Conformational dynamics of auto-inhibition in the ER calcium sensor STIM1
- Department of Molecular and Cellular Physiology, Stanford University School of Medicine, United States
- Howard Hughes Medical Institute, Stanford University School of Medicine, United States
Figures
Figure 1 with 3 supplements
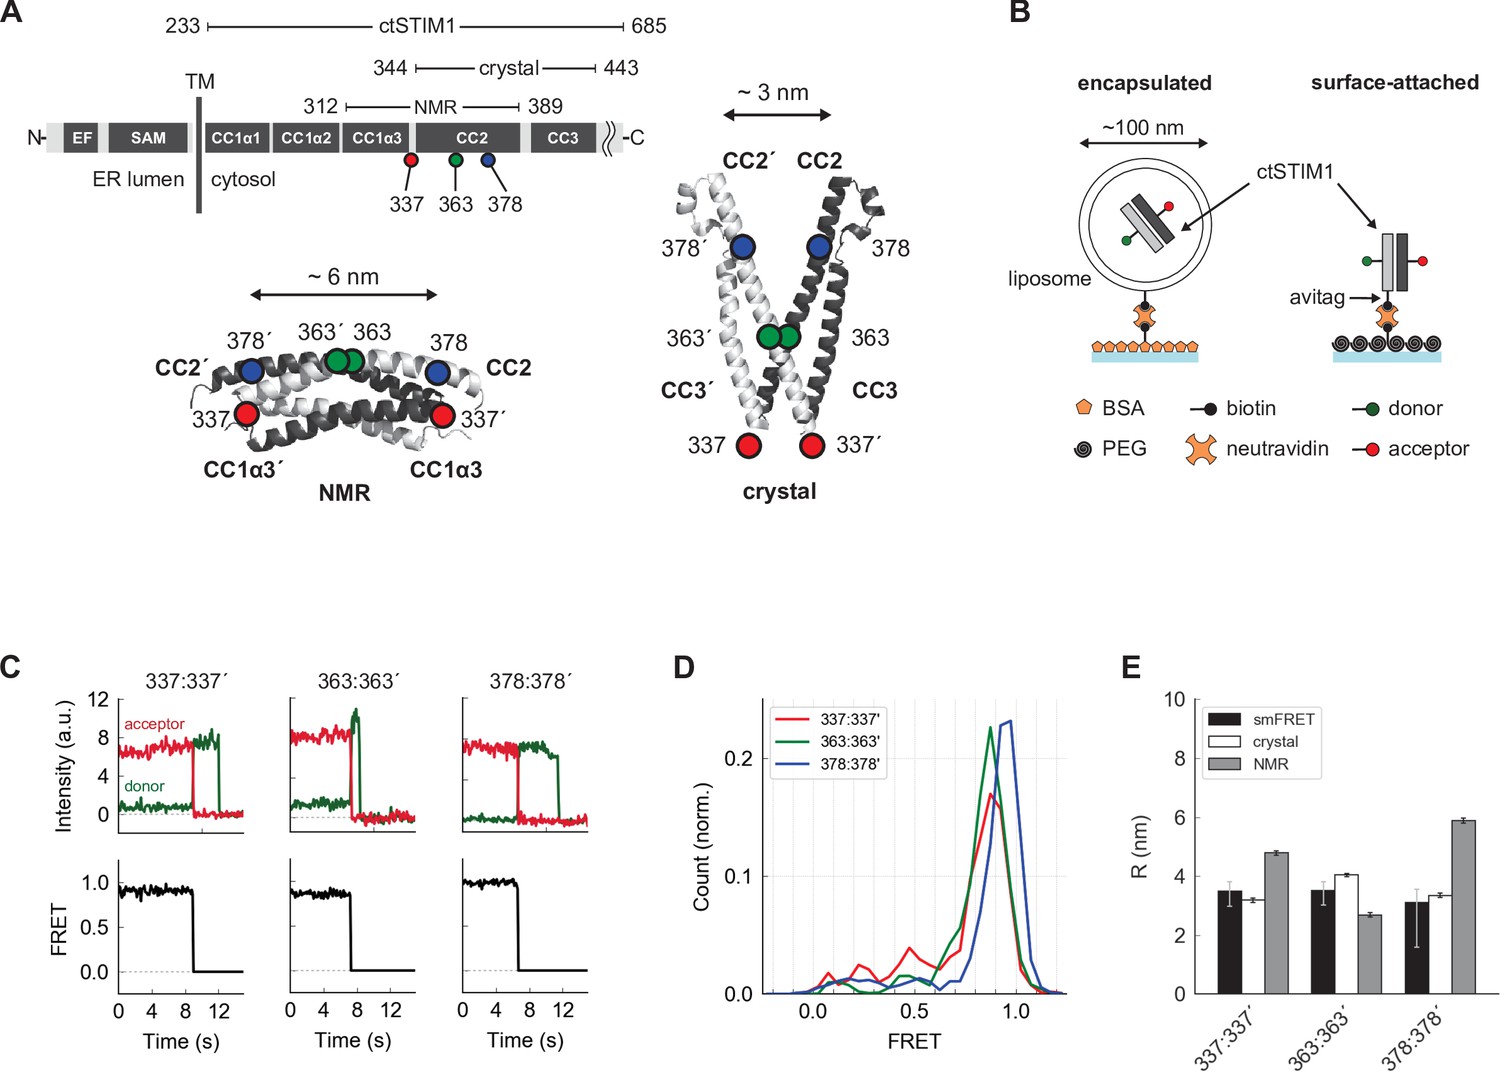
Parallel orientation of CC2 domains in ctSTIM1 is consistent with the CAD crystal structure.
(A) (top) Schematic overview of domains in ctSTIM1, comprising the membrane-proximal coiled-coil 1 (CC1) domain with helical regions α1 (aa 238–271), α2 (aa 278–304), and α3 (aa 308–337), and the CC2 (345–391) and CC3 (aa 408–437) domains which are part of CAD. (bottom) The orientations of the CC2 domains distinguish the NMR structure of CC1α3-CC2 (bottom left, anti-parallel CC2 domains; 2MAJ.pdb) from the crystal structure of CAD (bottom right, parallel CC2 domains; 3TEQ.pdb). Sites tested by inter-subunit smFRET are indicated. Although aa 337 is not part of the crystal structure (aa 344–443), it is sufficiently close to permit comparison to the NMR structure. (B) Two methods for immobilizing single ctSTIM1 dimers for smFRET. ctSTIM1 peptides were encapsulated in liposomes and immobilized on a glass slide by a biotin-neutravidin interaction or were attached directly via a C-terminal avitag. (C) Example recordings of donor (green) and acceptor (red) fluorescence evoked by donor excitation for sites 337:337´, 363:363´, and 378:378´. Single-step bleaching events indicate a single molecule, while the anti-correlated response of the donor to the acceptor bleach event is a hallmark of smFRET. Calculated FRET ratios (black) are shown below. (D) Ensemble smFRET histograms for sites 337:337´, 363:363´, and 378:378´ displayed predominantly high FRET, indicating close parallel apposition. (E) A comparison of smFRET-derived distances (black) with simulated inter-fluorophore distances from the crystal (white) and NMR structures (gray). The measured distances closely match the crystal structure but deviate strongly from the NMR structure, particularly for 337:337´ and 378:378´. smFRET error bars indicate the expected distance deviation corresponding to an uncertainty of ±0.05 in FRET measurement. 'Crystal' and 'NMR' error bars indicate the s.e.m. of inter-fluorophore distance from 100 simulations of dye position (see Materials and methods).
Figure 1—figure supplement 1
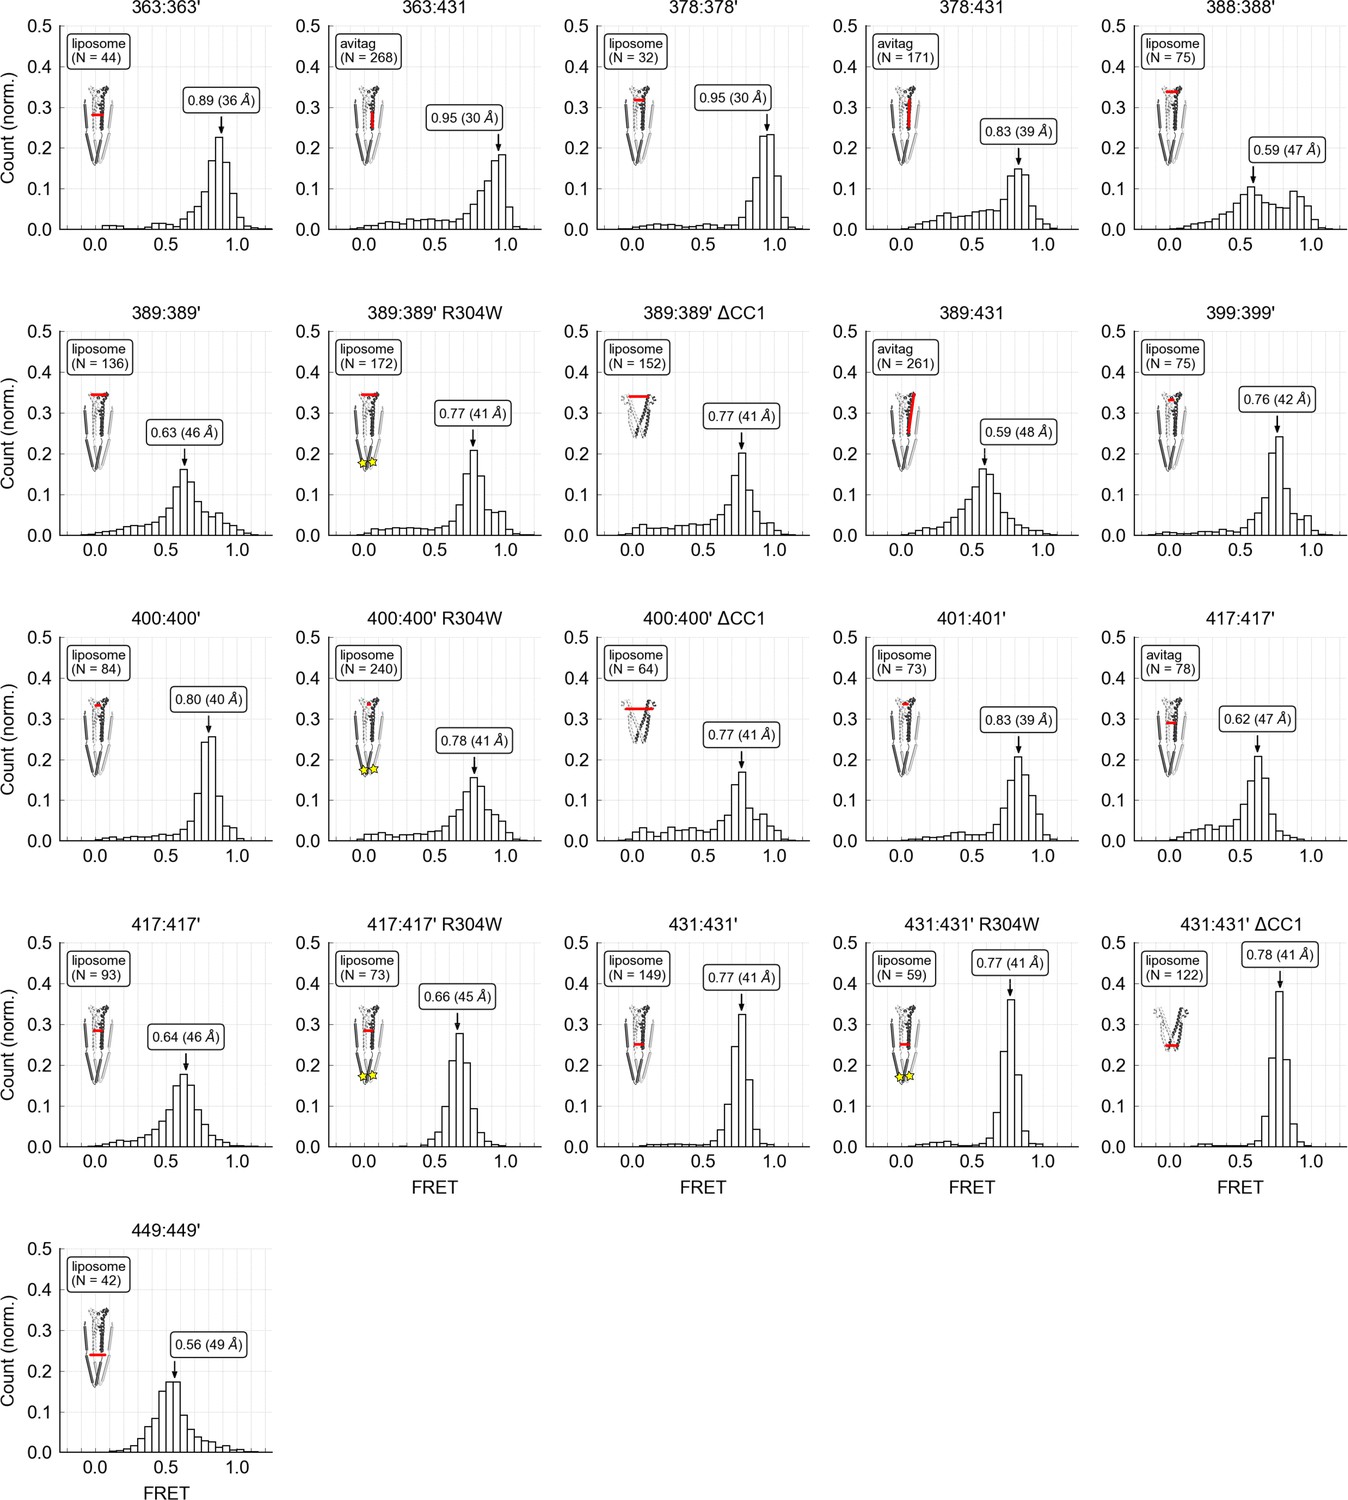
smFRET histograms for CAD measurements.
Peaks of the histograms are indicated by arrows and represent the predominant ctSTIM1 conformation. The locations of the measurement sites are indicated on a model of ctSTIM1 for each sample. Legend boxes indicate immobilization method (liposome or avitag), the number of molecules used to construct the histogram (N), the peak FRET value and the corresponding distance (see Materials and methods).
-
Figure 1—figure supplement 1—source data 1
Time series of donor and acceptor fluorescence and FRET for single molecules.
- https://cdn.elifesciences.org/articles/66194/elife-66194-fig1-figsupp1-data1-v2.xlsx
Figure 1—figure supplement 2
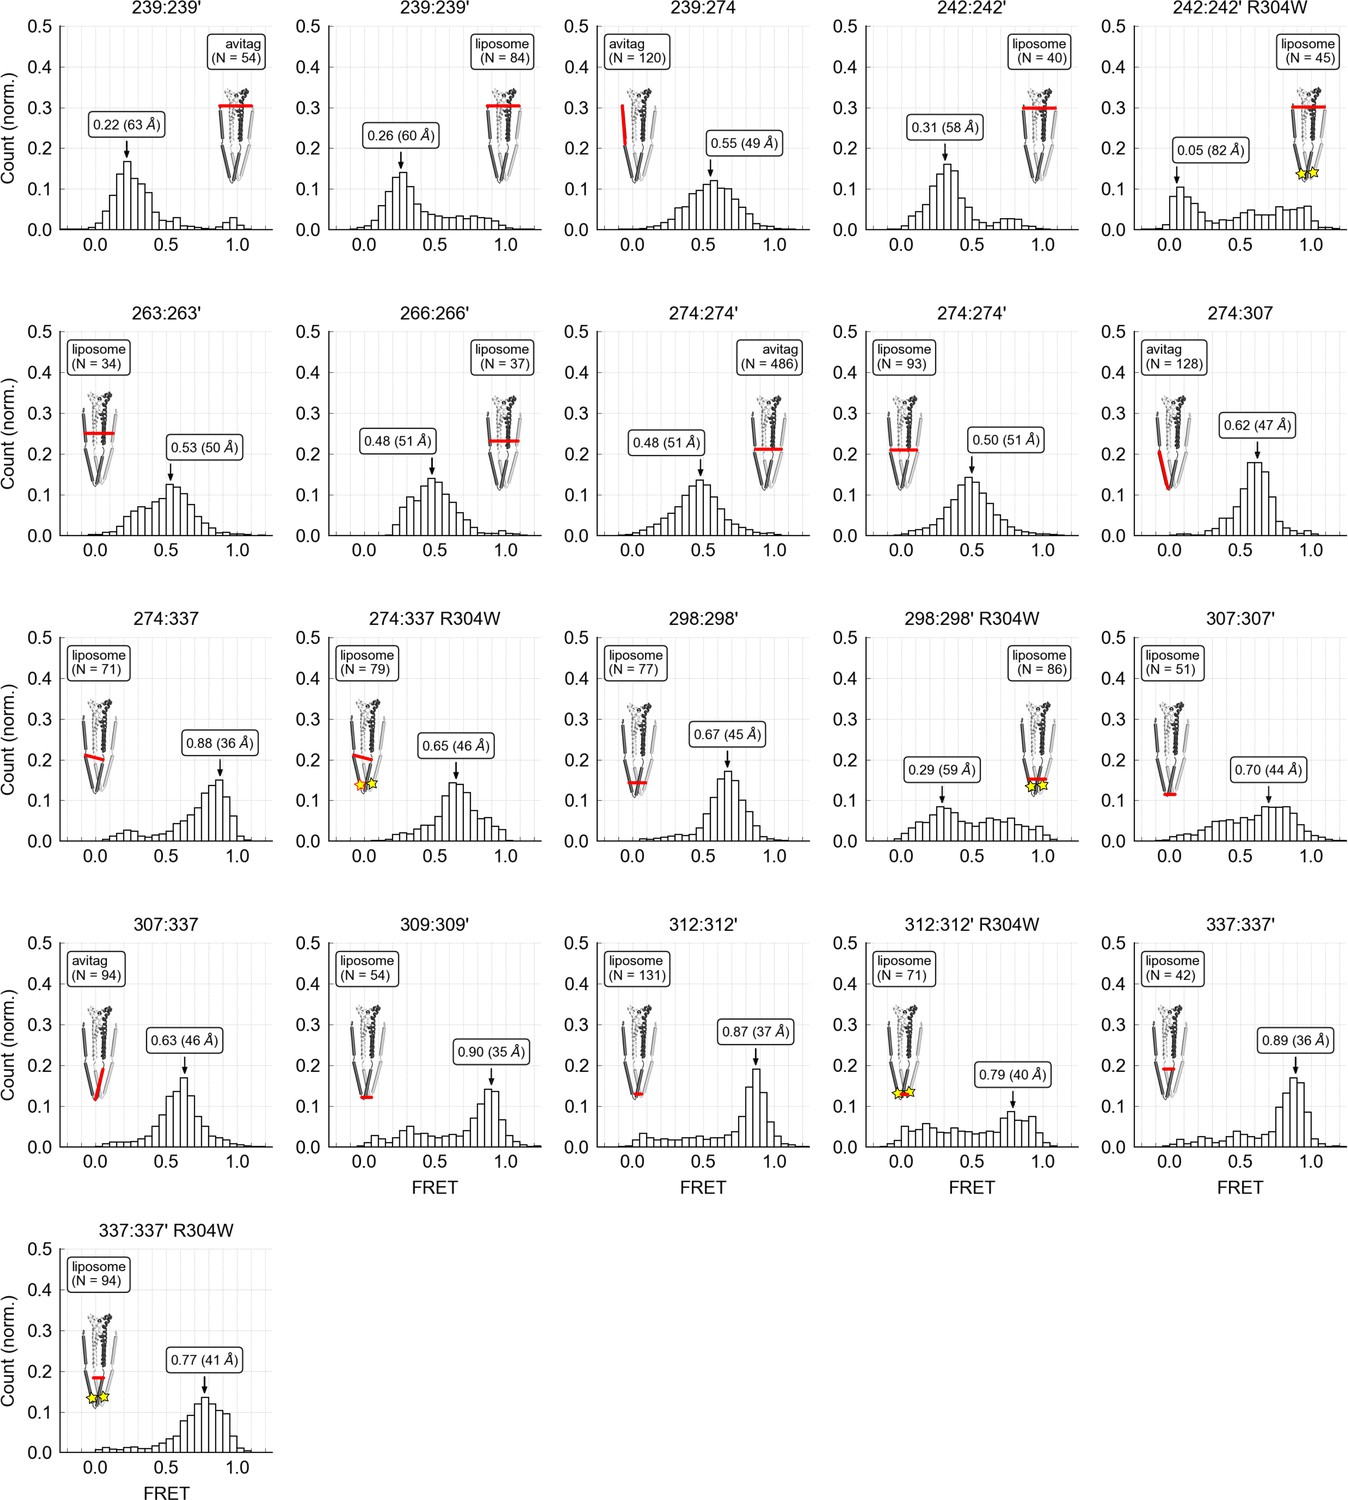
smFRET histograms for CC1 measurements.
Peaks of the histograms are indicated by arrows and represent the predominant ctSTIM1 conformation. The locations of the measurement sites are indicated on a model of ctSTIM1 for each sample. Legend boxes indicate immobilization method (liposome or avitag), the number of molecules used to construct the histogram (N), the peak FRET value and the corresponding distance (see Materials and methods).
-
Figure 1—figure supplement 2—source data 1
Time series of donor and acceptor fluorescence and FRET for single molecules.
- https://cdn.elifesciences.org/articles/66194/elife-66194-fig1-figsupp2-data1-v2.xlsx
Figure 1—figure supplement 3
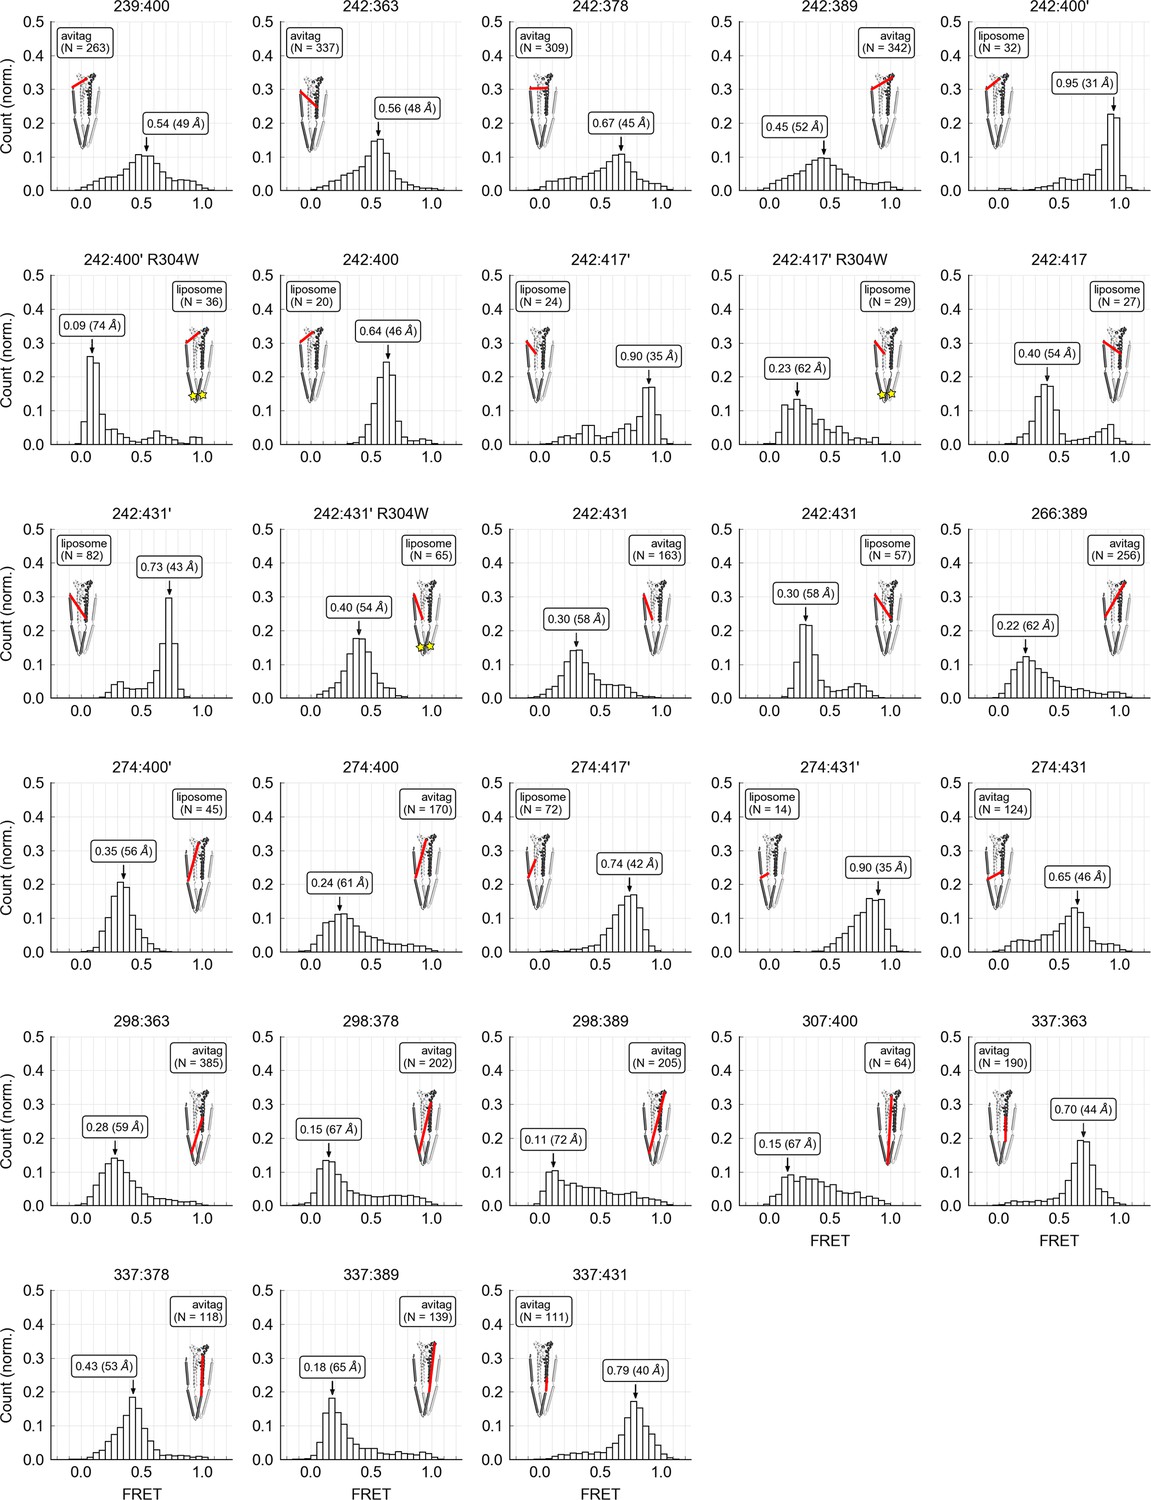
smFRET histograms for CC1:CAD measurements.
Peaks of the histograms are indicated by arrows and represent the predominant ctSTIM1 conformation. The locations of the measurement sites are indicated on a model of ctSTIM1 or CAD for each sample. Legend boxes indicate immobilization method (liposome or avitag), the number of molecules used to construct the histogram (N), the peak FRET value and the corresponding distance (see Materials and methods).
-
Figure 1—figure supplement 3—source data 1
Time series of donor and acceptor fluorescence and FRET for single molecules.
- https://cdn.elifesciences.org/articles/66194/elife-66194-fig1-figsupp3-data1-v2.xlsx
Figure 2 with 1 supplement
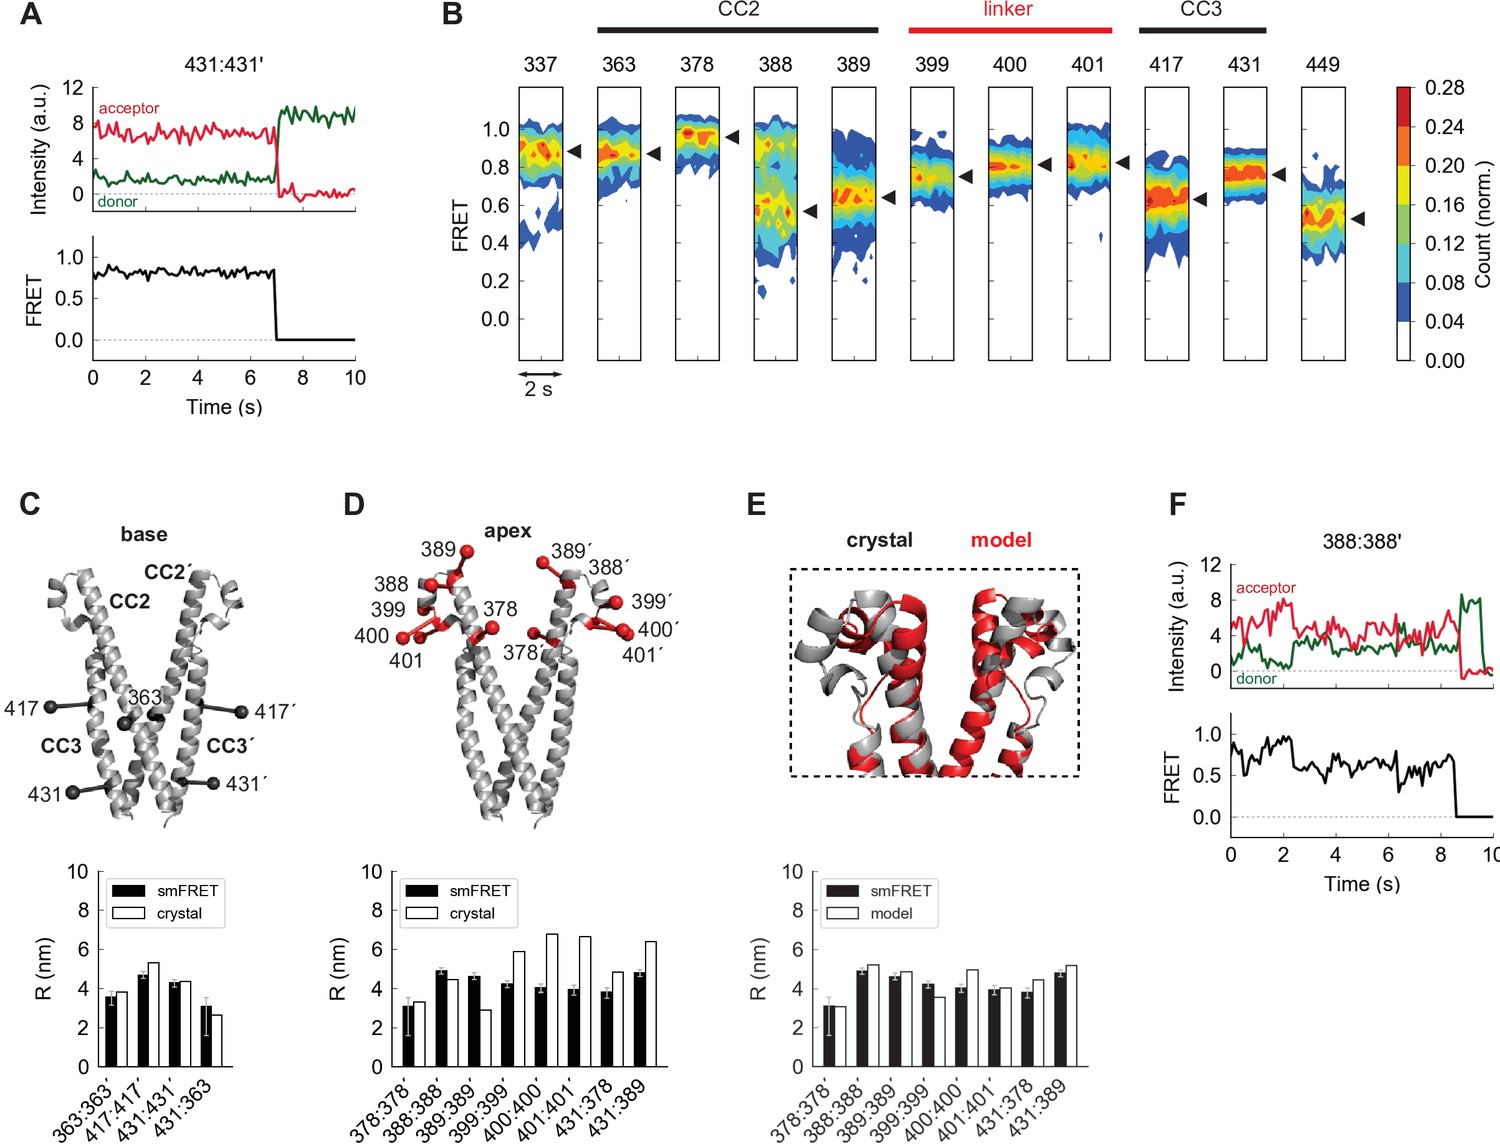
The apex of CAD in ctSTIM1 deviates from the CAD crystal structure.
(A) Representative smFRET recording at the base of CAD (431:431´) showing stable, high FRET. (B) Ensemble density plots of the initial 2 s of inter-subunit smFRET recordings for sites throughout CAD. Predominant FRET levels are shown by arrowheads to the right of each plot. (C–D) Comparison of inter-fluorophore distances from smFRET and the CAD crystal structure. Simulated fluorophores are represented by the average position of a central atom, indicated here as ball-on-stick models (see Materials and methods). For sites near the dimer interface (the 'base' of CAD, C), the smFRET-derived distances (black bars) agree closely with the crystal structure (white bars). Measurements in the apex (D) deviate from the crystal structure. (E) Modified structure (red) generated by a smFRET-constrained optimization of the crystal structure (gray). Outward rotation of the distal CC2 region (aa 379–391) around G379 as a pivot point restored close correspondence between smFRET-derived distances and the crystal structure (bottom). (F) Representative example of smFRET fluctuations in the CAD apex (388:388´).
Figure 2—figure supplement 1
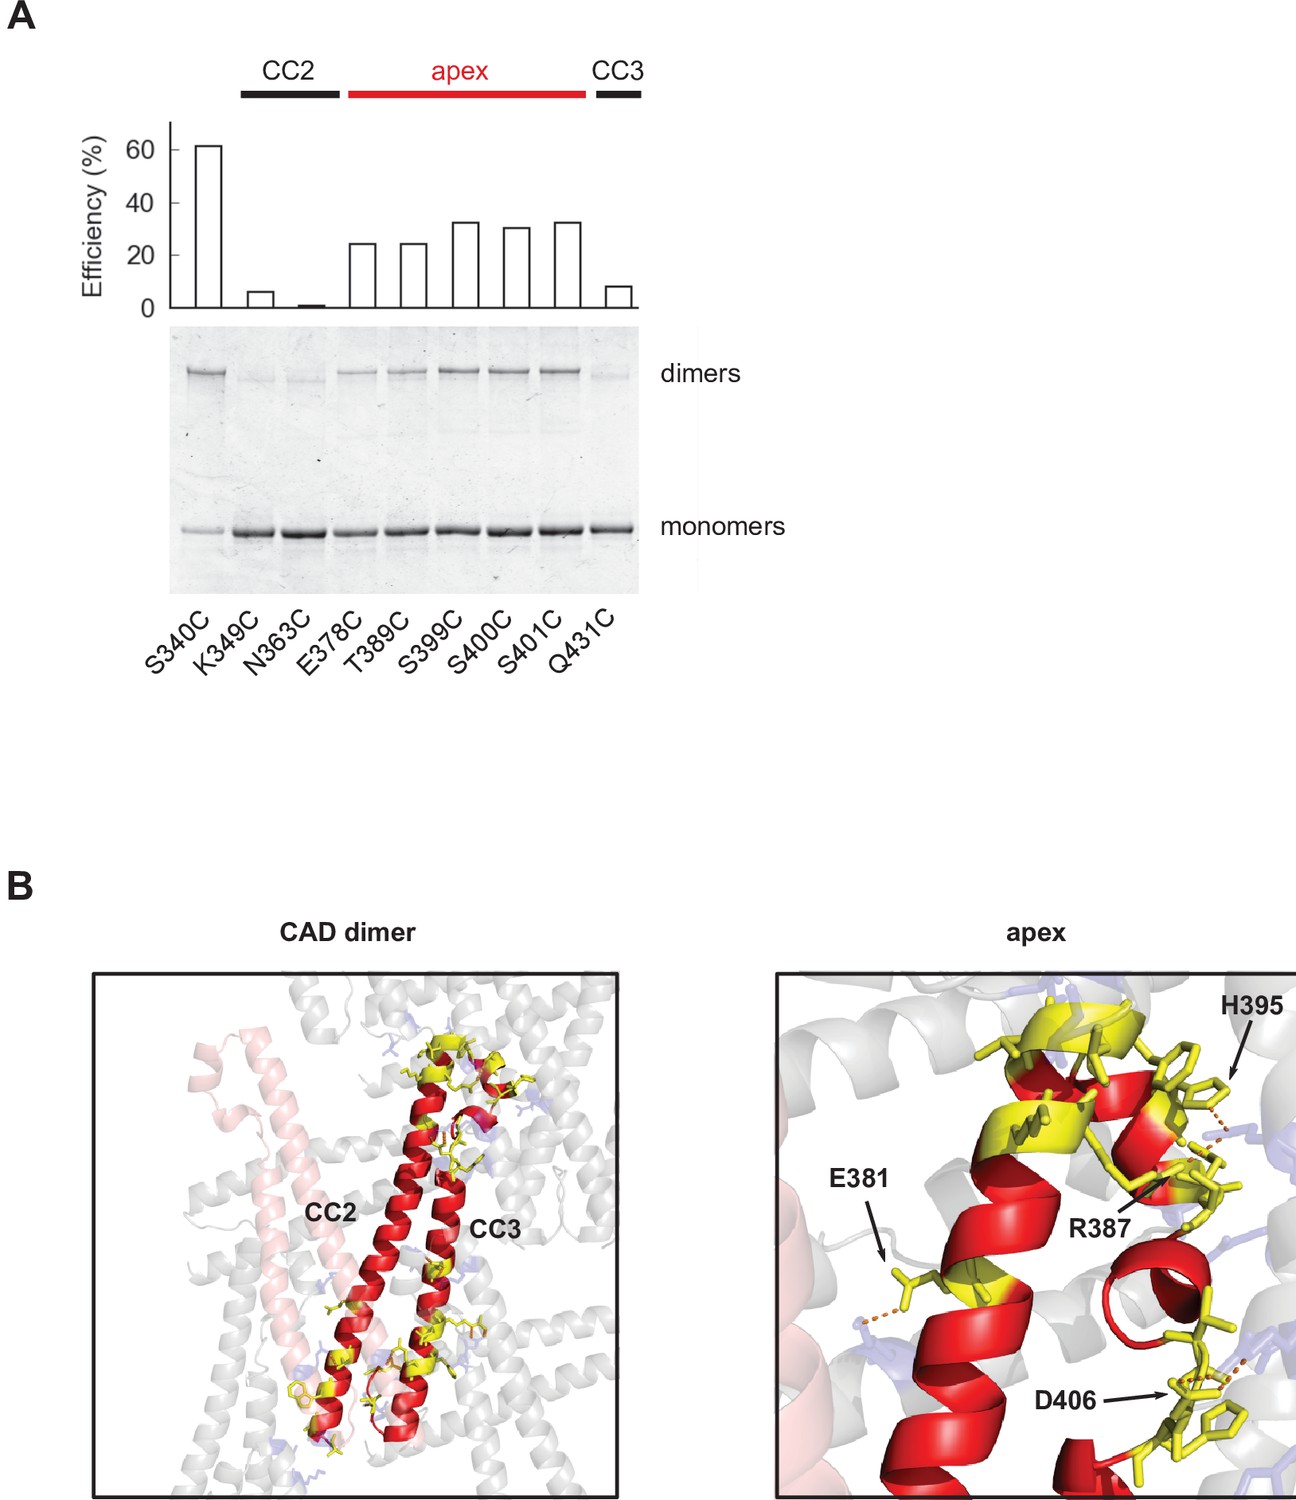
CAD apex structure.
(A) Dimerization of ctSTIM1 cysteine mutants by disulfide bond formation in CAD, shown by non-reducing SDS-PAGE. CuP-induced dimerization was virtually absent at basal sites but was evident at all tested sites in the apical region. (B) Analysis of external contacts of a CAD subunit in the reconstructed crystal lattice. In the left panel a subunit of CAD is shown in red, the adjacent subunit in the dimer is shown in transparent pink, and interacting subunits in the crystal lattice are shown in transparent gray. The crystal lattice was generated from structural coordinates in 3TEQ.pdb using Chimera software (Pettersen et al., 2004). Residues on the red subunit that are in contact with the external crystal lattice (including the paired subunit) are shown in yellow, and their corresponding contacts in the external lattice are shown in blue. Contacts are defined as sites where Van der Waals radii touch or overlap. Extensive external contacts are made at the base of CAD, near the dimer interface, and at the apex in the CC2-CC3 linker region. The enlargement on the right shows lattice contacts throughout virtually the entire apex. Polar contacts (hydrogen bonds) are shown as dashed orange lines.
-
Figure 2—figure supplement 1—source data 1
Raw unedited gel for Figure 2—figure supplement 1A (ctSTIM1 CAD cysteine crosslinking).
- https://cdn.elifesciences.org/articles/66194/elife-66194-fig2-figsupp1-data1-v2.zip
-
Figure 2—figure supplement 1—source data 2
Uncropped labeled gel for Figure 2—figure supplement 1A (ctSTIM1 CAD cysteine crosslinking).
- https://cdn.elifesciences.org/articles/66194/elife-66194-fig2-figsupp1-data2-v2.zip
Figure 3 with 1 supplement
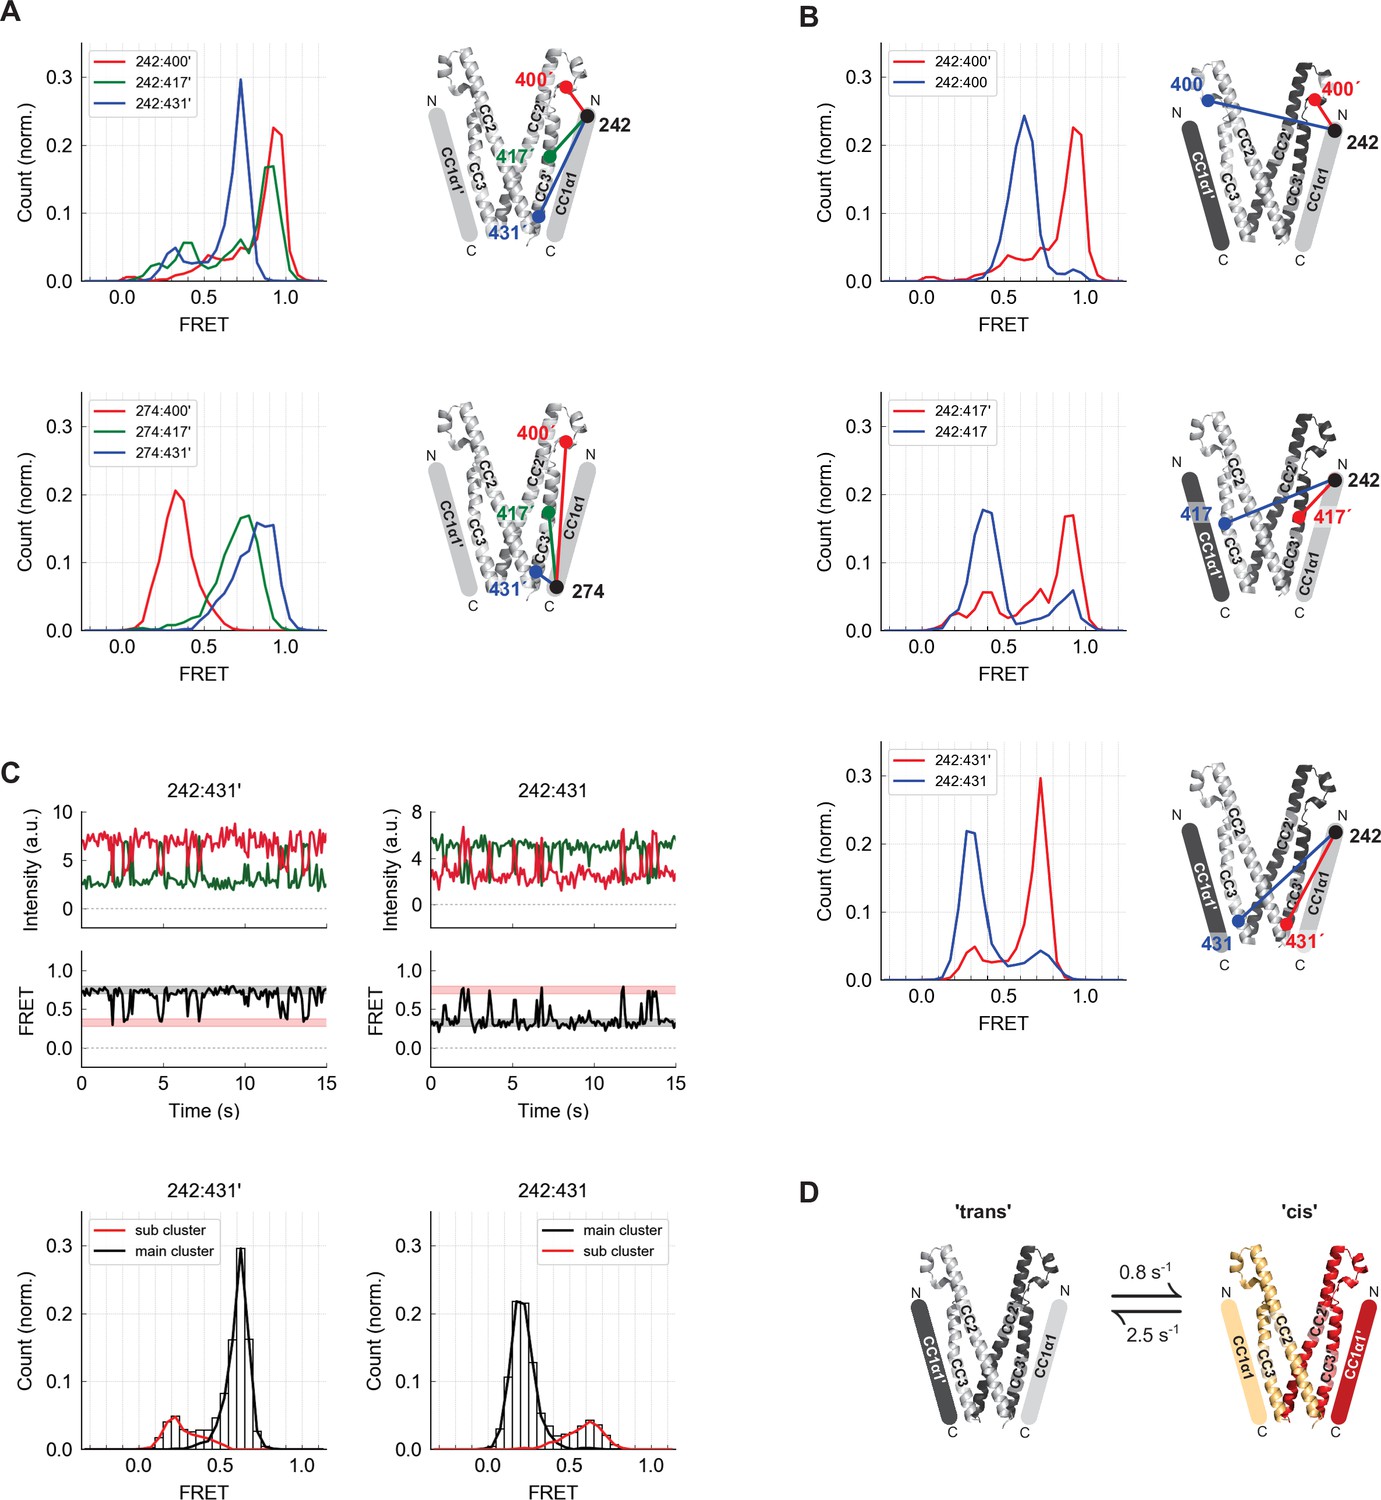
The CC1α1 domain is near and parallel to the CC3 domain of the opposing CAD subunit.
(A) Asymmetric inter-subunit smFRET measurements between CC1α1 and CC3 reveal a parallel orientation, with high FRET levels at 242:400´ (top, red) and 274:431´ (bottom, blue) indicating close apposition. The crystal structure of CAD is shown with schematic representation of CC1α1 domains. (B) The predominant smFRET level between CC1α1 and CC3 was consistently higher for inter-subunit measurements (red) than intra-subunit measurements (blue). This pattern indicates a predominant domain-swapped configuration in which CC1α1 docks close to the CC3 domain of its opposing subunit. (C) Inter- and intra-subunit recordings (242:431´ and 242:431, respectively) displayed brief smFRET transitions between two states indicated by red and black bars. In both cases, fluctuations occurred between the same two FRET levels, reflected in the main and sub cluster peaks of the ensemble FRET histogram below, suggesting the CC1α1 domains switched sides on CAD (see also Figure 3—figure supplement 1). (D) Schematic illustration of spontaneous conformational transitions of the CC1α1 domain. In the predominant conformation, CC1α1 is closely apposed and parallel to CC3 on its opposing subunit in a domain-swapped configuration ('trans'). Occasionally, CC1α1 switches to interact briefly with CC3 on its own subunit ('cis'). Rate constants were derived from dwell time analysis of smFRET traces (Figure 3—figure supplement 1E,F).
Figure 3—figure supplement 1
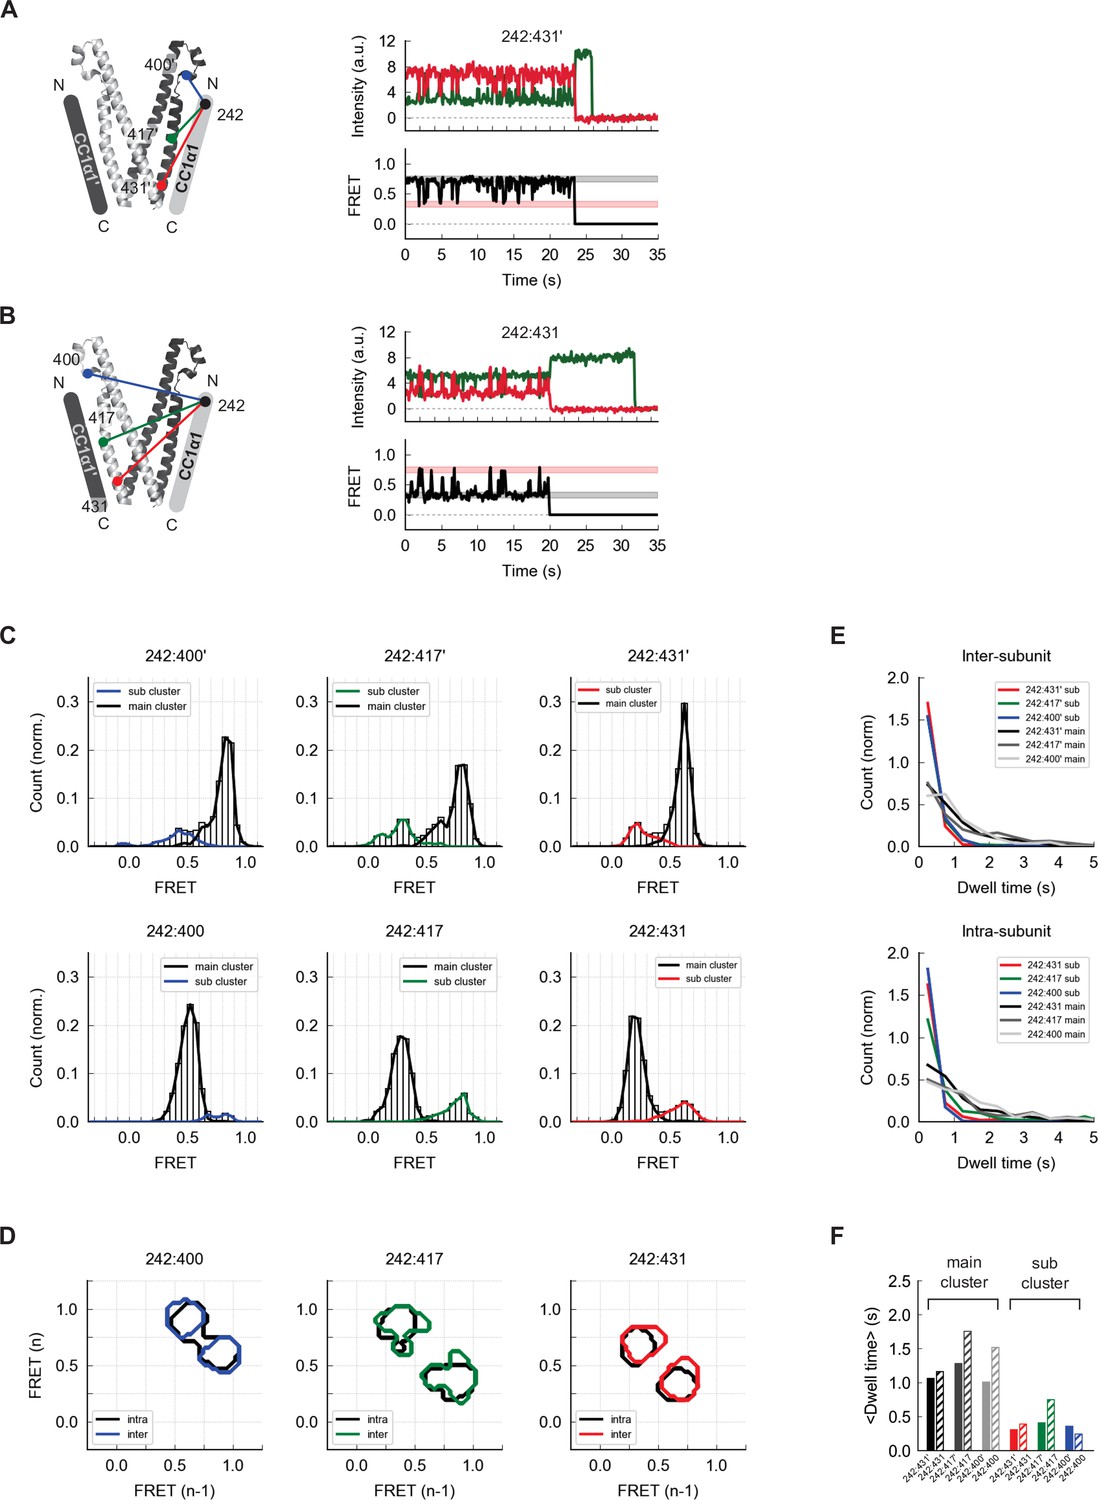
CC1α1:CAD dynamics.
(A) Schematic drawing of the measurement sites for inter-subunit smFRET measurements from aa 242 in CC1α1 to sites 400´, 417´, and 431´ in CC3´ (left). An example recording of smFRET transitions at 242:431´ is shown (right), with black and red bars indicating the predominant and transient FRET levels, respectively. (B) Schematic drawing of the measurement sites for intra-subunit smFRET measurements from aa 242 in CC1α1 to sites 400, 417, and 431 in CC3 (left), and an example recording of smFRET transitions at 242:431 (right). (C) Ensemble smFRET histograms show the equivalence of predominant (main cluster) and transient (sub cluster) FRET levels in inter- and intra-subunit measurements, suggesting that CC1α1 briefly switches sides on CAD, probably using the same binding interface. (D) Ensemble transition density plots show the FRET level after a transition [FRET(n)] against FRET before a transition [FRET(n-1)] for all fluctuating molecules (see Materials and methods). Contours indicate which transitions were most often observed, overlaying intra-subunit (black) and inter-subunit (colored) measurements. (E) Dwell time distributions for inter-subunit (left) and intra-subunit (right) measurements were similar, further supporting the hypothesis that CC1α1 domains briefly switch sides on CAD. (F) Average dwell times were similar between the various measurement configurations, for predominant and transient FRET levels. Average dwell times of the predominant and transient states were 1.2 s and 0.4 s, respectively.
-
Figure 3—figure supplement 1—source data 1
Time series of FRET, Hidden-Markov Model fits, and state clusters for single molecules.
- https://cdn.elifesciences.org/articles/66194/elife-66194-fig3-figsupp1-data1-v2.xlsx
Figure 4 with 1 supplement
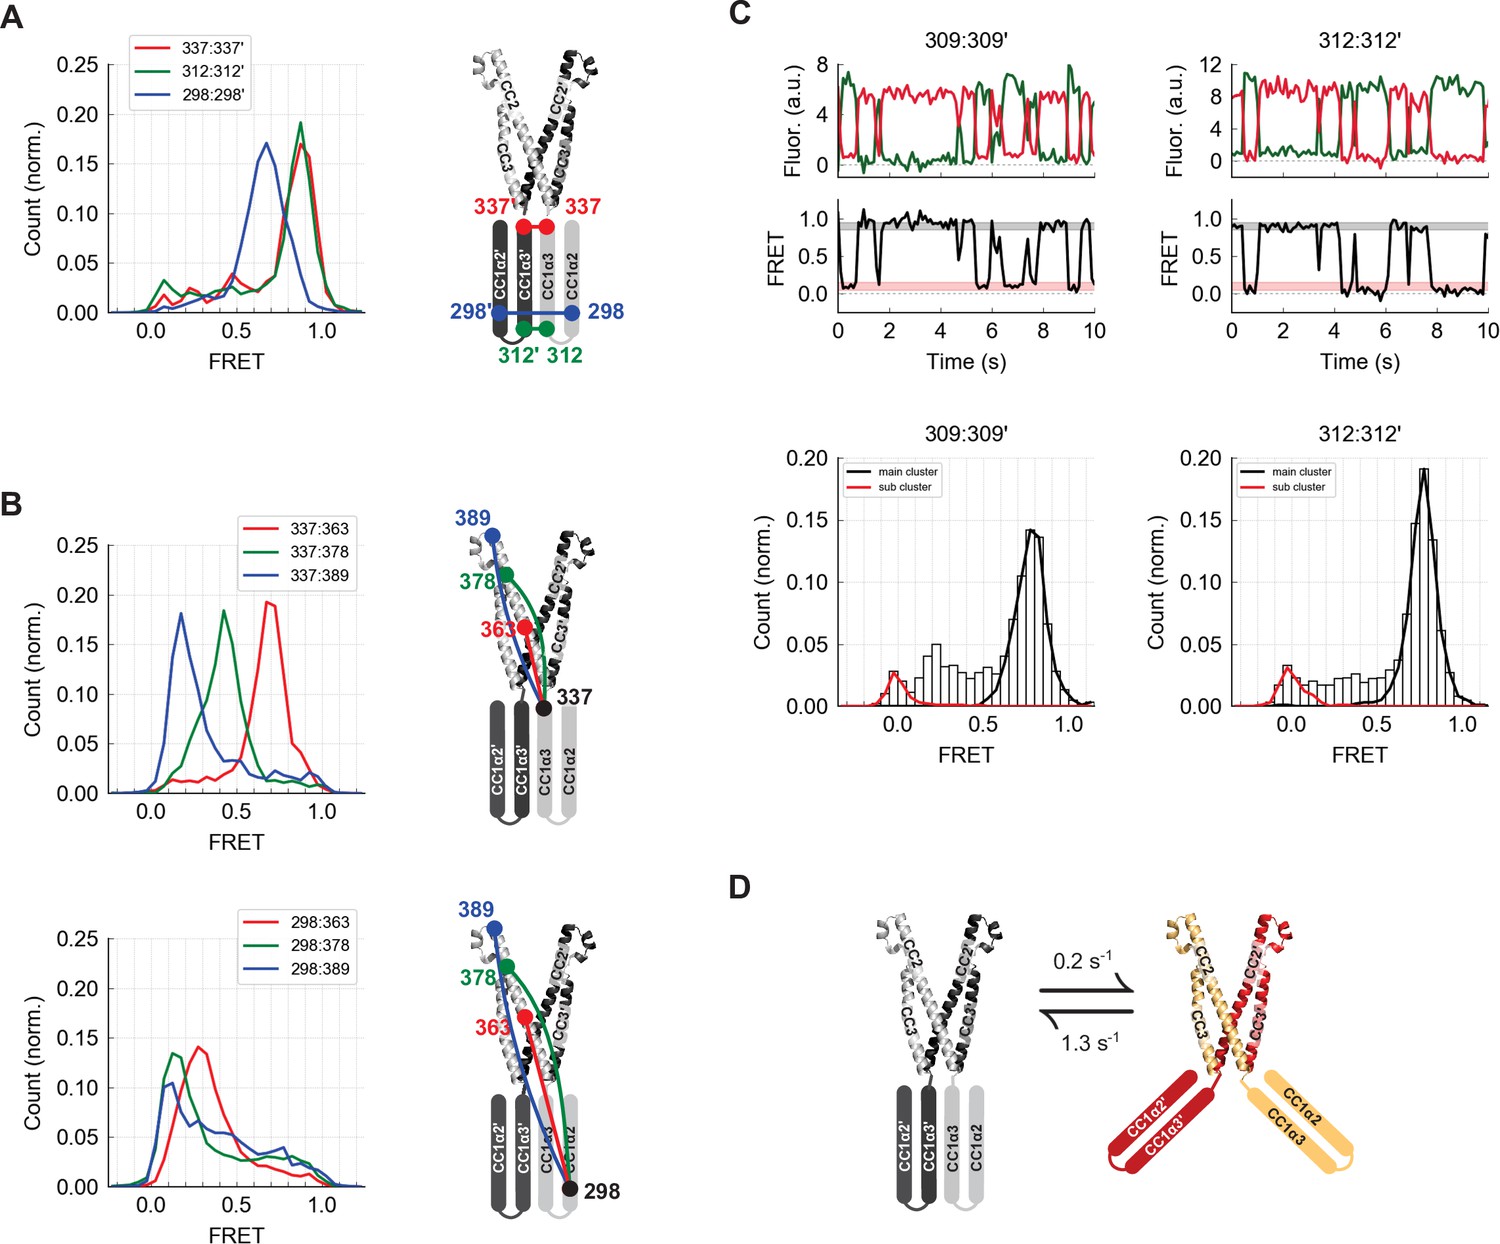
The CC1α2 and CC1α3 domains are closely apposed and directed away from CAD.
(A) High inter-subunit smFRET at the N- and C-termini of the CC1α3 domain (aa 312 and 337, respectively) indicates close parallel apposition of the two helices. The crystal structure of CAD is shown with a schematic depiction of CC1α2 and CC1α3 domains. (B) (top) High intra-subunit smFRET from aa 337 to sites on CC2 declined progressively with distance, while intra-subunit smFRET from aa 298 (near the CC1α2/α3 linker) to sites in CC2 was low (bottom), indicating that the CC1α2 and α3 domains are directed away from CAD. (C) Inter-subunit recordings near the CC1α3 N-terminus displayed brief transitions from the predominant high-FRET state to a low-FRET state. Ensemble histograms show similar main and sub cluster FRET states for neighboring sites aa 309 and 312. (D) Schematic depiction of spontaneous conformational transitions of the CC1α3 domains. CC1α3 domains are closely apposed (left) but occasionally transition to a open configuration (right) at rates derived from dwell time analysis of smFRET traces (Figure 4—figure supplement 1E,F).
Figure 4—figure supplement 1
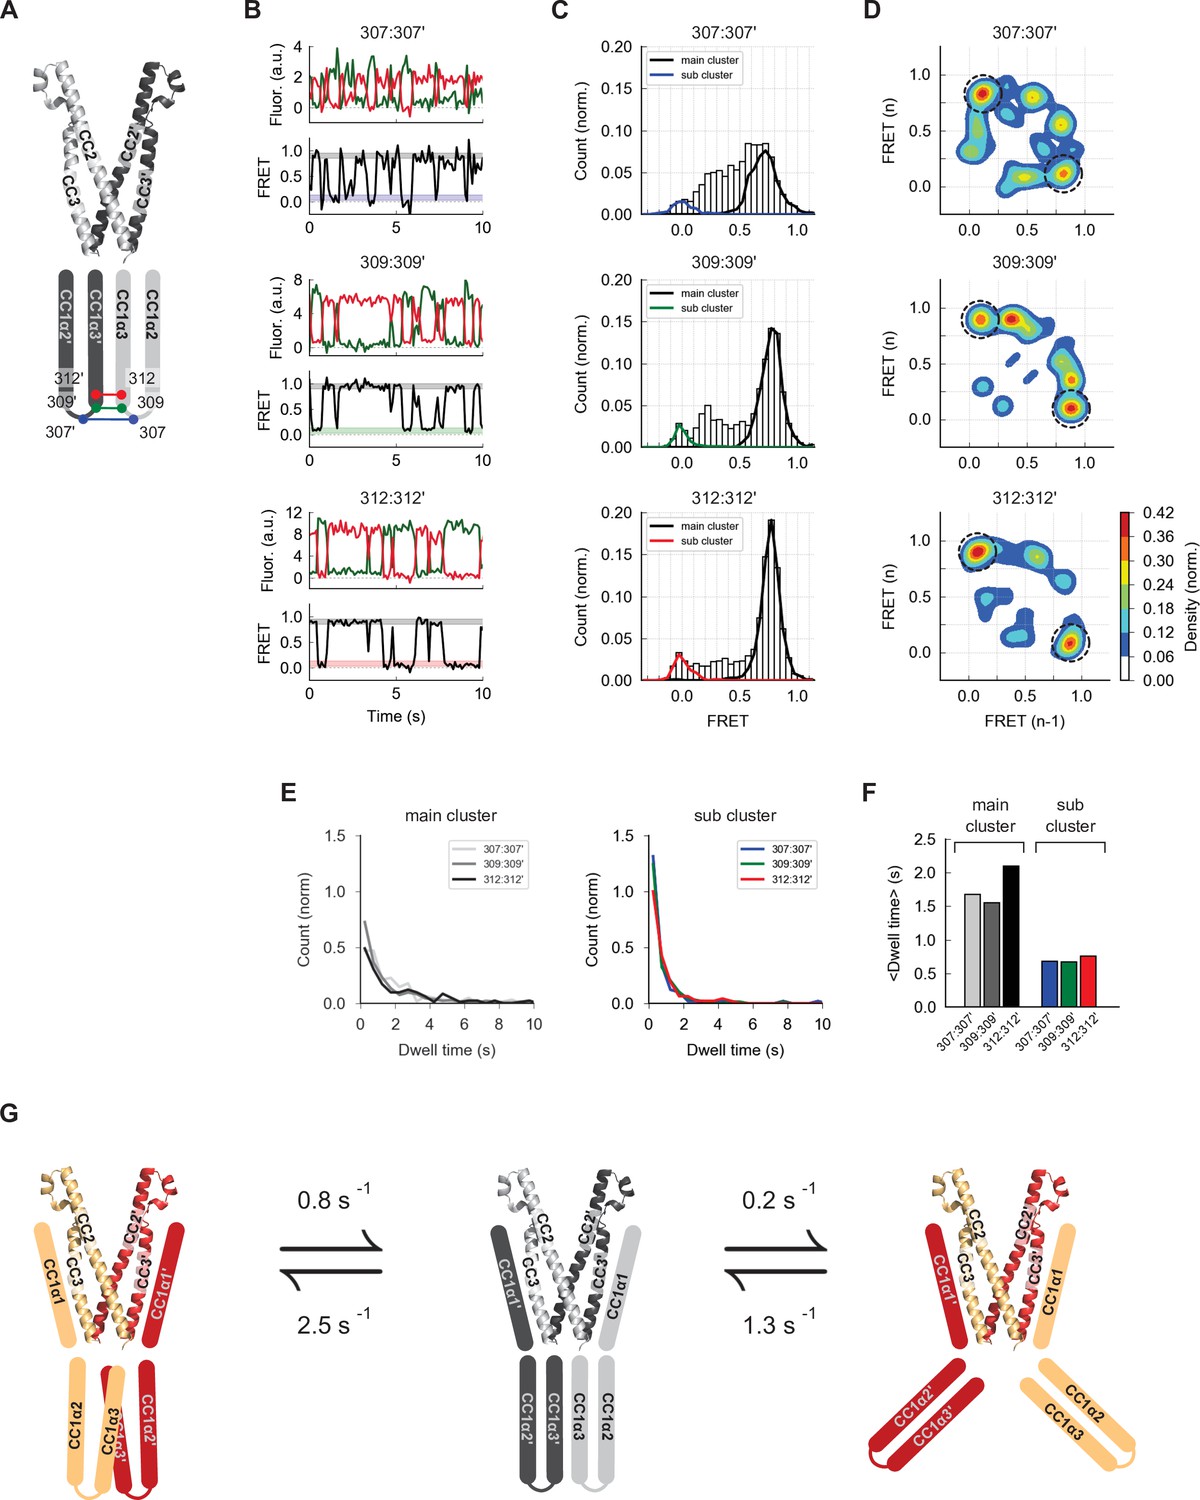
CC1α3:CC1α3´ dynamics.
(A) Schematic drawing of inter-subunit smFRET measurement sites near the CC1α3 N-terminus. (B) Example traces at aa 307 (top), 309 (center), and 312 (bottom) show large-amplitude fluctuations from the predominant high FRET level. Black and colored bars indicate the respective main and sub cluster FRET levels shown in C. (C) Ensemble smFRET histograms including the predominant and transient FRET clusters associated with the large-amplitude fluctuations. (D) FRET transition diagrams show that the predominant fluctuations at all three sites are large-amplitude transitions between a high- and a low-FRET state (dashed circles). (E) Dwell time distributions of the main and sub cluster FRET states were similar for all three sites, indicating a common underlying conformational change. (F) Average dwell times of main and sub cluster FRET states for all three sites. Overall average dwell times were 1.7 s for the main cluster, and 0.7 s for the sub cluster. (G) Two types of conformational changes in the CC1 domain. From the predominant resting state (center), CC1α1 domains occasionally switch sides on CAD (left), and CC1α3 domains occasionally move apart (right). Given their different kinetic rates, the two conformational transitions are apparently not directly coupled.
-
Figure 4—figure supplement 1—source data 1
Time series of FRET, Hidden-Markov Model fits, and state clusters for Figure 4—figure supplement 1.
- https://cdn.elifesciences.org/articles/66194/elife-66194-fig4-figsupp1-data1-v2.xlsx
Figure 5 with 3 supplements

smFRET-derived models of the configuration of CC1 and CAD in ctSTIM1.
(A) 36 smFRET-derived distances were used to reconstruct the orientations of CC1 domains relative to CAD, yielding two classes of solutions with the CC1α2/α3 domains in a ’stacked' (left) or 'wedged' (right) configuration. In both classes, CC1α1 domains are in close parallel apposition to the CC3 domains on the adjacent subunit in a domain-swapped configuration, with the CC1α2 and CC1α3 domains forming a compact parallel structure directed away from CAD. The average of 50 model solutions is shown for each class (see Figure 5—figure supplement 1 for individual solutions). The complete list of smFRET values and distance constraints used to generate the models is shown in Supplementary file 1. (B) smFRET-derived models suggest hydrophobic stabilization of the CC1α2/α3 complex by antiparallel apposition of CC1α2 and CC1α3´. (C) The crystal structure of CC1 peptides depicts an antiparallel interaction of CC1α2 and CC1α3´ domains (left, dashed box), in which hydrophobic residues form a tightly packed dimer interface (top right, adapted from 4O9B.pdb). (Bottom right) Tight antiparallel packing of CC1α2/α3´ in ctSTIM1 was confirmed by inter-subunit crosslinks with EDC (red lines) (see also Figure 5—figure supplement 3). (D) Parallel apposition of hydrophobic residues on CC1α1 and CC3´. Many of these were previously identified by mutagenesis to stabilize the inactive state of STIM1, including L248, L251, L258, L261, L416, V419, and L423. (E) A model of the hydrophobic CC1α1:CC3´ interface obtained by computational peptide docking (see Materials and methods).
Figure 5—figure supplement 1
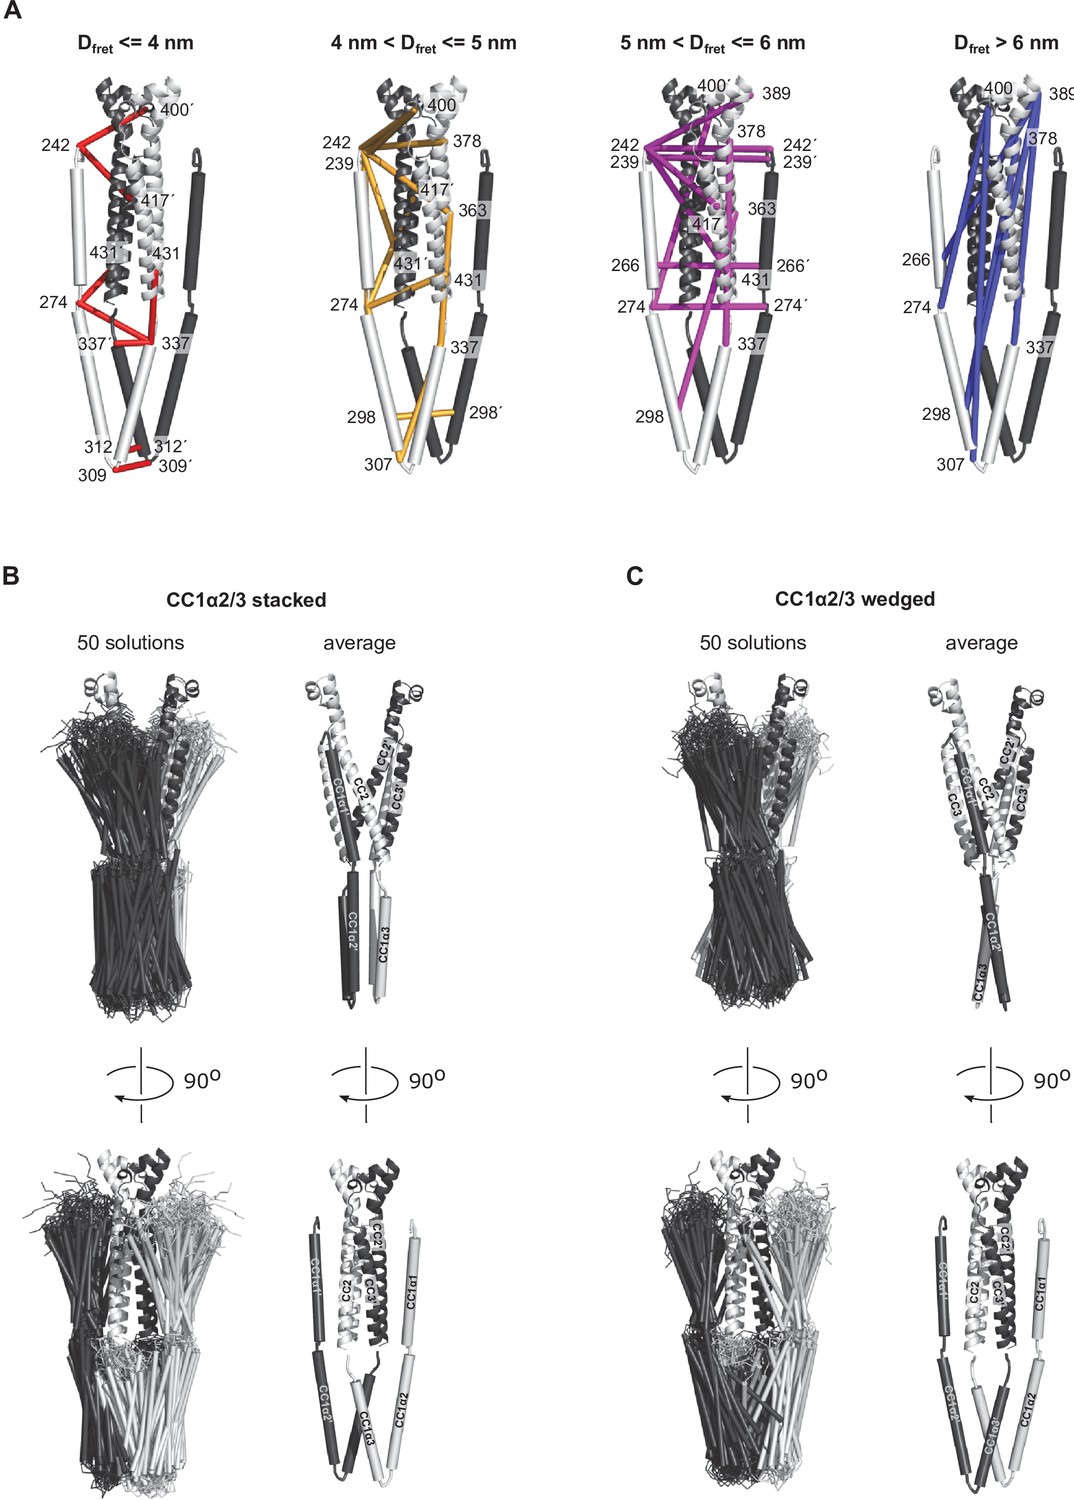
CC1-CAD models.
smFRET-constrained modeling produced two different topologies for stacking of the CC1α2/α3 domains. For both classes of solutions, the orientation of CC1α1 parallel to CC3 on the adjacent subunit was virtually identical, and CC1α2/α3 domains were compact, parallel-folded, and oriented away from CAD. (A) FRET measurement sites grouped according to the smFRET-derived distances (DFRET), superimposed on the stacked model shown in B. (B) Overlay (left) and average (right) of 50 solutions with stacked CC1α2/α3 domains. This was the predominant topology, representing ~70 % of solutions. (C) Overlay (left) and average (right) of 50 solutions for the alternative wedged CC1α2/α3 topology. The complete list of smFRET values and distance constraints used to generate the models is shown in Supplementary file 1. Models can be accessed in Supplementary files 2 and 3.
Figure 5—figure supplement 2
Mass spectrometry analysis of ctSTIM1 crosslinking by BS3.
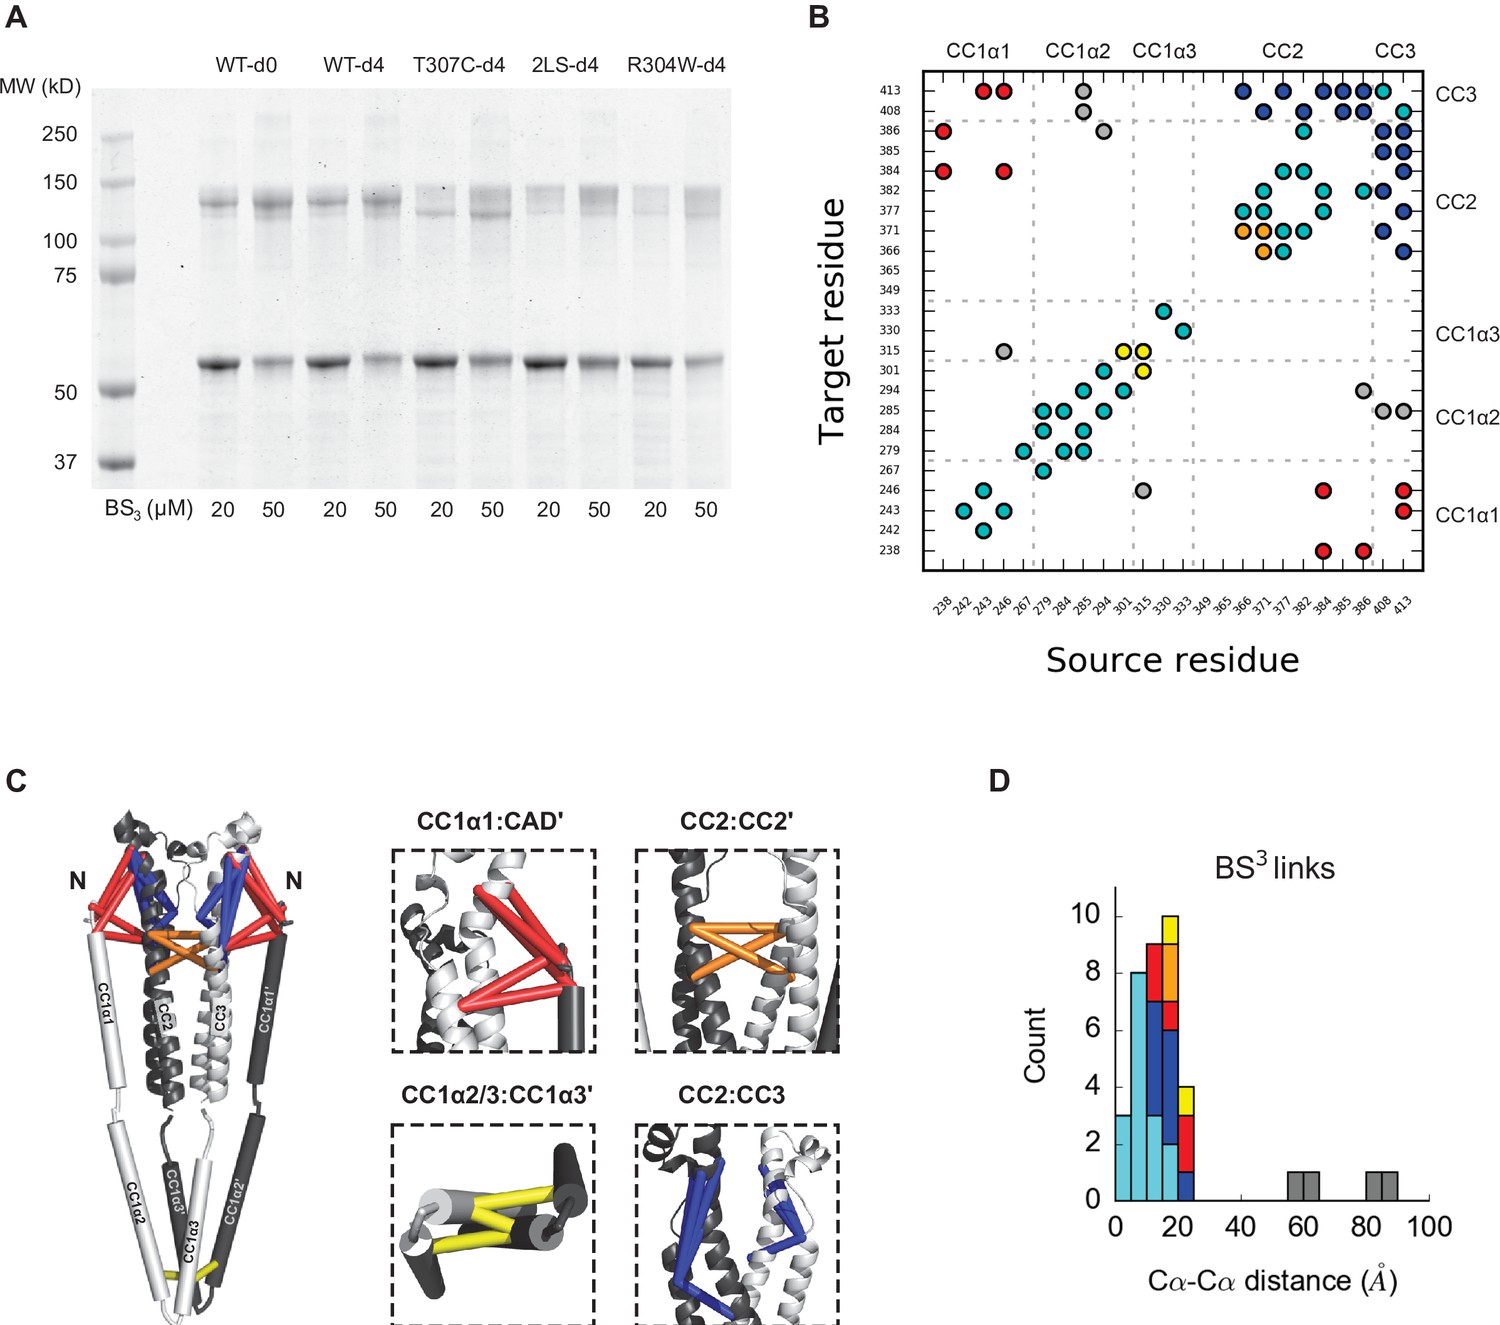
(A) SDS-PAGE of wild-type and mutant ctSTIM1 treated with BS3 to induce lysine-lysine crosslinking. Wild-type ctSTIM1 was treated with BS3-d0 as a reference, and four different ctSTIM1 variants were treated with BS3-d4 to detect the effect of the variation using comparative XLMS (see Materials and methods and Figure 7—figure supplement 2): wild-type ctSTIM1 as control (WT-d4), disulfide linked T307C ctSTIM1 (T307C-d4), and ctSTIM1 with activating mutations L248S + L251S (2LS-d4) or R304W (R304W-d4). The T307C samples were treated with DTT prior to electrophoresis. BS3 treatment resulted in the formation of ctSTIM1 dimers, with distinct band patterns for wild-types and mutants. MS analysis of WT ctSTIM1 is shown in B; mutant analysis is shown in Figure 7—figure supplement 2. (B) Identification of BS3-linked lysine residues in CC1-CAD by mass spectrometry analysis of wild-type ctSTIM1 monomer and dimer gel bands. Identified links are indicated in a matrix of all possible lysine pairs in CC1-CAD. Links found exclusively in the dimer band were likely inter-subunit links (red, orange, or yellow). Links found in the monomer band were intra-subunit links (blue or cyan). (C) Mapping of BS3 links on the smFRET-derived structural model. Inter-subunit links were detected for CC1α1:CAD´ (red), CC2:CC2´ (orange), and CC1α3:CC1α3´ and CC1α2:CC1α3´ (yellow). Intra-subunit links were detected for CC2:CC3 (blue), and for several sites that were near each other on the peptide chain (cyan). (D) Distribution of distances between residues for all detected links mapped on the smFRET-derived model (using the Cα atom for residues in CAD). The majority of linked residues matched well with the theoretical BS3 length of ~15 Å, except links shown in gray.
-
Figure 5—figure supplement 2—source data 1
Raw unedited gel for Figure 5—figure supplement 2A (ctSTIM1 BS3 crosslinking).
- https://cdn.elifesciences.org/articles/66194/elife-66194-fig5-figsupp2-data1-v2.zip
-
Figure 5—figure supplement 2—source data 2
Uncropped labeled gel for Figure 5—figure supplement 2A (ctSTIM1 BS3 crosslinking).
- https://cdn.elifesciences.org/articles/66194/elife-66194-fig5-figsupp2-data2-v2.zip
Figure 5—figure supplement 3
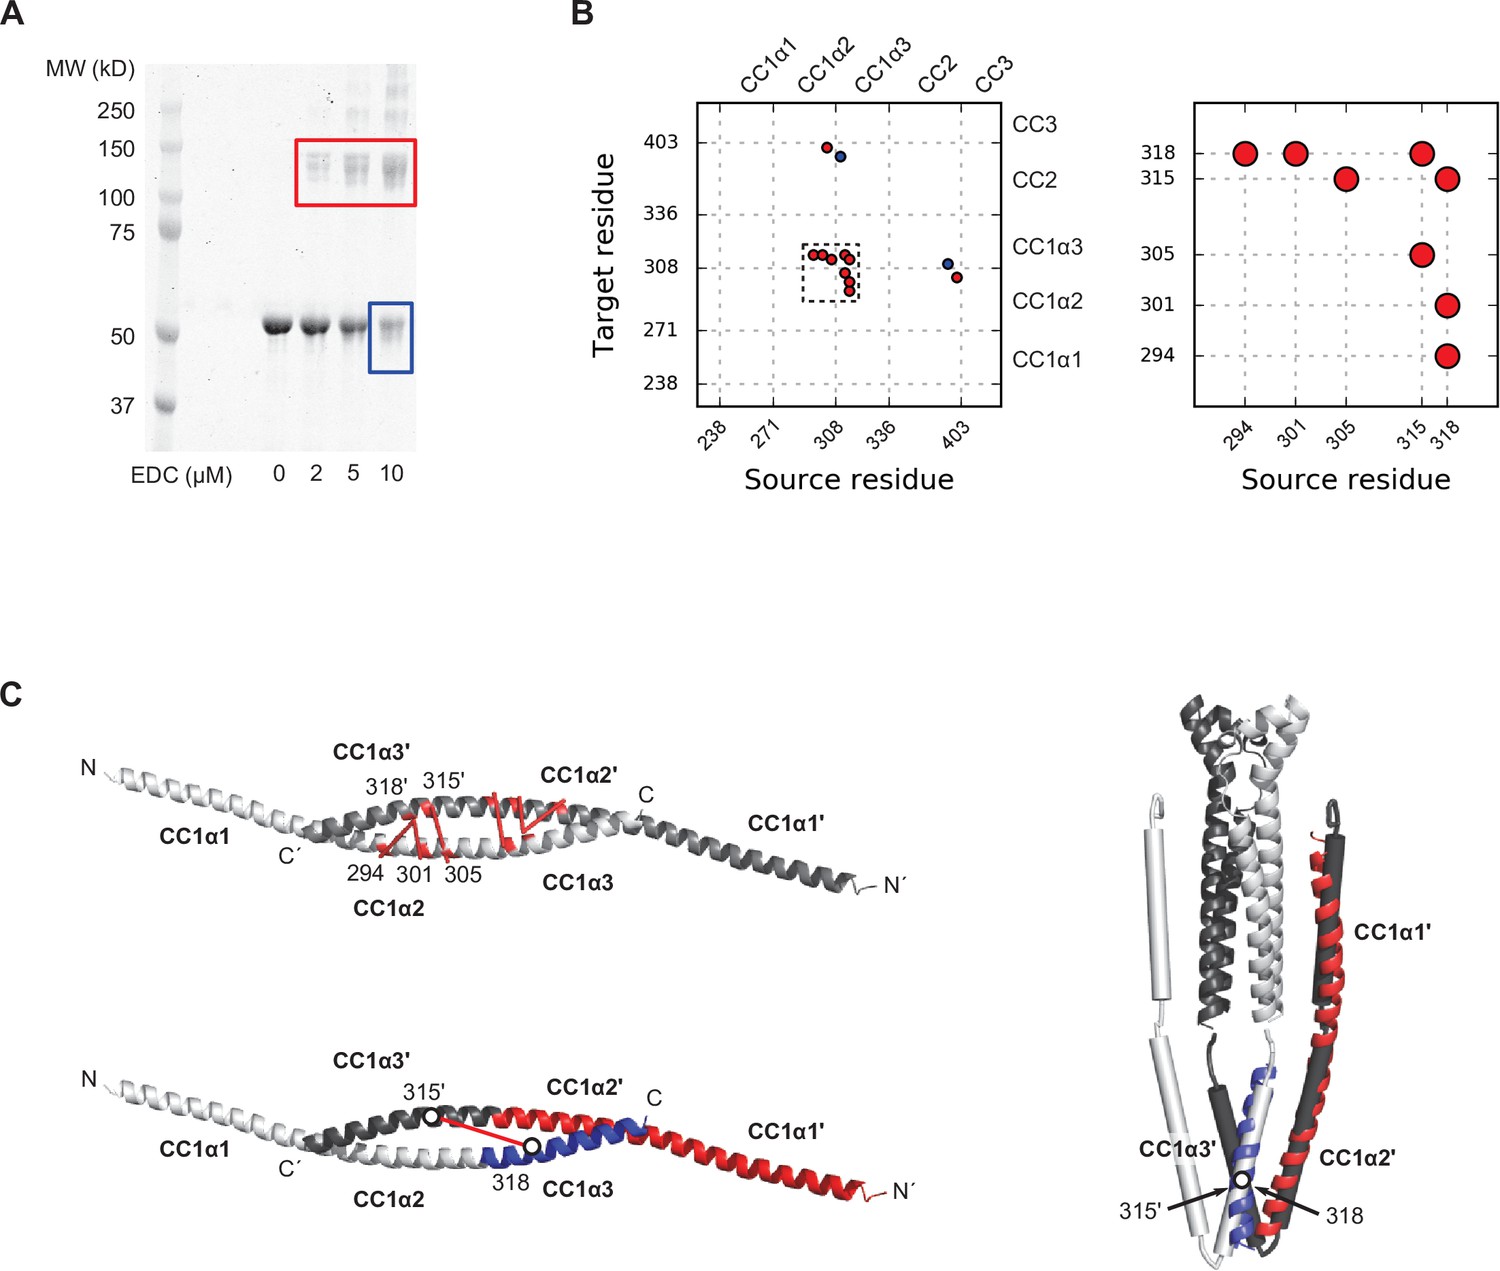
Mass spectrometry analysis of ctSTIM1 crosslinking by EDC.
(A) SDS-PAGE analysis of ctSTIM1 treated with zero-length amine-carboxyl crosslinker EDC. Monomer (blue) and dimer (red) bands were cut from the gel for analysis by mass spectrometry. For the monomer band we used only the last lane, to obtain roughly equal amounts of material from both bands and increase the fraction of reacted sample. (B) Mass spectrometry analysis showed a cluster of four dimeric (likely inter-subunit) links within the CC1α2-CC1α3 region, indicated by the black dashed square and enlarged on the right. (C) A crystal structure of the CC1 fragment (237–340, with mutations M244L and L321M) is a dimer of two continuous helices with a coiled-coil interactions between CC1α2 and CC1α3 domains (4O9B.pdb) (Cui et al., 2013). Three out of the four EDC links in the CC1α2/α3 cluster (K294:E318´, K301:E318´, and E305:K315´) could be mapped directly onto the crystal structure (top left). The fourth link (K315´:E318) appears to bridge a larger distance (bottom left), but can be rationalized by aligning the red and blue sections of the CC1 dimer crystal structure to the corresponding parts of the smFRET-derived CC1-CAD model and folding the CC1 dimer around the flexible region aa 305–310 (right). In the CC1-CAD model, residues 315´ and 318 are proximal to each other, consistent with EDC crosslinking of these sites.
-
Figure 5—figure supplement 3—source data 1
Raw unedited gel for Figure 5—figure supplement 3A (ctSTIM1 EDC crosslinking).
- https://cdn.elifesciences.org/articles/66194/elife-66194-fig5-figsupp3-data1-v2.zip
-
Figure 5—figure supplement 3—source data 2
Uncropped labeled gel for Figure 5—figure supplement 3A (ctSTIM1 EDC crosslinking).
- https://cdn.elifesciences.org/articles/66194/elife-66194-fig5-figsupp3-data2-v2.zip
Figure 6 with 1 supplement
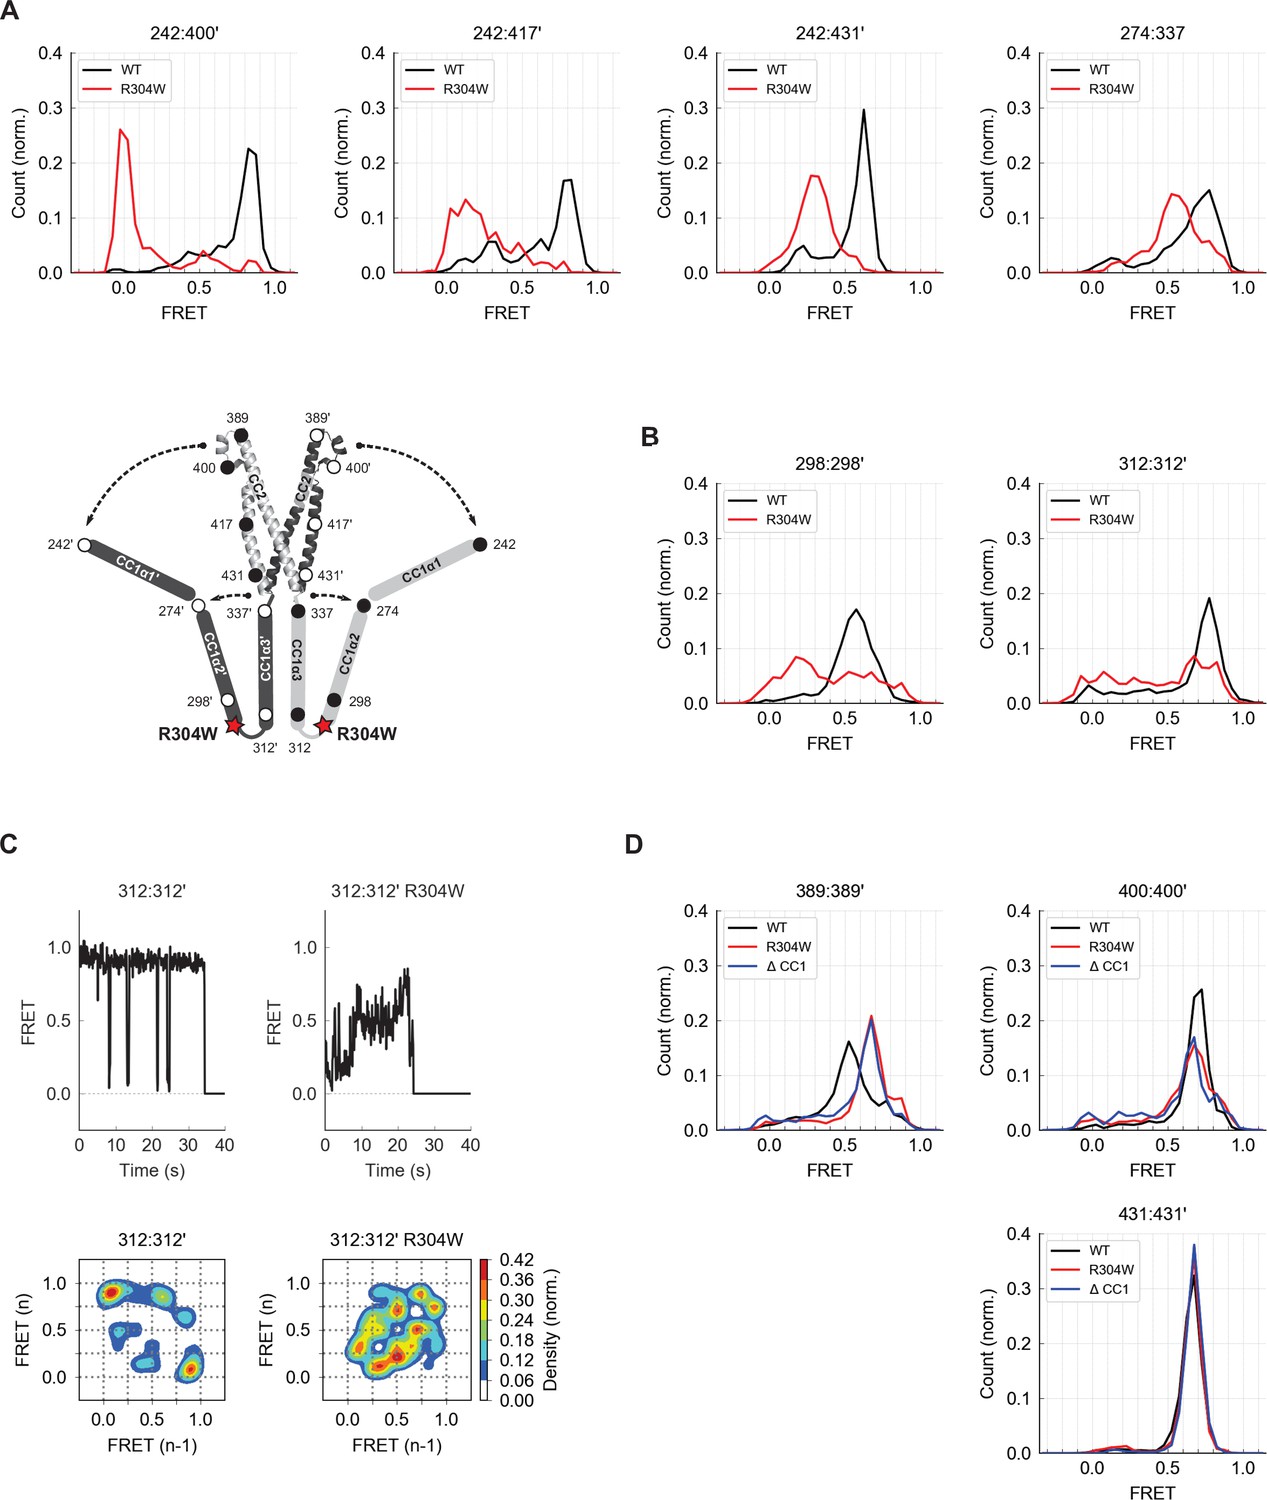
The Stormorken R304W mutation releases CC1 from CAD.
(A) The R304W mutation reduced inter-subunit smFRET between aa 242 on CC1α1 and sites 400´, 417´, and 431´ on CC3´, indicating separation of CC1α1 from CAD. The mutation also reduced intra-subunit FRET for 274:337, consistent with a widening of the angle between CC1α2 and CC1α3. (B) The predominant FRET levels for 298:298´ (left) and 312:312´ (right) were diminished by R304W, suggesting a disruption of the compact parallel structure of CC1α2/α3 domains. (C) Effects of R304W on inter-subunit FRET fluctuations at 312:312´, near the CC1α3 N-terminus. The dominant large-amplitude fluctuations of the wild-type (top left) were entirely absent in the mutant, which instead displayed frequent small fluctuations among a range of FRET levels (top right). The different fluctuation modes are summarized in ensemble transition density plots (see Materials and methods) which show a single dominant FRET transition for wild-type molecules (bottom left, 38 molecules), and a multimodal density distribution for R304W mutants (bottom right, 25 molecules). (D) In the CAD apex, R304W or deletion of the entire CC1 region (ctSTIM1-ΔCC1) increased the FRET at 389:389´ (left) and reduced it slightly at 400:400´ (center), suggesting that the apex interacts with CC1α1 in the WT conformation. Neither R304W nor ΔCC1 affected FRET at 431:431´ (right) in the CAD base.
Figure 6—figure supplement 1
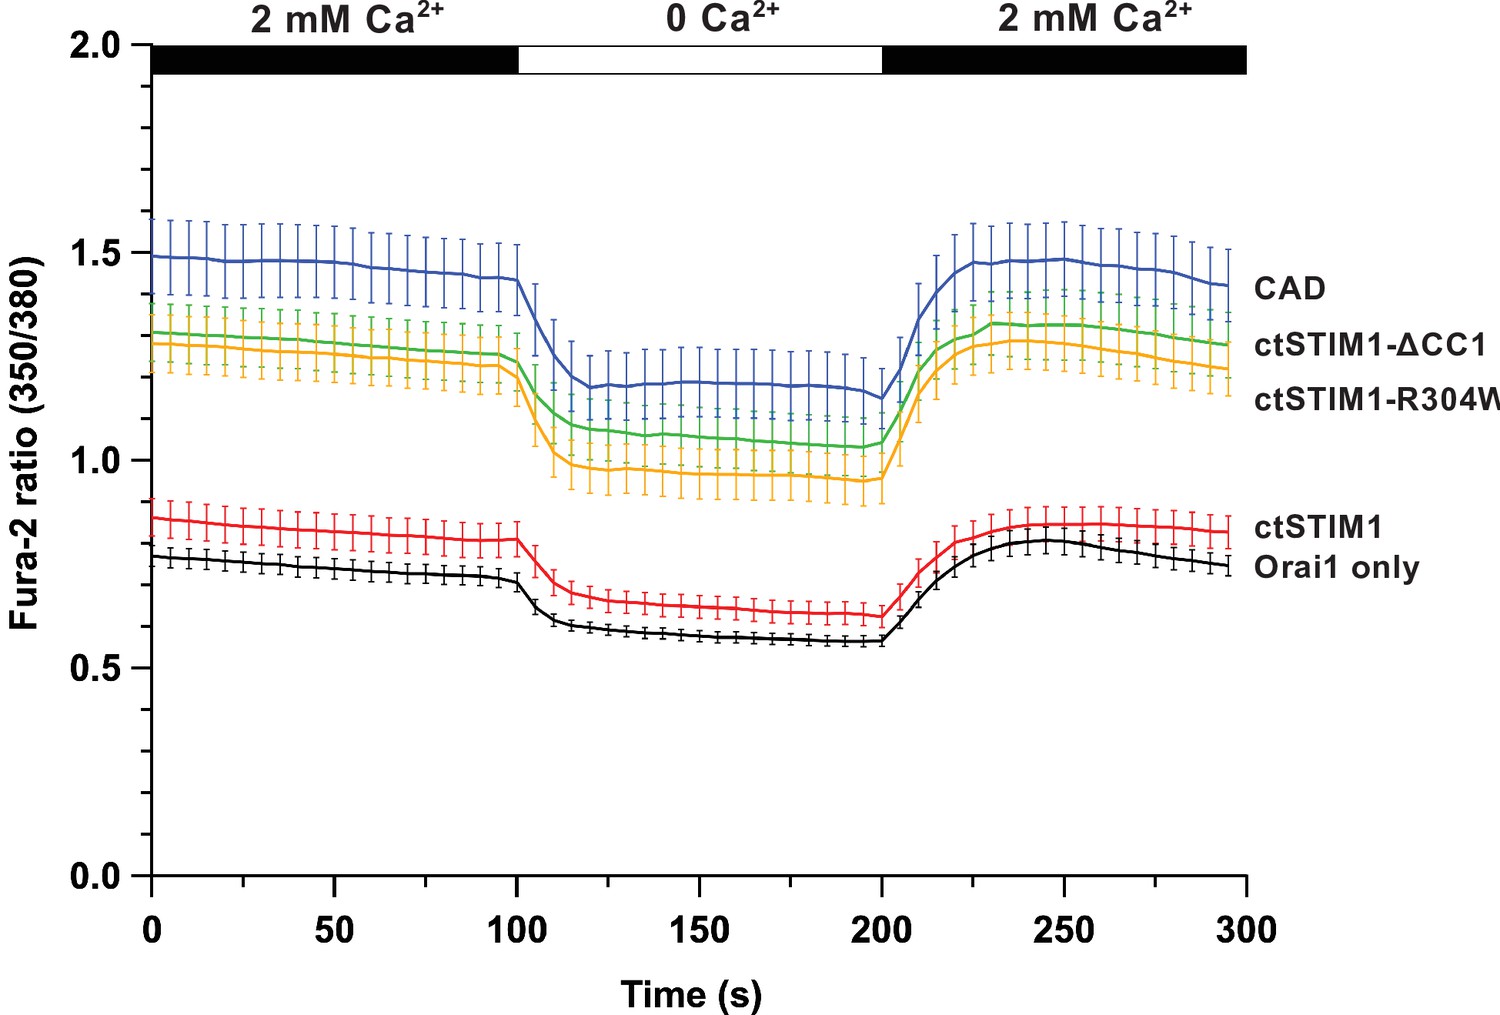
Orai1-mediated Ca2+ influx evoked by ctSTIM1 fragments.
HEK293 cells expressing the indicated ctSTIM1 variant and Orai1-GFP were exposed sequentially to 2 mM Ca2+, 0 Ca2+, and 2 mM Ca2+. The fura-2 350/380 fluorescence ratio is shown for ctSTIM1 (aa 233–685), ctSTIM1-R304W, ctSTIM1-ΔCC1 (aa 340–685), CAD (aa 342–448), and Orai1-GFP alone. Each trace shows the mean and s.e.m. of 25–35 cells in multiple runs from two independent transfections. ctSTIM1 has very little activity, while ctSTIM1-R304W and ctSTIM1-ΔCC1 approach the high activity of the CAD fragment.
Figure 7 with 2 supplements
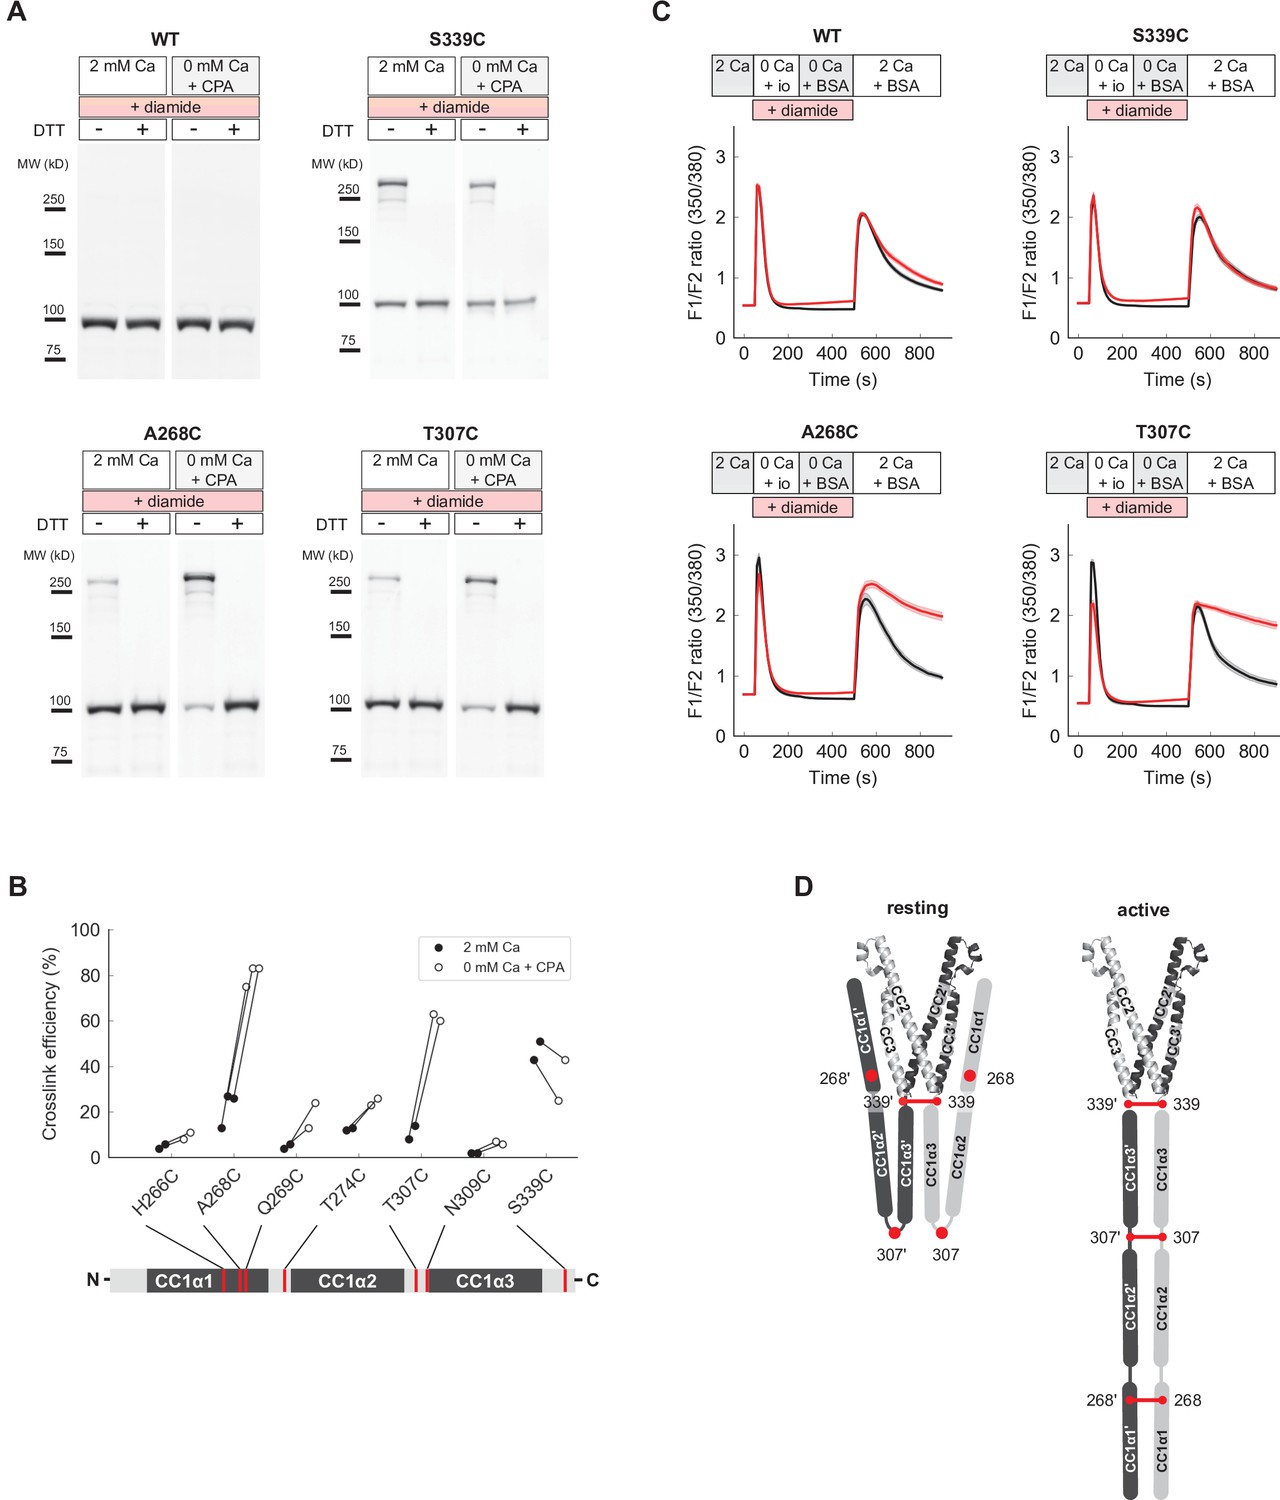
Close pairing of CC1 domains along their entire length in the activated state of full-length STIM1 (flSTIM1) in vivo.
(A) Western-blot analysis of diamide-induced cysteine crosslinking of flSTIM1-WT, flSTIM1-A268C, flSTIM1-T307C and flSTIM1-S339C in HEK293 cells, under resting (2 mM Ca2+) or store-depleted (0 mM Ca2+ + CPA) conditions. (B) Summary of flSTIM1 cysteine crosslinking before (black) and after (white) store depletion measured in individual paired experiments. While crosslinking at aa 268 and aa 307 strongly increased in the activated state, crosslinking at aa 339 occurred independently of STIM1 activation (see also Figure 7—figure supplement 1B). (C) Effects of flSTIM1 cysteine crosslinking on deactivation of SOCE following store refilling. WT flSTIM1 and cysteine mutants were co-expressed with Orai1 for cytosolic calcium imaging. In cells expressing WT flSTIM1 and store-depleted by transient exposure to ionomycin (io, 1 µM), addition of 2 mM Ca2+ elevated [Ca2+]i due to SOCE, followed by a decline as SOCE deactivated from store refilling (top left, black). In contrast, diamide-induced crosslinking of A268C or T307C flSTIM1 mutants stabilized the active state, as evidenced by persistent calcium influx after ionomycin wash-out and store refilling (bottom left and right, red). Crosslinking of S339C did not affect deactivation of SOCE upon store refilling (top right). Each trace shows the mean and s.e.m. of the following numbers of cells (control/diamide) from at least two independent experiments: WT (91/106), A268C (31/47), T307C (38/46), S339C (44/41). (D) Schematic illustration of CC1 cysteine crosslinking in the resting (left) and activated (right) states of flSTIM1 (only CC1 and CAD are shown for clarity). In the resting state, CC1α1 and CC1α3 domains are kept apart, preventing crosslinking at locations upstream of aa 339. Upon store depletion, release of the CC1α1 domains from CAD promotes alignment of CC1 domains along their entire length, enabling crosslinking at aa 268 and 307.
-
Figure 7—source data 1
Raw unedited and uncropped labeled western blots for Figure 7A (WT).
- https://cdn.elifesciences.org/articles/66194/elife-66194-fig7-data1-v2.zip
Figure 7—figure supplement 1
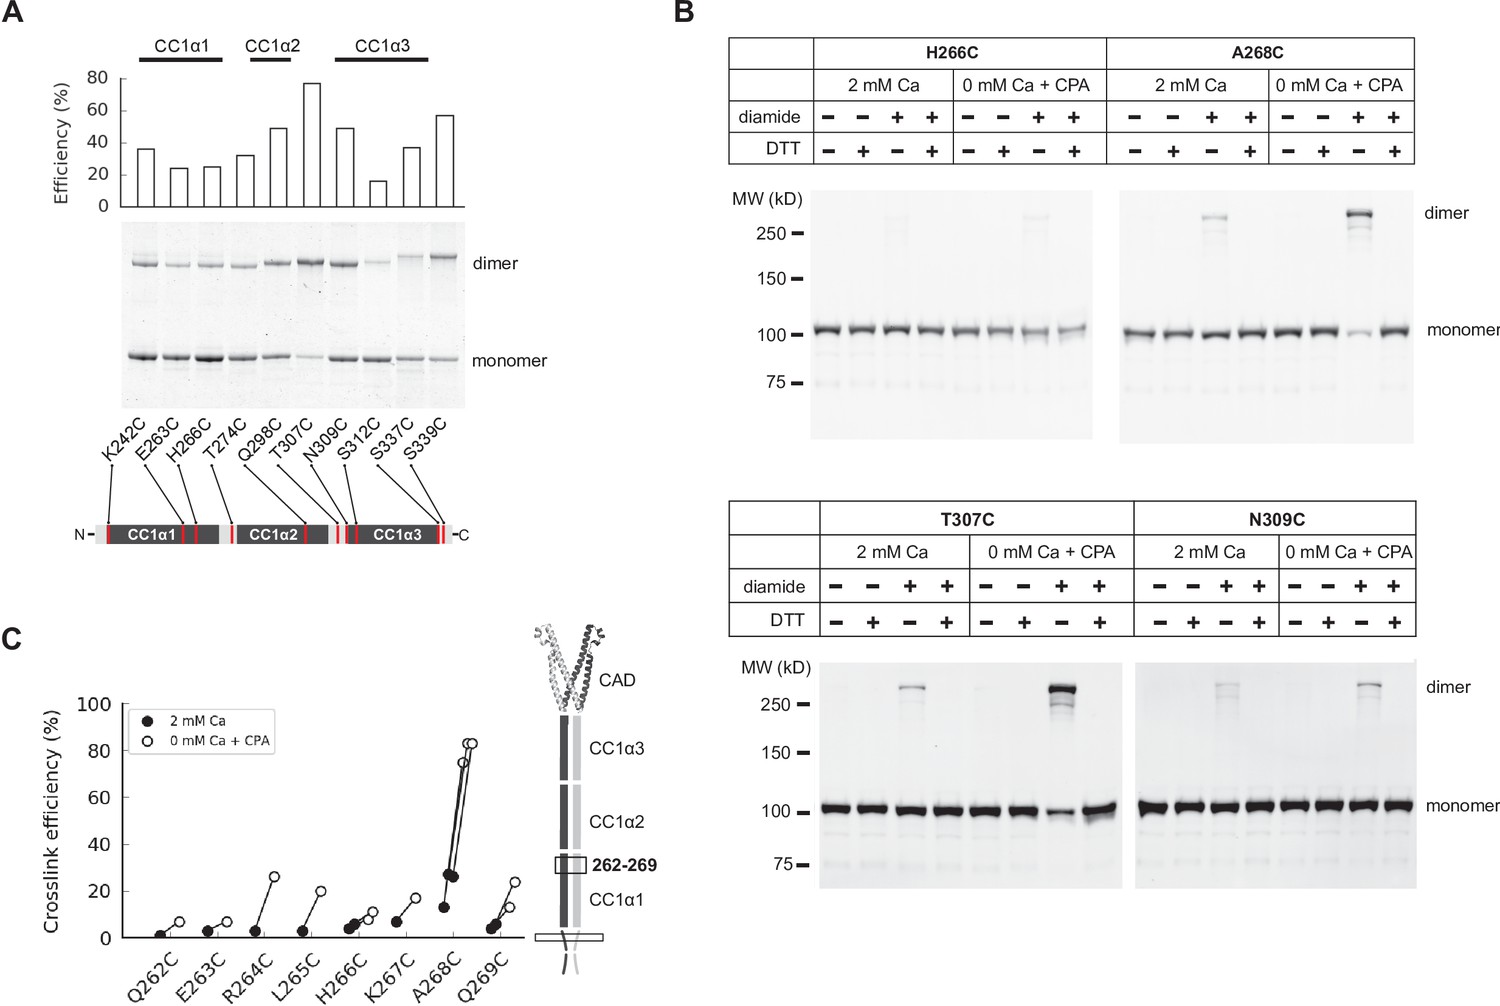
CC1 cysteine crosslinking in ctSTIM1 and flSTIM1.
(A) Cysteine crosslinking throughout the CC1 domain of ctSTIM1 mutants in vitro produced by copper phenanthroline and detected by non-reducing SDS-PAGE (see Materials and methods). Crosslinking efficiency peaked at aa 307 in the CC1α2/α3 linker region. (B) Full-length STIM1 (flSTIM1) mutants H266C, A268C, T307C, and N309C, were transiently over-expressed in HEK293 cells for diamide-induced cysteine crosslinking in vivo. Western-blot analysis shows strong crosslinking of flSTIM1-A268C and flSTIM1-T307C only after activation by store depletion (0 mM Ca+ CPA). Little or no crosslinking occurred at nearby residues (H266C or N309C). All crosslinking was reversed by DTT. (C) Crosslinking efficiencies in the inactive (black) and active (white) states for residues aa 262–269 at the C-terminal end of CC1α1. Crosslinking at several sites within this region increased somewhat in the active state, but crosslinking for A268C was particularly strong, suggesting a close, stable apposition at that position.
-
Figure 7—figure supplement 1—source data 1
Raw unedited and uncropped labeled gel and western blots for Figure 7—figure supplement 1.
- https://cdn.elifesciences.org/articles/66194/elife-66194-fig7-figsupp1-data1-v2.zip
Figure 7—figure supplement 2
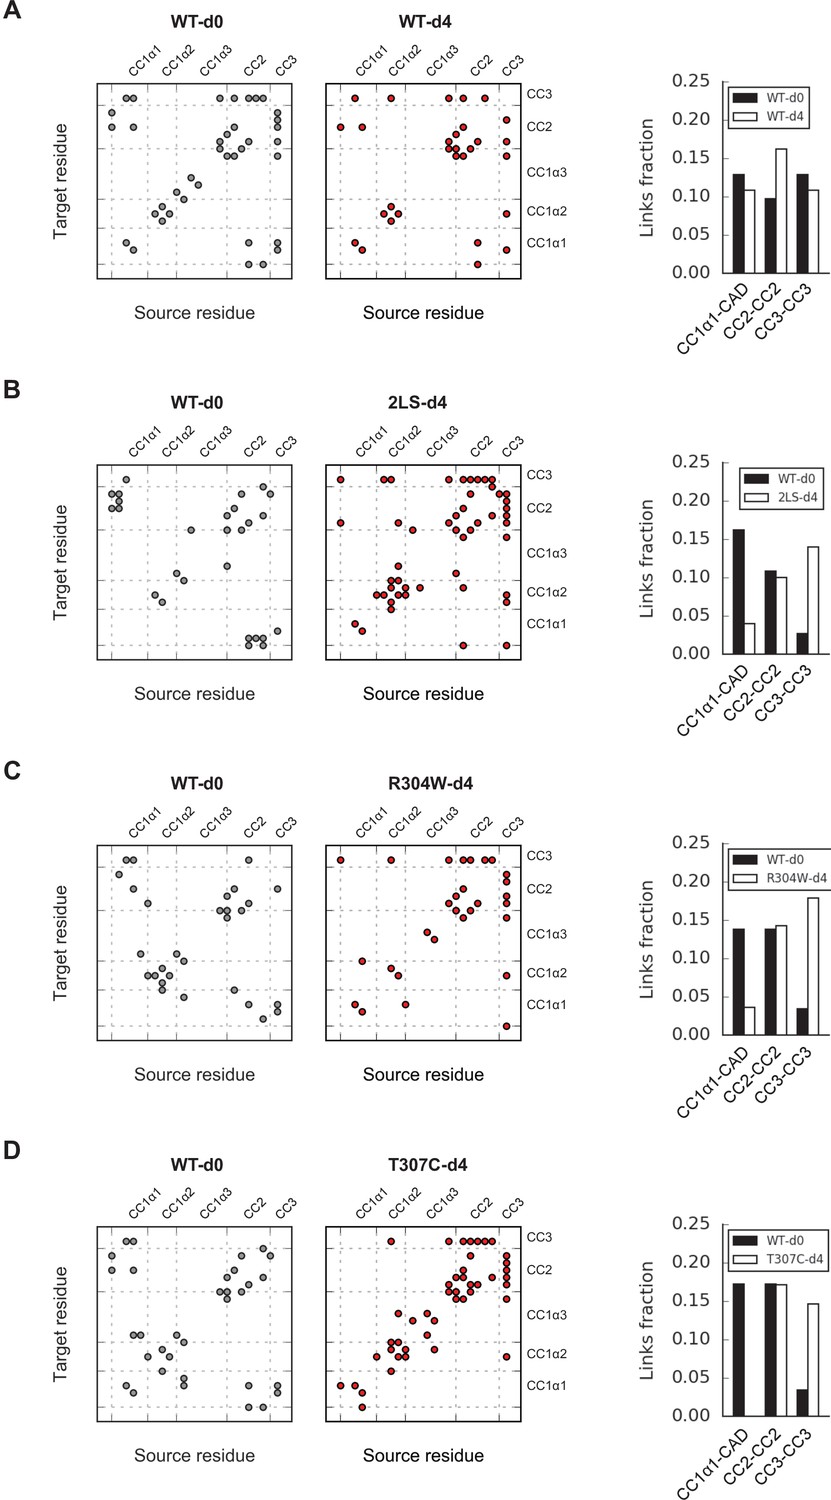
Mass spectrometry analysis of BS3 crosslinking of active ctSTIM1 mutants.
Mass-spectrometry analysis of ctSTIM1 variants 2LS (L248S + L251S, B), R304W (C), and T307C (D) showed similarly altered link patterns relative to WT (A). Crosslinked residue pairs for each sample are given in Figure 7—figure supplement 2—source data 1. The bar graphs indicate the number of unique links between the indicated domains as a fraction of the total number of unique links in the sample. Relative to the WT reference, the number of CC1α1-CAD links decreased in the variants, consistent with the release of CC1α1 in an activated state of ctSTIM1. The decrease in CC1α1-CAD links was compensated by an increase in CC2-CC3 links within CAD, probably because the CC1α1 domain was no longer able to compete for links with sites in CAD. See Figure 5—figure supplement 2A for SDS-PAGE analysis of each sample.
-
Figure 7—figure supplement 2—source data 1
List of crosslinked residues from mass spectrometry.
- https://cdn.elifesciences.org/articles/66194/elife-66194-fig7-figsupp2-data1-v2.xlsx
Figure 8

Possible conformational trajectories of flSTIM1 activation in vivo.
(A) In the resting state, the parallel orientation of CC1α1 and CC3 domains implies that CAD is held with its apex close to and pointed towards the ER membrane, effectively shielding critical interaction sites (stars) from engaging with Orai. The region C-terminal to CAD is abbreviated as its conformation is unknown. (B) Alternative models for transitions to the active state of flSTIM1. In the ‘fold out’ model (top), following the release of CC1α1, CAD undergoes a symmetric conformational change in which the CC2 domains pass through a transient antiparallel state, providing a free path for the region downstream of CAD to extend towards the plasma membrane. In the ‘flip out’ model (bottom), CAD maintains its parallel resting conformation and undergoes an asymmetric outward rotation from between the CC1 domains. Assuming that the initial resting conformation is symmetric, one of its C-terminal domains (gray) would need to be carried through the gap between the two CC1 domains.
Author response image 1
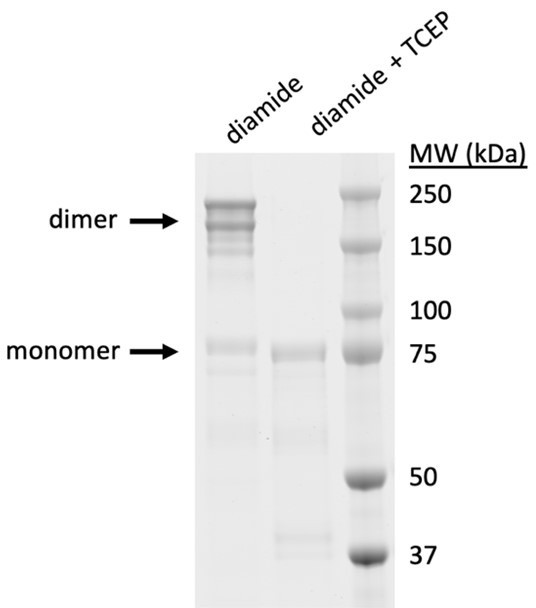
Dimers of flSTIM1 show anomalously low mobility in SDS-PAGE.
Purified flSTIM1 was treated with 0.1 mM diamide for 10 min. In lane 2, 10 mM TCEP (reducing agent) was added to the crosslinked sample 10 min before running the gel. Coomassie blue SDS-PAGE with MW markers shown at right.
Tables
Key resources table
| Reagent type (species) or resource | Designation | Source or reference | Identifiers | Additional information |
|---|---|---|---|---|
| Gene (human) | STIM1 | Origene | ||
| Strain, strain background (Escherichia coli) | BL21 | New England Biolabs | C25271 | |
| Strain, strain background (Escherichia coli) | CVB101 | Avidity | CVB101 | |
| Cell line (human) | HEK293 | ATCC | CRL-1573 | |
| Antibody | Mouse monoclonal anti-mCherry | Takara Bio | 632,543RRID:AB_2307319 | (1:2000) |
| Antibody | Donkey polyclonal anti-mouse IgG | LI-COR | 926–032212RRID:AB_621847 | (1:10000) |
| Recombinant DNA reagent | pAC6 (vector) | Avidity | ||
| Recombinant DNA reagent | mCherry-labeled STIM1 (plasmid) | doi:10.1083/jcb.200604014 | ||
| Recombinant DNA reagent | Orai1-GFP (plasmid) | doi:10.1074/jbc.M703573200 | ||
| Peptide, recombinant protein | TEV protease | MCLAB | TEV-200 | |
| Peptide, recombinant protein | BSA-biotin | Sigma Aldrich | A8549 | |
| Peptide, recombinant protein | Neutravidin | Thermo Fisher | 31000 | |
| Peptide, recombinant protein | Glucose oxidase | Sigma Aldrich | G2133 | |
| Peptide, recombinant protein | Catalase | Sigma Aldrich | C9322 | |
| Peptide, recombinant protein | Trypsin/LysC protease | Promega | V5071 | |
| Commercial assay or kit | QuikChange II | Agilent | 200524 | |
| Commercial assay or kit | PEG/PEG-biotin | Laysan Bio | BIO-PEG-SVA-5K & MPEG-SVA-5K | |
| Chemical compound, drug | TCEP | Thermo Fisher Scientific | 77720 | |
| Chemical compound, drug | Alexa Fluor 555 | Invitrogen Life Technologies | A-20346 | |
| Chemical compound, drug | Alexa Fluor 647 | Invitrogen Life Technologies | A-20347 | |
| Chemical compound, drug | Biotinylated lipids 18:1 Biotinyl Cap PE | Avanti Polar Lipids | 870273 C | |
| Chemical compound, drug | egg-PC lipids | Avanti Polar Lipids | 840051 C | |
| Chemical compound, drug | Cyclooctatetraene | Sigma Aldrich | 138924 | |
| Chemical compound, drug | BS3-d0 | Sigma Aldrich | 21590 | |
| Chemical compound, drug | BS3-d4 | Sigma Aldrich | 21595 | |
| Chemical compound, drug | EDC | Thermo Fisher Scientific | 77149 | |
| Chemical compound, drug | Sulfo-NHS | Thermo Fisher Scientific | 24520 | |
| Chemical compound, drug | ProteaseMax | Promega | V2071 | |
| Chemical compound, drug | Cyclopiazonic acid (CPA) | Sigma Aldrich | C1530 | |
| Chemical compound, drug | Protease inhibitor cocktail | Cell Signaling Technology | 5871 S | |
| Chemical compound, drug | Lipofectamine 2000 | Thermo Scientific | 11668027 | |
| Chemical compound, drug | Poly-D-lysine | Sigma Aldrich | P-7405 | |
| Chemical compound, drug | fura-2/AM | Invitrogen | F-1221 | |
| Software, algorithm | μManager | doi:https://doi.org/10.1002/0471142727 | RRID:SCR_016865 | https://micro-manager.org/ |
| Software, algorithm | SMART: Single Molecule Analysis Research Tool | doi:10.1371/journal.pone.0030024 | https://simtk.org/projects/smart/ | |
| Software, algorithm | Crystallography and NMR System (CNS) | doi:10.1038/nprot.2007.406; doi:https://doi.org/10.1107/S0907444998003254 | RRID:SCR_014223 | http://cns-online.org/v1.2/ |
| Software, algorithm | PyMOL Molecular Graphics System ver. 1.8 | Schrödinger, LLC | RRID:SCR_000305 | http://www.pymol.org/ |
| Software, algorithm | ProDy | doi:10.1093/bioinformatics/btr168 | http://prody.csb.pitt.edu/ | |
| Software, algorithm | Flexpepdock server of Rosetta | doi:10.1093/nar/gkr431 | Rosetta, RRID:SCR_015701 | http://flexpepdock.furmanlab.cs.huji.ac.il/ |
| Software, algorithm | Byonic v2.12.0 or v2.14.27 | Protein Metrics | RRID:SCR_016735 | |
| Other | NiNTA beads | Qiagen | 30210 | |
| Other | SnakeSkin | Life Technologies | 68700 | |
| Other | HiTrap Q column | GE Healthcare Life Sciences | 17-1153-01 | |
| Other | Quartz microscope slides | G. Finkenbeiner Inc. | For smFRET | |
| Other | Microscope coverslips | Erie Scientific | 24 × 40 1.5 001 | For smFRET |
| Other | Liposome Extruder Set | Avanti Polar Lipids | 610023 | |
| Other | PC Membranes 0.1 µm | Avanti Polar Lipids | 610005-1EA | |
| Other | Sepharose CL-4B column | Sigma Aldrich | CL4B200 | |
| Other | OBIS 532 nm LS 150 mW laser | Coherent | 1280719 | For smFRET |
| Other | OBIS 637 nm LX 140 mW laser | Coherent | 1196626 | For smFRET |
| Other | Dichroic beamsplitter | Semrock | FF652-Di01−25 × 36 | For smFRET |
| Other | Donor band-pass filter | Semrock | FF01-580/60-25-D | For smFRET |
| Other | Acceptor band-pass filter | Semrock | FF01-731/137-25 | For smFRET |
| Other | Emission beam splitter | Cairn Research | OptoSplit-II | For smFRET |
| Other | EM-CCD camera | Andor | iXon DU897E | For smFRET |
| Other | Polychrome II | TILL Photonics | For calcium imaging | |
| Other | emission filter | Semrock | FF02-534/30-25 | For calcium imaging |
| Other | emission filter >480 nm | Chroma Technology Corp. | For calcium imaging | |
| Other | Flash4.0 sCMOS camera | Hamamatsu Corp. | For calcium imaging |
Additional files
-
Supplementary file 1
smFRET-derived distance measurements used to construct the CC1-CAD model.
The table lists the complete set of amino acid pairs, their predominant smFRET efficiencies, the corresponding smFRET-derived distances, and the range of distance values used for generating the models shown in Figure 5A and Figure 5—figure supplement 1. The 'FRET peak' and 'Distance' values correspond to the peaks of the smFRET histograms and the associated calculated distances shown in Figure 1—figure supplements 1–3. For sites with both liposome and avitag measurements, the liposome measurement was used to constrain the CC1:CAD model. The ‘Range’ values indicate the allowable distance bounds for each pair of modeled residues (see Materials and methods).
- https://cdn.elifesciences.org/articles/66194/elife-66194-supp1-v2.docx
-
Supplementary file 2
PyMOL file containing the stacked CC1-CAD models shown in Figure 5—figure supplement 1.
- https://cdn.elifesciences.org/articles/66194/elife-66194-supp2-v2.pse
-
Supplementary file 3
PyMOL file containing the wedged CC1-CAD models shown in Figure 5—figure supplement 1.
- https://cdn.elifesciences.org/articles/66194/elife-66194-supp3-v2.pse
-
Transparent reporting form
- https://cdn.elifesciences.org/articles/66194/elife-66194-transrepform1-v2.docx
Download links
A two-part list of links to download the article, or parts of the article, in various formats.
Downloads (link to download the article as PDF)
Open citations (links to open the citations from this article in various online reference manager services)
Cite this article (links to download the citations from this article in formats compatible with various reference manager tools)
Conformational dynamics of auto-inhibition in the ER calcium sensor STIM1
eLife 10:e66194.
https://doi.org/10.7554/eLife.66194


