AAV-Txnip prolongs cone survival and vision in mouse models of retinitis pigmentosa
- Department of Genetics, Blavatnik Institute, Harvard Medical School, United States
- Department of Ophthalmology, Harvard Medical School, United States
- Howard Hughs Medical Institute, United States
- Department of Biostatistics, Harvard T.H. Chan School of Public Health, United States
- Retina Service, Massachusetts Eye and Ear Infirmary, Harvard Medical School, United States
Figures
Figure 1 with 2 supplements
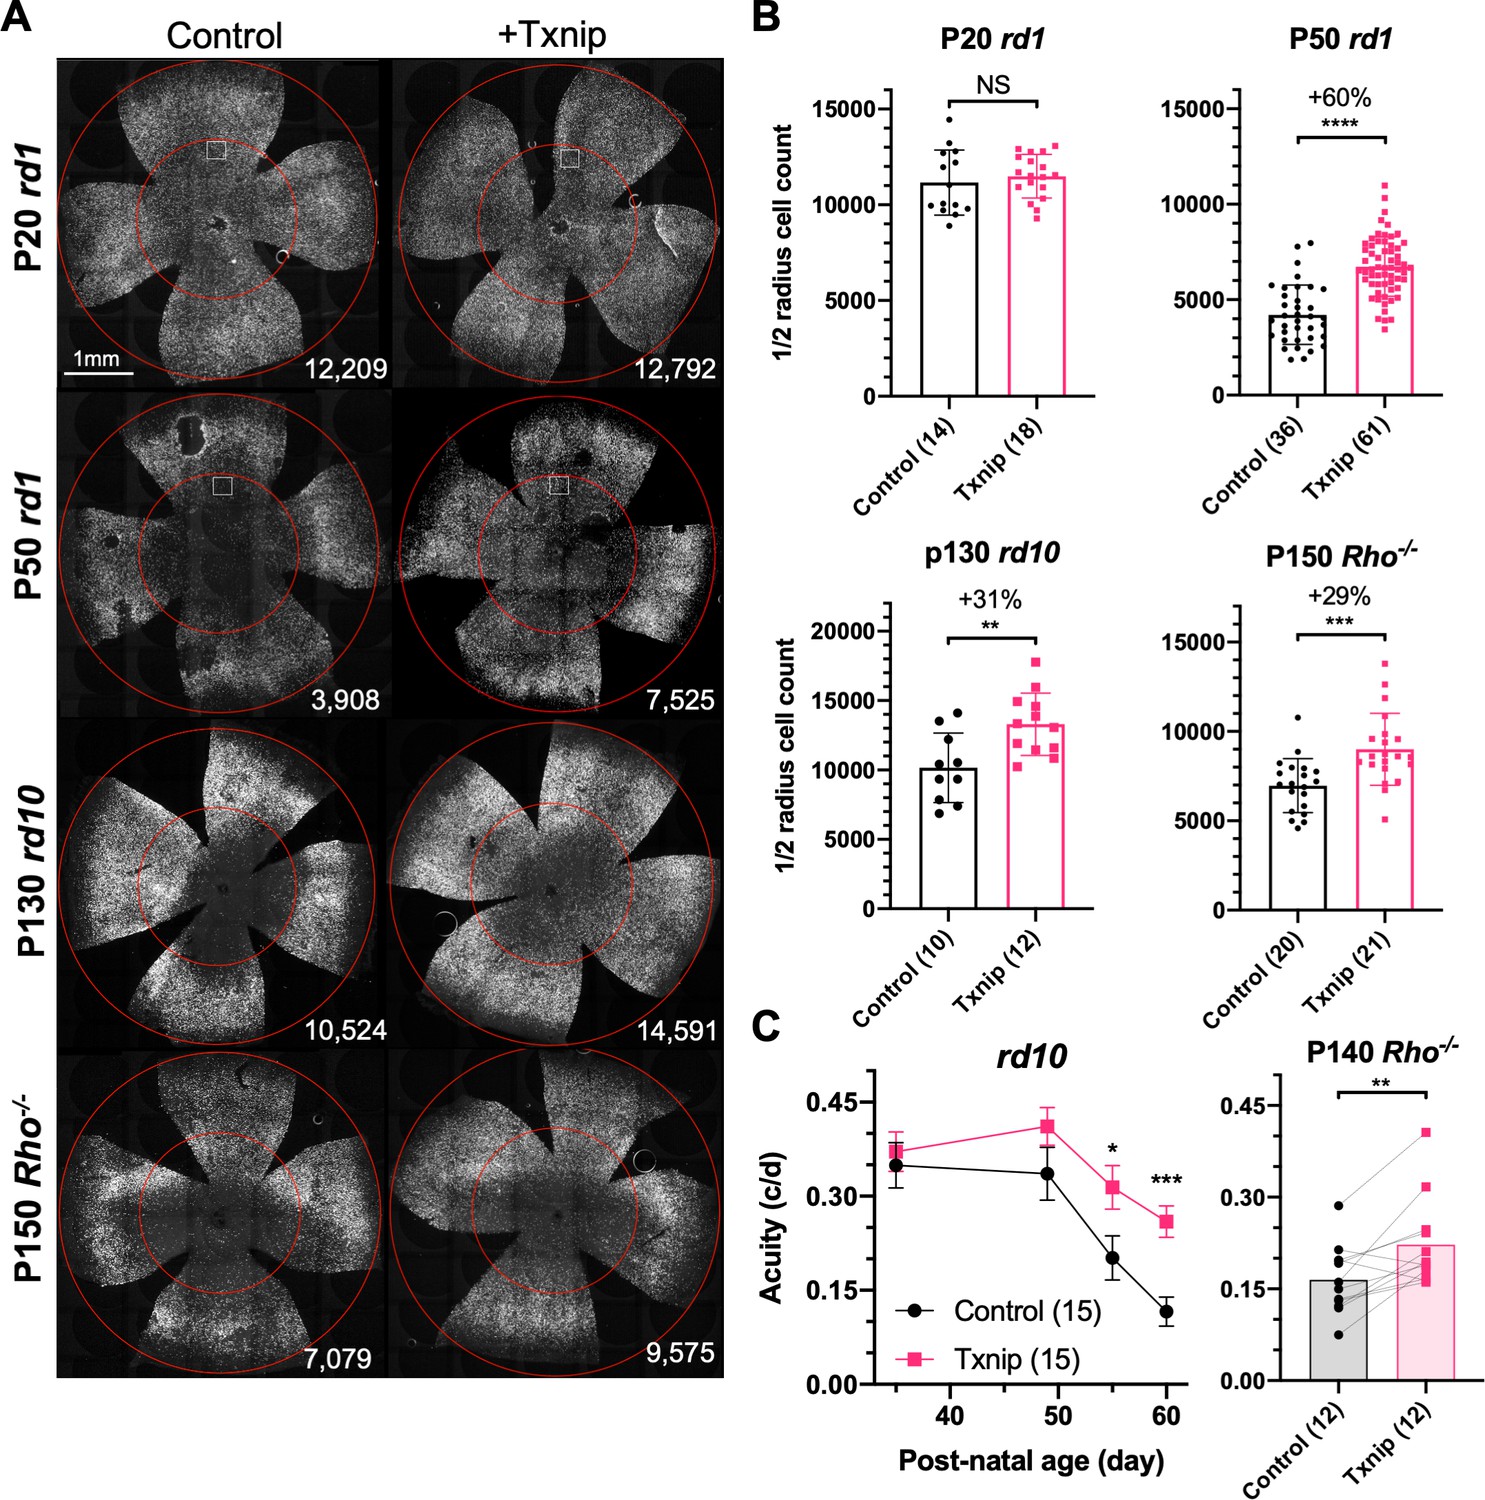
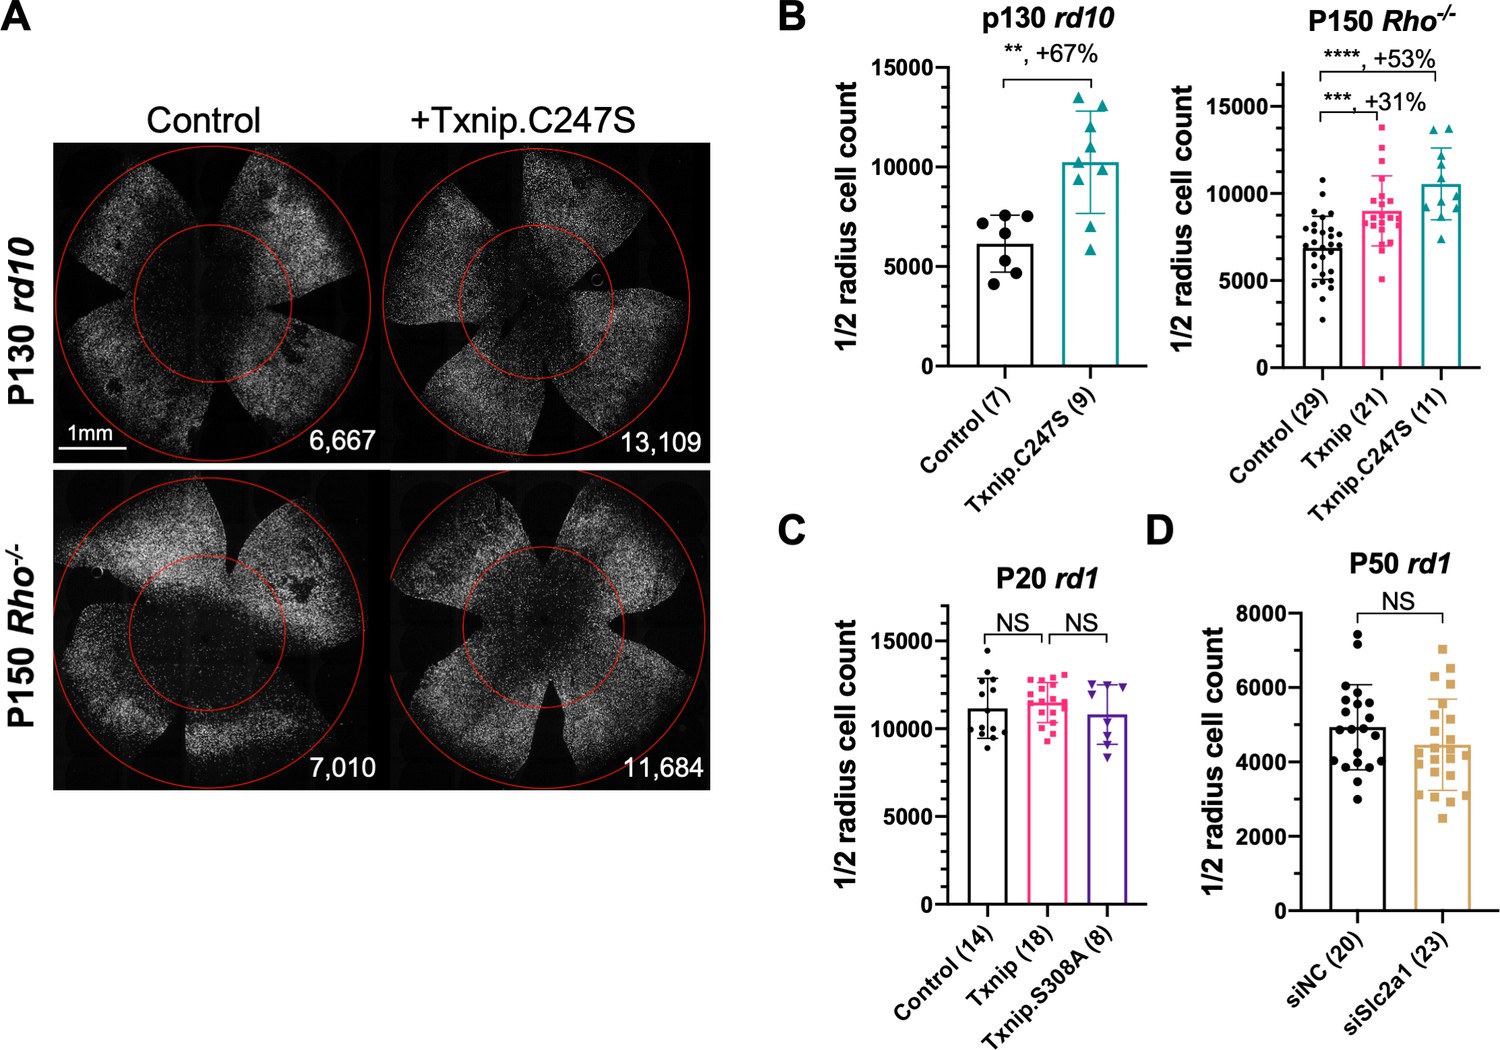
Txnip effects on cone survival and cone-mediated vision in retinitis pigmentosa (RP) mice.
(A) Representative images from postnatal day 20 (P20) and P50 rd1, P130 rd10, and P150 Rho-/- flat-mounted retinas, in which retinas were infected with adeno-associated viruses (AAVs) encoding Txnip and H2BGFP (AAV8-RedO-Txnip, ≈1 × 10⁹ vg/eye plus AAV8-RedO-H2BGFP, 2.5 × 10⁸ vg/eye) or control (AAV8-RedO-H2BGFP, 2.5 × 10⁸ vg/eye). The outer circle was drawn to mark the outline of the retina, and the inner circle was drawn to the ½ radius of the outer circle. The small boxes in the top four panels mark the regions shown at higher magnification in Figure 1—figure supplement 1C, demonstrating the pixels recognized as cones by the MATLAB automated-counting program. The number at the lower-right corner in each panel is the count of cones within the ½ radius of each image. All H2BGFP-labeled cones were counted within the central retina defined by the ½ radius (i.e., not just the cells from the small boxes). (B) Quantification of H2BGFP-positive cones within the ½ radius of the retina for different groups (same as in A). Error bar: standard deviation. The number in the round brackets ‘()’ indicates the sample size, that is, the number of retinas within each group. (C) Visual acuity of rd10 and Rho-/- mice transduced with Txnip or H2BGFP alone in each eye measured using an optomotor assay. Error bar: SEM. NS: not significant; p>0.05, *p<0.05, **p<0.01, ***p<0.001, **** p< or <<0.0001. RedO: red opsin promoter; AAV: adeno-associated virus.
-
Figure 1—source data 1
Adeno-associated virus 8 vectors used in this study.
Best1: retinal pigmented epithelium-specific promoter; SynPVI, SynP136, red opsin (RedO), RO1.7: various cone-specific promoters; N/A: not applicable; –: not performed; Pos: positive for cone rescue; Neg: negative for cone rescue.
- https://cdn.elifesciences.org/articles/66240/elife-66240-fig1-data1-v2.docx
Figure 1—figure supplement 1
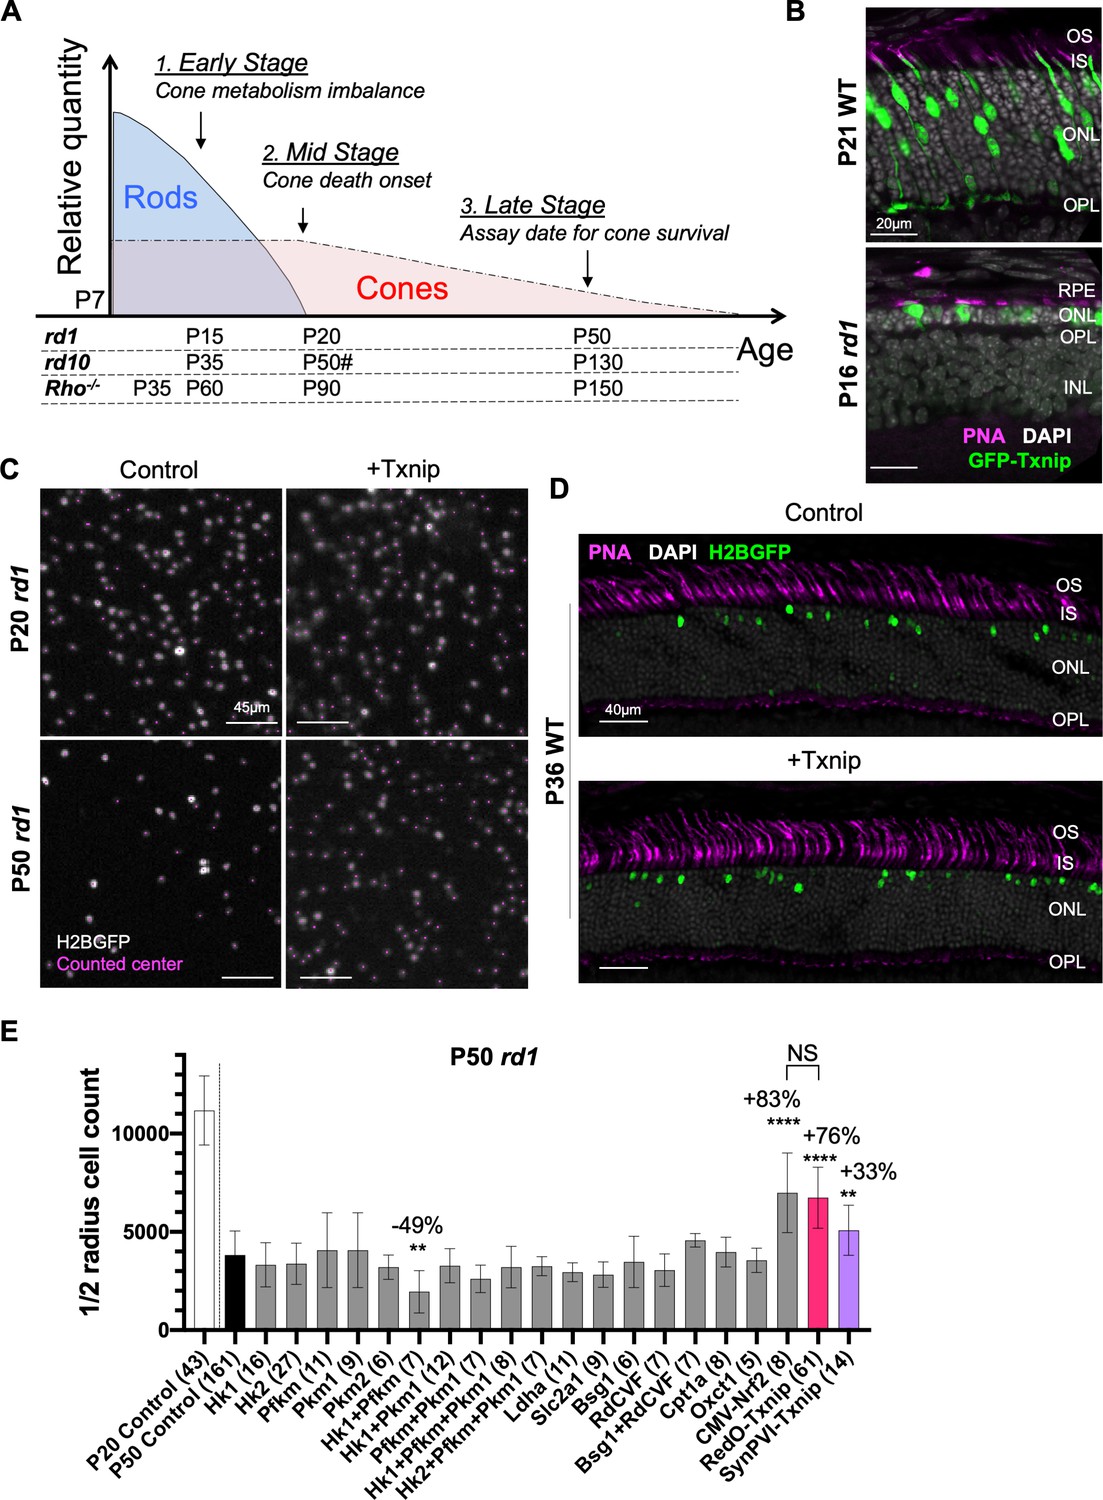
Additional figures for effects of metabolic genes on cone survival.
(A) Schematics of photoreceptor degeneration in retinitis pigmentosa (RP) mice (Punzo et al., 2009). # rd10 mid stage varies due to light-dependent rod degeneration (Chang et al., 2007). (B) The localization of Txnip expression in cones was tracked using a fusion protein of Txnip and GFP. AAV8-RO1.7-GFP-Txnip (1 × 10⁹ vg/eye, RO1.7 is a shorter version of red opsin promoter [RedO] of similar expression pattern) expression in P21 wildtype (WT) (BALB/c) and P16 rd1 retina are shown (green: GFP; magenta: peanut agglutinin [PNA] for cone extracellular matrix; gray: DAPI).OS: outer segment; IS: inner segment; ONL: outer nuclear layer; OPL: outer plexiform layer; INL: inner nuclear layer; RPE: retinal pigmented epithelium. (C) Pixels recognized as cones by a MATLAB automated-counting program. Images are from the small boxes in the top four panels of Figure 1A (gray: H2BGFP-labeled cones; magenta: center of one labeled cell recognized by MATLAB program). (D) P36 WT (C57BL/6J) retinal cross section with PNA staining injected with control (AAV8-RedO-H2BGFP, 2.5 × 10⁸ vg/eye) or AAV8-RedO-Txnip (2 × 10⁹ vg/eye) to assess if RedO-Txnip was toxic to cones (magenta: PNA; green: H2BGFP; gray: DAPI). (E) Quantification of H2BGFP-positive cones within the ½ radius of P20 rd1 control retinas, and P50 rd1 retinas transduced with 20 different vectors and combinations (single: ≈1 × 10⁹ vg/eye; combination: ≈2–3 × 10⁹ vg/eye total) or control (AAV8-RedO-H2BGFP, 2.5 × 10⁸ vg/eye). All injections of experimental vectors included AAV8-RedO-H2BGFP, 2.5 × 10⁸ vg/eye. The number in the round brackets ‘()’ indicates the sample size, that is, the number of retinas within each group. (Note: we did not use dark-reared rd10 for testing the RdCVF vector, and our adeno-associated virus (AAV) capsid and promoter were different from the original study of Byrne et al., 2015.) Error bar: standard deviation. NS: not significant; p>0.05, *p<0.05, **p<0.01, ***p<0.001, **** p< or <<0.0001. (Same applies to the rest of the figure supplements.) RedO: red opsin promoter.
Figure 1—figure supplement 2
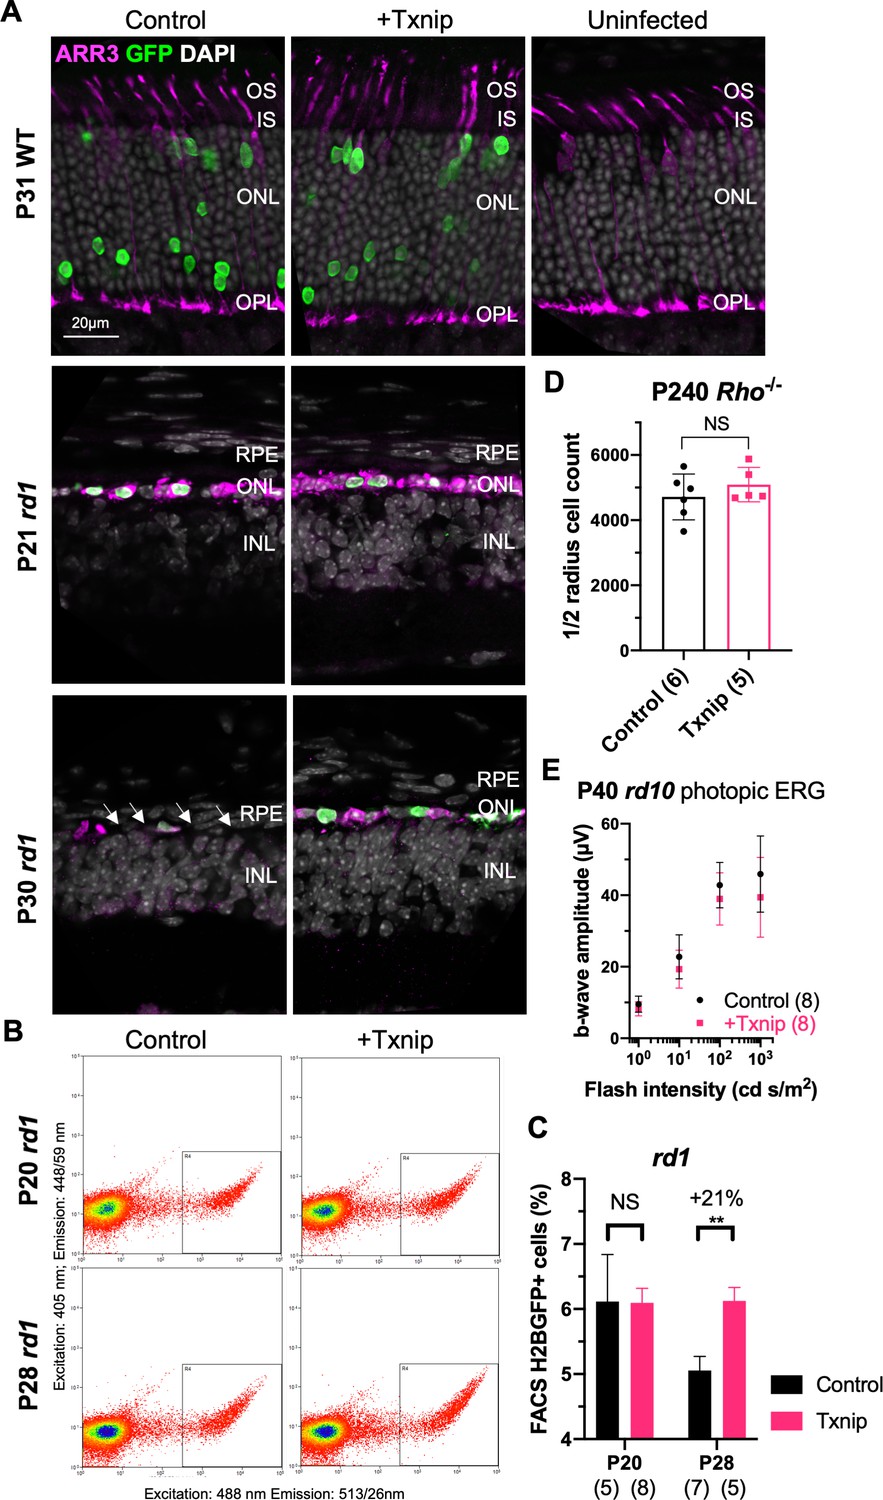
Additional figures for Txnip effects on cone survival.
(A) P31 wildtype (C57BL/6J), P21 rd1, and P30 rd1 retinal cross section with ARR3 antibody staining with AAV8-RedO-Txnip (1 × 10⁹ vg/eye, plus AAV8-RedO-H2BGFP, 2.5 × 10⁸ vg/eye) or control (AAV8-RedO-H2BGFP, 2.5 × 10⁸ vg/eye). Arrows: absent cone nuclei in rd1 outer nuclear layer (ONL) at P30 (magenta: ARR3; green: GFP; gray: DAPI). (B) Representative flow cytometry gating for cones and non-cone cells in the retina from different conditions. Cones were defined as AAV8-SynP136-H2BGFP (1 × 10⁹ vg/eye)-positive cells. Non-cones were defined as SynP136-H2BGFP-negative cells. No DAPI staining was applied. (C) Quantification by flow cytometry (FACS) of H2BGFP-positive cones from P20 and P28 rd1 retinas transduced with control (AAV8-SynP136-H2BGFP, 1 × 10⁹ vg/eye) or AAV8-RedO-Txnip (1 × 10⁹ vg/eye, plus AAV8-SynP136-H2BGFP, 1 × 10⁹ vg/eye). The number in the round brackets ‘()’ is sample size, that is, number of retinas. Error bar: SEM. (D) Quantification of H2BGFP-positive cones within the ½ radius of P240 Rho-/- retinas transduced with Txnip (AAV8-RedO-Txnip, 1 × 10⁹ vg/eye, plus AAV8-RedO-H2BGFP, 2.5 × 10⁸ vg/eye) or control (AAV8-RedO-H2BGFP, 2.5 × 10⁸ vg/eye). Error bar: standard deviation. (E) Ensemble- averaged photopic electroretinography b-wave amplitude from P40 rd10 eyes injected at P0 with control (AAV8-RedO-H2BGFP, 2.5 × 10⁸ vg/eye) or Txnip (AAV8-RedO-Txnip, 1 × 10⁹ vg/eye, plus AAV8-RedO-H2BGFP, 2.5 × 10⁸ vg/eye), elicited by 1 (peak), 10 (peak), 100 (xenon), and 1000 (xenon) cd s/m2 white light flashes with a white light background of 30 cd/m2. Error bar: SEM. RedO: red opsin; AAV: adeno-associated virus.
Figure 2 with 2 supplements
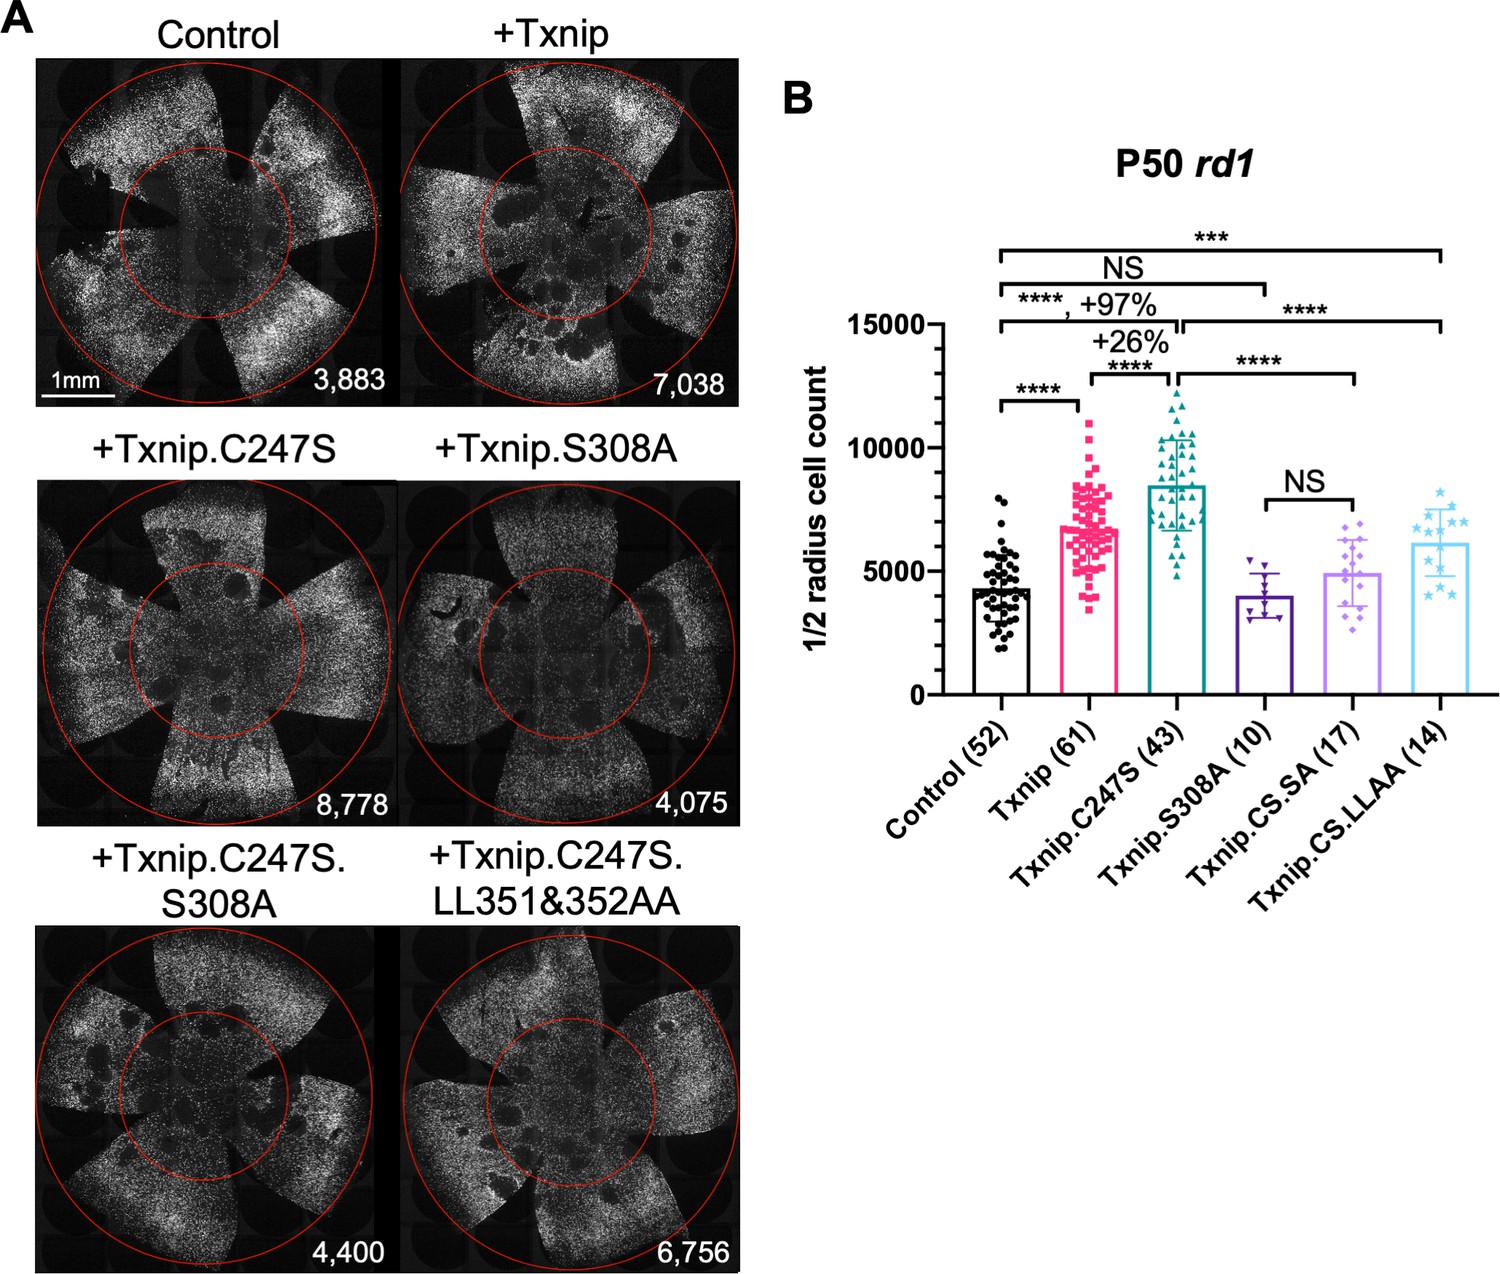
Test of Txnip alleles on cone survival.
(A) Representative P50 rd1 flat-mounted retinas after P0 infection with one of five different Txnip alleles (AAV8-RedO-Txnip wildtype (WT)/.C247S/.S308A/.C247S.S308A/.C247S.LL351 and 352AA, ≈1 × 10⁹ vg/eye, plus AAV8-RedO-H2BGFP, 2.5 × 10⁸ vg/eye), or control eyes infected with AAV8-RedO-H2BGFP, 2.5 × 10⁸ vg/eye alone. (B) Quantification of H2BGFP-positive cones within the ½ radius of P50 rd1 retinas transduced with WT Txnip, Txnip alleles, and control (same as in A). The number in the round brackets ‘()’ indicates the sample size, that is, the number of retinas within each group. Error bar: standard deviation. Txnip.CS.SA: Txnip.C247S.S308A; Txnip.CS.LLAA: Txnip.C247S.LL351 and 352AA. NS: not significant, p>0.05, *p<0.05, **p<0.01, ***p<0.001, **** p< or <<0.0001. RedO: red opsin promoter; AAV: adeno-associated virus.
Figure 2—figure supplement 1
Additional figures for effects of Txnip alleles on cone survival.
(A) Representative P130 rd10 and P150 Rho-/- flat-mounted retinas with H2BGFP (gray)-labeled cones transduced with Txnip.C247S (AAV8-RedO-Txnip.C247S, 1 × 10⁹ vg/eye, plus AAV8-RedO-H2BGFP, 2.5 × 10⁸ vg/eye) or control (AAV8-RedO-H2BGFP, 2.5 × 10⁸ vg/eye). (B) Quantification of H2BGFP-positive cones within the ½ radius of P130 rd10 and P150 Rho-/- retinas transduced with Txnip.C247S or control. The number in the round brackets ‘()’ indicates the sample size, that is, the number of retinas within each group. (C) Quantification of H2BGFP-positive cones within the ½ radius of P20 rd1 retinas transduced with Txnip, Txnip.S308A, or control. (D) Quantification of H2BGFP-positive cones within the ½ radius of P50 rd1 retinas transduced with siNC (non-targeting control shRNA, AAV8-RedO-siNC, 1 × 10⁹ vg/eye plus AAV8-RedO-H2BGFP, 2.5 × 10⁸ vg/eye) or Slc2a1/GLUT1 shRNA (AAV8-RedO-siSlc2a1, 1 × 10⁹ vg/eye plus AAV8-RedO-H2BGFP, 2.5 × 10⁸ vg/eye). The number in the round brackets ‘()’ indicates the sample size, that is, the number of retinas within each group. RedO: red opsin promoter; AAV: adeno-associated virus.
Figure 2—figure supplement 2
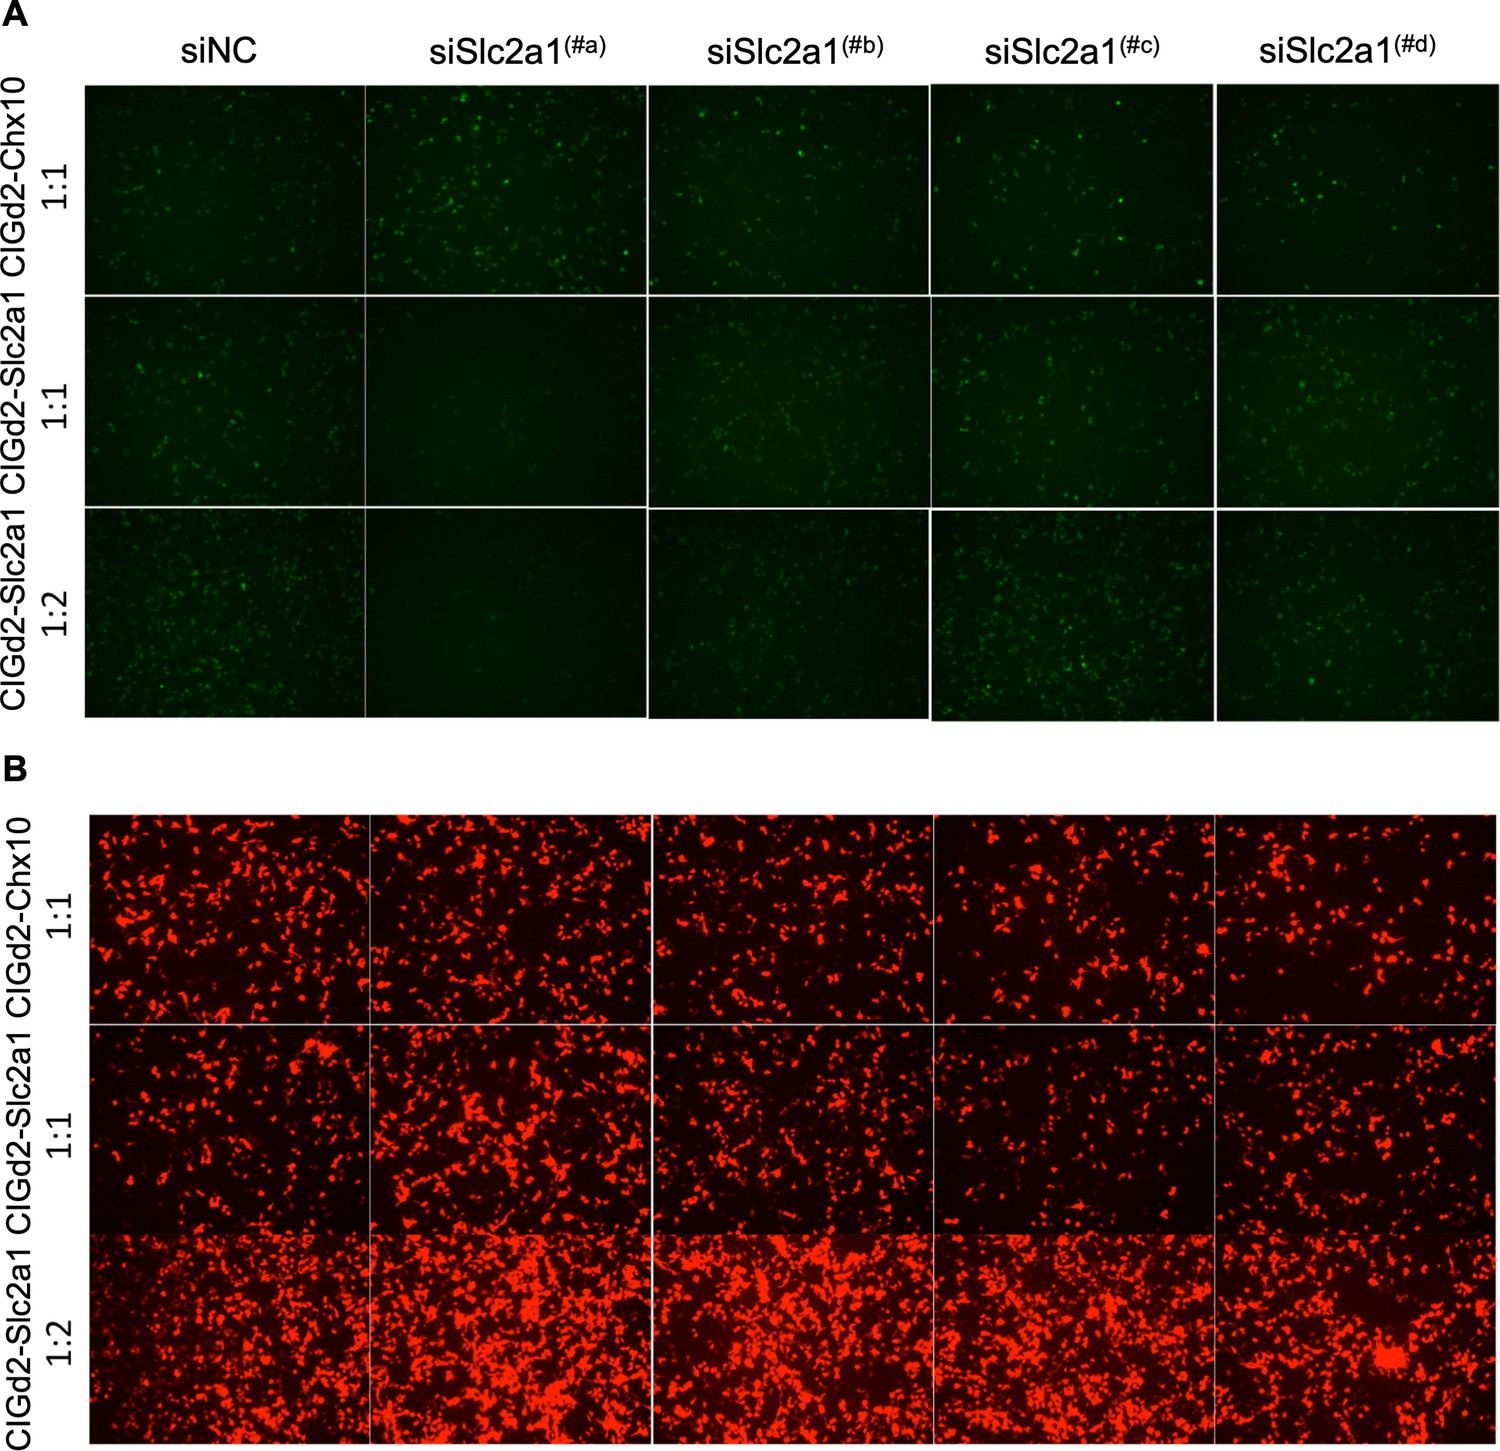
Slc2a1/GLUT1 shRNA in vitro screening.
(A) GFP signals from 293 T cells transfected with CAG-Slc2a1-IRES-GFPd2, which encodes GLUT1, that is, the target sequences for shRNAs (CIGd2-Slc2a1) or CIGd2-Chx10 (negative control for a non-targeted sequence). The indicated shRNA plasmids were added to the CIGd2-Slc2a1 or CIGd2-Chx10 plasmids at the indicated ratios. The siNC is a non-targeting shRNA control. (B) CAG-mCherry plasmid was transfected as a control for transfection in all cases, with mCherry signals shown from the same regions as in panels shown for GFP above. GLUT1: glucose transporter 1.
Figure 3 with 4 supplements
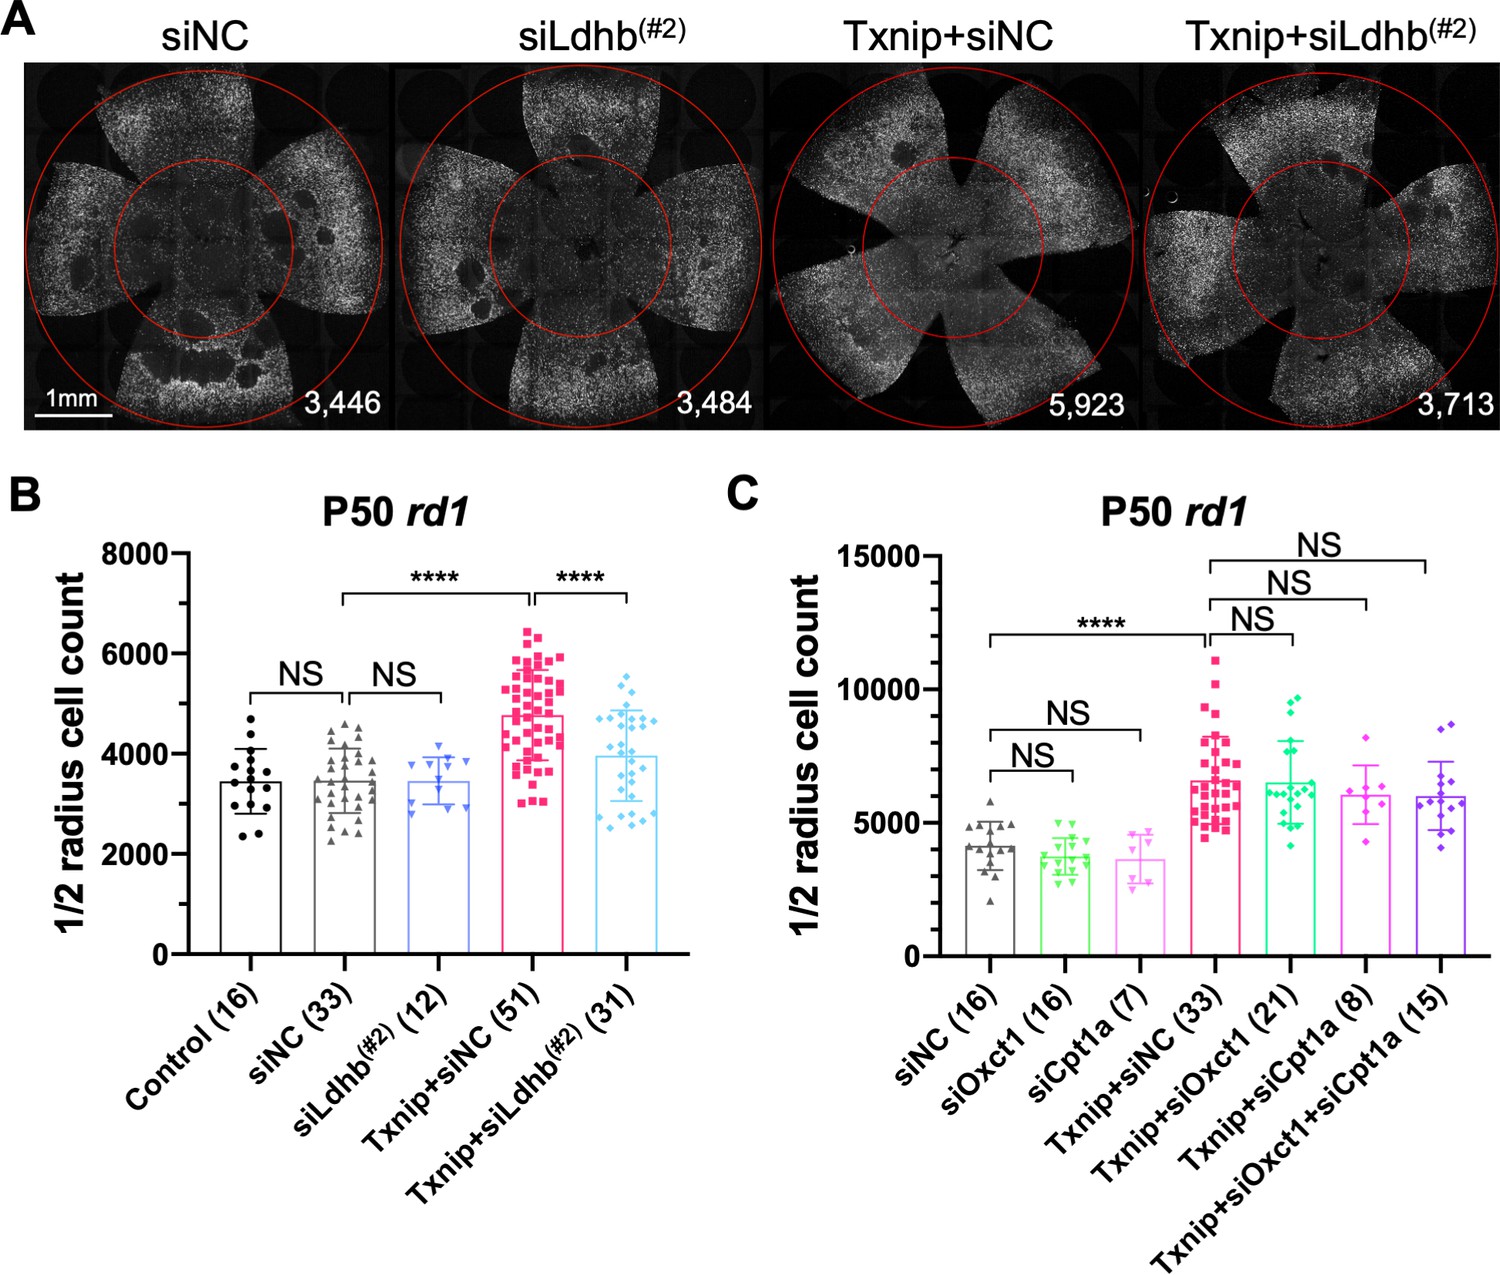
Effect of knockdown of lactate dehydrogenase b (Ldhb) in Txnip-transduced retinitis pigmentosa cones in vivo.
(A) Representative P50 rd1 flat-mounted retinas after P0 infection with control shRNA construct (siNC) or an shRNA construct targeting Ldhb (siLdhb(#2)) in the presence or absence of transduced Txnip (AAV8-RedO-Txnip, ≈1 × 10⁹ vg/eye; AAV8-RedO-shRNA ≈1 × 10⁹ vg/eye), plus AAV8-RedO-H2BGFP (2.5 × 10⁸ vg/eye) (B) Quantification of H2BGFP-positive cones within the ½ radius of P50 rd1 retinas transduced with control, siNC control, Txnip + siLdhb(#2), or Txnip + siNC control (same as in A). (C) Quantification of H2BGFP-positive cones within the ½ radius of P50 rd1 retinas transduced with Txnip + siOxct1(#c), Txnip + siCpt1a(#c), Txnip + siOxct1(#c) + siCpt1a(#c), or siNC control. (All are AAV8-RedO-Txnip, ≈1 × 10⁹ vg/eye; AAV8-RedO-shRNA, ≈1 × 10⁹ vg/eye; plus AAV8-RedO-H2BGFP, 2.5 × 10⁸ vg/eye.) Error bar: standard deviation. NS: not significant, p>0.05, **p<0.01, ***p<0.001, **** p< or <<0.0001. RedO: red opsin promoter; AAV: adeno-associated virus.
Figure 3—figure supplement 1
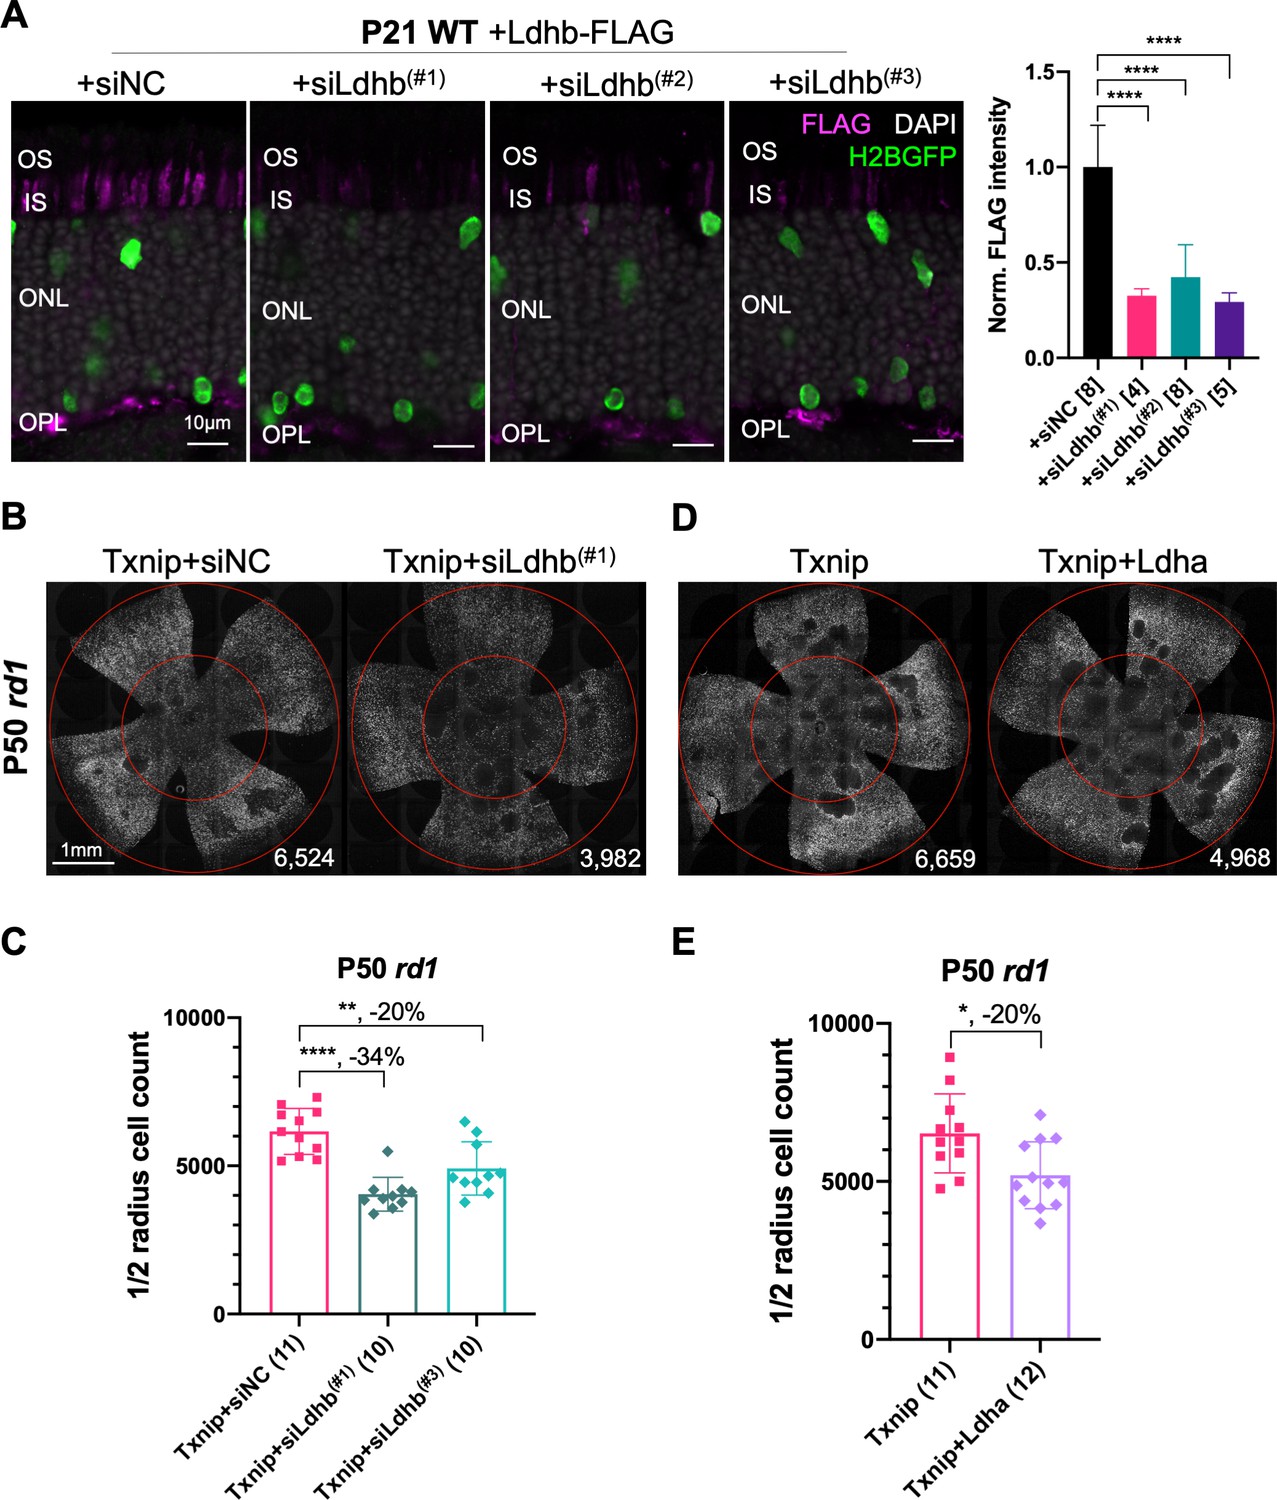
Additional figures for the dependency of Txnip rescue on lactate dehydrogenase b and effect of Ldha.
(A) AAV8-RO1.7-Ldhb-FLAG (1 × 10⁹ vg/eye) co-injected with siNC (non-targeting shRNA control, AAV8-RedO-shRNA, 1 × 10⁹ vg/eye) or co-injected with Ldhb shRNAs (AAV8-RedO-shRNA, 1 × 10⁹ vg/eye) in P21 wildtype (CD1) retina, all also injected with AAV8-RedO-H2BGFP (2.5 × 10⁸ vg/eye) to track the infection. Magenta: anti-FLAG; green: anti-GFP; gray: DAPI. Right panel: the quantification of FLAG intensity from multiple fields of inner segment regions. The number in the square brackets ‘[]’ indicates the sample size, that is, the number of images taken from regions of interest of one retina, in each condition. (B) Representative P50 rd1 flat-mounted retinas injected as in Figure 3A, with Txnip + siNC, Txnip + siLdhb(#1), or Txnip + siLdhb(#3). (C) Quantification of H2BGFP-positive cones within the ½ radius of P50 rd1 retinas transduced with Txnip + siNC, Txnip + siLdhb(#1), or Txnip + siLdhb(#3). (D) Representative P50 rd1 flat-mounted retinas with H2BGFP (gray)-labeled cones transduced with Txnip or Txnip + Ldha (AAV8-RO1.7-Ldha, 1 × 10⁹ vg/eye; AAV8-RedO-Txnip 1 × 10⁹ vg/eye; plus AAV8-RedO-H2BGFP, 2.5 × 10⁸ vg/eye) (E) Quantification of H2BGFP-positive cones within the ½ radius of P50 rd1 retinas transduced with Txnip or Txnip + Ldha. RedO: red opsin; AAV: adeno-associated virus; Ldhb: lactate dehydrogenase b; Ldha: lactate dehydrogenase a.
Figure 3—figure supplement 2
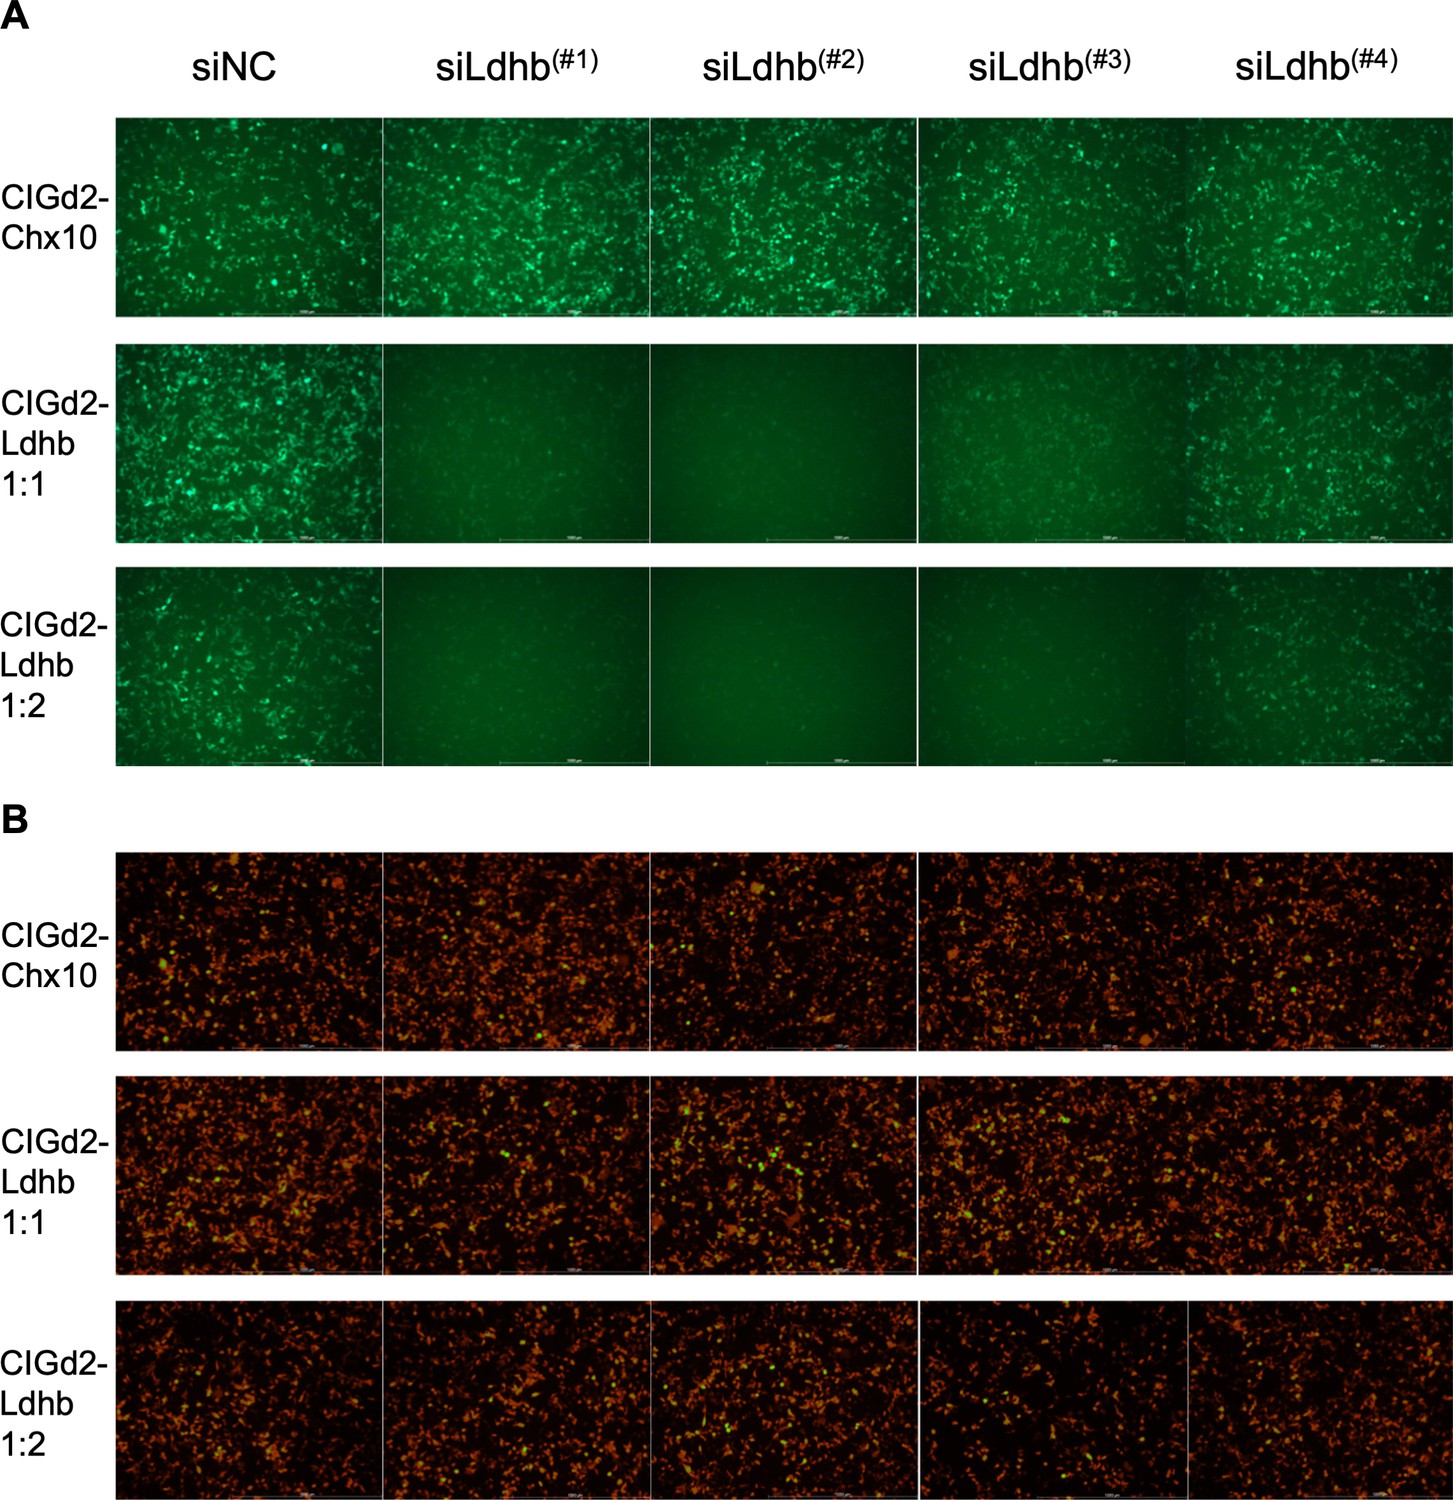
Lactate dehydrogenase b (Ldhb) shRNA in vitro screening.
(A) GFP signals from 293 T cells transfected with CAG-Ldhb-IRES-GFPd2, which encodes Ldhb, that is, the target sequences for shRNAs (CIGd2-Ldhb), or CIGd2-Chx10 (negative control for a non-targeted sequence). The indicated shRNAs were added to the CIGd2-Ldhb or CIGd2-Chx10 plasmids at the indicated ratios. The siNC is a non-targeting shRNA control. (B) CAG-mCherry plasmid was transfected as a control for transfection in all cases, with mCherry signals shown from the same regions as in panels shown for GFP above. The green/yellow color was due to overexposure during image acquisition (i.e., oversaturated mCherry signals).
Figure 3—figure supplement 3
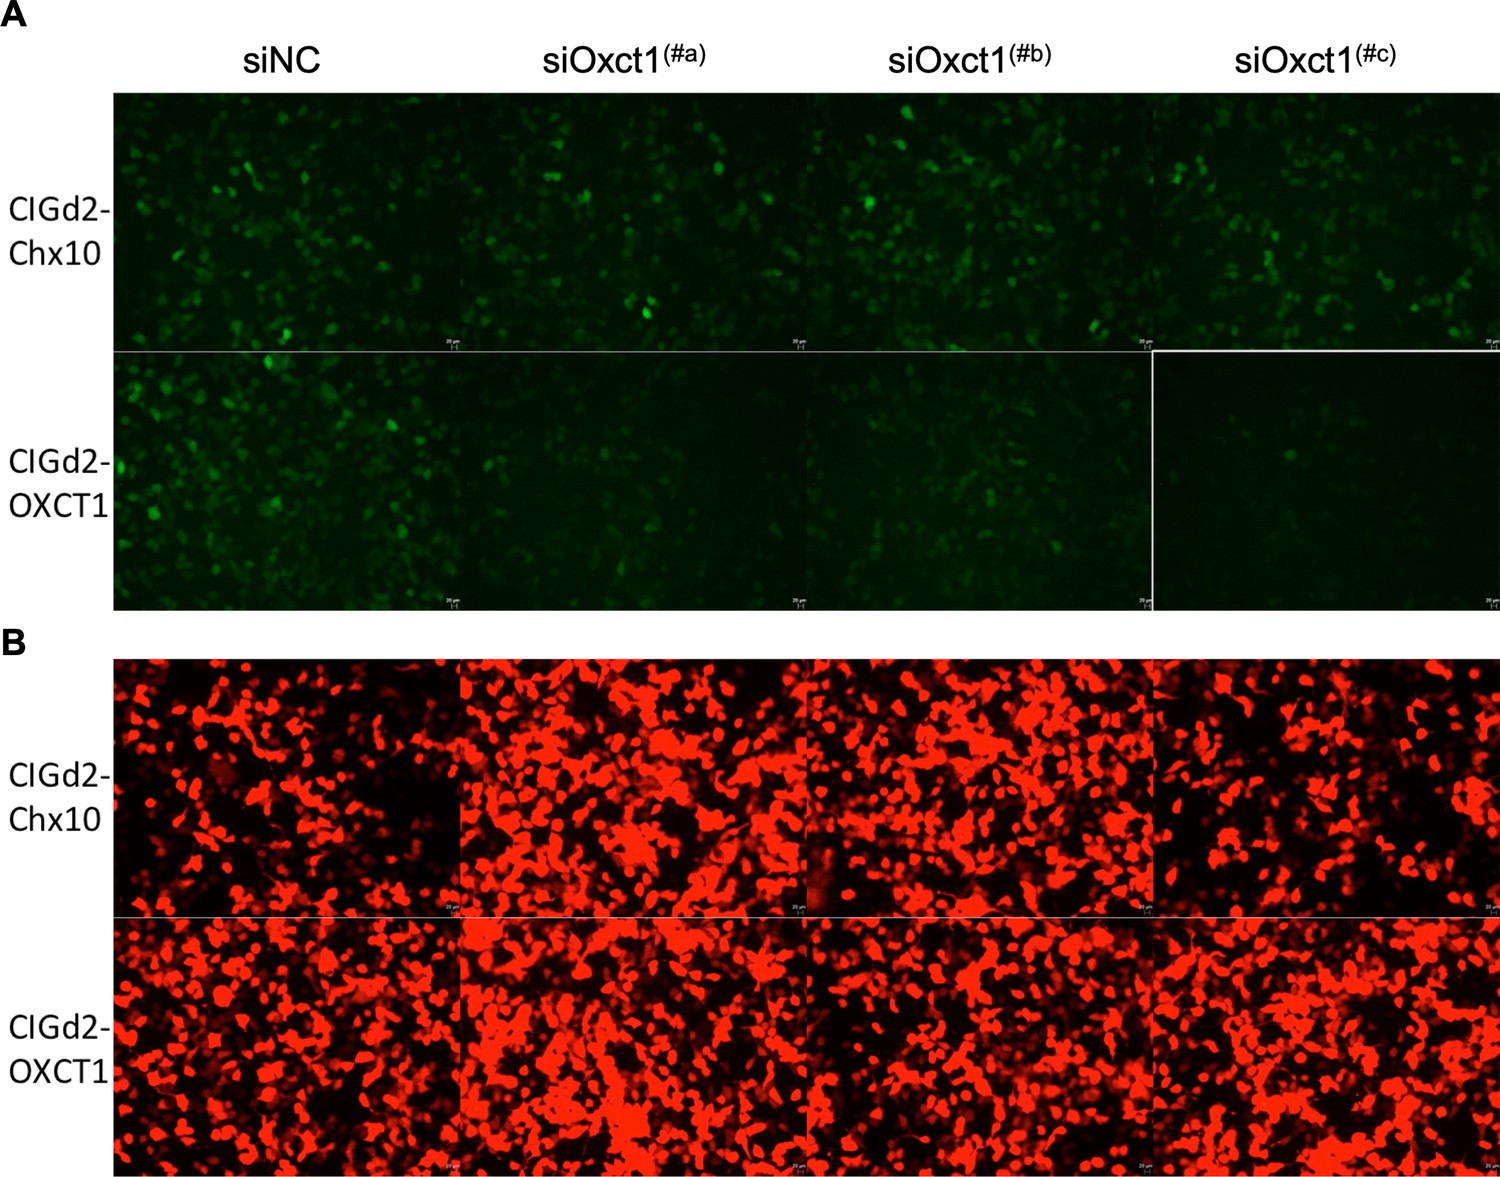
Oxct1 shRNA in vitro screening.
(A) GFP signals from 293 T cells transfected with CAG-Oxct1-IRES-GFPd2, which encodes Oxct1, that is, the target sequences for shRNAs (CIGd2-Oxct1), or CIGd2-Chx10 (negative control for a non-targeted sequence). The indicated shRNAs were added to the CIGd2-Oxct1 or CIGd2-Chx10 plasmids at the indicated ratios. The siNC is a non-targeting shRNA control. (B) CAG-mCherry plasmid was transfected as a control for transfection in all cases, with mCherry signals shown from the same regions as in panels shown for GFP above.
Figure 3—figure supplement 4
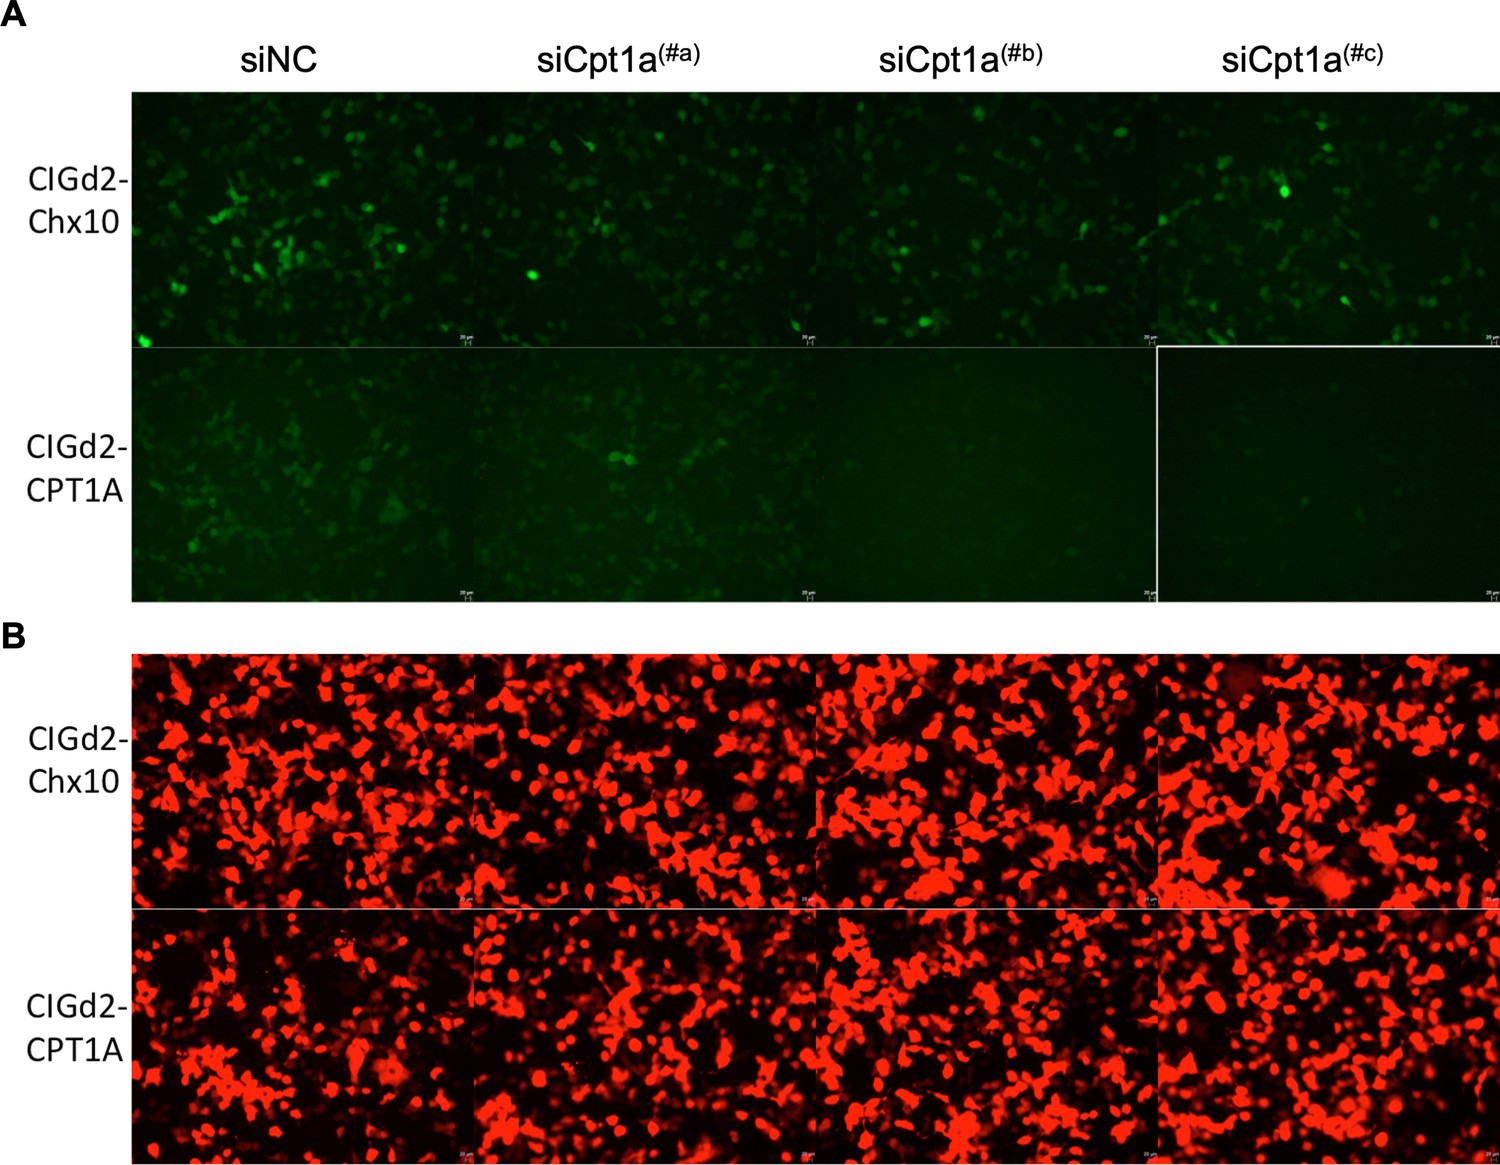
Cpt1a shRNA in vitro screening.
(A) GFP signals from 293 T cells transfected with CAG-Oxct1-IRES-GFPd2, which encodes Cpt1a, that is, the target sequences for shRNAs (CIGd2-Cpt1a), or CIGd2-Chx10 (negative control for a non-targeted sequence). The indicated shRNAs were added to the CIGd2-Cpt1a or CIGd2-Chx10 plasmids at the indicated ratios. The siNC is a non-targeting shRNA control. (B) CAG-mCherry plasmid was transfected as a control for transfection in all cases, with mCherry signals shown from the same regions as in panels shown for GFP above.
Figure 4 with 1 supplement
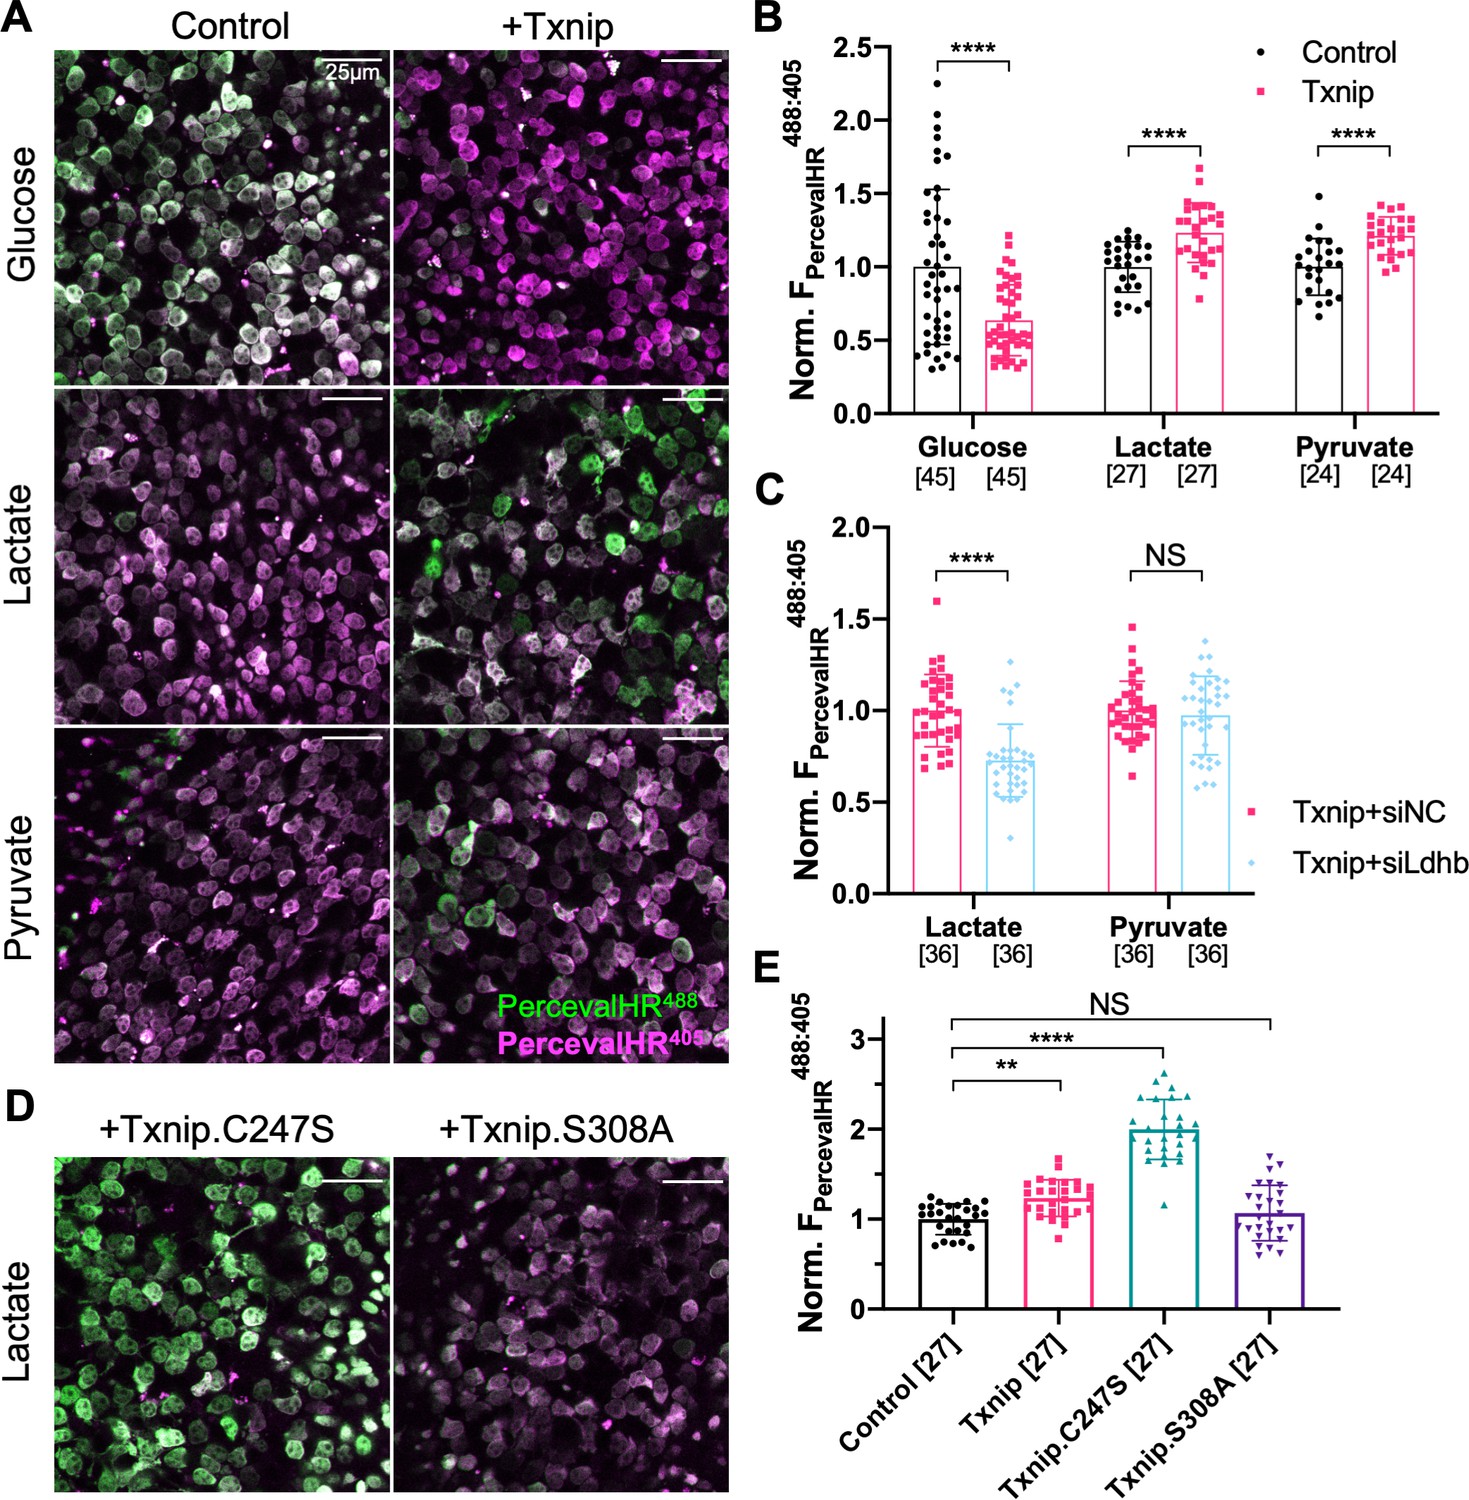
Effect of Txnip on ATP:ADP levels in retinitis pigmentosa (RP) cones in media with different carbon sources.
(A) Representative ex vivo live images of PercevalHR-labeled cones in P20 rd1 retinas cultured with high-glucose, lactate-only, or pyruvate-only medium and transduced with Txnip (AAV8-RedO-Txnip, 1 × 10⁹ vg/eye, plus AAV8-RO1.7-PercevalHR, 1 × 10⁹ vg/eye) (RO1.7 is a shorter version of the red opsin [RedO] promoter with a similar expression pattern) or control (i.e., AAV8-RO1.7-PercevalHR, 1 × 10⁹ vg/eye). Magenta: fluorescence by 405 nm excitation, indicating low-ATP:ADP; green: fluorescence by 488 nm excitation, indicating high-ATP:ADP. (B) Quantification of normalized PercevalHR fluorescence intensity ratio (FPercevalHRex488nm: ex405nm, proportional to ATP:ADP ratio) in cones from P20 rd1 retinas in different conditions. The number in the square brackets ‘[]’ indicates the sample size, that is, the number of images taken from regions of interest of multiple retinas (≈3 images per retina), in each condition. (C) Quantification of normalized PercevalHR fluorescence intensity of retinas infected with Txnip + siLdhb(#2) and Txnip + siNC in cones from P20 rd1 retina in lactate-only or pyruvate-only medium. (AAV8-RedO-Txnip, ≈1 × 10⁹ vg/eye; AAV8-RedO-shRNA ≈1 × 10⁹ vg/eye; plus AAV8-RO1.7-PercevalHR, 1 × 10⁹ vg/eye.) (D) Representative ex vivo live images of PercevalHR-labeled cones in P20 rd1 retinas cultured in lactate-only medium, following transduction with Txnip.C247S (AAV8-RedO-Txnip.C247S, 1 × 10⁹ vg/eye) or Txnip.S308A (AAV8-RedO-Txnip.S308A, 1 × 10⁹ vg/eye). Magenta: fluorescence by 405 nm excitation, indicating low-ATP:ADP; green: fluorescence by 488 nm excitation, indicating high-ATP:ADP. (E) Quantification of normalized PercevalHR fluorescence intensity following transduction by Txnip, Txnip alleles, and control cones in P20 rd1 retinas cultured in lactate-only medium. Error bar: standard deviation. NS: not significant, p>0.05, **p<0.01, ***p<0.001, **** p< or <<0.0001. AAV: adeno-associated virus.
Figure 4—figure supplement 1
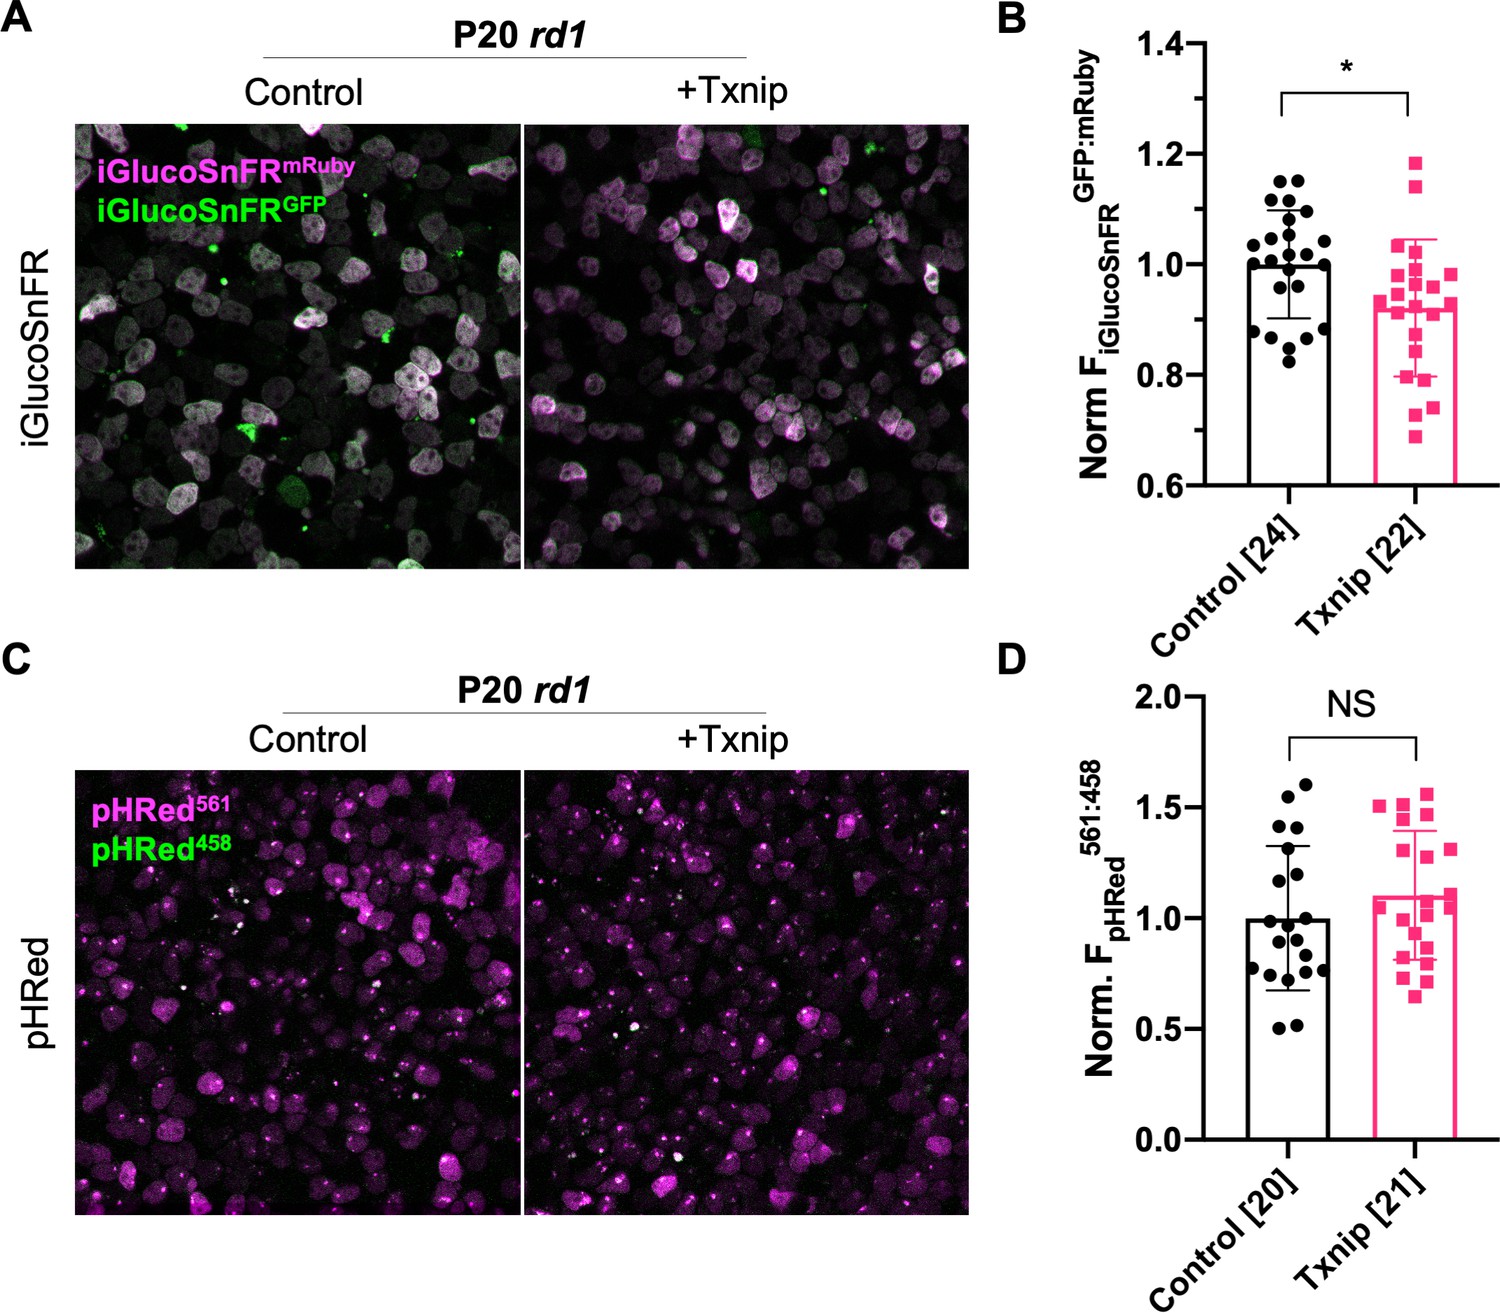
Effect of Txnip on pH and glucose levels in retinitis pigmentosa (RP) cones.
(A) Representative ex vivo live images of iGlucoSnFR-labeled cones in P20 rd1 retinas cultured with high-glucose medium, retinas transduced with AAV8-RedO-Txnip (1 × 10⁹ vg/eye, plus AAV8-SynPVI-iGlucoSnFR, 1 × 10⁹ vg/eye) or control (AAV8-SynPVI-iGlucoSnFR, 1 × 10⁹ vg/eye). Green: glucose sensing GFP of iGlucoSnFR; magenta: mRuby of iGlucoSnFR for normalization. (B) Quantification of normalized iGlucoSnFR fluorescence intensity (FiGlucoSnFRGFP: mRuby, proportional to glucose level) in cones from P20 rd1 retinas transduced with Txnip or control (≈3 images per retina). The number in the square brackets ‘[]’ indicates the sample size, that is, the number of images taken from regions of interest of multiple retinas (≈3images per retina), in each condition. (C) Ex vivo live images of pHRed-labeled cones in P20 rd1 retinas cultured with high-glucose medium transduced by Txnip (AAV8-RedO-Txnip, 1 × 10⁹ vg/eye) or control (AAV8-SynP136-pHRed, 1 × 10⁹ vg/eye). Magenta: fluorescence by 561 nm excitation, indicating a lower pH; green: fluorescence by 458 nm excitation, indicating a higher pH. (D) Quantification of normalized pHRed fluorescence intensity (FpHRedx561nm: 458nm, inversely proportional to pH value) in cones from P20 rd1 retinas transduced with Txnip or control (≈3 images per retina). The number in the square brackets ‘[]’ indicates the sample size, that is, the number of images taken from regions of interest of multiple retinas (≈3 images per retina), in each condition. RedO: red opsin promoter; AAV: adeno-associated virus.
Figure 5 with 2 supplements
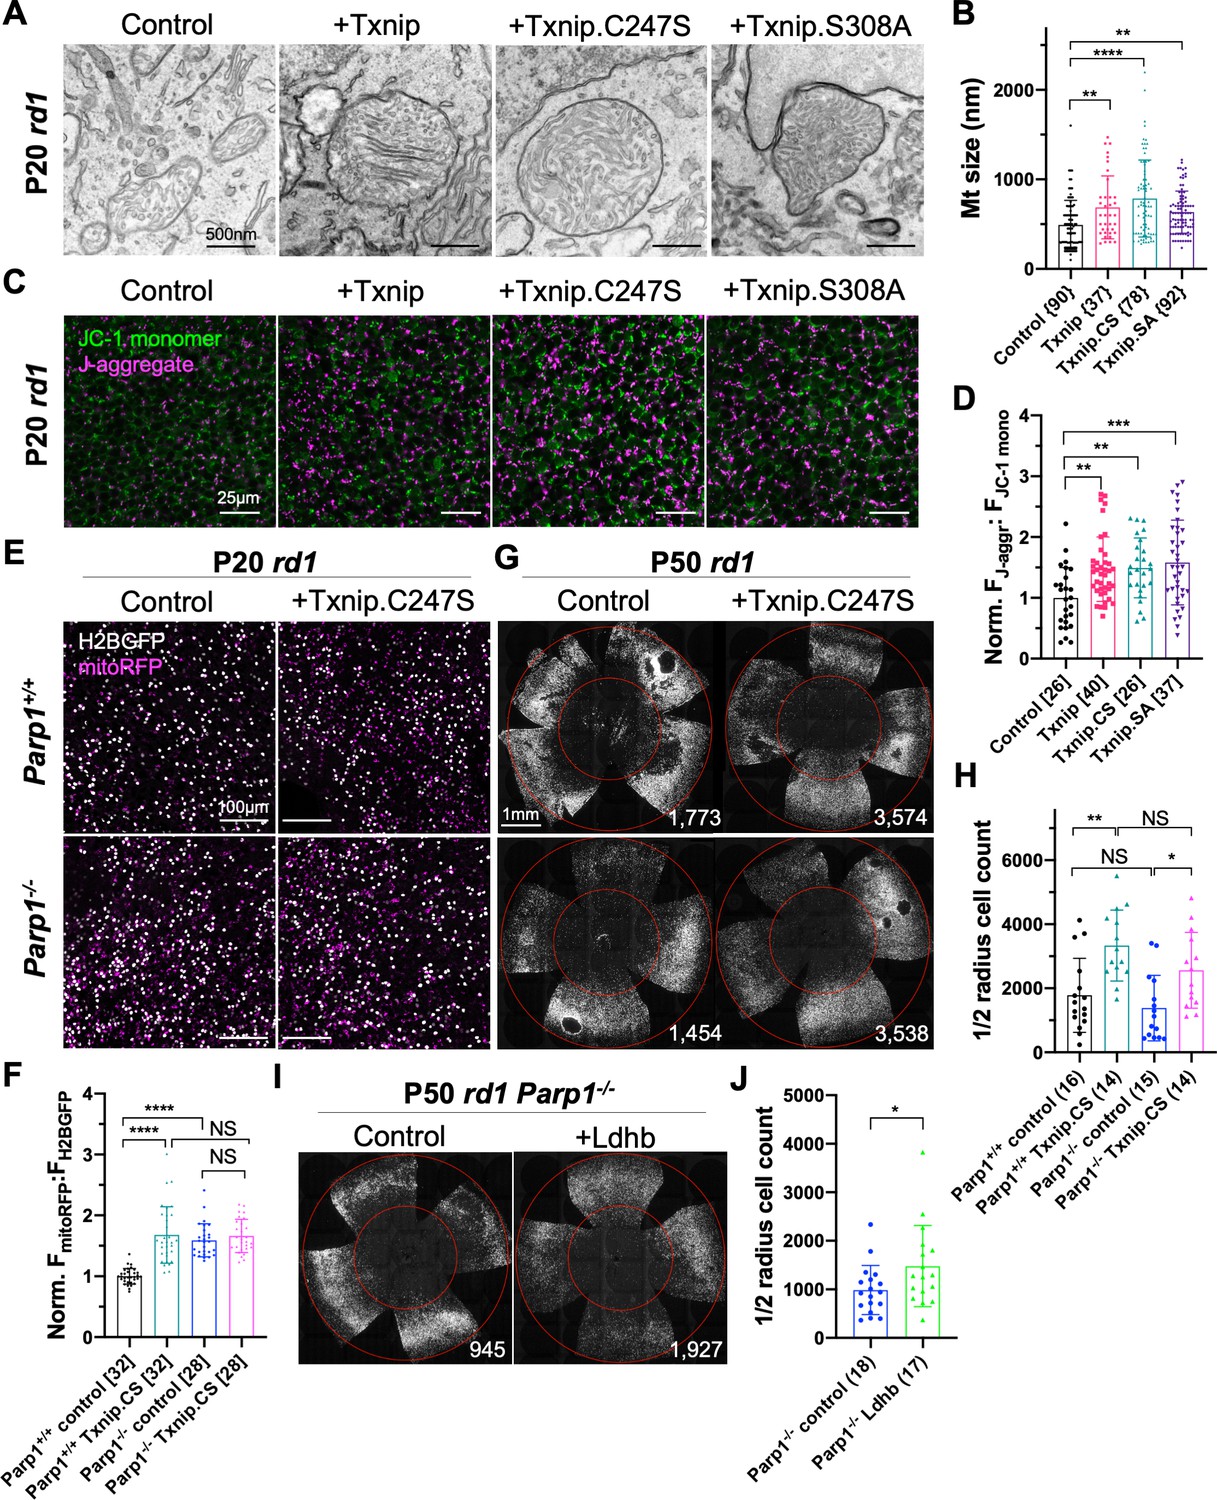
Effects of Txnip on retinitis pigmentosa (RP) cone mitochondrial size and function.
(A) Representative transmission electron microscopy (TEM) images of RP cones from P20 rd1 cones transduced with wildtype Txnip, Txnip.C247S, or Txnip.S308A (all are AAV8-RedO-Txnip, ≈1 × 10⁹ vg/eye plus AAV8-RedO-H2BGFP, 2.5 × 10⁸ vg/eye), and control (AAV8-RedO-H2BGFP, 2.5 × 10⁸ vg/eye). (B) Quantification of mitochondrial diameters from control, Txnip, Txnip.C247S, and Txnip.S308A-transduced cones (same as in A). The number in the curly brackets ‘{}’ indicates the sample size, that is, the number of mitochondria from multiple cones of ≥ 1 retina for each condition (five retinas for control, four for Txnip, two for Txnip.C247S, and one for Txnip.S308A). (C) Images of JC-1 dye staining (indicator of electron transport chain [ETC] function) in live cones of P20 rd1 central retina under different conditions (same as in A). Magenta: J-aggregate, indicating high ETC function; green: JC-1 monomer, low ETC function, used for normalization. H2BGFP channel, the tracer of AAV infected area, is not shown. (D) Quantification of normalized cone JC-1 dye staining (fluorescence intensity of J-aggregate:JC-1 monomer) from live cones in P20 rd1 retinas (same as in A) in different conditions (3–4 images per retina). The number in the square brackets ‘[]’ indicates the sample size, that is, the number of images taken from regions of interest of multiple retinas, in each condition. (E) Images of mitoRFP staining (reflecting mitochondrial function) in Txnip.C247S (AAV8-RedO-Txnip.C247S, 1 × 10⁹ vg/eye, plus AAV8-RedO-H2BGFP, 2.5 × 10⁸ vg/eye and AAV8-SynP136-mitoRFP, 1 × 10⁹ vg/eye) and control (AAV8-RedO-H2BGFP, 2.5 × 10⁸ vg/eye plus AAV8-SynP136-mitoRFP, 1 × 10⁹ vg/eye) cones from fixed P20 Parp1+/+ rd1 and Parp1-/- rd1 retinas near the optic nerve head. Magenta: mitoRFP; gray: H2BGFP, for mitoRFP normalization. (F) Quantification of normalized mito-RFP:H2BGFP intensity in different conditions (same as in E) of P20 Parp1 rd1 retinas (four images per retina, near optic nerve head). (G) Images of P50 Parp1+/+ rd1 and Parp1-/- rd1 retinas with H2BGFP (gray)-labeled cones transduced with Txnip.C247S (AAV8-RedO-Txnip, ≈1 × 10⁹ vg/eye plus AAV8-RedO-H2BGFP, 2.5 × 10⁸ vg/eye) and control (AAV8-RedO-H2BGFP, 2.5 × 10⁸ vg/eye). (H) Quantification of H2BGFP-positive cones within the ½ radius of P50 Parp1+/+ rd1 and Parp1-/- rd1 retinas transduced with Txnip.C247S or control (same as in G). (I) Images of P50 Parp1-/- rd1 retinas with H2BGFP (gray)-labeled cones transduced with Ldhb (AAV8-RedO-Ldhb, 1 × 10⁹ vg/eye, plus AAV8-RedO-H2BGFP, 2.5 × 10⁸ vg/eye) or H2BGFP only (AAV8-RedO-H2BGFP, 2.5 × 10⁸ vg/eye). (J) Quantification of H2BGFP-positive cones within the ½ radius of P50 Parp1-/- rd1 retinas transduced with Ldhb or H2BGFP only (same as in I). Error bar: standard deviation. NS: not significant, p>0.05, *p<0.05, **p<0.01, ***p<0.001, **** p< or <<0.0001. Txnip.CS: Txnip.C247S; Txnip.SA: Txnip.S308A. RedO: red opsin promoter; AAV: adeno-associated virus; Ldhb: lactate dehydrogenase b.
-
Figure 5—source data 1
Differentially expressed genes in cones infected by AAV8-RedO-Txnip (1 × 10⁹ vg/eye plus AAV8-SynP136-H2BGFP, 1 × 10⁹ vg/eye) vs. control (AAV8-SynP136-H2BGFP, 1 × 10⁹ vg/eye) in common between two retinitis pigmentosa strains (rd1 and Rho-/-). RedO: red opsin promoter; AAV: adeno-associated virus.
- https://cdn.elifesciences.org/articles/66240/elife-66240-fig5-data1-v2.docx
-
Figure 5—source data 2
Differentially expressed gene(s) in cones infected by AAV8-RedO-Txnip (1 × 10⁹ vg/eye plus AAV8-SynP136-H2BGFP, 1 × 10⁹ vg/eye) vs. control (AAV8-SynP136-H2BGFP, 1 × 10⁹ vg/eye) in common between two wildtype strains (BALB/c and C57BL6/J). RedO: red opsin promoter; AAV: adeno-associated virus.
- https://cdn.elifesciences.org/articles/66240/elife-66240-fig5-data2-v2.docx
-
Figure 5—source data 3
Cone Txnip mRNA raw reads in the RNA-seq data (from 1000 FACS cones per retina).
Data presented as mean ± SEM (n = sample size, i.e., number of retinas per condition).
- https://cdn.elifesciences.org/articles/66240/elife-66240-fig5-data3-v2.docx
-
Figure 5—source data 4
Cone mRNA raw reads from RNA-seq of all 35 retinas used in the study.
Data presented as mean ± SEM (n = 35 for all). No significant difference in these genes with or without Txnip in each strain.
- https://cdn.elifesciences.org/articles/66240/elife-66240-fig5-data4-v2.docx
Figure 5—figure supplement 1
Additional figures for RNAseq results of Txnip and effects of Txnip on retinitis pigmentosa (RP) cone mitochondria.
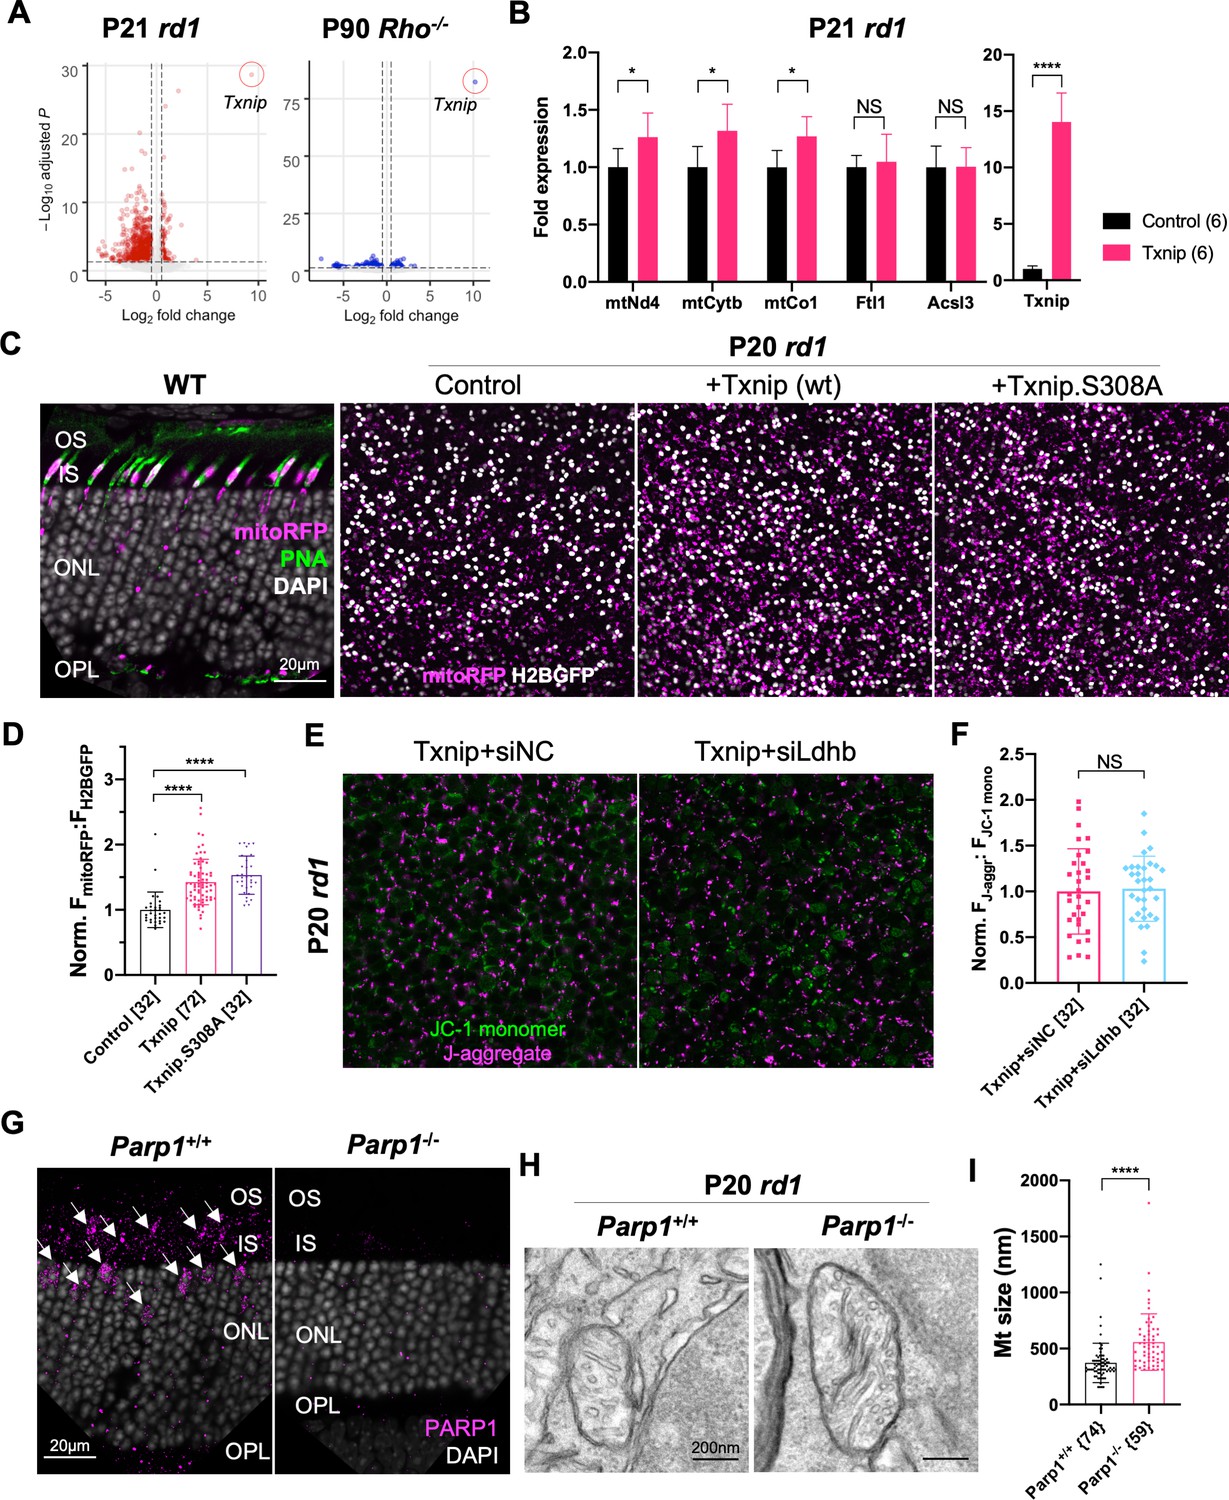
(A) Volcano plots of differentially expressed genes in retinitis pigmentosa (RP) cones FACS sorted from P21 rd1 retinas (left panel; +Txnip, n = 3, relative to control, n = 6) and P90 rho-/- retinas (right panel; +Txnip, n = 4, relative to control, n = 4). Dotted lines indicate adjusted p<0.05 and log2 fold change >0.5. Infection was done at P0 by Txnip (AAV8-RedO-Txnip, 1 × 10⁹ vg/eye, plus AAV8-SynP136-H2BGFP, 1 × 10⁹ vg/eye) or control (AAV8-SynP136-H2BGFP, 1 × 10⁹ vg/eye). (B) ddPCR fold changes of commonly (i.e., rd1 and Rho-/-) upregulated mitochondrial electron transport chain (ETC) genes and other genes (i.e., Acsl3 and Ftl1) by Txnip overexpression in FACS sorted P21 rd1 cones. The number in the round brackets ‘()’ indicates the sample size, that is, the number of retinas within each group. (C) MitoRFP signals in infected retinas. First panel: AAV8-SynP136-mitoRFP (1 × 10⁹ vg/eye) expression in P26 wildtype (BALB/c) retina cross section. Magenta: mitoRFP; green: PNA; gray: DAPI. Other three panels: representative mitoRFP images from rd1 retinas infected with the control (AAV8-RedO-H2BGFP, 2.5 × 10⁸ vg/eye, plus AAV8-SynP136-mitoRFP, 1 × 10⁹ vg/eye), Txnip (AAV8-RedO-Txnip, 1 × 10⁹ vg/eye plus AAV8-RedO-H2BGFP, 2.5 × 10⁸ vg/eye, and AAV8-SynP136-mitoRFP, 1 × 10⁹ vg/eye), or Txnip.S308A (AAV8-RedO-Txnip.S308A, 1 × 10⁹ vg/eye plus AAV8-RedO-H2BGFP, 2.5 × 10⁸ vg/eye, and AAV8-SynP136-mitoRFP, 1 × 10⁹ vg/eye) fixed at P20. rd1 retina flat-mounts near the optic nerve head, reflecting the mitochondrial function. Magenta: mitoRFP; gray: H2BGFP, for infection normalization. (D) Quantification of normalized mito-RFP:H2BGFP intensity of P20 rd1 retinas transduced with control, Txnip, or Txnip.S308A, as in C. The number in the square brackets ‘[]’ indicates the sample size, that is, the number of images taken from regions of interest of multiple retinas (four images per retina), in each condition. (E) Representative JC-1 dye staining image from live cones in P20 rd1 retina transduced with Txnip + siNC or + siLdhb(#2) (as in Figure 3A). Magenta: J-aggregate, indicating high ETC function; green: JC-1 monomer, for normalization. H2BGFP channel, the tracer of adeno-associated virus (AAV)-infected area, is not shown. (F) Quantification of normalized cone JC-1 dye staining (fluorescence intensity of J-aggregate:JC-1 monomer) from live cones in P20 rd1 retinas transduced with Txnip + siNC or siLdhb(#2) (as in Figure 3B). The number in the square brackets ‘[]’ indicates the sample size, that is, the number of images taken from regions of interest of multiple retinas (four images per retina), in each condition. (G) PARP1 antibody staining of Parp1+/+ (C57BL/6J) or Parp1-/- (on 129S background) retina. Magenta: Parp1; gray: DAPI; arrowheads: Parp1 staining from inner segments and cone nuclei. (H) Representative mitochondria transmission electron microscopy images from P20 Parp1+/+ or Parp1-/- rd1 cones. (I) Quantification of diameters of mitochondrial cross sections from P20 Parp1+/+ or Parp1-/- rd1 cones from one retina per condition. The number in the curly brackets ‘{}’ indicates the sample size, that is, the number of mitochondria from multiple cones from one retina for each condition. RedO: red opsin promoter.
Figure 5—figure supplement 2
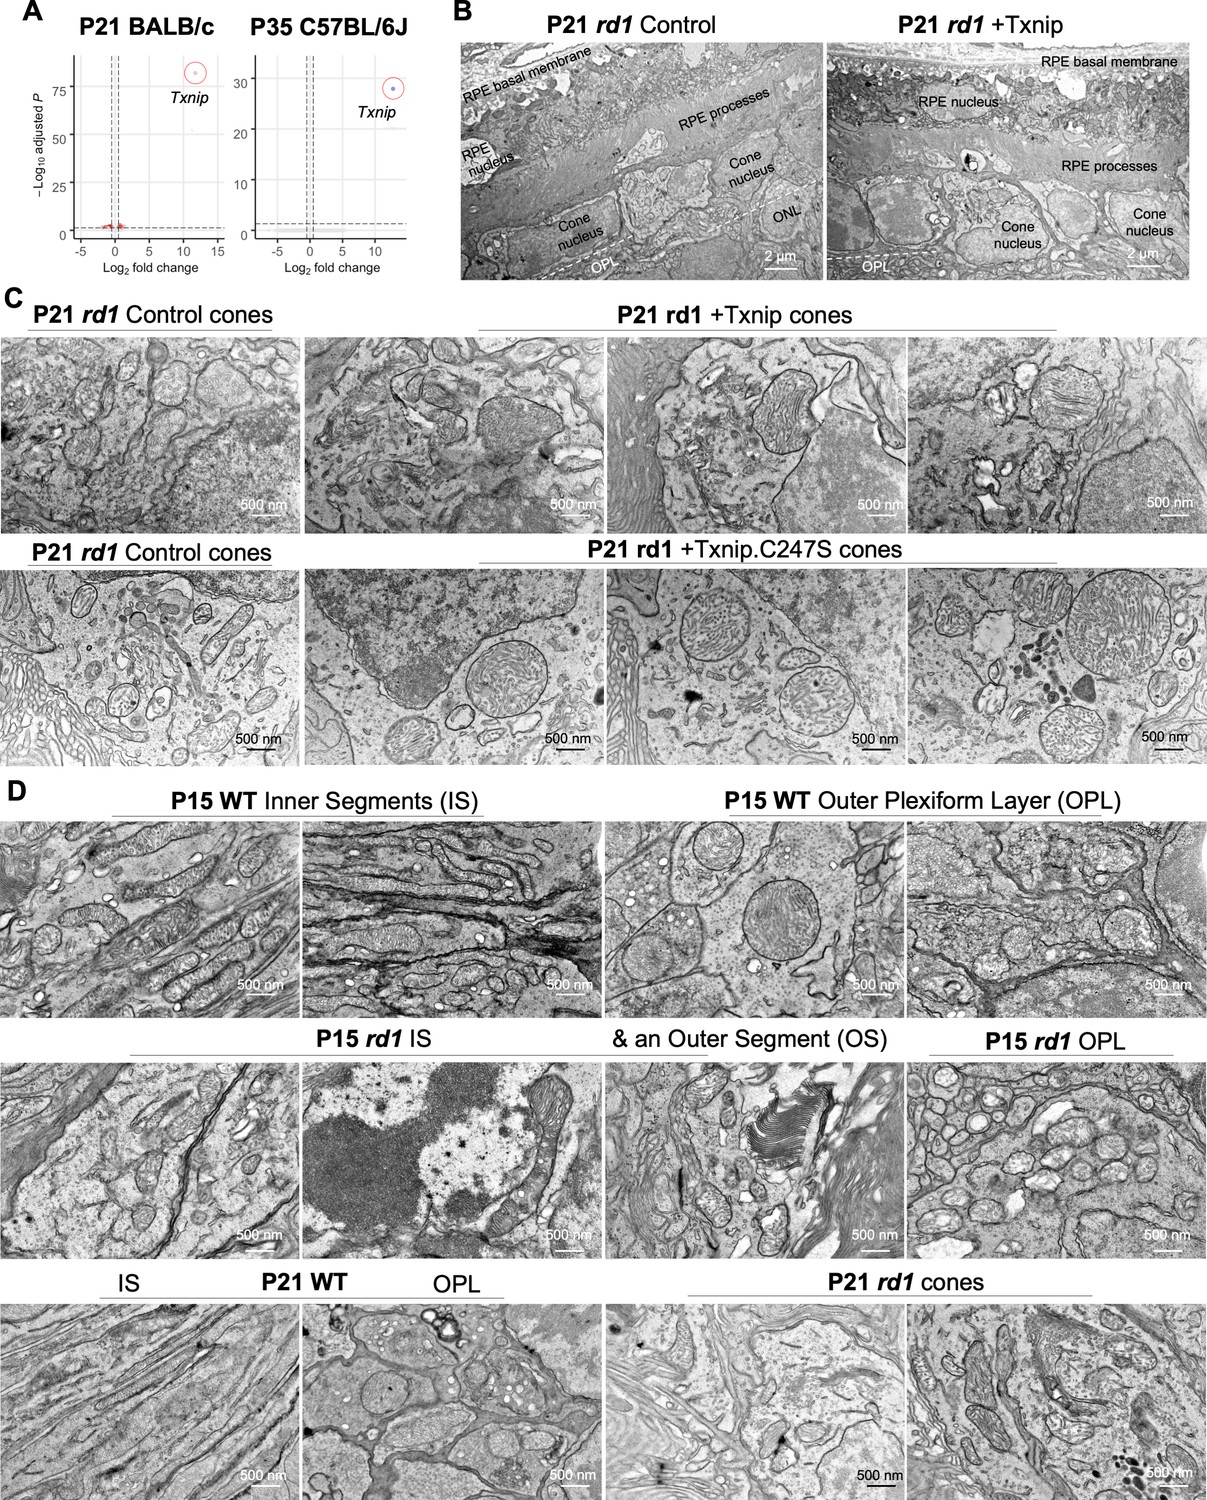
Additional figures for effects of Txnip on retinitis pigmentosa (RP) cone mitochondria.
(A) Volcano plots of differentially expressed genes in wildtype (WT) cones FACS sorted from P21 BALB/c retinas (left panel; +Txnip, n = 6, relative to control, n = 6) and P35 C57BL/6J retinas (right panel; +Txnip, n = 3, relative to control, n = 3). Dotted lines indicate adjusted p<0.05 and log2 fold change >0.5. Infection was done at P0 by Txnip (AAV8-RedO-Txnip, 1 × 10⁹ vg/eye, plus AAV8-SynP136-H2BGFP, 1 × 10⁹ vg/eye) or control (AAV8-SynP136-H2BGFP, 1 × 10⁹ vg/eye). (B) Representative low-magnification transmission electron microscopy (TEM) images of retinal pigmented epithelium and cones from P21 rd1 retinas transduced with Txnip (AAV8-RedO-Txnip, 1 × 10⁹ vg/eye, plus AAV8-RedO-H2BGFP, 2.5 × 10⁸ vg/eye) and control (AAV8-RedO-H2BGFP, 2.5 × 10⁸ vg/eye). (C) Additional representative high-magnification TEM images of cones from P21 rd1 retinas transduced with Txnip, Txnip.C247S, and control. (D) Representative high-magnification TEM images with a focus on photoreceptor mitochondria from P15 and P21 WT (BALB/c) and rd1 retinas with no adeno-associated virus (AAV) injection.
Figure 6
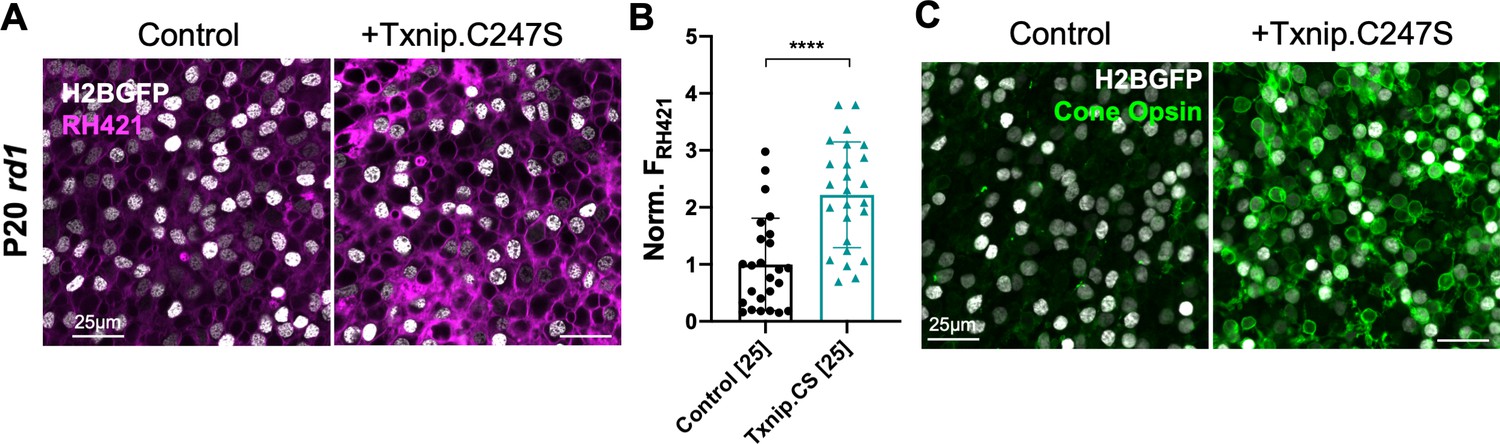
Effect of Txnip on Na+/K+ ATPase pump function and cone opsin expression in retinitis pigmentosa cones.
(A) Images of live ex vivo RH421 stained cones in P20 rd1 retinas transduced with Txnip.C247S (AAV8-RedO-Txnip C247S, ≈1 × 10⁹ vg/eye plus AAV8-RedO-H2BGFP, 2.5 × 10⁸ vg/eye) and control (AAV8-RedO-H2BGFP, 2.5 × 10⁸ vg/eye) and cultured in lactate-only medium. Magenta: RH421 fluorescence, proportional to Na+/K+ ATPase function; gray: H2BGFP, tracer of infection. (B) Quantification of normalized RH421 fluorescence intensity from Txnip.C247S-transduced cones relative to control in P20 rd1 retinas cultured in lactate-only medium (same as in A, five images per retina). The number in the square brackets ‘[]’ indicates the sample size, that is, the number of images taken from regions of interest of multiple retinas, in each condition. Txnip.CS: Txnip.C247S. (C) Immunohistochemistry with anti-s-opsin plus anti-m-opsin antibodies in the center of P50 rd1 retinas transduced with Txnip.C247S or control. Green: cone-opsins; gray: H2BGFP, tracer of infection. Error bar: standard deviation. **** p< or <<0.0001. RedO: red opsin promoter; AAV: adeno-associated virus.
Figure 7 with 1 supplement

Effect of dominant negative HIF1α and Best1-Txnip.C247S.LL351 and 352AA on retinitis pigmentosa cone survival.
(A) Images of P50 rd1 retinas with H2BGFP (gray)-labeled cones transduced with dnHIF1α (AAV8-RO1.7-dnHIF1α, 1 × 10⁹ vg/eye), Hif1a (AAV8-SynPVI-Hif1a, SynPVI is an alternative cone-specific promoter, 1 × 10⁹ vg/eye), Best1-Txnip.C247S.LL351 and 352AA (Txnip.CS.LLAA, driven by a retinal pigmented epithelium-specific promoter; AAV8, 5 × 10⁸ vg/eye; all including AAV8-RedO-H2BGFP, 2.5 × 10⁸ vg/eye), or control (AAV8-RedO-H2BGFP, 2.5 × 10⁸ vg/eye). (B) Quantification of H2BGFP-positive cones within the ½ radius of P50 rd1 retinas transduced with dnHIF1α, Hif1a, Best1-Txnip.C247S.LL351, and 352AA or control (same as in A). B-Tx.CS.LLAA: Best1-Txnip.C247S.LL351 and 352AA. Error bar: standard deviation. *p<0.05, **p<0.01, ***p<0.001.RedO: red opsin promoter; AAV: adeno-associated virus.
Figure 7—figure supplement 1
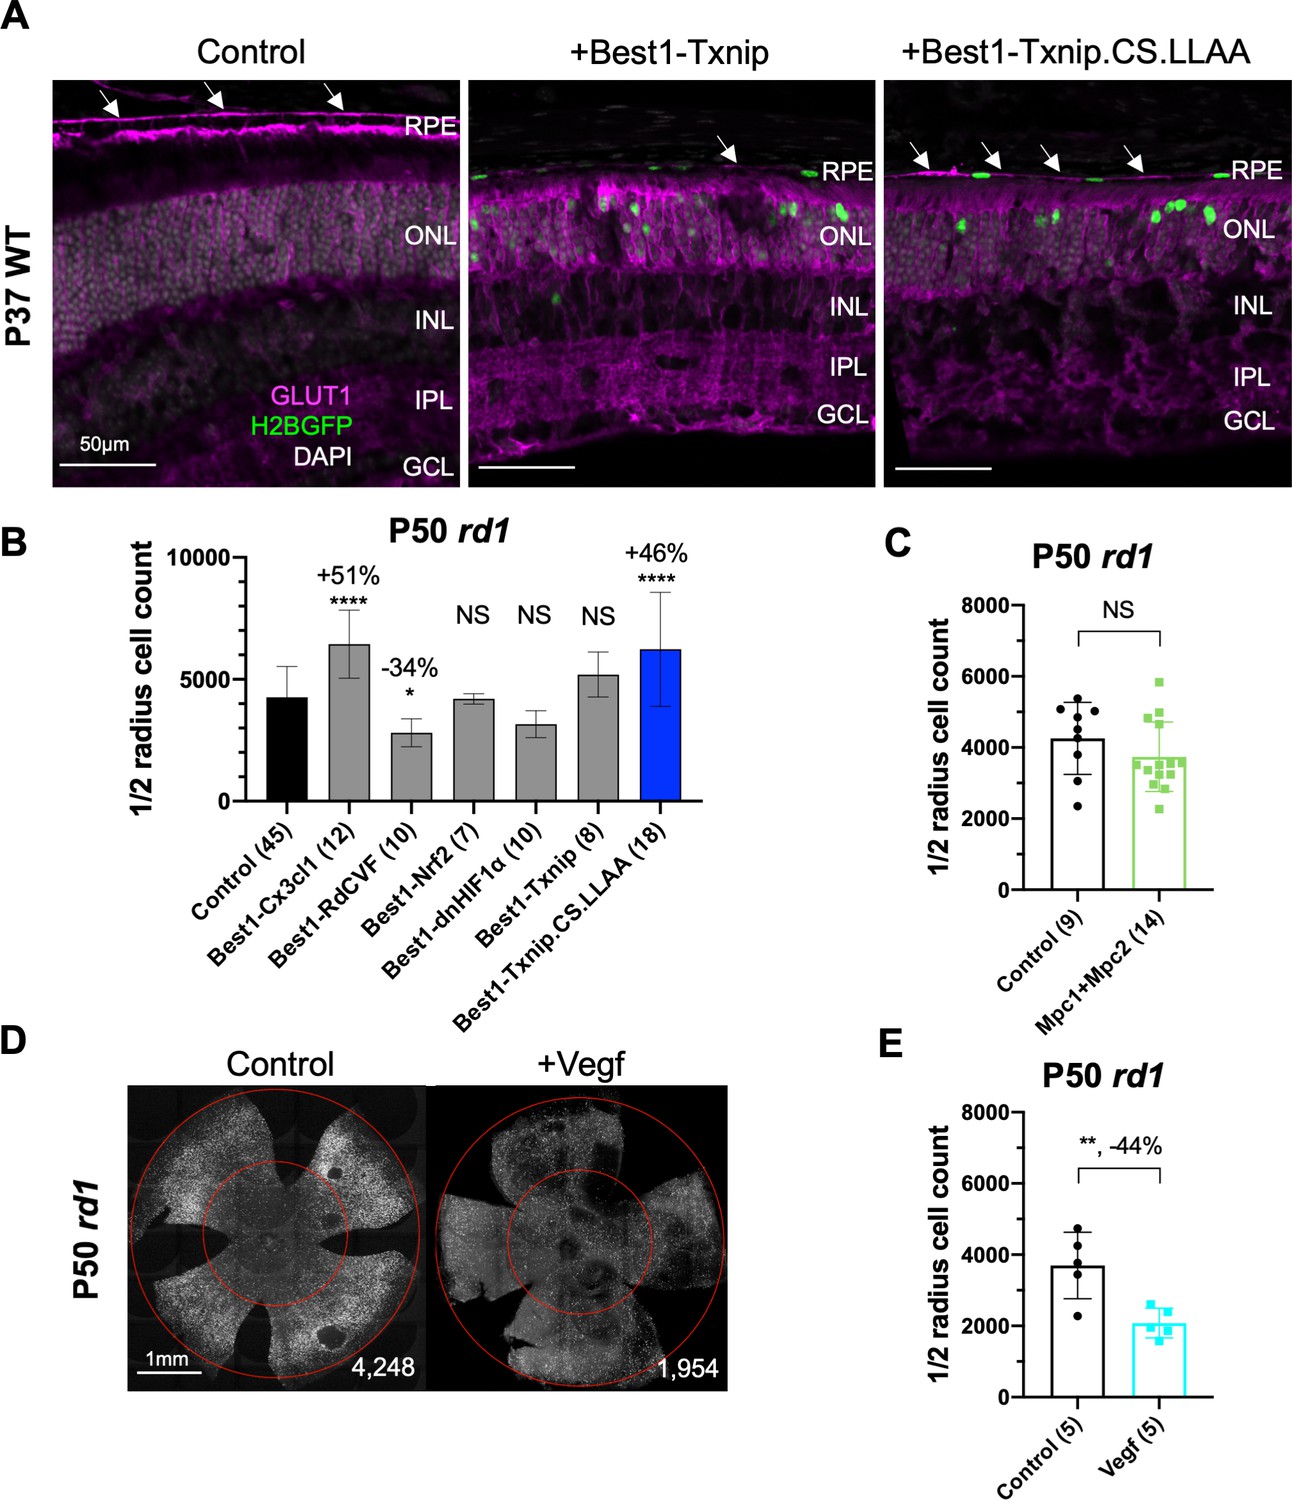
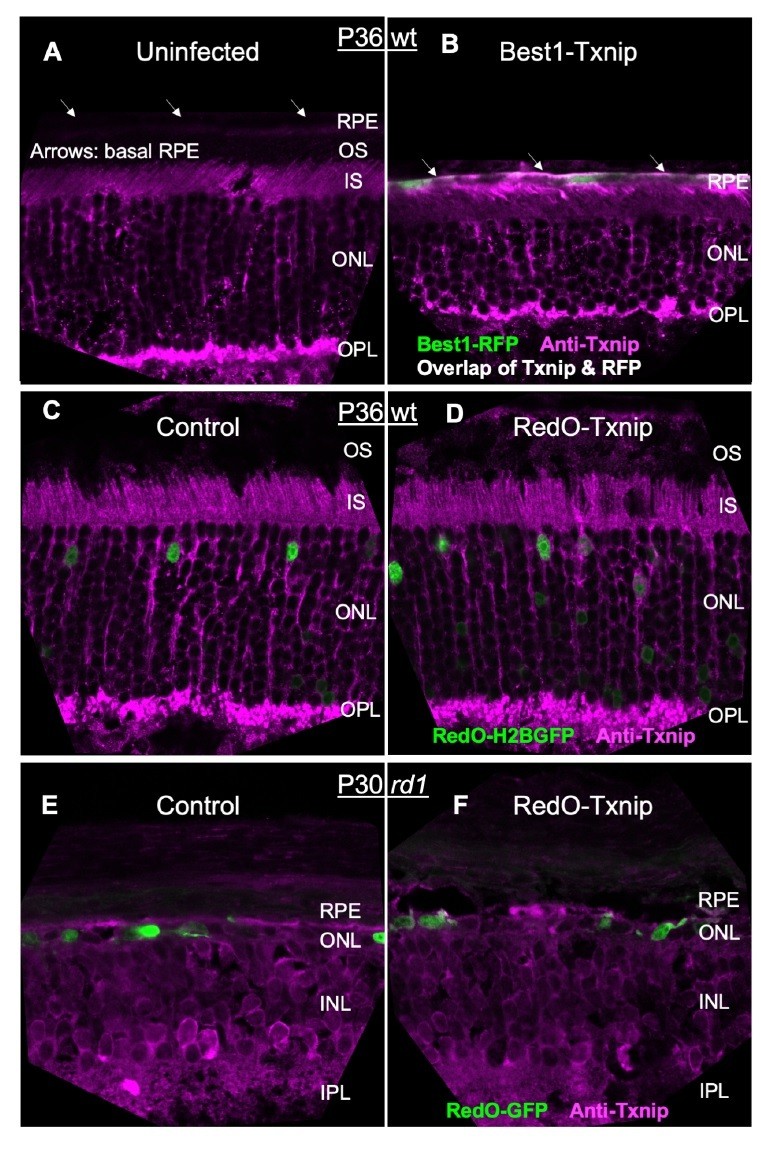
Additional figures for various vectors effect on retinitis pigmentosa (RP) cone survival.
(A) Glucose transporter 1 (GLUT1) expression in P37 wildtype (C57BL/6J) eyes transduced with control (AAV8-RedO-H2BGFP, 2.5 × 10⁸ vg/eye), AAV8-Best1-Txnip (5 × 10⁸ vg/eye, plus AAV8-RedO-H2BGFP, 2.5 × 10⁸ vg/eye), or AAV8-Best1-Txnip.C247S.LL351 and 352AA (5 × 10⁸ vg/eye, plus AAV8-RedO-H2BGFP, 2.5 × 10⁸ vg/eye). Arrows: GLUT1 in the basal membrane of the retinal pigmented epithelium. Magenta: GLUT1; green: RedO-H2BGFP for infection tracing; gray: DAPI. (B) Quantification of H2BGFP-positive cones within the ½ radius of P50 rd1 retinas transduced with six different Best1-vectors (all AAV8-Best1, 2.5–5 × 10⁸ vg/eye plus AAV8-RedO-H2BGFP, 2.5 × 10⁸ vg/eye) or control (AAV8-RedO-H2BGFP, 2.5 × 10⁸ vg/eye). (Note: we did not use dark-reared rd10 for testing the RdCVF vector, and our adeno-associated virus (AAV) capsid and promoter were different from the original study of Byrne et al., 2015.) Best1-Cx3cl1 was included as a positive control (Wang et al., 2019). (C) Quantification of H2BGFP-positive cones within the ½ radius of P50 rd1 retinas transduced with AAV8-RO1.7-Mpc1 + AAV8-RO1.7-Mpc2 (1 × 10⁹ vg/eye each plus AAV8-RedO-H2BGFP, 2.5 × 10⁸ vg/eye) or control (AAV8-RedO-H2BGFP, 2.5 × 10⁸ vg/eye). (D) Representative P50 rd1 flat-mounted retinas with H2BGFP (gray)-labeled cones transduced with Vegf164 (AAV8-RO1.7, 1 × 10⁹ vg/eye plus AAV8-RedO-H2BGFP, 2.5 × 10⁸ vg/eye) and control (AAV8-RedO-H2BGFP, 2.5 × 10⁸ vg/eye). (E) Quantification of H2BGFP-positive cones within the ½ radius of P50 rd1 retinas transduced with Vegf164 or control. RedO: red opsin promoter. Txnip.CS.LLAA: Txnip.C247S.LL351 and 352AA.
Figure 8 with 1 supplement
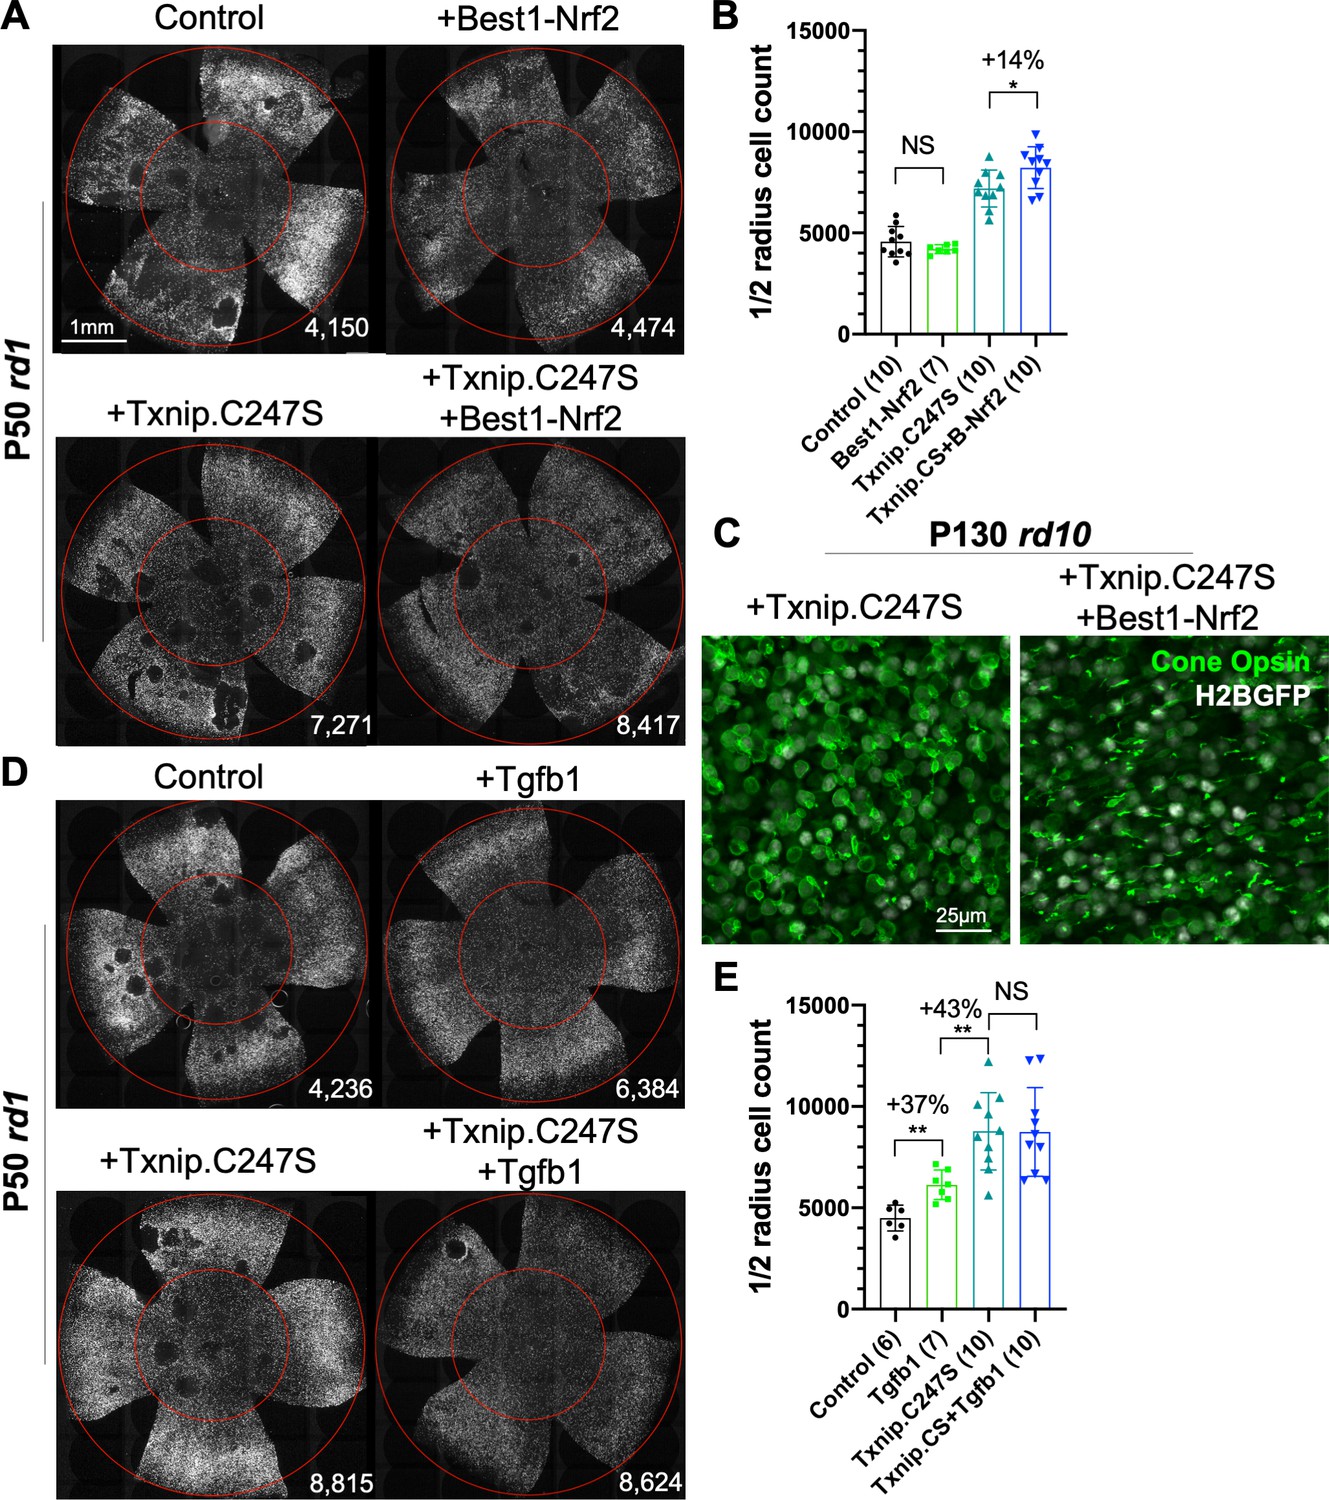
Effect of combinations of Txnip.C247S with Best1-Nrf2 or Tgfb1 on retinitis pigmentosa cone survival.
(A) Images of P50 rd1 retinas with H2BGFP (gray)-labeled cones transduced with Nrf2 (AAV8-Best1-Nrf2, 2.5 × 10⁸ vg/eye), Txnip.C247S (AAV8-RedO-Txnip.C247S, 1 × 10⁹ vg/eye), Txnip.C247S (AAV8-RedO-Txnip.C247S, 1 × 10⁹ vg/eye) + Best1-Nrf2 (AAV8-Best1-Nrf2, 2.5 × 10⁸ vg/eye), or control (AAV8-RedO-H2BGFP, 2.5 × 10⁸ vg/eye). All experimental vector injections included AAV8-RedO-H2BGFP, 2.5 × 10⁸ vg/eye. (B) Quantification of H2BGFP-positive cones within the ½ radius of P50 rd1 retinas transduced with Best1-Nrf2, Txnip.C247S, Txnip.C247S + Best1-Nrf2, or control. Txnip.CS: Txnip.C247S. B-Nrf2: Best1-Nrf2. (C) Immunohistochemistry with anti-S-opsin plus anti-M-opsin antibodies in the center of P130 rd10 retinas transduced with Txnip.C247S (left panel) or Txnip.C247S + Best1-Nrf2 (right panel). Green: cone-opsins; gray: H2BGFP, tracer of infection. (D) Images of P50 rd1 retinas with H2BGFP (gray)-labeled cones transduced with Tgfb1 (AAV8-RedO, 1 × 10⁹ vg/eye), Txnip.C247S (AAV8-RedO-Txnip.C247S, 1 × 10⁹ vg/eye), Txnip.C247S (AAV8-RedO-Txnip.C247S, 1 × 10⁹ vg/eye) + Tgfb1 (AAV8-RedO-Tgfb1, 1 × 10⁹ vg/eye), or control (AAV8-RedO-H2BGFP, 2.5 × 10⁸ vg/eye). All experimental vector injections included AAV8-RedO-H2BGFP, 2.5 × 10⁸ vg/eye. (E) Quantification of H2BGFP-labeled cones within the ½ radius of P50 rd1 retinas transduced with control, Tgfb1, Txnip.C247S, or Txnip.C247S + Tgfb1. Error bar: standard deviation. NS: not significant, p>0.05, *p<0.05, **p<0.01. RedO: red opsin promoter; AAV: adeno-associated virus.
Figure 8—figure supplement 1
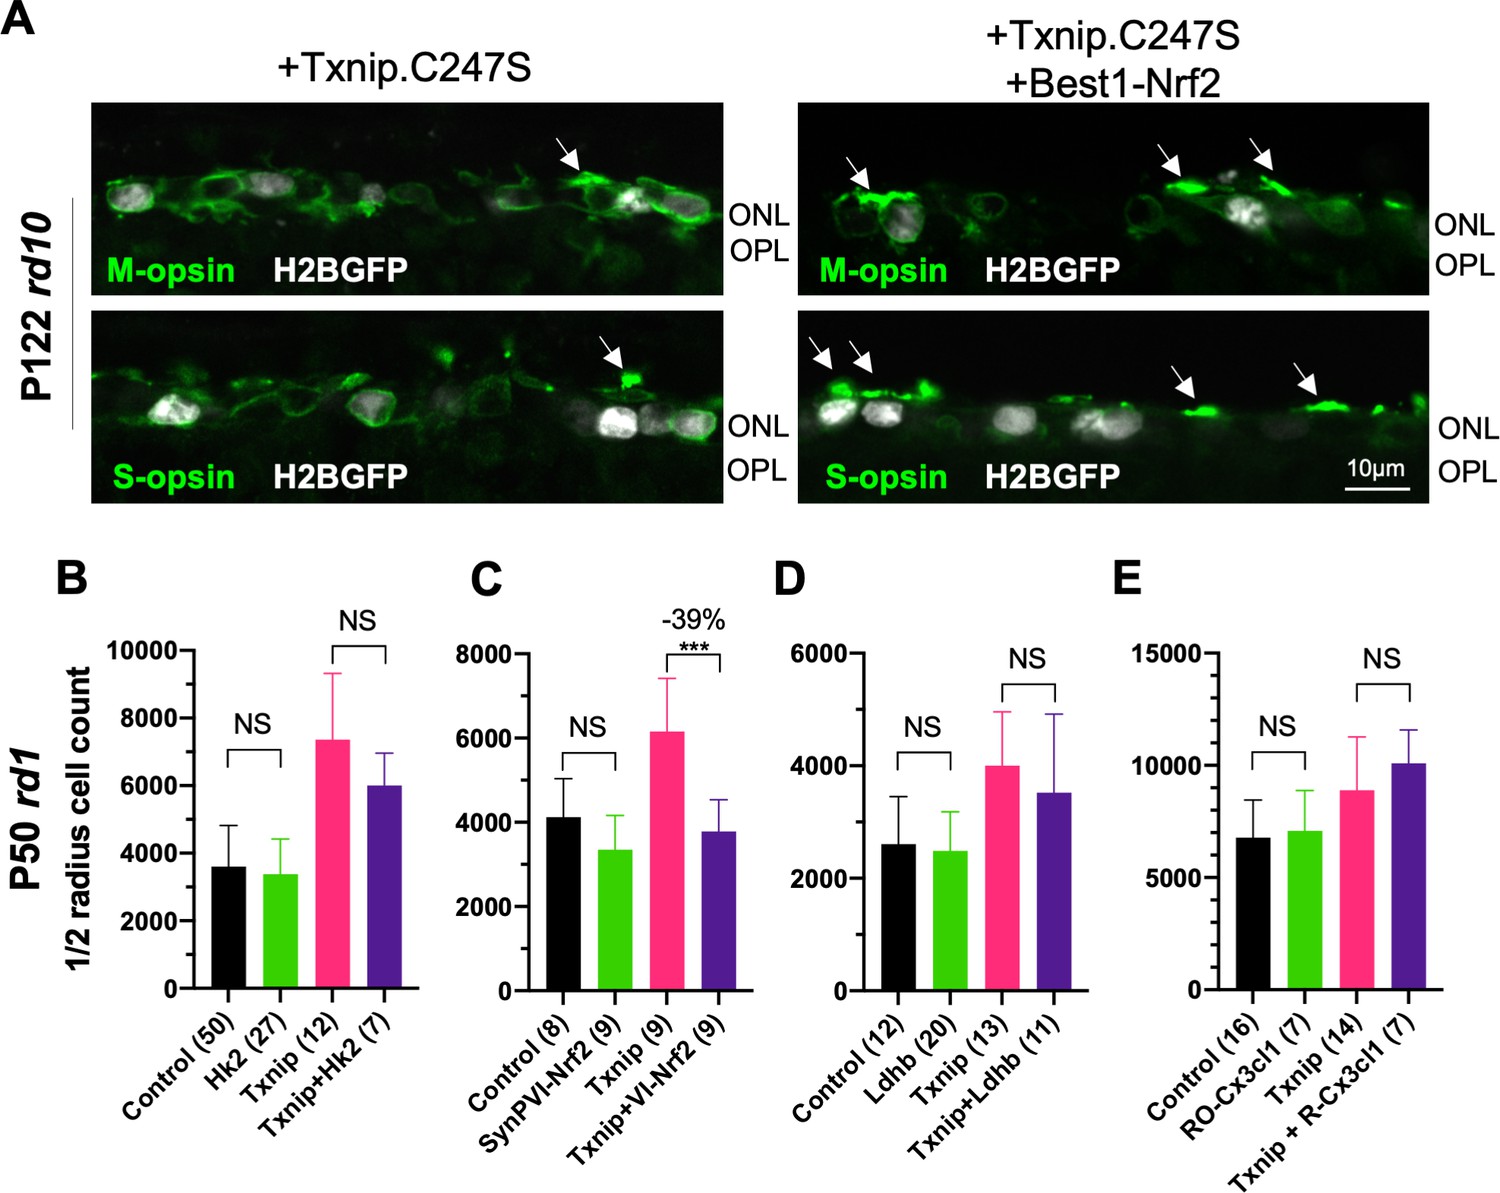
Effect of combinations of Txnip with various vectors on retinitis pigmentosa (RP) cone survival.
(A) Immunohistochemistry with anti-S-opsin or anti-M-opsin antibodies of P122 rd10 retina sections transduced with AAV8-RedO-Txnip.C247S (left panel; 1 × 10⁹ vg/eye, plus AAV8-RedO-H2BGFP, 2.5 × 10⁸ vg/eye) or Txnip.C247S + Best1-Nrf2 (right panel; AAV8-RedO-Txnip.C247S, 1 × 10⁹ vg/eye plus AAV8-Best1-Nrf2, 2.5 × 10⁸ vg/eye and AAV8-RedO-H2BGFP, 2.5 × 10⁸ vg/eye). Arrows: cone outer segment-like structure (green: S- or M-opsin; gray: H2BGFP, tracer of infection). (B–E) Quantification of H2BGFP-positive cones within the ½ radius of P50 rd1 retinas transduced with control (AAV8-RedO-H2BGFP, 2.5 × 10⁸ vg/eye), (B) SynPVI-Hk2, (C) SynPVI-Nrf2, (D) RedO-Ldhb, and (E) RedO-Cx3cl1, RedO-Txnip, and combinations with RedO-Txnip (all AAV8, ≈1 × 10⁹ vg/eye for each vector). VI: SynPVI; RO- or R-: RedO-; RedO: red opsin promoter; AAV: adeno-associated virus.
Figure 9

Model for the mechanism of Txnip-mediated cone rescue.
The data suggest that at least two pathways are required for Txnip rescue – Pathway I: enhancement of lactate catabolism, which requires the function of LDHB; and pathway II: improved mitochondrial health, possibly through mitochondrial Parp1 inhibition. An additional pathway, pathway III: inhibiting glycolysis by removing glucose transporter 1 (GLUT1) from cell surface, may partially contribute to rescue by working with improved lactate metabolism and improved mitochondrial health, and/or unidentified pathways. This diagram was created from a BioRender Template. MCT: monocarboxylate transporter; 3PG: 3 phosphoglyceric acid; TCA: tricarboxylic acid cycle.
Author response image 1
Author response image 2

Tables
Key resources table
| Reagent type (species) or resource | Designation | Source or reference | Identifiers | Additional information |
|---|---|---|---|---|
| Genetic reagent (Mus musculus) | Pde6brd1 | Charles River; Taconic | Stock #: 207; FVB/NTac. MGI: 1856373 | |
| Genetic reagent (M. musculus) | Pde6brd10 | Jackson Laboratory | Stock #: 004297 MGI:2388259 | |
| Genetic reagent (M. musculus) | Rho-/- | Janis Lem (Tufts University) | MGI:2680822 | PMID:9892703 |
| Genetic reagent (M. musculus) | Parp1-/- | Jackson Laboratory | Stock #: 002779. MGI:1857862 | |
| Antibody | Rabbit anti-GLUT1 | Alpha Diagnostics | GT11-A | IHC (1:300) |
| Antibody | Rabbit anti-PARP1 | Abcam | ab227244 | IHC (1:300) |
| Antibody | Chicken anti-GFP | Abcam | ab13970 | IHC (1:1000) |
| Antibody | Goat anti-FLAG | Abcam | ab1257 | IHC (1:2000) |
| Antibody | Rabbit anti-ARR3 | Millipore Sigma | AB15282 | IHC (1:1000) |
| Antibody | Rabbit anti-OPN1MW | Millipore Sigma | AB5405 | IHC (1:600) |
| Antibody | Rabbit anti-OPN1SW | Millipore Sigma | AB5407 | IHC (1:200) |
| Genetic reagent (M. musculus) | Txnip cDNA | GeneCopoeia | Cat. #: Mm07552 NCBI: NM_001009935.2 | |
| Genetic reagent (M. musculus) | Hif1a cDNA | GeneCopoeia | Cat. #: Mm30422 NCBI: NM_010431.2 | |
| Genetic reagent (M. musculus) | Hk2 cDNA | GeneCopoeia | Cat. #: Mm03044 NCBI: NM_013820.3 | |
| Genetic reagent (M. musculus) | Ldha cDNA | GeneCopoeia | Cat. #: Mm28710 NCBI: NM_001136069.2 | |
| Genetic reagent (M. musculus) | Ldhb cDNA | GeneCopoeia | Cat. #: Mm03608 NCBI: NM_008492.2 | |
| Genetic reagent (M. musculus) | Slc2a1 cDNA | GeneCopoeia | Cat. #: Mm21137 NCBI: NM_011400.3 | |
| Genetic reagent (M. musculus) | Bsg1 cDNA | GeneCopoeia | Cat. #: Mm01471 NCBI: NM_009768.2 | |
| Genetic reagent (M. musculus) | Cpt1a cDNA | GeneCopoeia | Cat. #: Mm20470 NCBI: NM_013495.2 | |
| Genetic reagent (M. musculus) | Oxct1 cDNA | GeneCopoeia | Cat. #: Mm08941 NCBI: NM_024188.6 | |
| Genetic reagent (M. musculus) | Mpc1 cDNA | GeneCopoeia | Cat. #: Mm41054 NCBI: NM_001364919.1 | |
| Genetic reagent (M. musculus) | Mpc2 cDNA | GeneCopoeia | Cat. #: Mm19410 NCBI: BC018324.1 | |
| Genetic reagent (Homo sapiens) | Nrf2 cDNA | GeneCopoeia | Cat. #: T3128 NCBI: NM_006164.4 | |
| Genetic reagent (H. sapiens) | Hk1 | William Hahn and David Root (via Addgene) | Cat. #: 23730 | PMID:21107320 |
| Genetic reagent (H. sapiens) | Pfkm | William Hahn and David Root (via Addgene) | Cat. #: 23728 | PMID:21107320 |
| Genetic reagent (H. sapiens) | Pkm2 | William Hahn and David Root (via Addgene) | Cat. #: 23757 | PMID:21107320 |
| Genetic reagent (H. sapiens) | Pkm1 | Lewis Cantley and Matthew Vander Heiden (via Addgene) | Cat. #: 44241 | PMID:18337815 |
| Recombinant DNA reagent | DsRed2-mito | Addgene (Michael Davidson) | 55838 | |
| Recombinant DNA reagent | GFP-Txnip | Addgene (Clark Distelhorst) | 18758 | PMID:16301999 |
| Recombinant DNA reagent | PercevalHR | Addgene (Gary Yellen) | 49082 | PMID:24096541 |
| Recombinant DNA reagent | pAAV-RedO | Botond Roska | PMID:20576849 | |
| Recombinant DNA reagent | pAAV-SynPVI (ProA7) | Botond Roska | PMID:31285614 | |
| Recombinant DNA reagent | pAAV-SynP136 (ProA1) | Botond Roska | PMID:31285614 | |
| Software, algorithm | RP cone counting | This paper | MATLAB scripts available at https://github.com/sawyerxue/RP-cone-count |
Additional files
Download links
A two-part list of links to download the article, or parts of the article, in various formats.
Downloads (link to download the article as PDF)
Open citations (links to open the citations from this article in various online reference manager services)
Cite this article (links to download the citations from this article in formats compatible with various reference manager tools)
AAV-Txnip prolongs cone survival and vision in mouse models of retinitis pigmentosa
eLife 10:e66240.
https://doi.org/10.7554/eLife.66240


