Activation of mTORC1 and c-Jun by Prohibitin1 loss in Schwann cells may link mitochondrial dysfunction to demyelination
- Gustavo Della-Flora Nunes

- Emma R Wilson
- Edward Hurley
- Bert W O'Malley
- Yannick Poitelon
- Lawrence Wrabetz
- M Laura Feltri
- Hunter James Kelly Research Institute, University at Buffalo, United States
- Department of Biochemistry, University at Buffalo, United States
- Immunobiology & Transplant Science Center and Department of Surgery, Houston Methodist Hospital, United States
- Department of Medicine and Molecular and Cellular Biology, Baylor College of Medicine, United States
- Department of Neuroscience and Experimental Therapeutics, Albany Medical College, United States
- Department of Neurology, Jacobs School of Medicine and Biomedical Sciences, University at Buffalo, United States
Figures
Figure 1 with 4 supplements
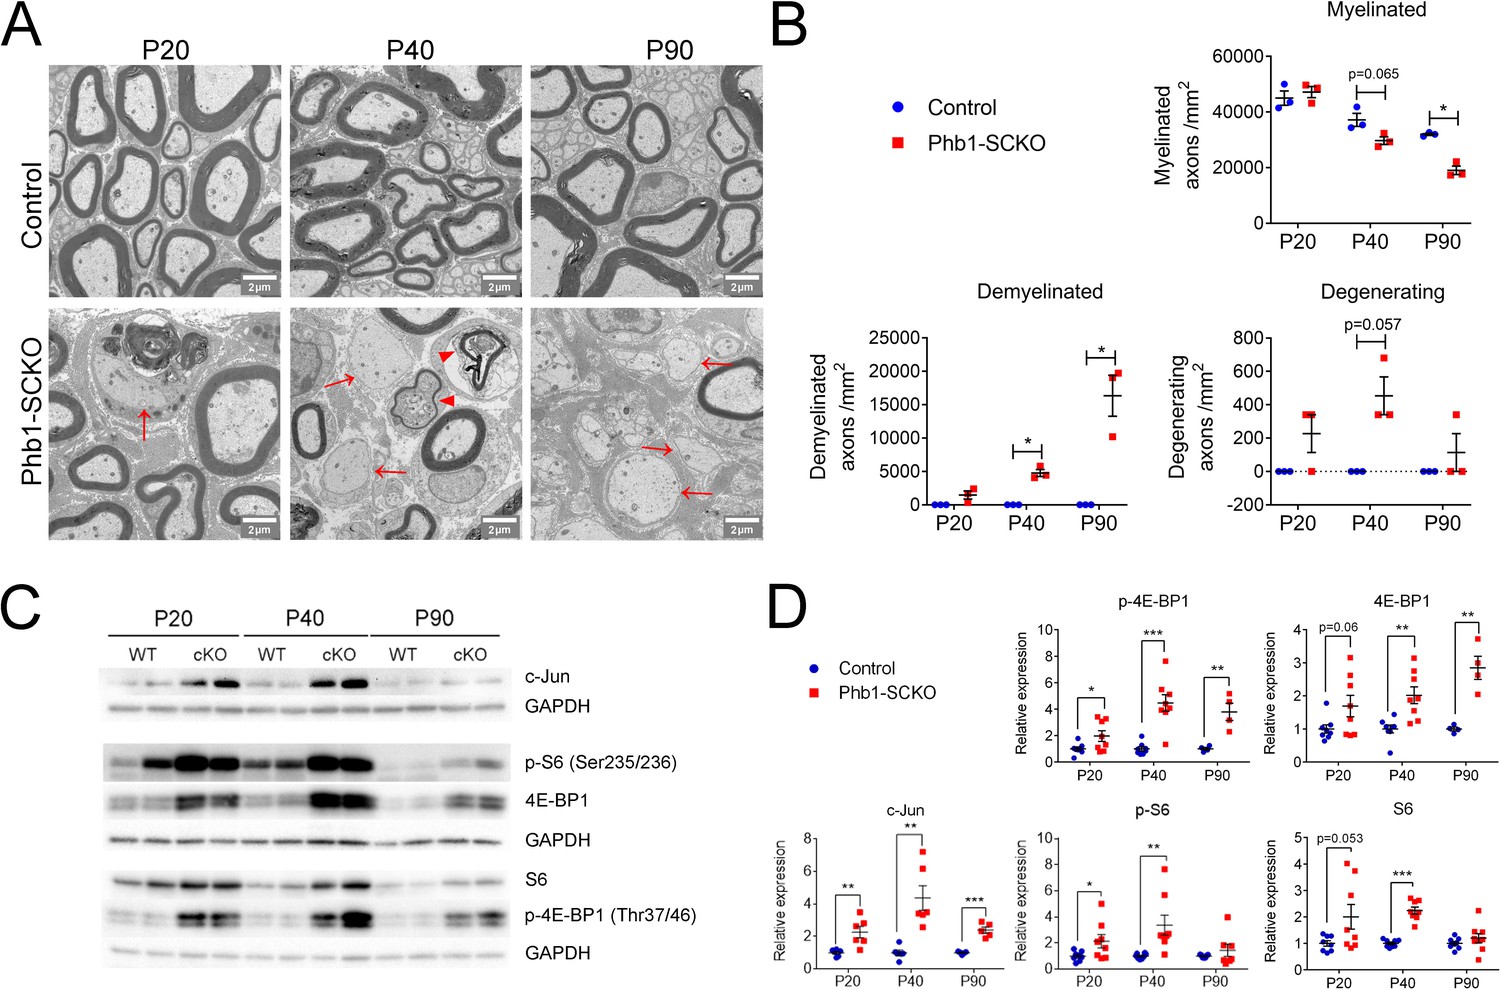
The mTORC1 and c-Jun pathways are activated upon deletion of Phb1.
(A) Representative electron micrographs of sciatic nerves demonstrating the demyelinating phenotype of Phb1-SCKO mice. Note the presence of demyelinated axons (arrows) and degenerating axons (arrowheads). (B) Quantification of myelinated, demyelinated and degenerating axons at the analyzed ages. There is progressive demyelination and axonal degeneration in the sciatic nerves of Phb1-SCKO animals. N = 3 animals per genotype. Two-way ANOVA. Myelinated: F (2, 8) interaction = 7.544, p = 0.0144; F (1.941, 7.763) time = 55.74, p < 0.0001; F (1.941, 7.763) group = 21.91, p = 0.0094. Demyelinated: F (2, 8) interaction = 14.25, p = 0.0023; F (1.011, 4.042) time = 14.25, p = 0.0191; F (1, 4) group = 113.5, p = 0.0004. Degenerating: F (2,8) interaction = 1.75, p = 0.234; F (1, 4) time = 1.75, p = 0.2564; F (1, 4) group = 49, p = 0.0022. (C) Representative western blot from sciatic nerve lysates reveal that deletion of Phb1 leads to upregulation of c-Jun and increased total and phosphorylated levels of the mTORC1 targets S6 and 4E-BP1. (D) Quantitative analysis of the relative expression of the proteins in (C). N = 4–9 animals per genotype. Unpaired two-tailed t-test. p-4E-BP1 [P20 (t = 2.264, df = 14), P40 (t = 5.337, df = 14), P90 (t = 4.228, df = 6)]; 4E-BP1 [P20 (t = 2.013, df = 14), P40 (t = 3.625, df = 14), P90 (t = 5.199, df = 6)]; c-Jun [P20 (t = 3.53, df = 10), P40 (t = 4.34, df = 10), P90 (t = 7.172, df = 8)]; p-S6 [P20 (t = 2.186, df = 14), P40 (t = 3.086, df = 14), P90 (t = 0.936, df = 12)]; S6 [P20 (t = 2.104, df = 14), P40 (t = 8.838, df = 14), P90 (t = 1.084, df = 16)]; * p < 0.05, ** p < 0.01, *** p < 0.001.
-
Figure 1—source data 1
Raw data and annotated uncropped western blots from Figure 1.
- https://cdn.elifesciences.org/articles/66278/elife-66278-fig1-data1-v2.zip
-
Figure 1—source data 2
Raw data and statistical analyses for data in Figure 1.
- https://cdn.elifesciences.org/articles/66278/elife-66278-fig1-data2-v2.xlsx
Figure 1—figure supplement 1
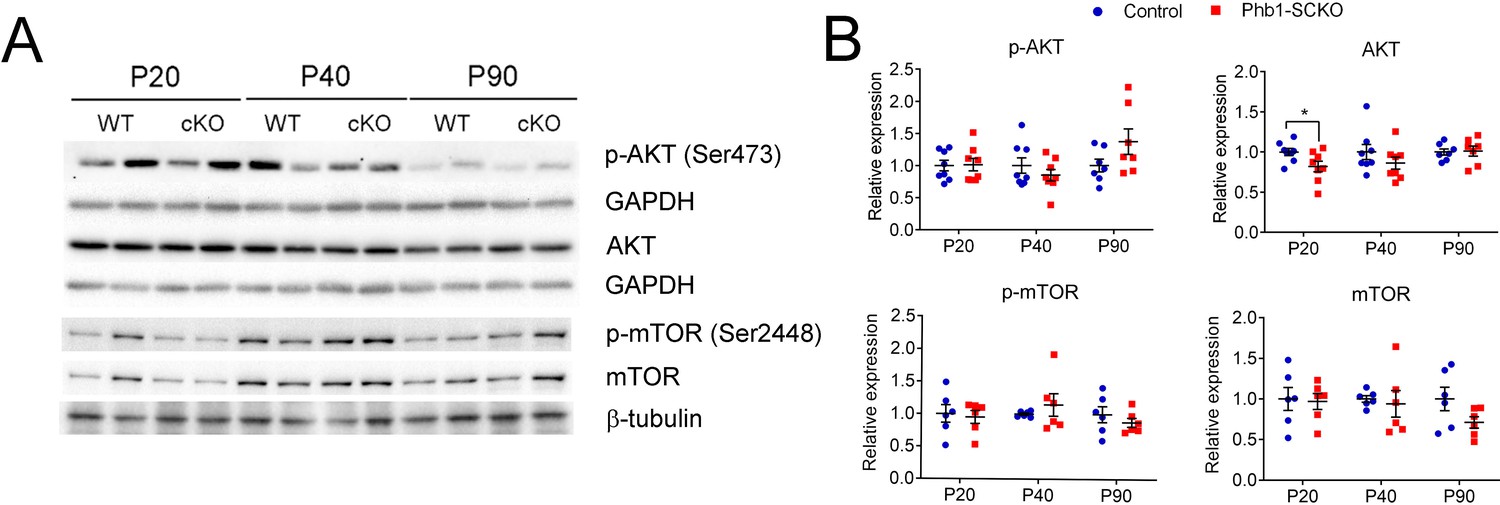
Akt and mTOR phosphorylation are not significantly altered by deletion of Phb1 in SCs.
(A) Representative western blot from sciatic nerve lysates. (B) Quantification of the western blot reveals only a minor difference in AKT expression at P20. N = 7–8 animals per genotype. Unpaired two-tailed t-test. p-AKT [P20 (t = 0.113, df = 14), P40 (t = 0.999, df = 14), P90 (t = 1.684, df = 12)]; AKT [P20 (t = 2.25, df = 14), P40 (t = 1.62, df = 14), P90 (t = 0.166, df = 12)]; p-mTOR [P20 (t = 0.299, df = 10), P40 (t = 0.821, df = 10), P90 (t = 0.866, df = 10)]; mTOR [P20 (t = 0.18, df = 10), P40 (t = 0.355, df = 10), P90 (t = 1.81, df = 10)]. * p < 0.05.
-
Figure 1—figure supplement 1—source data 1
Raw data and annotated uncropped western blots from Figure 1—figure supplement 1.
- https://cdn.elifesciences.org/articles/66278/elife-66278-fig1-figsupp1-data1-v2.zip
-
Figure 1—figure supplement 1—source data 2
Raw data and statistical analyses for data in Figure 1—figure supplement 1.
- https://cdn.elifesciences.org/articles/66278/elife-66278-fig1-figsupp1-data2-v2.xlsx
Figure 1—figure supplement 2
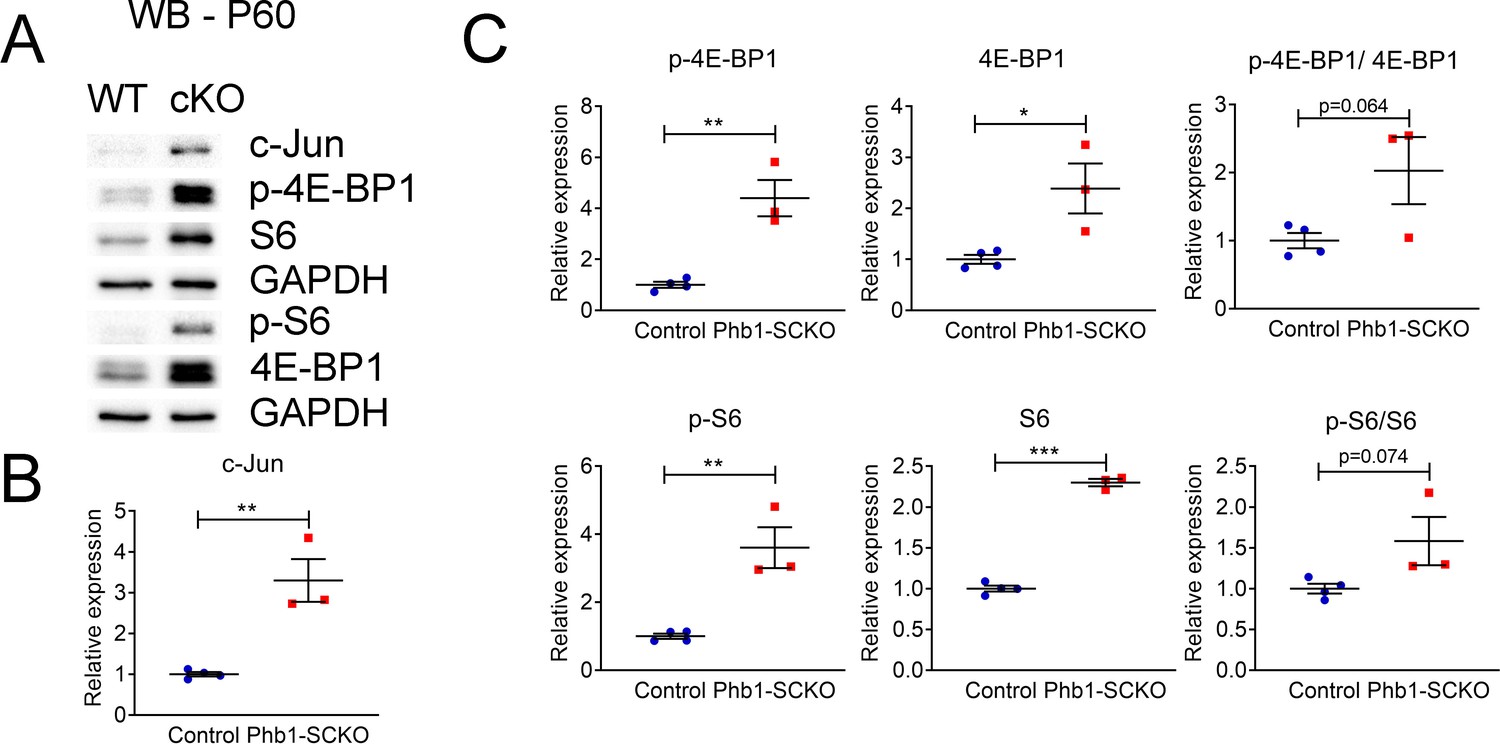
c-Jun and the mTORC1 pathway continue to be elevated in P60 Phb1-SCKO mice.
(A) Representative western blot from sciatic nerve lysates. (B) Quantification of the western blot shows upregulation of c-Jun. N = 3–4 animals per genotype. Unpaired two-tailed t-test. t = 5.198, df = 5. (C) Quantification of the western blot in (A) confirmed the activation of the mTORC1 pathway. N = 3–4 animals per genotype. Unpaired two-tailed t-test. p-4E-BP1 (t = 5.546, df = 5), 4E-BP1 (t = 3.289, df = 5), p-4E-BP1/4E-BP1 (t = 2.375, df = 5), p-S6 (t = 2.257, df = 5), S6 (t = 22.91, df = 5), p-S6/S6 (t = 2.257, df = 5). * p < 0.05, ** p < 0.01, *** p < 0.001.
-
Figure 1—figure supplement 2—source data 1
Raw data and annotated uncropped western blots from Figure 1—figure supplement 2.
- https://cdn.elifesciences.org/articles/66278/elife-66278-fig1-figsupp2-data1-v2.zip
-
Figure 1—figure supplement 2—source data 2
Raw data and statistical analyses for data in Figure 1—figure supplement 2.
- https://cdn.elifesciences.org/articles/66278/elife-66278-fig1-figsupp2-data2-v2.xlsx
Figure 1—figure supplement 3
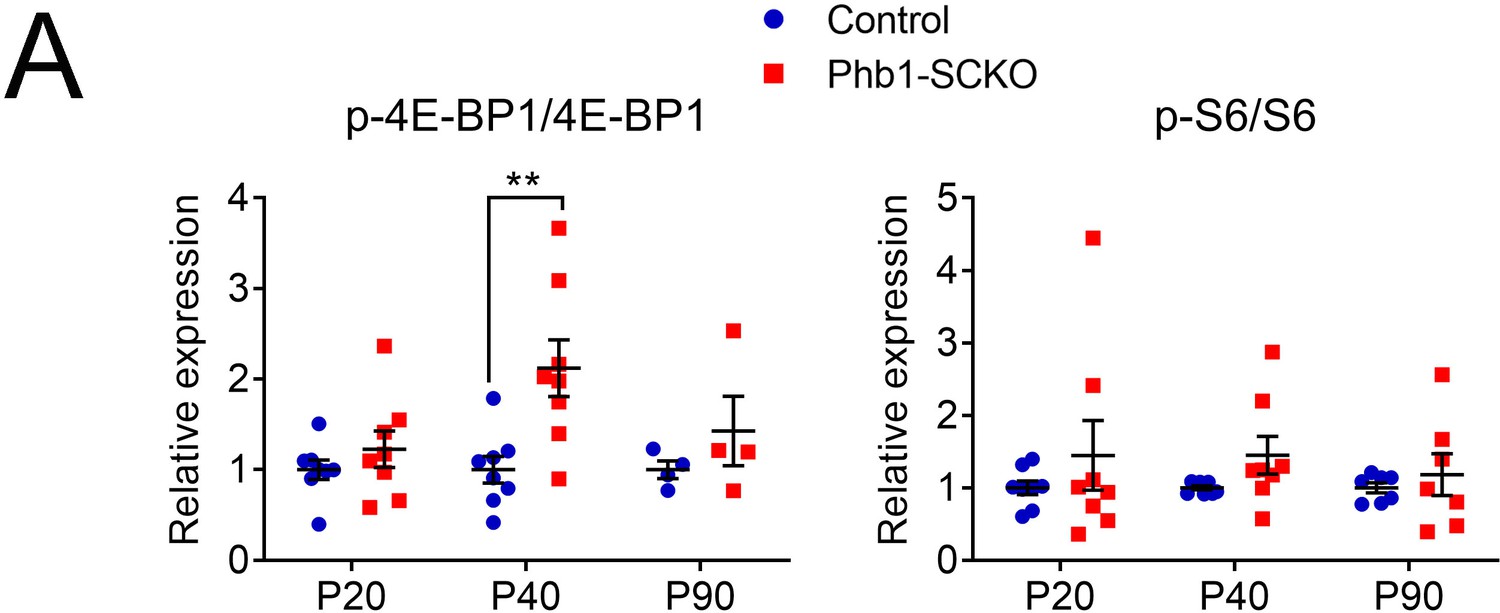
Ratios of phosphorylated to total 4E-BP1 and S6 are only slightly altered by deletion of Phb1.
(A) Quantification from western blots in Figure 1C. N = 4–9 animals per genotype. Unpaired two-tailed t-test. p-4E-BP1/4E-BP1 [P20 (t = 0.994, df = 14), P40 (t = 3.239, df = 14), P90 (t = 1.082, df = 6)]; p-S6/S6 [P20 (t = 0.911, df = 14), P40 (t = 1.73, df = 14), P90 (t = 0.618, df = 6)]. ** p < 0.01.
-
Figure 1—figure supplement 3—source data 1
Raw data and statistical analyses for data in Figure 1—figure supplement 3.
- https://cdn.elifesciences.org/articles/66278/elife-66278-fig1-figsupp3-data1-v2.xlsx
Figure 1—figure supplement 4
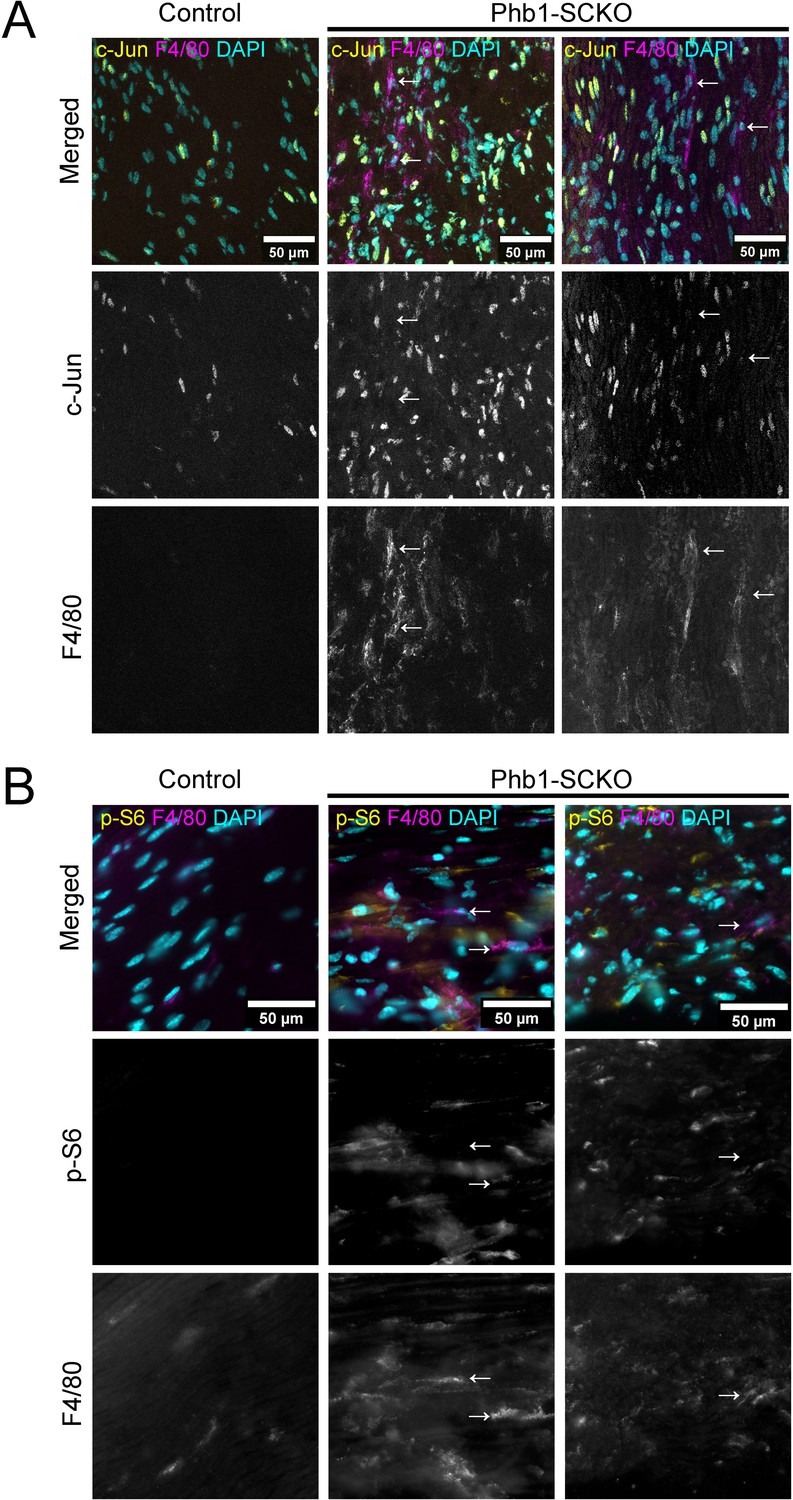
Macrophages contribute minimally to c-Jun and p-S6 in the sciatic nerves of Phb1-SCKO mice.
(A) Representative confocal z-projections of P40 sciatic nerves stained for c-Jun and the macrophage marker F4/80. Macrophages (arrows) are negative or only weakly-positive for c-Jun. Data is consistent on the two Phb1-SCKO mice analyzed. (B) Representative immunofluorescence images of P40 sciatic nerves stained for p-S6 and the macrophage marker F4/80. Macrophages (arrows) are negative or only weakly-positive for p-S6. Data is consistent on the two Phb1-SCKO mice analyzed.
Figure 2 with 2 supplements
Mitochondrial perturbations in SCs in vitro lead to activation of the mTORC1 pathway.
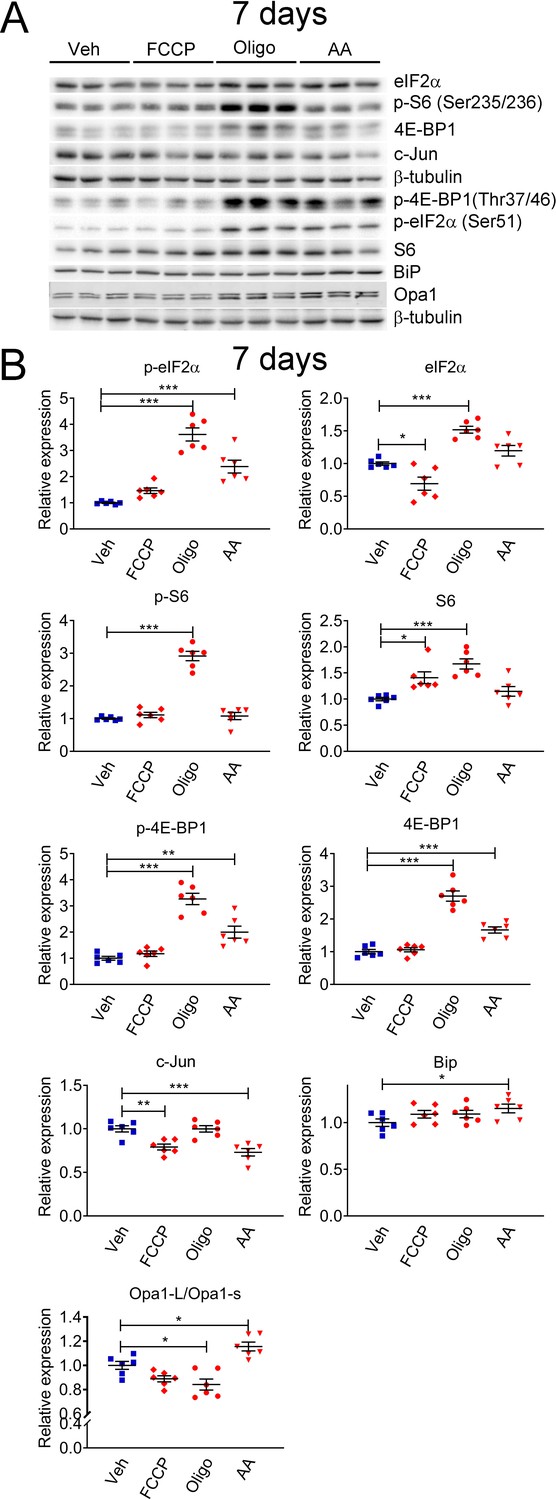
(A) Representative western blot from cell lysates of primary rat SCs treated with 5 μM FCCP, 2.5 μM oligomycin (Oligo), 10 μM antimycin A (AA) or vehicle (Veh) for 7 days. There is a robust activation of the ISR when SCs are treated long-term with oligomycin or antimycin A, conditions that also result in activation of the mTORC1 pathway. (B) Quantification of the experiments in (A). N = 6 wells per condition. One-way ANOVA corrected for multiple comparisons with the Dunnett method. F (3, 20) p-eIF2α = 39.18, p < 0.0001; F (3, 20) eIF2α = 23.9, p < 0.0001; F (3, 20) p-S6 = 87.39, p < 0.0001; F (3, 20) S6 = 11.13, p < 0.0001; F (3, 20) p-4E-BP1 = 37.53, p < 0.0001; F (3, 20) 4E-BP1 = 59.55, p < 0.0001; F (3, 20) c-Jun = 13.82, p < 0.0001; F (3, 20) Bip = 2.211, p = 0.118; F(3, 20) Opa1-L/Opa1-s = 15.09, p < 0.0001. * p < 0.05, ** p < 0.01, *** p < 0.001.
-
Figure 2—source data 1
Raw data and annotated uncropped western blots from Figure 2.
- https://cdn.elifesciences.org/articles/66278/elife-66278-fig2-data1-v2.zip
-
Figure 2—source data 2
Raw data and statistical analyses for data in Figure 2.
- https://cdn.elifesciences.org/articles/66278/elife-66278-fig2-data2-v2.xlsx
Figure 2—figure supplement 1
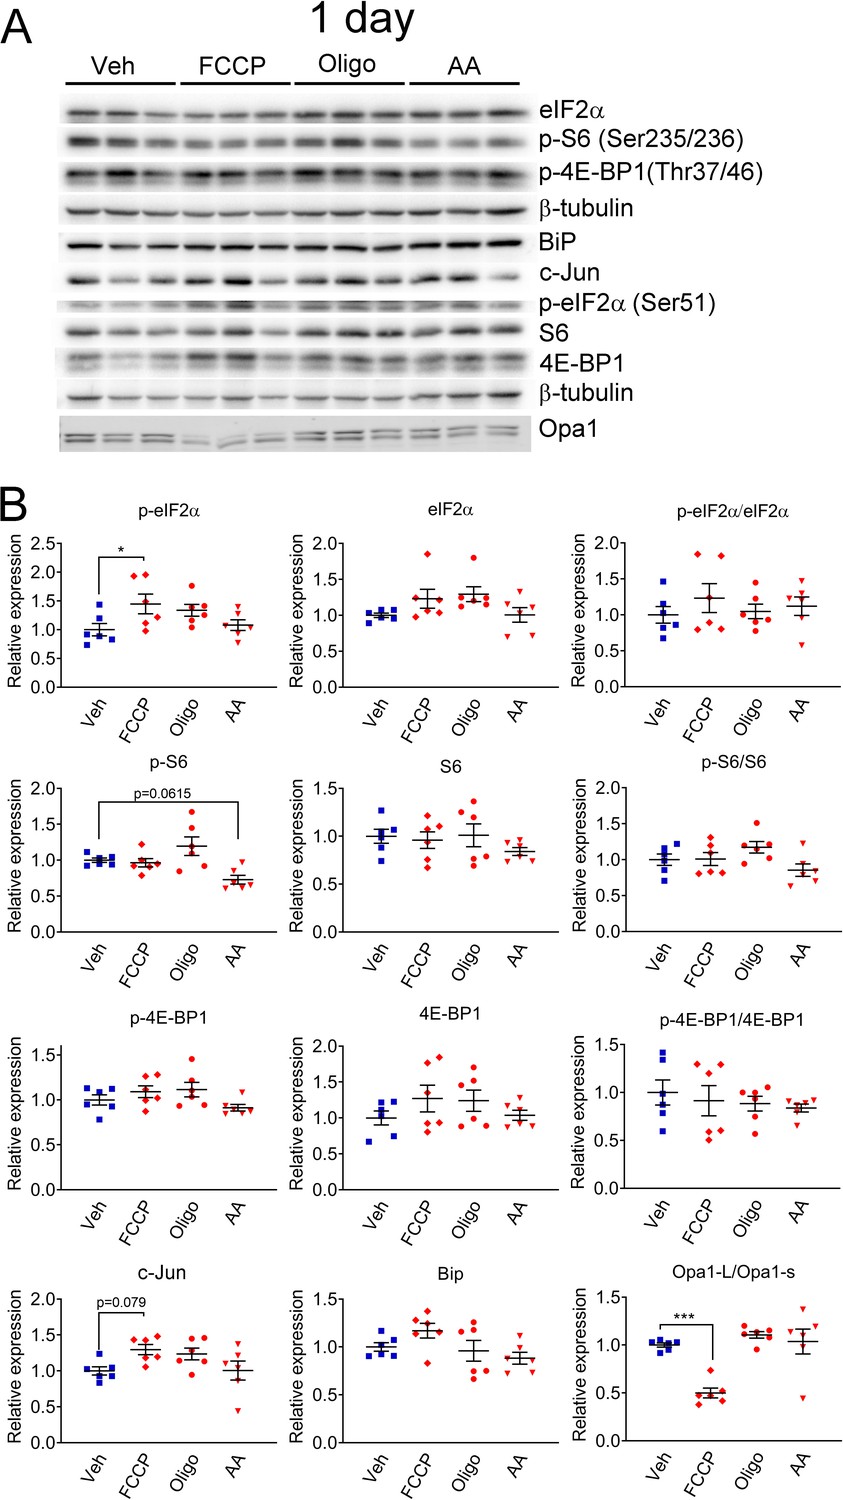
Short-term mitochondrial perturbation in SCs in vitro lead to activation of the ISR.
(A) Representative western blot from cell lysates of primary rat SCs treated with 5 μM FCCP, 2.5 μM oligomycin (Oligo), 10 μM antimycin A (AA) or vehicle (Veh) for 1 day. Short-term FCCP induces the integrated stress response (ISR), as seen by elevation of p-eIF2α. (B) Quantification of the experiments in (A). N = 6 wells per condition. One-way ANOVA corrected for multiple comparisons with the Dunnett method. F (3, 20) p-eIF2α = 1.327, p = 0.0568; F (3, 20) eIF2α = 2.355, p = 0.1025; F (3, 20) p-eIF2α/ eIF2α = 0.5113, p = 0.6791; F (3, 20) p-S6 = 5.928, p = 0.0046; F (3, 20) S6 = 0.842, p = 0.487; F (3, 20) p-S6/S6 = 2.407, p = 0.0974; F (3, 20) p-4E-BP1 = 2.236, p = 0.1155; F (3, 20) 4E-BP1 = 1.078, p = 0.381; F (3, 20) p-4E-BP1/4E-BP1 = 0.3764, p = 0.7710; F (2, 20) c-Jun = 2.911, p = 0.0597; F (3, 20) Bip = 2.528, p = 0.0864; F (3, 20) Opa1-L/Opa1-s = 14.5, p < 0.0001. * p < 0.05, *** p < 0.001.
-
Figure 2—figure supplement 1—source data 1
Raw data and annotated uncropped western blots from Figure 2—figure supplement 1.
- https://cdn.elifesciences.org/articles/66278/elife-66278-fig2-figsupp1-data1-v2.zip
-
Figure 2—figure supplement 1—source data 2
Raw data and statistical analyses for data in Figure 2—figure supplement 1.
- https://cdn.elifesciences.org/articles/66278/elife-66278-fig2-figsupp1-data2-v2.xlsx
Figure 2—figure supplement 2
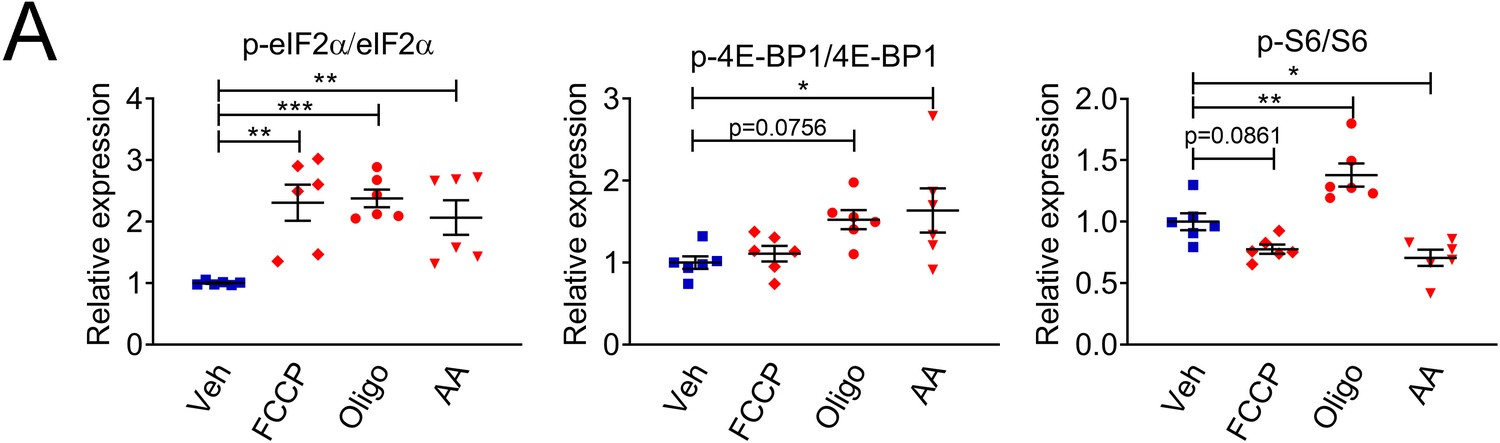
Ratios of phosphorylated to total eIf2α, 4E-BP1 and S6 are altered in SCs by a 7-day treatment with compounds that affect mitochondrial function.
(A) Quantification from western blots in Figure 2A. N = 6 wells per condition. One-way ANOVA corrected for multiple comparisons with the Dunnett method. F (3, 20) p-eIF2α/eIF2α = 8.760, p = 0.0007; F (3, 20) p-4E-BP1/4E-BP1 = 3.813, p = 0.0260; F (3, 20) p-S6/S6 = 18.95, p < 0.0001. * p < 0.05, ** p < 0.01, *** p < 0.001.
-
Figure 2—figure supplement 2—source data 1
Raw data and statistical analyses for data in Figure 2—figure supplement 2.
- https://cdn.elifesciences.org/articles/66278/elife-66278-fig2-figsupp2-data1-v2.xlsx
Figure 3 with 1 supplement
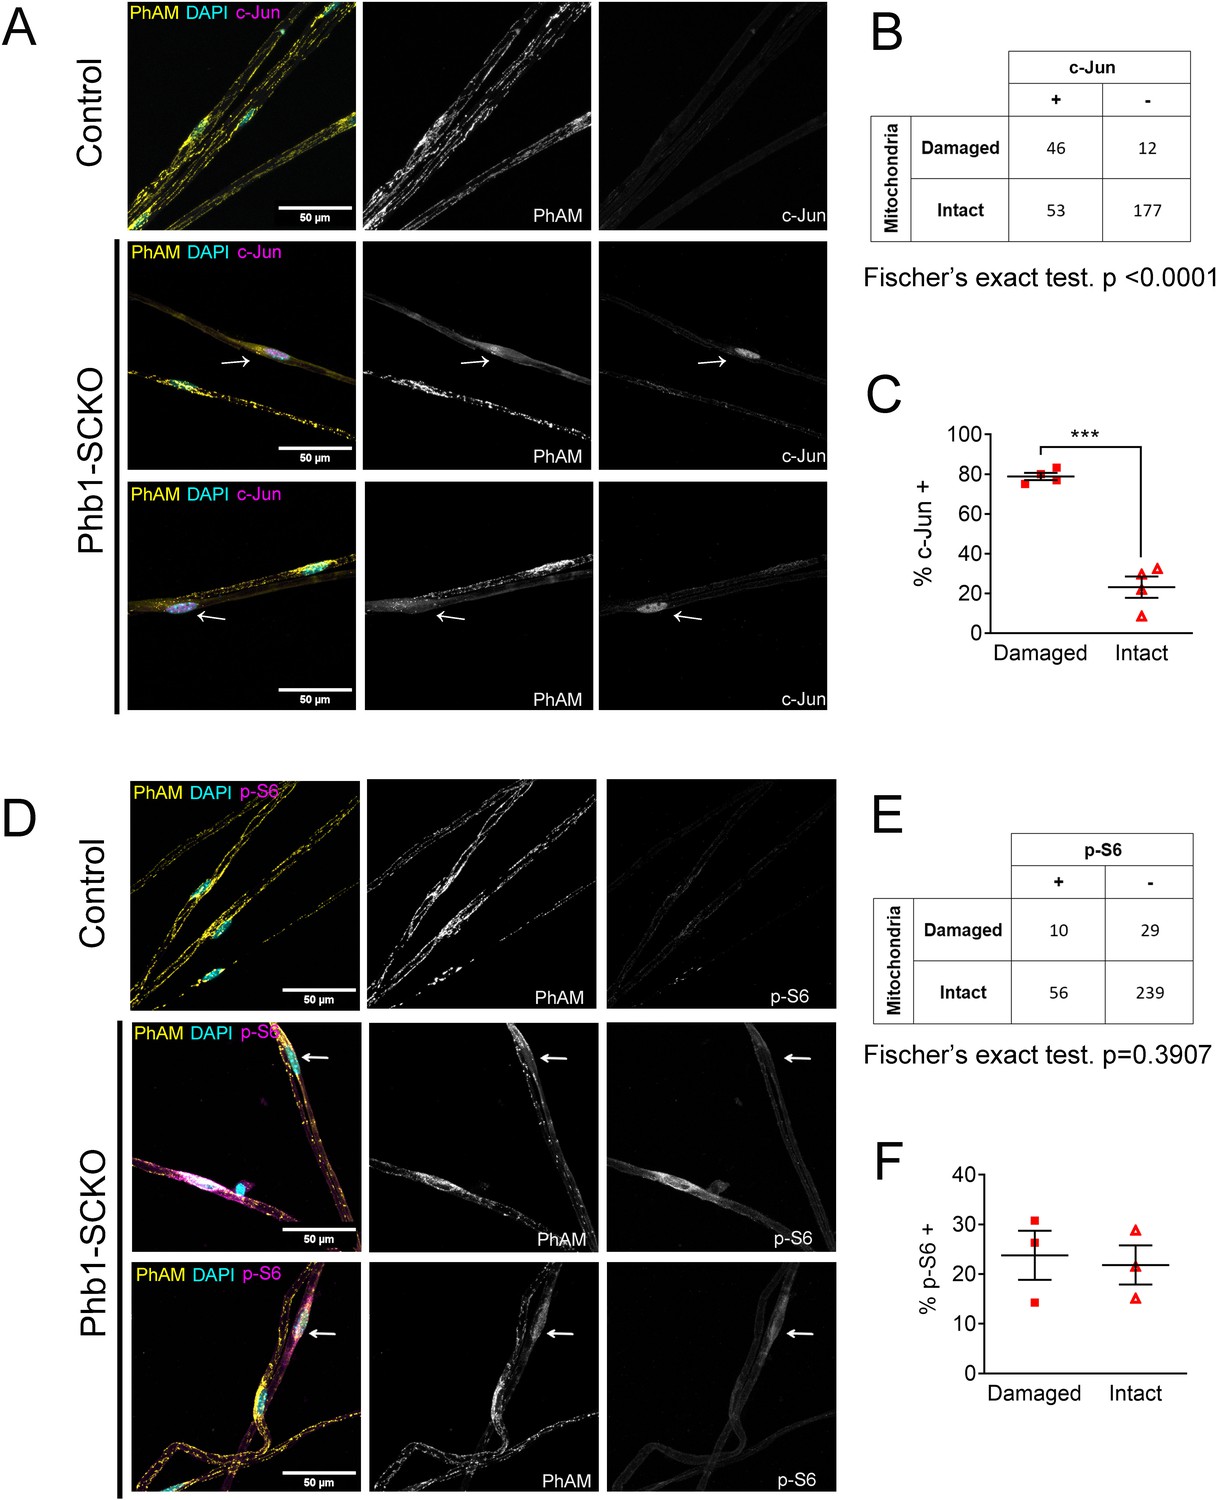
c-Jun expression is associated with mitochondrial loss in vivo, but mTORC1 activation is not at P40.
(A) Immunofluorescence for c-Jun in teased fibers from sciatic nerves of P40 animals expressing PhAM in SC mitochondria. Note that SCs of Phb1-SCKO mice that show perturbation to their mitochondrial network (arrows) tend to also show high nuclear c-Jun expression (magenta). (B) There is an association between mitochondrial damage and c-Jun staining in SCs of Phb1-SCKO mice. N = 4 animals. Fischer’s exact test. (C) The majority of SCs of Phb1-SCKO mice that lack PhAM expression away from the cell body show positive staining for c-Jun. N = 4 animals. Paired two-tailed t-test (t = 14.09, df = 3) (D) Immunofluorescence for phosphorylated S6 ribosomal protein (p–S6) in teased fibers from sciatic nerves of animals expressing PhAM. Arrows show two SCs with damaged mitochondria, the one on top was considered p-S6 -, while the one on the bottom was classified as p-S6 +. (E) There is no correlation between mitochondrial damage and p-S6 staining in SCs of Phb1-SCKO mice. N = 3 animals. Fischer’s exact test. (F) The percentage of SCs labeed with p-S6 is constant regardless of the status of their mitochondrial network visualized by PhAM. N = 3 animals. Paired two-tailed t-test (t = 0.236, df = 2). *** p < 0.001.
-
Figure 3—source data 1
Raw data and statistical analyses for data in Figure 3.
- https://cdn.elifesciences.org/articles/66278/elife-66278-fig3-data1-v2.xlsx
Figure 3—figure supplement 1
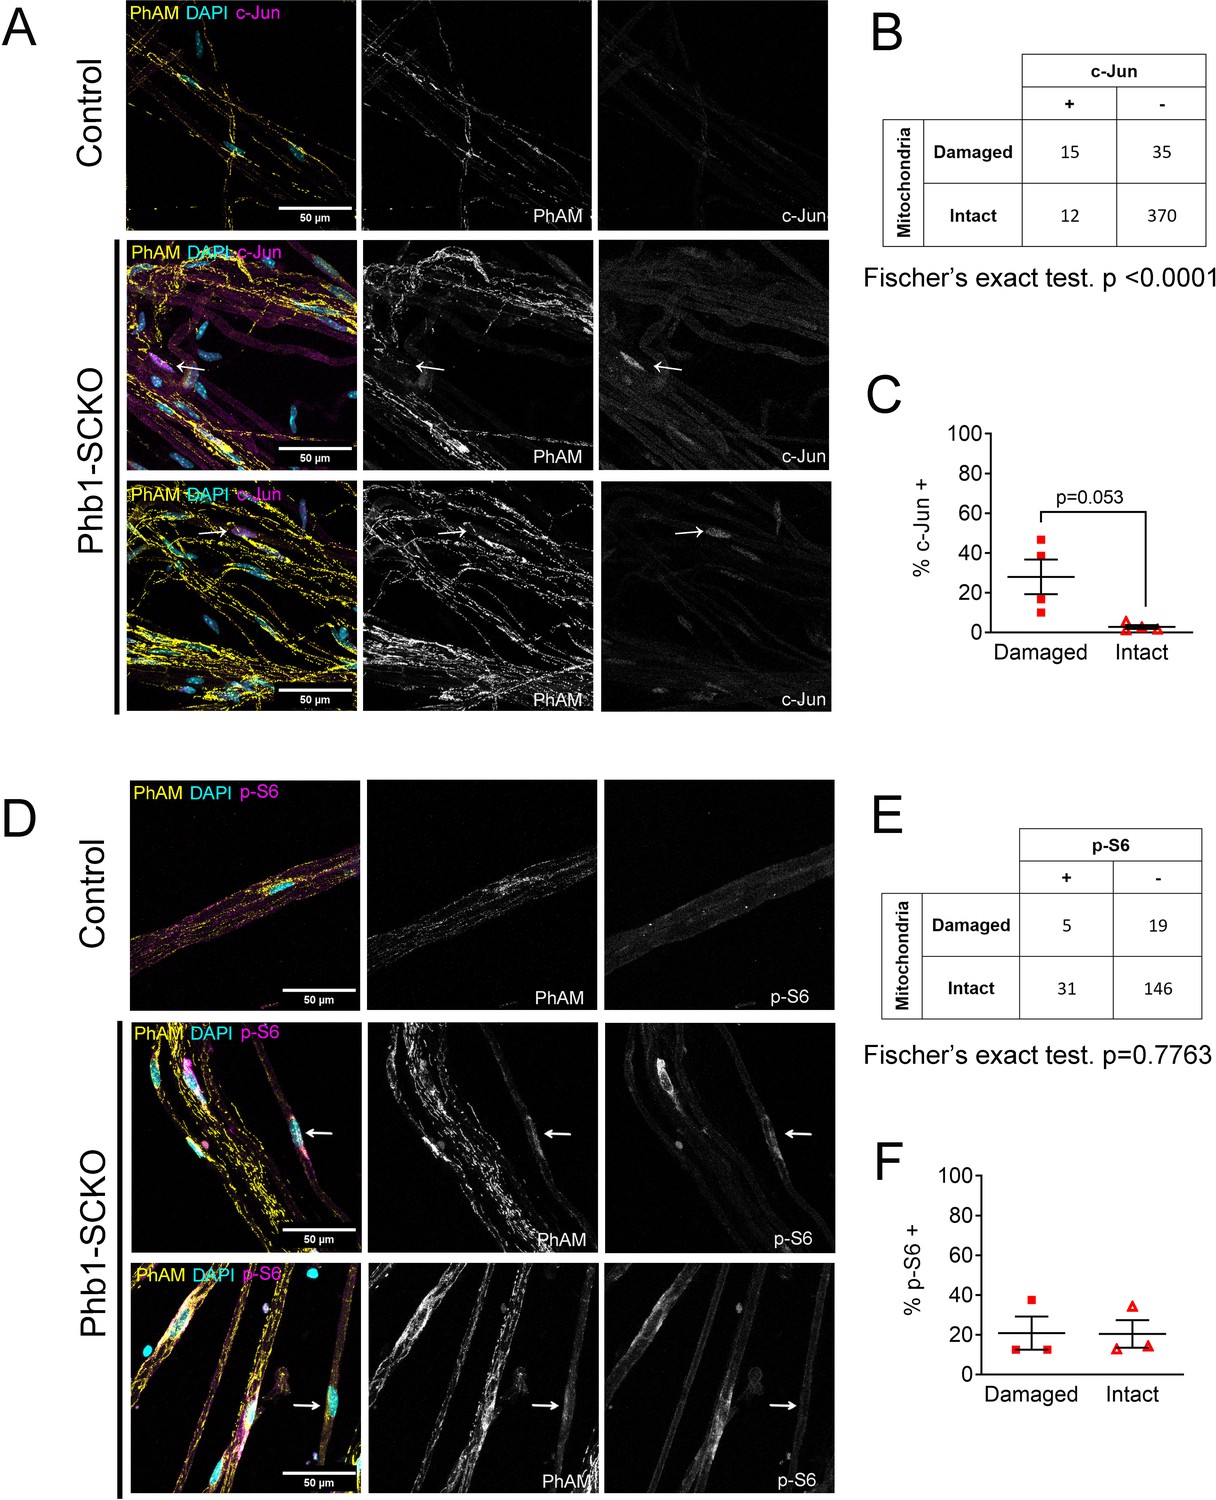
At P90, c-Jun expression continues to be associated with mitochondrial loss in vivo, but mTORC1 activation is not.
(A) Immunofluorescence for c-Jun in teased fibers from sciatic nerves of P90 animals expressing PhAM in SC mitochondria. Note that SCs of Phb1-SCKO mice that show perturbation to their mitochondrial network (arrows) tend to also show high nuclear c-Jun expression (magenta). (B) There is an association between mitochondrial damage and c-Jun staining in SCs of Phb1-SCKO mice. N = 4 animals. Fischer’s exact test. (C) The proportion of SCs of Phb1-SCKO mice with c-JUN+ nuclei tends to be higher in SCs that lack PhAM expression away from the cell body. N = 4 animals. Paired two-tailed t-test (t = 3.108, df = 3) (D) Immunofluorescence for phosphorylated S6 ribosomal protein (p–S6) in teased fibers from sciatic nerves of animals expressing PhAM at P90. Arrows show two SCs with damaged mitochondria, the one on top was considered p-S6 +, while the one on the bottom was classified as p-S6 -. (E) There is no correlation between mitochondrial damage and p-S6 staining in SCs of Phb1-SCKO mice. N = 3 animals. Fischer’s exact test. (F) The percentage of SCs labeled with p-S6 is constant regardless of the status of their mitochondrial network visualized by PhAM. N = 3 animals. Paired two-tailed t-test (t = 0.02817, df = 2).
-
Figure 3—figure supplement 1—source data 1
Raw data and statistical analyses for data in Figure 3—figure supplement 1.
- https://cdn.elifesciences.org/articles/66278/elife-66278-fig3-figsupp1-data1-v2.xlsx
Figure 4 with 1 supplement
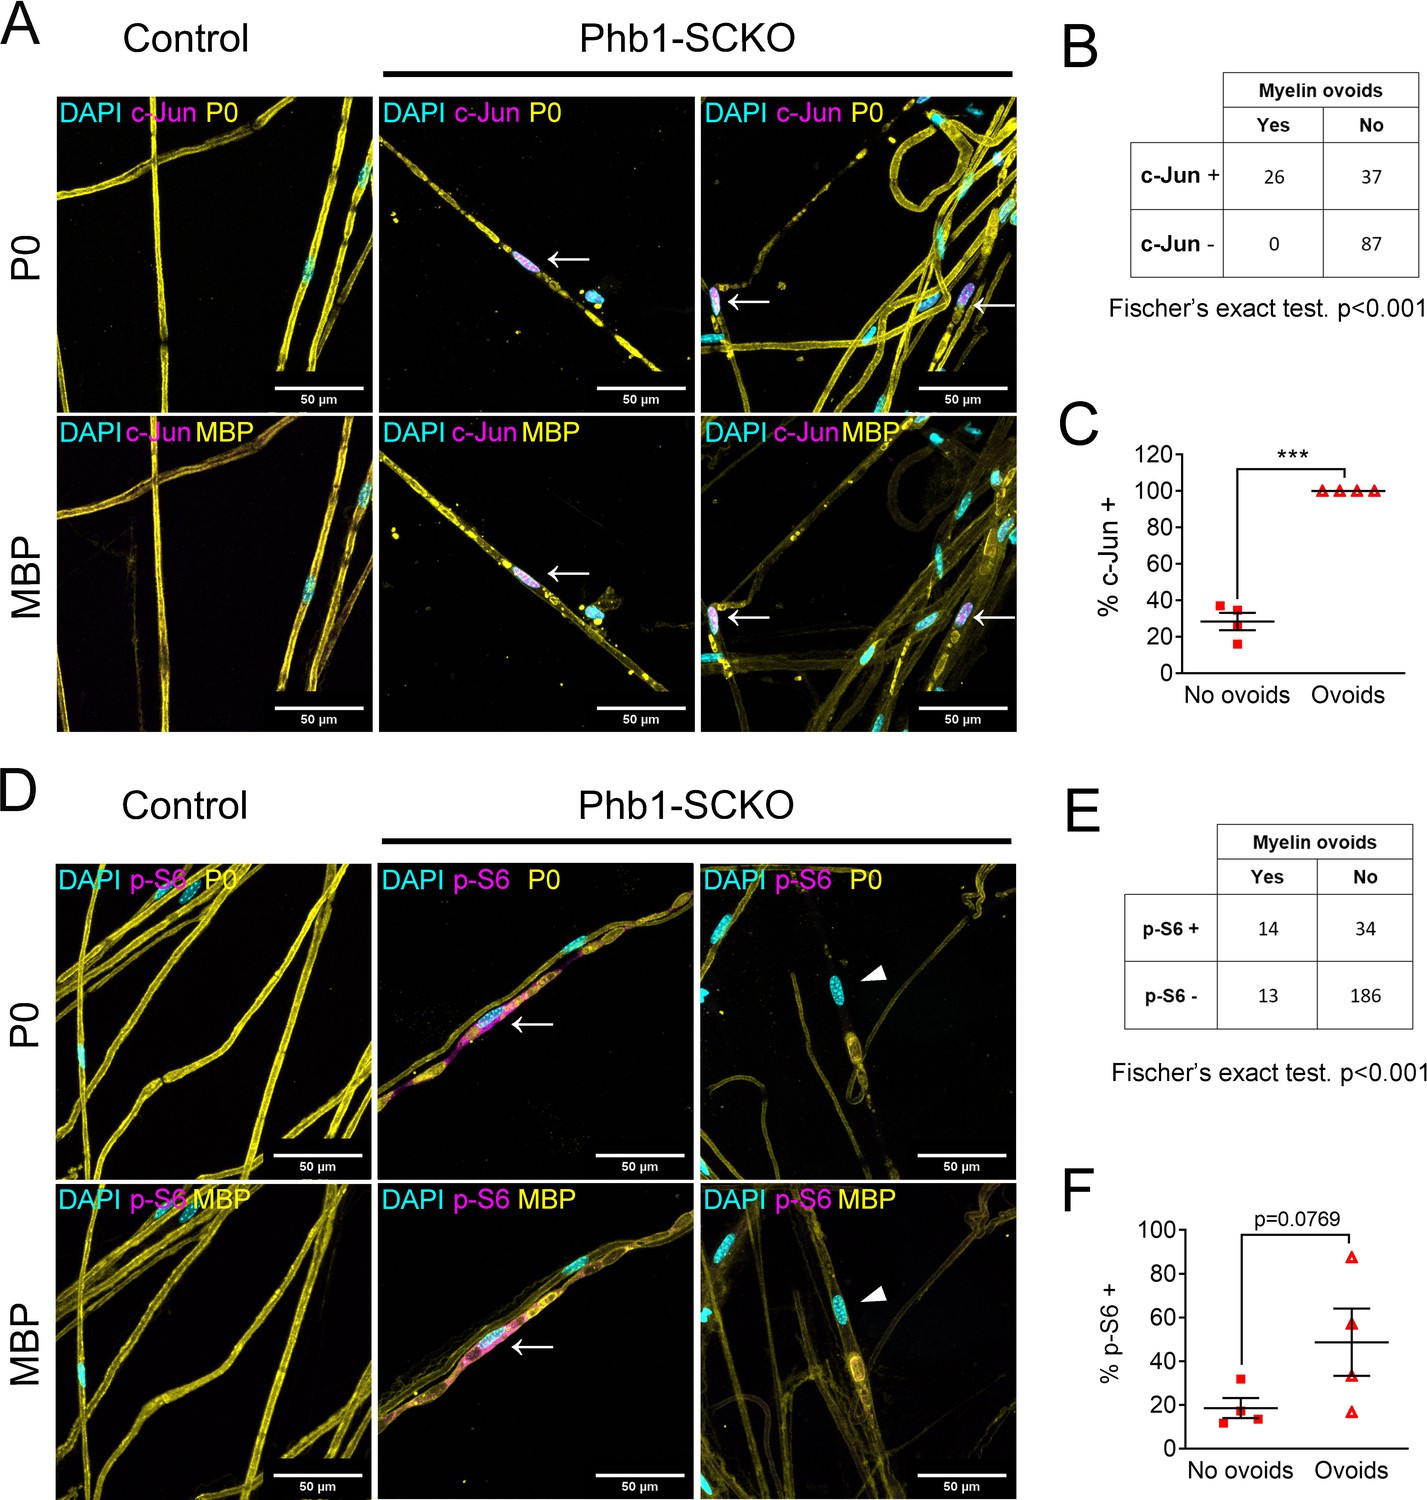
Activation of the mTORC1/c-Jun axis is associated with demyelination.
(A) Teased fibers from tibial nerves of 40-day-old mice stained for myelin proteins (MBP and P0) and c-Jun. All cells containing myelin ovoids were also c-Jun positive (arrows). (B) c-Jun immunoreactivity and presence of myelin ovoids are associated. N = 4 animals. Fischer’s exact test. (C) Cells that present with myelin ovoids show a higher percentage of c-Jun immunoreactivity. N = 4 animals. Paired two-tailed t-test (t = 15.05, df = 3). (D) Teased fibers from tibial nerves of 40-day-old mice stained for myelin proteins (MBP and P0) and phosphorylation of S6, a downstream target of mTORC1. Arrows and arrowheads show cells containing myelin avoids and that are p-S6 positive and p-S6 negative, respectively. (E) There is an association between p-S6 reactivity and presence of myelin ovoids. N = 4 animals. Fischer’s exact test. (F) The percentage of cells positive for p-S6 tends to be higher among cells that present with myelin ovoids. N = 4 animals. Paired two-tailed t-test (t = 2.651, df = 3). *** p < 0.001.
-
Figure 4—source data 1
Raw data and statistical analyses for data in Figure 4.
- https://cdn.elifesciences.org/articles/66278/elife-66278-fig4-data1-v2.xlsx
Figure 4—figure supplement 1
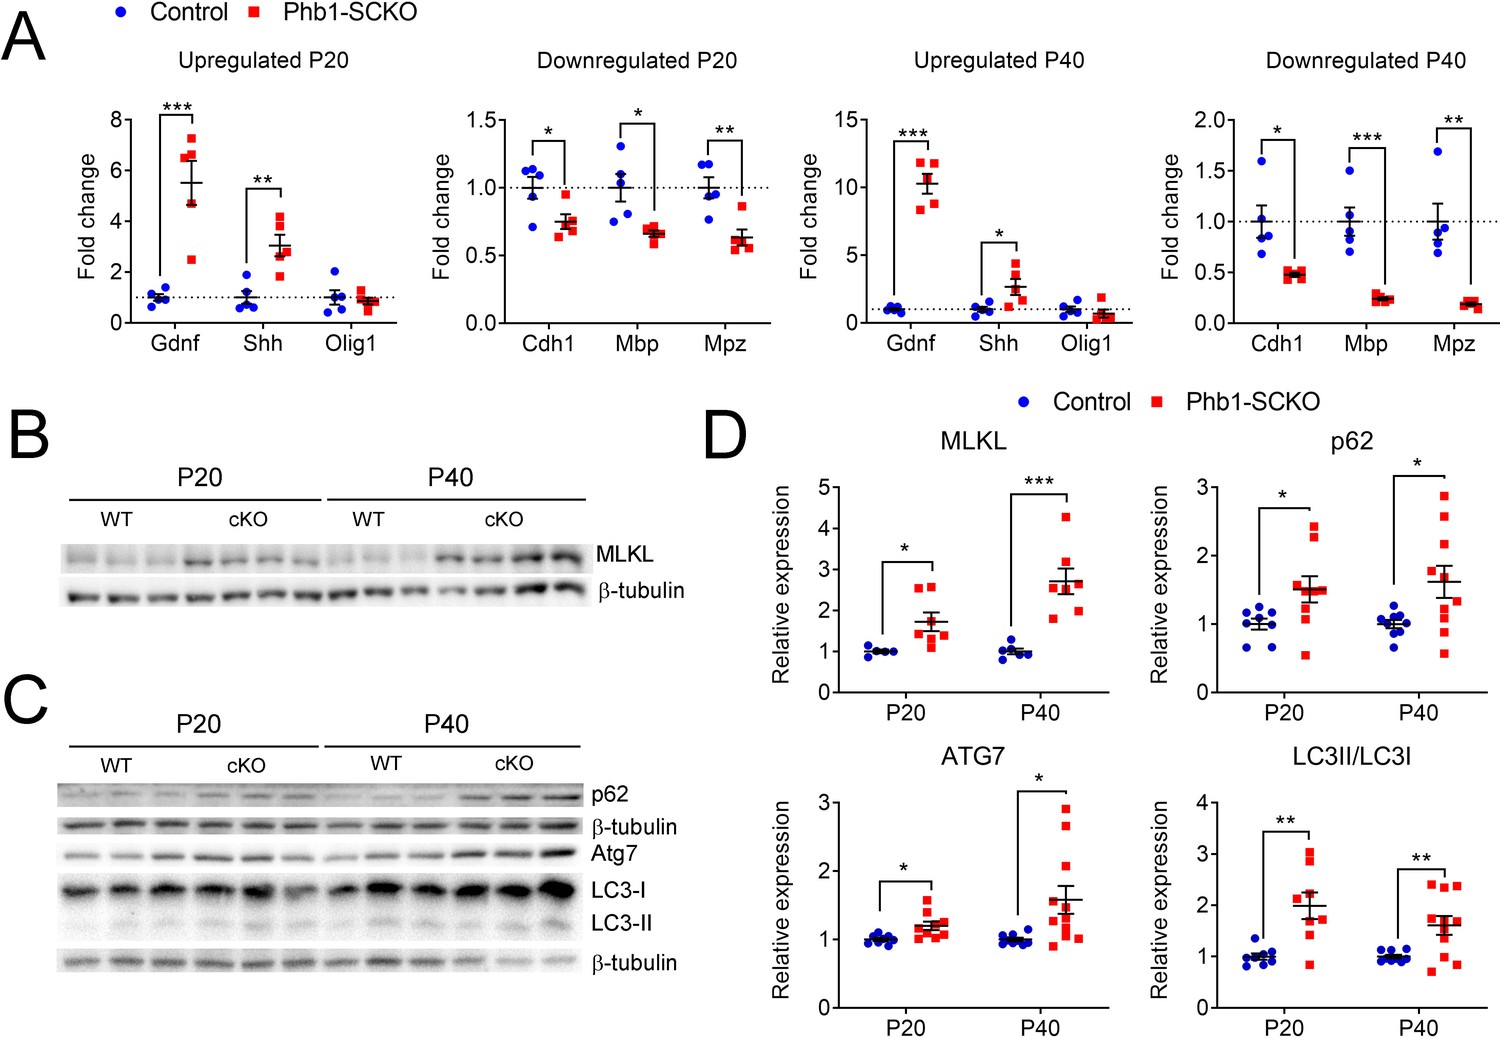
Phb1-SCKO mice show an overactive myelin breakdown machinery.
(A) qRT-PCR from sciatic nerves showing that multiple c-Jun targets have their expression altered in the expected direction when Phb1 is deleted in SCs. Olig1 was the only c-Jun target analyzed that was not altered in Phb1-SCKO mice. N = 5 animals per genotype. Unpaired two-tailed t-test. Up P20 [Gdnf (t = 5.143, df = 8), Shh (t = 4.158, df = 8), Olig1 (t = 0.46, df = 8)]; Down P20 [Cdh1 (t = 2.568, df = 8), Mbp (t = 3.26, df = 8), Mpz (t = 3.757, df = 8)]; Up P40 [Gdnf (t = 12.55, df = 8), Shh (t = 2.673, df = 8), Olig1 (t = 0.857, df = 8)]; Down P40 [Cdh1 (t = 3.27, df = 8), Mbp (t = 5.447, df = 8), Mpz (t = 4.549, df = 8)]. (B–C) Representative western blots illustrating the upregulation of MLKL (B) and of autophagy machinery (C) in sciatic nerves of Phb1-SCKO mice. (D) Quantification of the experiments in (A) and (B). N = 5–11 animals per genotype. Unpaired two-tailed t-test. MLKL [P20 (t = 2.63, df = 10), P40 (t = 4.937, df = 11)]; p62 [P20 (t = 2.335, df = 15), P40 (t = 2.418, df = 17)]; ATG7 [P20 (t = 2.862, df = 15), P40 (t = 2.539, df = 18)]; LC3II/LC3I [P20 (t = 3.734, df = 14), P40 (t = 2.965, df = 18)]. * p < 0.05, ** p < 0.01, *** p < 0.001.
-
Figure 4—figure supplement 1—source data 1
Raw data and annotated uncropped western blots from Figure 4—figure supplement 1.
- https://cdn.elifesciences.org/articles/66278/elife-66278-fig4-figsupp1-data1-v2.zip
-
Figure 4—figure supplement 1—source data 2
Raw data and statistical analyses for data in Figure 4—figure supplement 1.
- https://cdn.elifesciences.org/articles/66278/elife-66278-fig4-figsupp1-data2-v2.xlsx
Figure 5 with 1 supplement
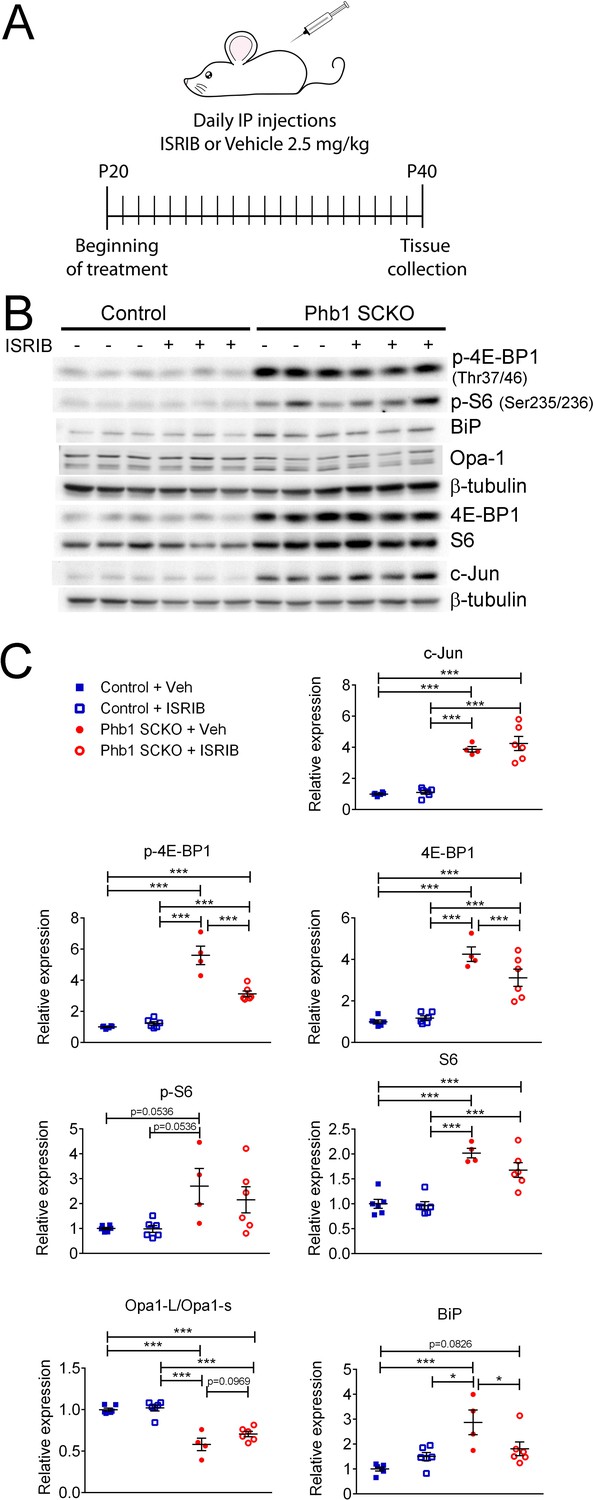
Effects of ISR on the other pathways investigated in PHB1-SCKO animals.
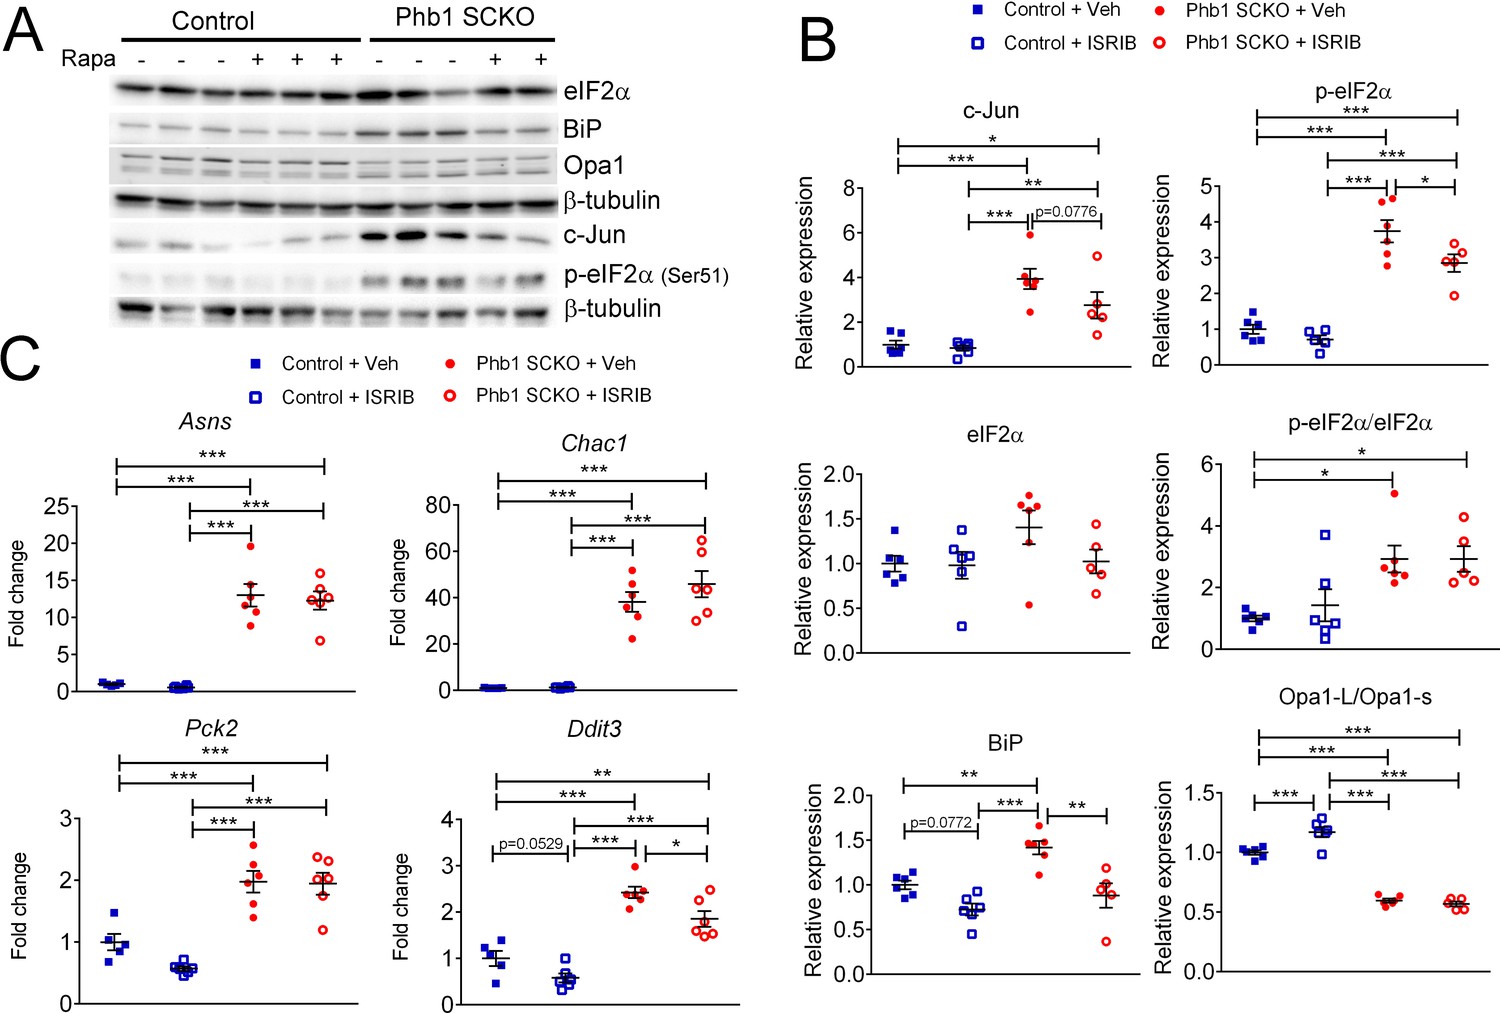
(A) Schematic representation of the pharmacological treatment with the ISR inhibitor ISRIB. (B) Representative western blot from sciatic nerve lysates demonstrating the effect of ISRIB in P40 Phb1-SCKO mice and controls. (C) Quantification of the western blots illustrated in (B). ISRIB only seems to cause small changes in the levels of 4E-BP1 (both total and phosphorylated) and BiP. N = 5–6 animals per group. Two-way ANOVA corrected for multiple comparisons using the Holm-Sidak method. c-Jun: F (1, 18) interaction = 0.267, p = 0.611; F (1, 18) ISRIB = 0.823, p = 0.376; F (1, 18) group = 125.8, p < 0.0001. p-4E-BP1: F (1, 18) interaction = 31.17, p < 0.0001; F (1, 18) ISRIB = 21.56, p = 0.0002; F (1, 18) group = 180.5, p < 0.0001. 4E-BP1: F (1, 18) interaction = 5.778, p = 0.027; F (1, 18) ISRIB = 3.133, p = 0.0937; F (1, 18) group = 90, p < 0.0001. p-S6: F (1, 18) interaction = 0.459, p = 0.5066; F (1, 18) ISRIB = 0.5113, p = 0.484; F (1, 18) group = 13.23, p = 0.0019. S6: F (1, 18) interaction = 1.891, p = 0.186; F (1, 18) ISRIB = 2.861, p = 0.108; F (1, 18) group = 60.64, p < 0.0001. Opa1-L/Opa1-s: F (1, 18) interaction = 1.719, p = 0.206; F (1, 18) ISRIB = 3.334, p = 0.0845; F (1, 18) group = 85, p < 0.0001. BiP: F (1, 18) interaction = 9.354, p = 0.0068; F (1, 18) ISRIB = 1.202, p = 0.2874; F (1, 18) group = 18.28, p = 0.0005. * p < 0.05, ** p < 0.01, *** p < 0.001.
-
Figure 5—source data 1
Raw data and annotated uncropped western blots from Figure 5.
- https://cdn.elifesciences.org/articles/66278/elife-66278-fig5-data1-v2.zip
-
Figure 5—source data 2
Raw data and statistical analyses for data in Figure 5.
- https://cdn.elifesciences.org/articles/66278/elife-66278-fig5-data2-v2.xlsx
Figure 5—figure supplement 1
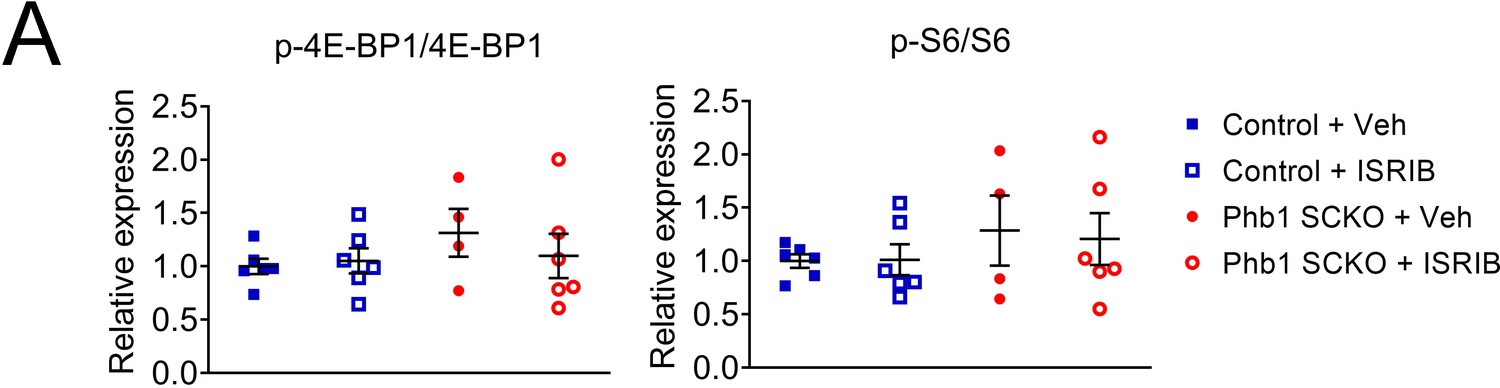
Ratios of phosphorylated to total 4E-BP1 and S6 are not affected by treatment with ISRIB.
(A) Quantification from western blots in Figure 5B. N = 5–6 animals per group. Two-way ANOVA corrected for multiple comparisons using the Holm-Sidak method. p-4E-BP1/4E-BP1: F (1, 18) interaction = 0.7009, p = 0.413; F (1, 18) ISRIB = 0.263, p = 0.614; F (1, 18) group = 1.264, p = 0.276. p-S6/S6: F (1, 18) interaction = 0.053, p = 0.821; F (1, 18) ISRIB = 0.263, p = 0.868; F (1, 18) group = 1.459, p = 0.243.
-
Figure 5—figure supplement 1—source data 1
Raw data and statistical analyses for data in Figure 5—figure supplement 1.
- https://cdn.elifesciences.org/articles/66278/elife-66278-fig5-figsupp1-data1-v2.xlsx
Figure 6 with 2 supplements
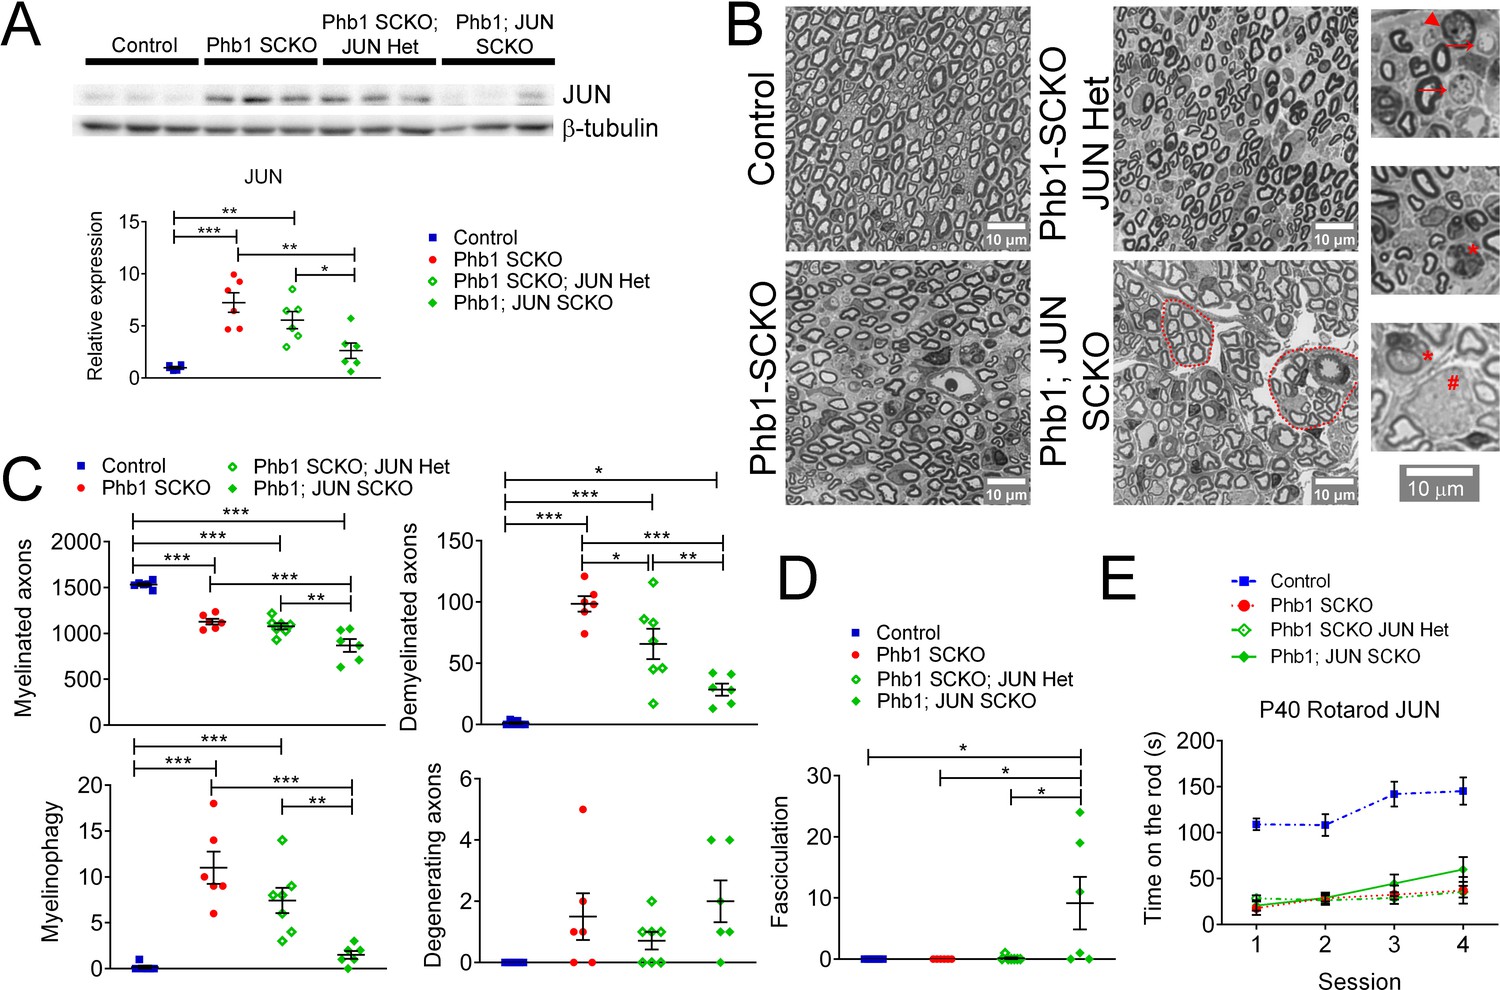
c-Jun may participate in the demyelination process in Phb1-SCKO mice, but Jun ablation is unable to ameliorate the behavioral phenotype.
(A) Top: Western blot from sciatic nerve lysates illustrating the reduction in c-Jun levels when SCs of P40 Phb1-SCKO mice have one (Phb1 SCKO; JUN Het) or both JUN alleles deleted (Phb1; JUN SCKO). Bottom: Quantification of the experiment represented in the top panel. N = 6 animals per group. One-way ANOVA corrected for multiple comparisons using the Holm-Sidak method. F (3, 20) = 15.08, p < 0.0001. (B) Representative semithin sections from tibial nerves. Note that nerves of Phb1; JUN SCKO mice show a division of axons into smaller fascicles (dotted lines), an abnormality known as hyper-fasciculation. Nerves of these animals also frequently have large bundle structures containing axons of mixed caliber, indicative of a mild radial sorting defect (see inset). Insets: Representative images of demyelinated axons (arrows), degenerating axon (arrowhead), myelinophagy (stars) and large bundles with axons of mixed caliber (pound). (C) Quantification of morphological parameters from semithin images reveal that Jun ablation results in a reduction in demyelinated axons and myelin degradation (myelinophagy; visualized by the presence of cytoplasmic myelin debris in SCs) in Phb1-SCKO mice. Nonetheless, animals in which Jun has been deleted show a dose-dependent reduction in myelinated axons, suggesting that deletion of Jun may amplify the developmental defect observed in Phb1-SCKO animals. N = 6–7 animals per group. One-way ANOVA corrected for multiple comparisons using the Holm-Sidak method. F (3, 21) myelinated = 3.211, p = 0.0438; F (3, 21) demyelinated = 5.064, p = 0.0085; F (3, 21) myelinophagy = 2.667, p = 0.074; F (3, 21) degenerating = 2.69, p = 0.0724. (D) Phb1; JUN SCKO mice commonly show hyper-fasciculation. N = 6–7 animals per group. One-way ANOVA corrected for multiple comparisons using the Holm-Sidak method. F (3, 21) = 16.67, p < 0.001 (E) Deletion of Jun has no observable effect in the performance of Phb1-SCKO mice in the rotarod. N = 6 animals per group. Two-way ANOVA corrected for multiple comparisons using the Holm-Sidak method. F (9, 60) interaction = 2.654, p = 0.0117; F (3, 60) time = 19.65, p < 0.0001; F (3, 20) group = 33.63, p < 0.0001. * p < 0.05, ** p < 0.01, *** p < 0.001.
-
Figure 6—source data 1
Raw data and annotated uncropped western blots from Figure 6.
- https://cdn.elifesciences.org/articles/66278/elife-66278-fig6-data1-v2.zip
-
Figure 6—source data 2
Raw data and statistical analyses for data in Figure 6.
- https://cdn.elifesciences.org/articles/66278/elife-66278-fig6-data2-v2.xlsx
Figure 6—figure supplement 1
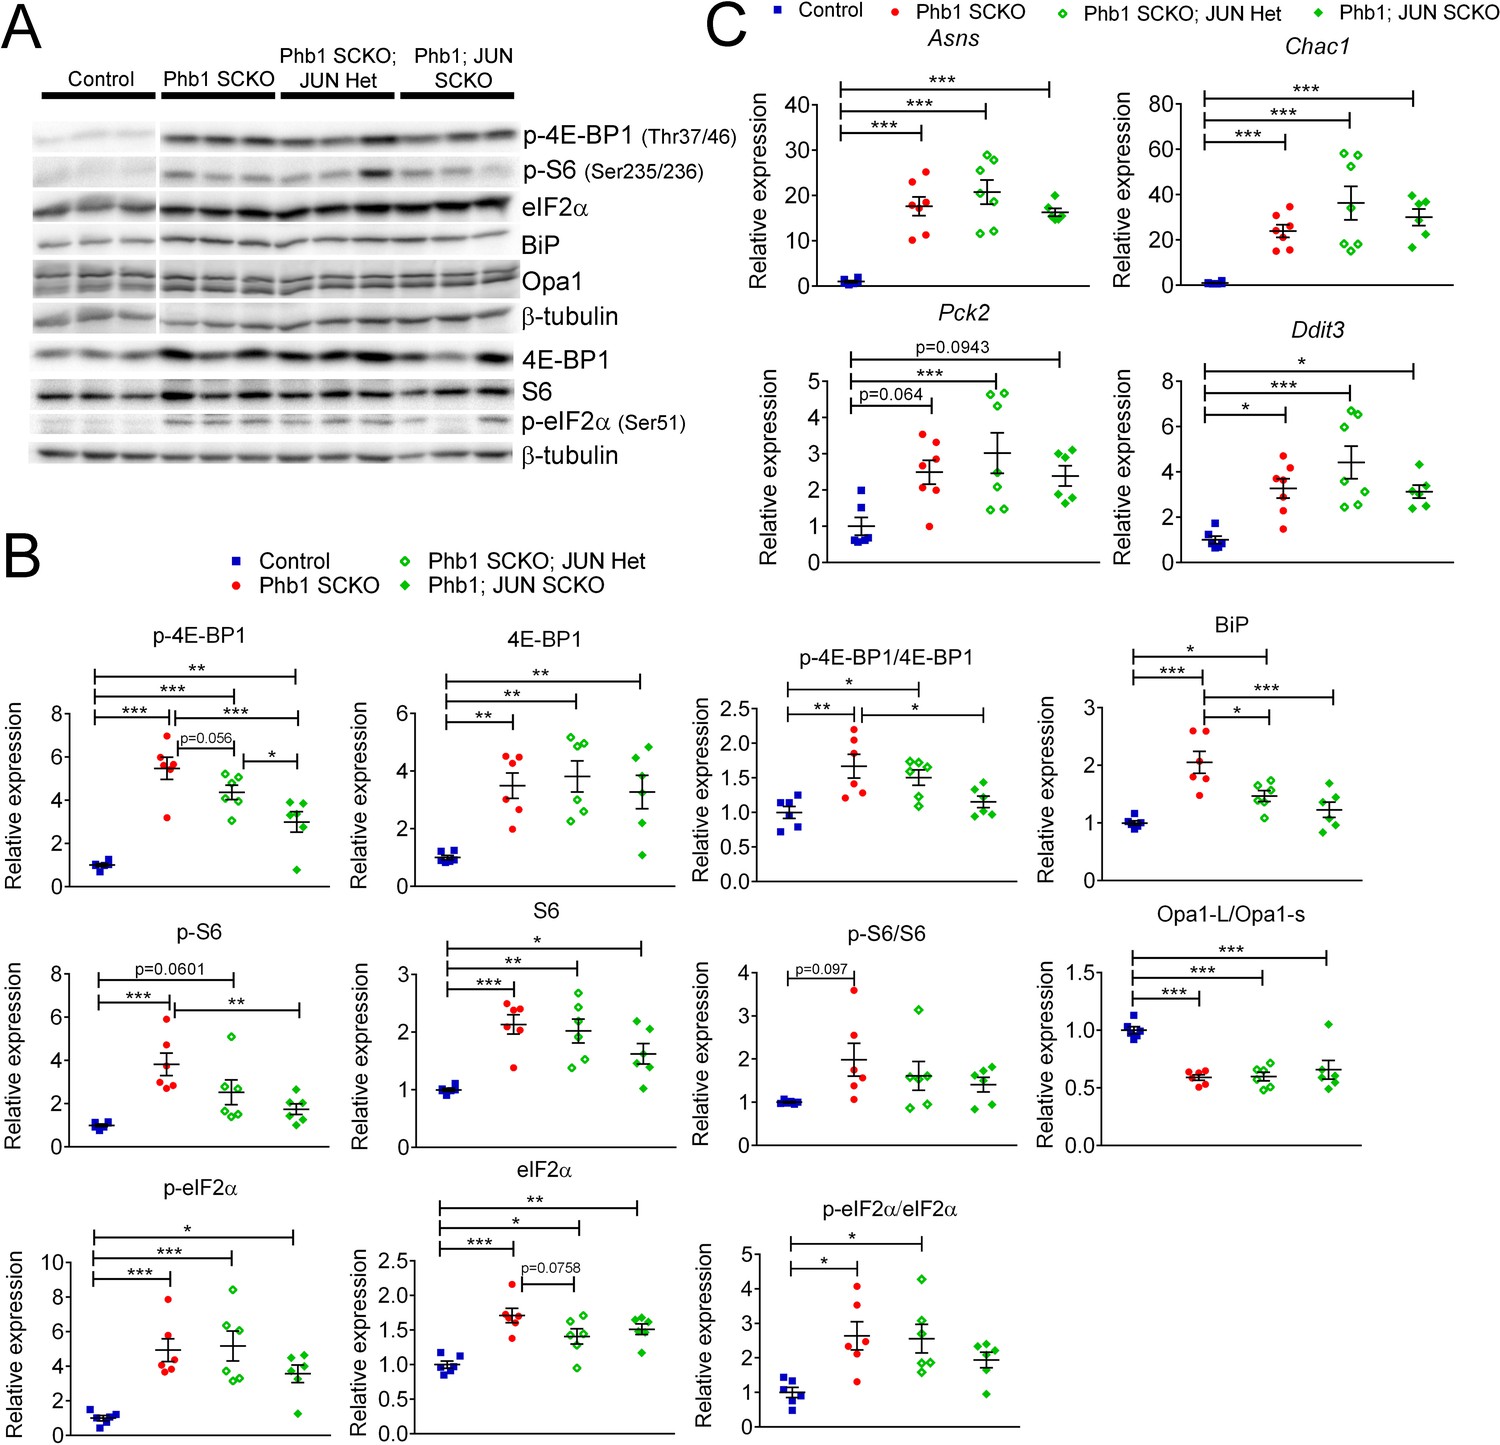
Effect of c-Jun in the other pathways altered in PHB1-SCKO animals.
(A) Representative western blot from sciatic nerve lysates demonstrating the effect of deleting one or two Jun alleles in P40 Phb1-SCKO mice. (B) Quantification of the western blots illustrated in (A). N = 6 animals per group. One-way ANOVA corrected for multiple comparisons using the Holm-Sidak method. F (3, 20) p-4E-BP1 = 24.74, p < 0.0001; F (3, 20) 4E-BP1 = 7.933, p = 0.0011; F (3, 20) p-4E-BP1/4E-BP1 = 6.694, p = 0.0026; F (3, 20) p-S6 = 8.786, p = 0.0006; F (3, 20) S6 = 10.15, p = 0.0003; F (3, 20) p-S6/S6 = 2.363, p = 0.1017; F (3, 20) p-eIF2α = 10.02, p = 0.0003; F (3, 20) eIF2α = 11.33, p = 0.0001; F (3, 20) p-eIF2α/eIF2α = 5.557, p = 0.0061; F (3, 20) Opa1-L/Opa1-s = 15.66, p < 0.0001; F (3, 20) BiP = 12.87, p < 0.0001. (C) qRT-PCR of downstream targets of ATF4 in the ISR in P40 sciatic nerves. Ablation of Jun does not seem to have any effect on the ISR induced by deletion of Phb1. N = 6–7 animals per group. One-way ANOVA corrected for multiple comparisons using the Holm-Sidak method. F (3, 22) Asns = 20.97, p < 0.0001; F (3, 22) Chac1 = 10.76, p = 0.0001; F (3, 22) Pck2 = 4.725, p = 0.0108; F (3, 22) Ddit3 = 8.676, p = 0.0005. * p < 0.05, ** p < 0.01, *** p < 0.001.
-
Figure 6—figure supplement 1—source data 1
Raw data and annotated uncropped western blots from Figure 6—figure supplement 1.
- https://cdn.elifesciences.org/articles/66278/elife-66278-fig6-figsupp1-data1-v2.zip
-
Figure 6—figure supplement 1—source data 2
Raw data and statistical analyses for data in Figure 6—figure supplement 1.
- https://cdn.elifesciences.org/articles/66278/elife-66278-fig6-figsupp1-data2-v2.xlsx
Figure 6—figure supplement 2
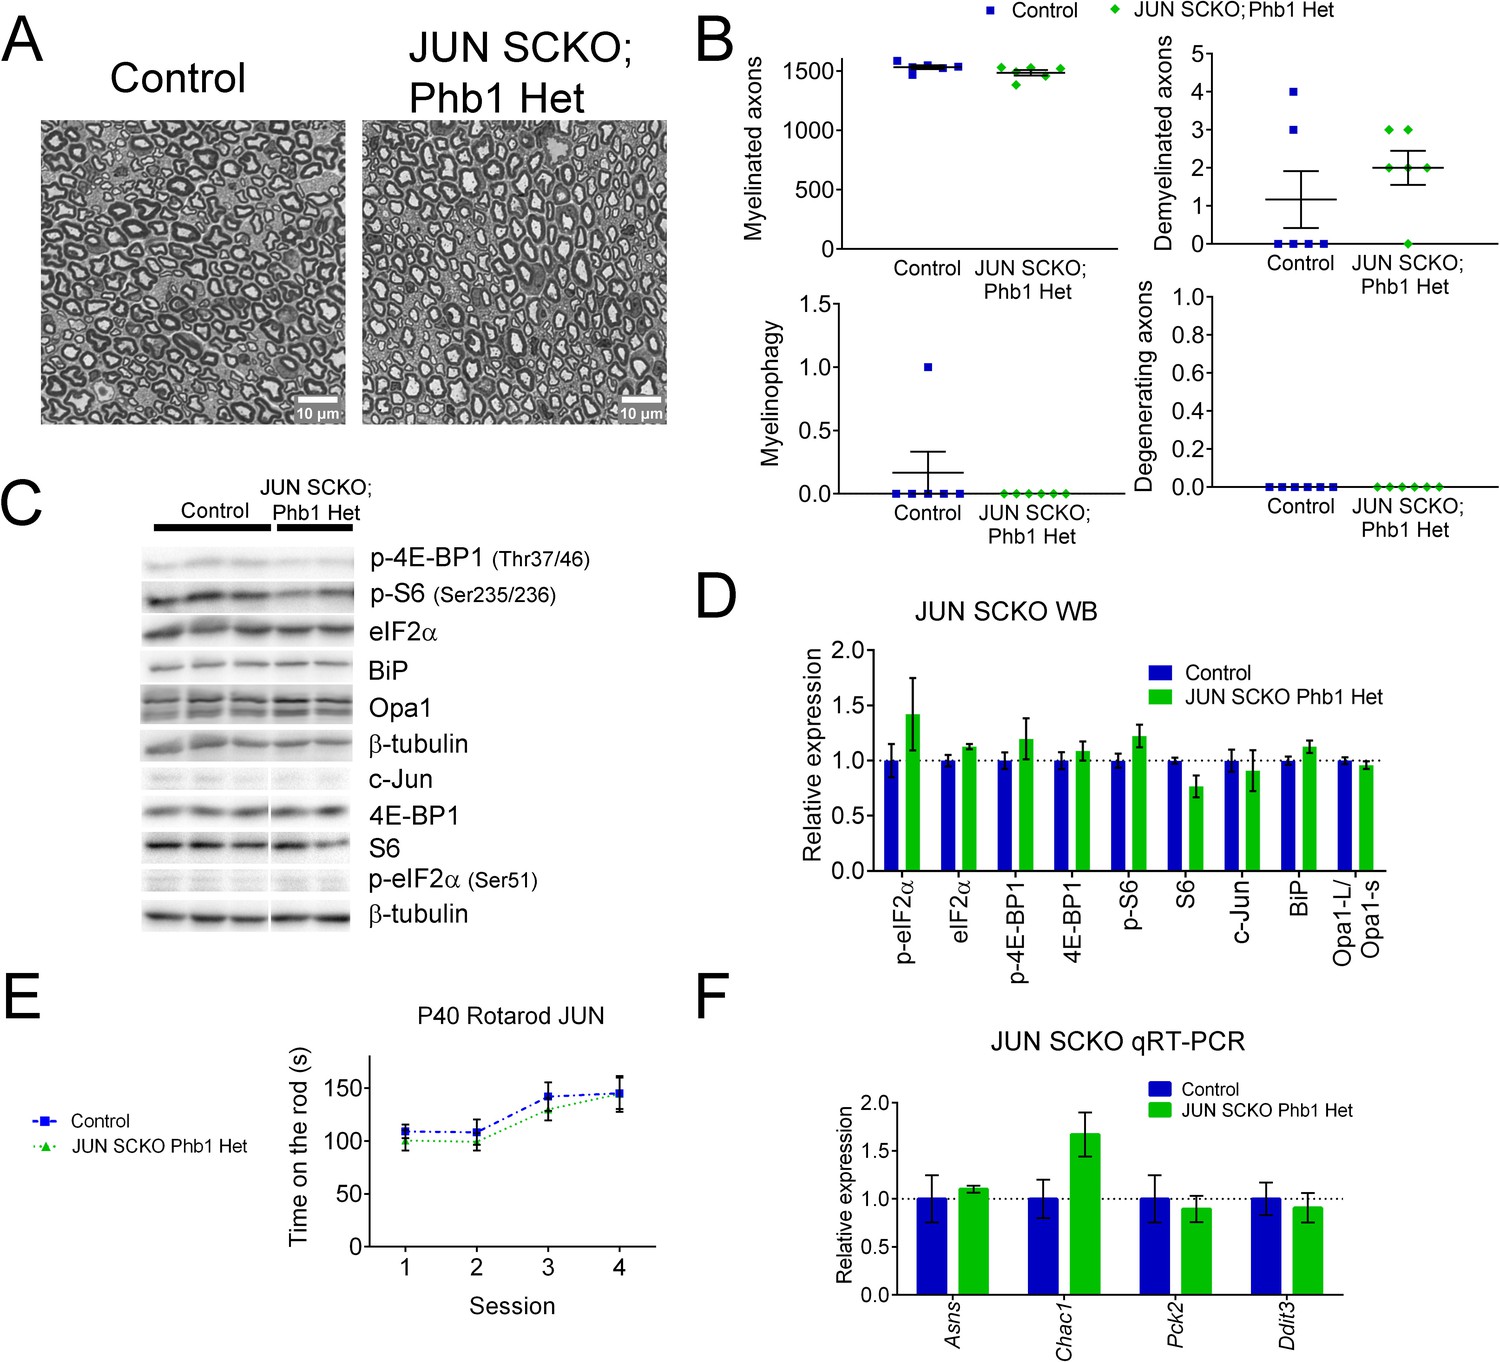
Deletion of Jun alone has no effect on the parameters analyzed.
(A) Representative semithin images of tibial nerves of control and JUN SCKO; Phb1 Het at P40 (B) Morphological parameters quantified from semithin images shows no difference between the two genotypes. N = 6 animals per genotype. Unpaired two-tailed t-test. Myelinated (t = 1.693, df = 10); Demyelinated (t = 0.9552, df = 10); Degenerating (no t-test possible because all values are identical) (C) Representative western blot of sciatic nerves at P40. (D) Quantification of (C). N = 4–6 animals per group. Unpaired two-tailed t-test corrected for multiple comparisons using the Holm-Sidak method. p-eIF2α (t = 1.3132, df = 8); eIF2α (t = 1.895, df = 8); p-4E-BP1 (t = 1.134, df = 8); 4E-BP1 (t = 0.75, df = 8); p-S6 (t = 1.973, df = 8); S6 (t = 2.743, df = 8); c-Jun (t = 0.469, df = 8); BiP (t = 1.952, df = 8); Opa1-L/Opa1-s (t = 0.875, df = 8). There are no statistically significant differences between the two groups. (E) There is no difference between genotypes in the motor performance evaluated with rotarod. N = 6 animals per group. Two-way ANOVA corrected for multiple comparisons using the Holm-Sidak method. F (3, 30) interaction = 0.2048, p = 0.892; F (3, 30) time = 15.31, p < 0.0001; F (1, 10) group = 0.2872, p = 0.604. (F) qRT-PCR of sciatic nerves at the same age shows no differences between the two groups. N = 4–6 animals per group. Unpaired two-tailed t-test corrected for multiple comparisons using the Holm-Sidak method. Asns (t = 0.404, df = 10); Chac1 (t = 2.215, df = 10); Pck2 (t = 0.37, df = 10); Ddit3 (t = 0.407, df = 10).
-
Figure 6—figure supplement 2—source data 1
Raw data and annotated uncropped western blots from Figure 6—figure supplement 2.
- https://cdn.elifesciences.org/articles/66278/elife-66278-fig6-figsupp2-data1-v2.zip
-
Figure 6—figure supplement 2—source data 2
Raw data and statistical analyses for data in Figure 6—figure supplement 2.
- https://cdn.elifesciences.org/articles/66278/elife-66278-fig6-figsupp2-data2-v2.xlsx
Figure 7 with 3 supplements
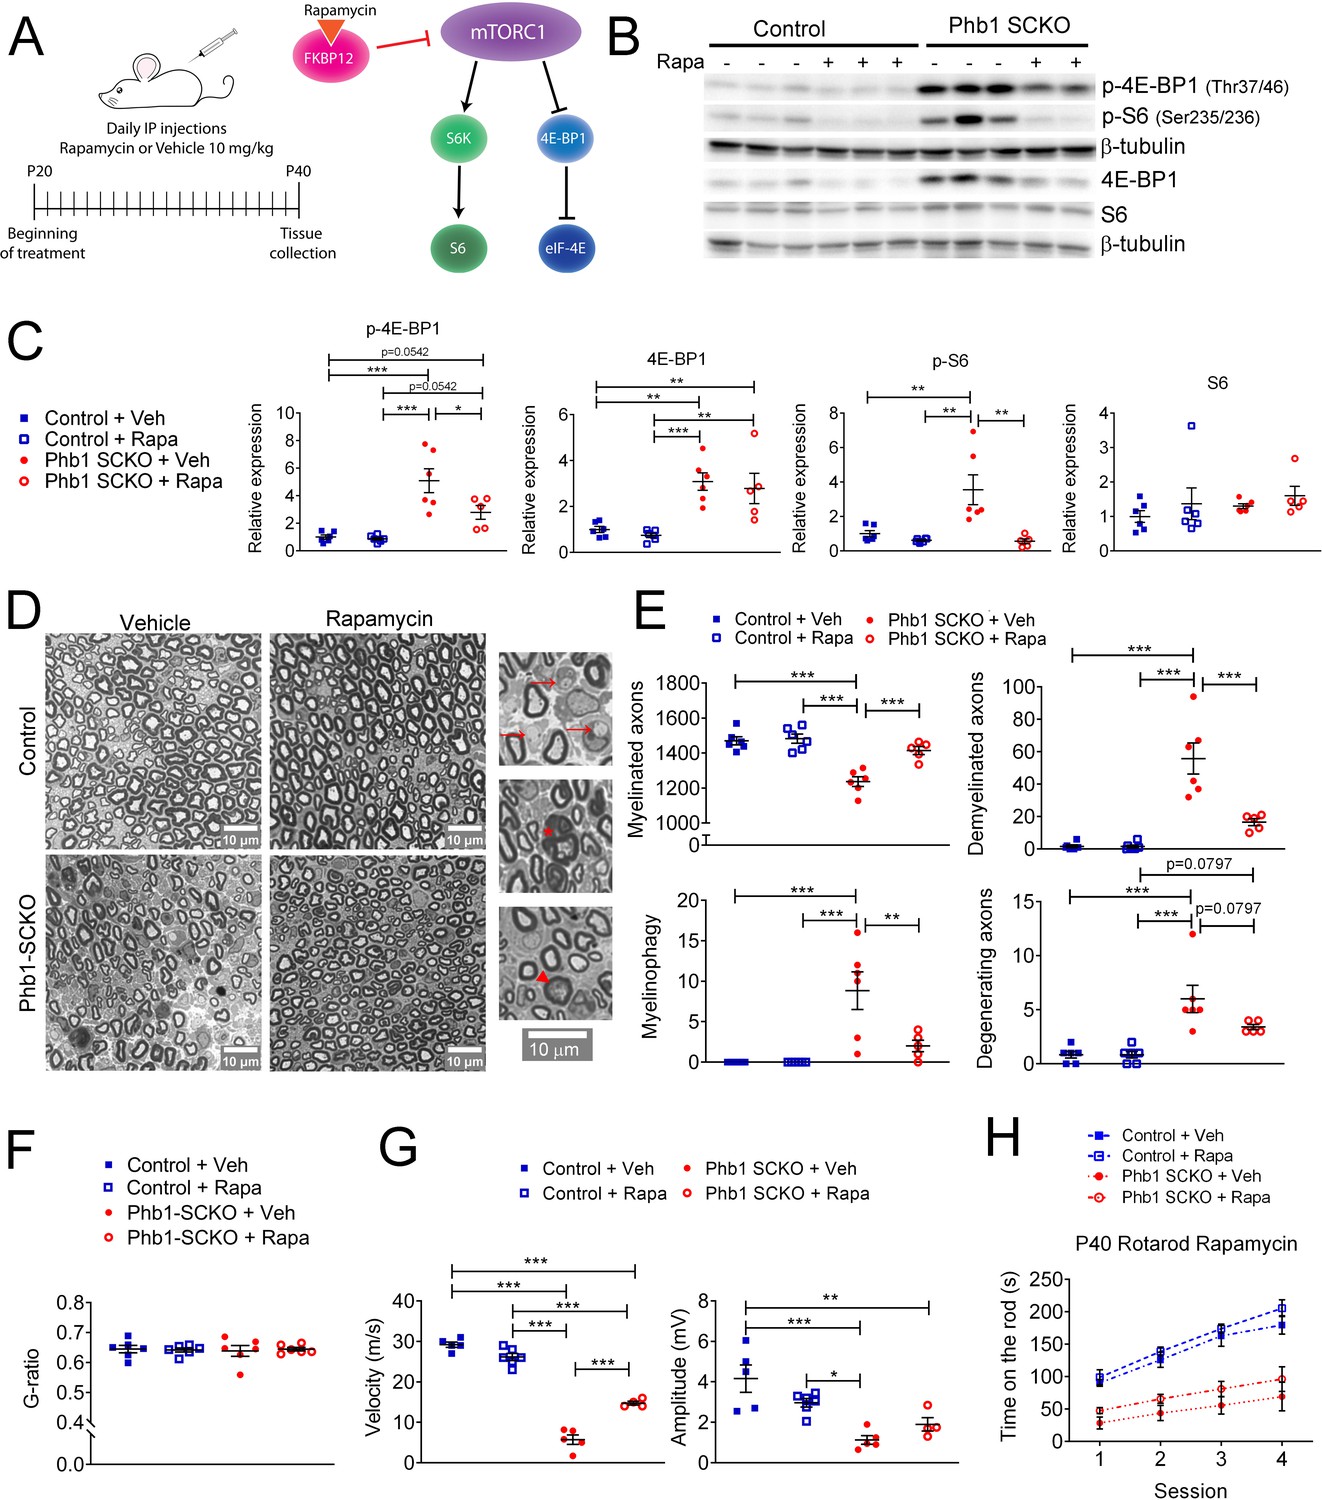
Inhibition of mTORC1 prevents demyelination in Phb1-SCKO mice.
(A) Schematics of the rapamycin treatment (left) and mechanism of action of rapamycin (right). (B) Representative western blot of sciatic nerve lysates demonstrating that rapamycin treatment reduces the phosphorylation of mTORC1 targets (S6 and 4E-BP1) in Phb1-SCKO mice. (C) Quantification of (B). N = 5–6 animals per group. Two-way ANOVA corrected for multiple comparisons using the Holm-Sidak method. p-4E-BP1: F (1, 19) interaction = 4.462, p = 0.0481; F (1, 19) rapa = 5.509, p = 0.0299; F (1, 19) group = 34.16, p < 0.0001. 4E-BP1: F (1, 19) interaction = 0.0038, p = 0.9514; F (1, 19) rapa = 0.618, p = 0.4414; F (1, 19) group = 33.58, p < 0.0001. p-S6: F (1, 19) interaction = 7.735, p = 0.0119; F (1, 19) rapa = 12.96, p = 0.0019; F (1, 19) group = 7.101, p = 0.0153. S6: F (1, 19) interaction = 0.01436, p = 0.9059; F (1, 19) rapa = 1.373, p = 0.2558; F (1, 19) group = 0.8633, p = 0.3645. (D) Representative tibial nerve sections of the four experimental groups. Insets: Representative images of demyelinated axons (arrows), degenerating axon (arrowhead) and myelinophagy (star). (E) Quantitative analysis of morphological parameters. Rapamycin treatment is able to reduce the number of demyelinated axons and SCs degrading myelin (myelinophagy), as well as increase the number of myelinated fibers in nerves of Phb1-SCKO animals. N = 5–6 animals per group. Two-way ANOVA corrected for multiple comparisons using the Holm-Sidak method. Myelinated: F (1, 19) interaction = 10.60, p = 0.0042; F (1, 19) rapa = 14.05, p = 0.0014; F (1, 19) group = 35.45, p < 0.0001. Demyelinated: F (1, 19) interaction = 14.32, p = 0.0013; F (1, 19) rapa = 14.57, p = 0.0012; F (1, 19) group = 45.02, p < 0.0001. Myelinophagy: F (1, 19) interaction = 7.333, p = 0.0139; F (1, 19) rapa = 7.333, p = 0.0139; F (1, 19) group = 18.43, p = 0.0004. Degenerating: F (1, 19) interaction = 3.344, p = 0.0832; F (1, 19) rapa = 3.344, p = 0.0832; F (1, 19) group = 29.59, p < 0.0001. (F) There is no alteration of myelin thickness (measured by g-ratio = axon diameter/ fiber diameter). N = 5–6 animals per group. Two-way ANOVA corrected for multiple comparisons using the Holm-Sidak method. F (1, 20) interaction = 0.1384, p = 0.7137; F (1, 20) rapa = 0.01424, p = 0.9062; F (1, 20) group = 0.01779, p = 0.8952. (G) Rapamycin is also able to ameliorate the nerve conduction velocity of mice lacking Phb1, but has no effect on CMAP amplitude. N = 4–6 animals per group. Two-way ANOVA corrected for multiple comparisons using the Holm-Sidak method. NCV: F (1, 16) interaction = 46.01, p < 0.0001; F (1, 20) rapa = 0.01424, p = 0.9062; F (1, 20) group = 0.01779, p = 0.8952. Amplitude: F (1, 16) interaction = 5.966, p = 0.0266; F (1, 16) rapa = 0.2774, p = 0.6057; F (1, 16) group = 25.98, p = 0.0001. (H) Phb1-SCKO mice treated with rapamycin show a trend toward improved performance in the rotarod. N = 6 animals per group. Two-way ANOVA corrected for multiple comparisons using the Holm-Sidak method. F (9, 60) interaction = 3.038, p = 0.0047; F (3, 60) time = 58.01, p < 0.0001; F (3, 20) group = 24.84, p < 0.0001. * p< 0.05, ** p < 0.01, *** p < 0.001.
-
Figure 7—source data 1
Raw data and annotated uncropped western blots from Figure 7.
- https://cdn.elifesciences.org/articles/66278/elife-66278-fig7-data1-v2.zip
-
Figure 7—source data 2
Raw data and statistical analyses for data in Figure 7.
- https://cdn.elifesciences.org/articles/66278/elife-66278-fig7-data2-v2.xlsx
Figure 7—figure supplement 1
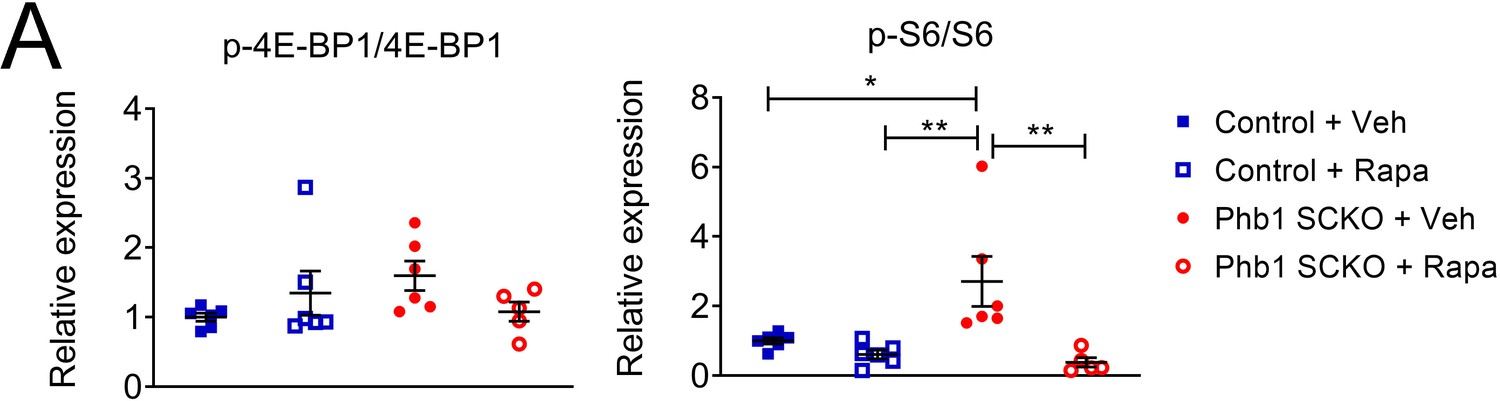
Effect of rapamycin on the ratio of phosphorylated to total 4E-BP1 and S6.
(A) Quantification of the western blot in Figure 7B. N = 5–6 animals per group. Two-way ANOVA corrected for multiple comparisons using the Holm-Sidak method. p-4E-BP1/4E-BP1: F (1, 19) interaction = 4.162, p = 0.056; F (1, 19) rapa = 0.162, p = 0.692; F (1, 19) group = 0.606, p = 0.445. p-S6/S6: F (1, 19) interaction = 0.023, p = 0.0481; F (1, 19) rapa = 12.11, p = 0.0025; F (1, 19) group = 3.601, p = 0.073. * p < 0.05, ** p < 0.01.
-
Figure 7—figure supplement 1—source data 1
Raw data and statistical analyses for data in Figure 7—figure supplement 1.
- https://cdn.elifesciences.org/articles/66278/elife-66278-fig7-figsupp1-data1-v2.xlsx
Figure 7—figure supplement 2
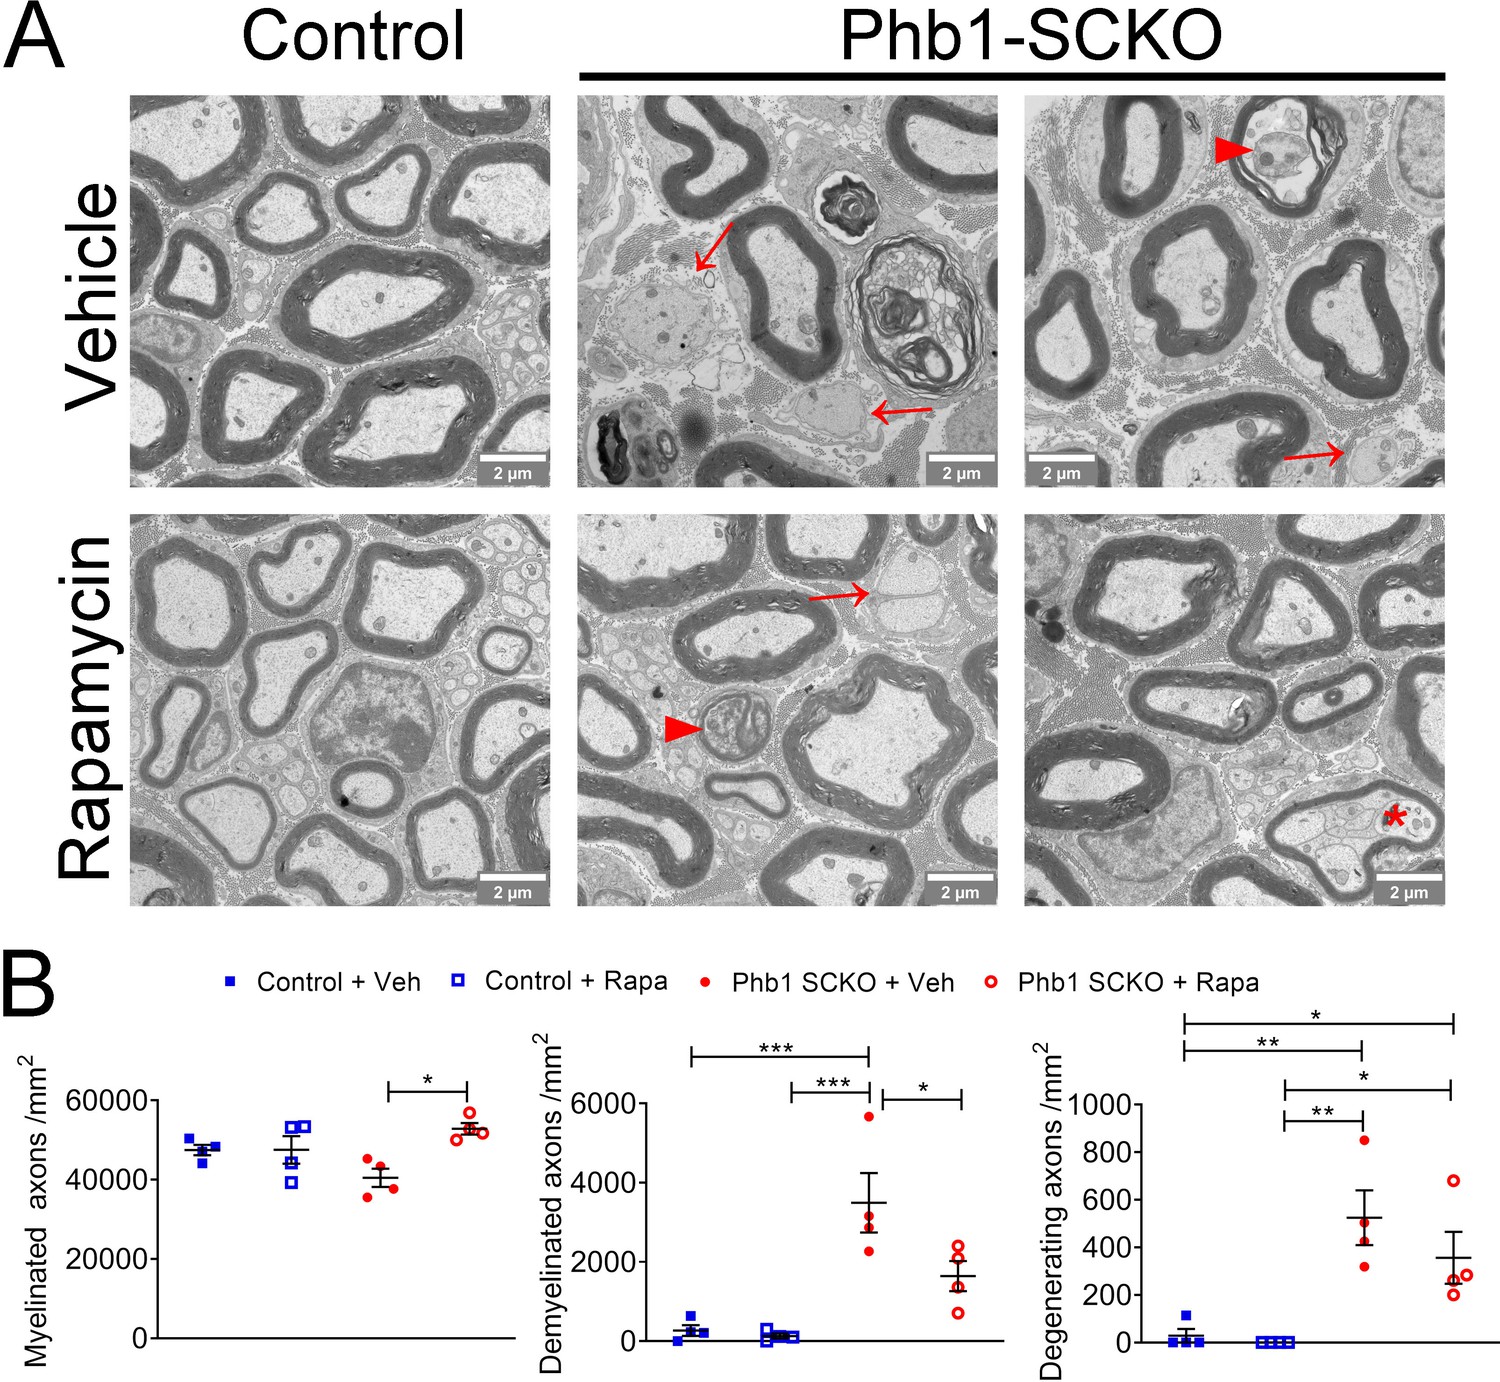
Rapamycin is effective at preventing demyelination in Phb1-SCKO mice, but does not seem to affect axonal degeneration.
(A) Representative electron micrographs of tibial nerves of P40 animals of the four experimental groups. Demyelinated axons are indicated by arrows, degenerating axons are labeled by arrowheads, and an aberrantly myelinated Remak bundle is indicated with an asterisk. (B) Assessment of the morphological findings in (A) revealed that rapamycin-treated Phb1-SCKO mice show reduced demyelination compared to vehicle-treated Phb1-SCKO animals. On the other hand, rapamycin had no significant effect on axon degeneration as quantified by this analysis. N = 4 animals per group. Two-way ANOVA corrected for multiple comparisons using the Holm-Sidak method. Myelinated: F (1, 12) interaction = 7.152, p = 0.02; F (1, 12) rapa = 7.242, p = 0.02; F (1, 12) group = 0.132, p = 0.722. Demyelinated: F (1, 12) interaction = 4.03, p = 0.068; F (1, 12) rapa = 5.441, p = 0.038; F (1, 12) group = 30.84, p = 0.0001. Degenerating: F (1, 12) interaction = 0.752, p = 0.403; F (1, 12) rapa = 1.486, p = 0.246; F (1, 12) group = 27.96, p = 0.0002. * p < 0.05, ** p < 0.01, *** p < 0.001.
-
Figure 7—figure supplement 2—source data 1
Raw data and statistical analyses for data in Figure 7—figure supplement 2.
- https://cdn.elifesciences.org/articles/66278/elife-66278-fig7-figsupp2-data1-v2.xlsx
Figure 7—figure supplement 3
The role of mTORC1 in the modulation of the other pathways investigated in this work.
(A) Representative western blot from sciatic nerve lysates of P40 Phb1-SCKO mice and controls treated with rapamycin or vehicle. (B) Quantification of the western blots illustrated in (A). N = 5–6 animals per group. Two-way ANOVA corrected for multiple comparisons using the Holm-Sidak method. c-Jun: F (1, 19) interaction = 1.930, p = 0.181; F (1, 19) rapa = 3.276, p = 0.0862; F (1, 19) group = 43.56, p < 0.0001. p-eIF2α: F (1, 19) interaction = 1.778, p = 0.199; F (1, 19) rapa = 6.878, p = 0.0173; F (1, 19) group = 117.7, p < 0.0001. eIF2α: F (1, 19) interaction = 1.538, p = 0.23; F (1, 19) rapa = 0.1899, p = 0.0173; F (1, 19) group = 2.339, p = 0.143. p-eIF2α/eIF2α: F (1, 19) interaction = 0.282, p = 0.602; F (1, 19) rapa = 0.597, p = 0.0173; F (1, 19) group = 18.16, p = 0.0004. BiP: F (1, 19) interaction = 2.442, p = 0.135; F (1, 19) rapa = 23.85, p = 0.0001; F (1, 19) group = 11.97, p = 0.0026. Opa1-L/Opa1-s: F (1, 19) interaction = 13.16, p = 0.0018; F (1, 19) rapa = 6.821, p = 0.0169; F (1, 19) group = 339.7, p < 0.0001. (C) qRT-PCR of downstream targets of ATF4 in the ISR in P40 sciatic nerves. There is no effect of rapamycin treatment, with the exception of an inhibition of the expression of Ddit3. N = 5–6 animals per group. Two-way ANOVA corrected for multiple comparisons using the Holm-Sidak method. Asns: F (1, 19) interaction = 0.0219, p = 0.884; F (1, 19) rapa = 0.31, p = 0.5842; F (1, 19) group = 132.4, p < 0.0001. Chac1: F (1, 19) interaction = 0.9956, p = 0.331; F (1, 19) rapa = 1.157, p = 0.296; F (1, 19) group = 119.7, p < 0.0001. Pck2: F (1, 19) interaction = 1.929, p = 0.181; F (1, 19) rapa = 2.598, p = 0.123; F (1, 19) group = 67.51, p < 0.0001. Ddit3: F (1, 19) interaction = 0.2831, p = 0.601; F (1, 19) rapa = 12.4, p = 0.0023; F (1, 19) group = 92.39, p < 0.0001. * p < 0.05, ** p < 0.01, *** p < 0.001.
-
Figure 7—figure supplement 3—source data 1
Raw data and annotated uncropped western blots from Figure 7—figure supplement 3.
- https://cdn.elifesciences.org/articles/66278/elife-66278-fig7-figsupp3-data1-v2.zip
-
Figure 7—figure supplement 3—source data 2
Raw data and statistical analyses for data in Figure 7—figure supplement 3.
- https://cdn.elifesciences.org/articles/66278/elife-66278-fig7-figsupp3-data2-v2.xlsx
Figure 8
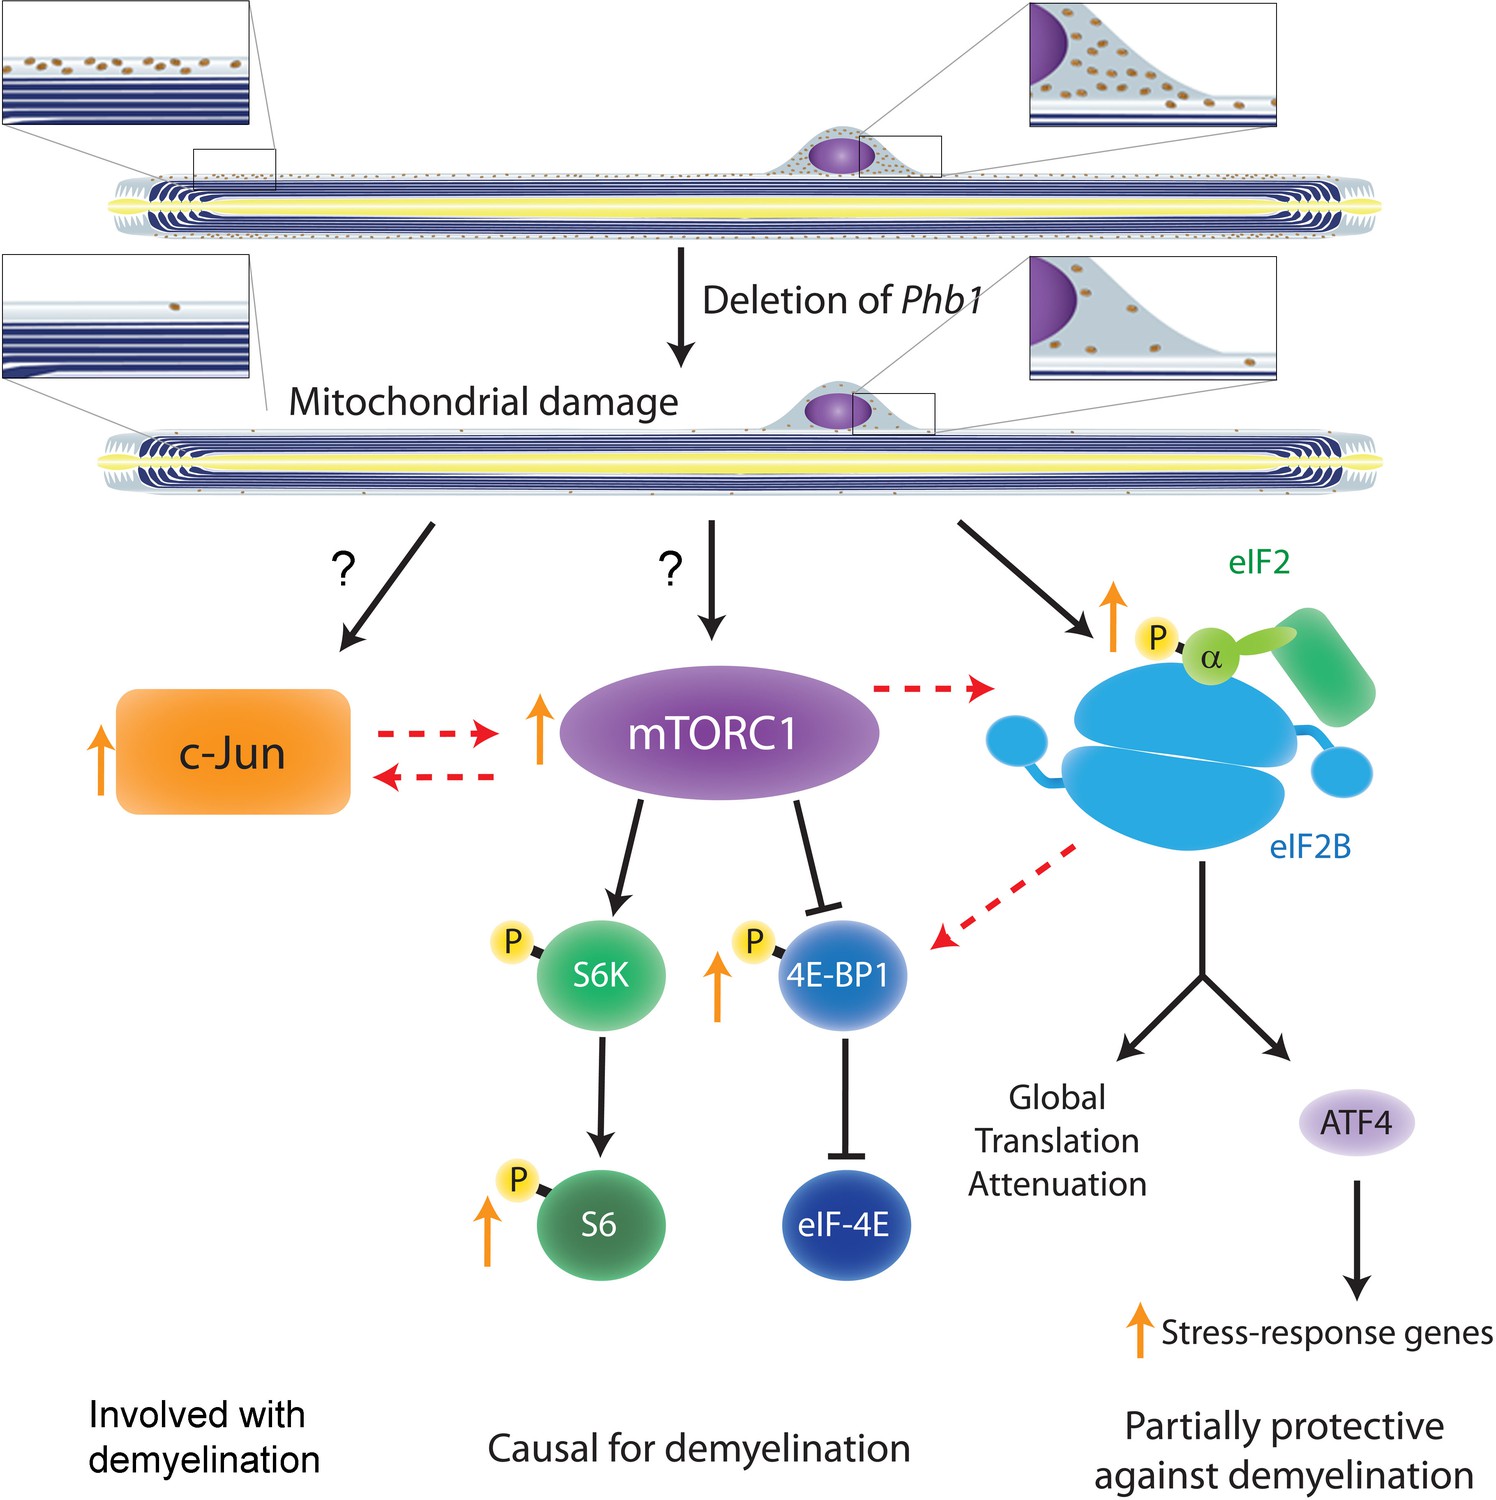
Crosstalk between the pathways investigated in the current study and in Della-Flora Nunes et al., 2021.
Ablation of Phb1 in SCs leads to severe perturbations to mitochondrial morphology and function, which in turn cause activation of the ISR in myelinating SCs (right). These SCs also upregulate c-Jun (left) and activate mTORC1 (center), a response that is directly or indirectly associated to the mitochondrial damage. All these pathways partially modulate each other, with mTORC1 playing the most central role and being causal for demyelination. c-Jun may also participate in demyelination and is key in the nerve repair response, while the ISR is partially protective against demyelination. Discontinuous arrows = partial effects; blunt arrows = inhibition; orange arrows = responses identified in our analyses of Phb1-SCKO mice.
Additional files
Download links
A two-part list of links to download the article, or parts of the article, in various formats.
Downloads (link to download the article as PDF)
Open citations (links to open the citations from this article in various online reference manager services)
Cite this article (links to download the citations from this article in formats compatible with various reference manager tools)
Activation of mTORC1 and c-Jun by Prohibitin1 loss in Schwann cells may link mitochondrial dysfunction to demyelination
eLife 10:e66278.
https://doi.org/10.7554/eLife.66278


