Tetrahydroxanthohumol, a xanthohumol derivative, attenuates high-fat diet-induced hepatic steatosis by antagonizing PPARγ
- School of Biological and Population Health Sciences, Nutrition Program, Linus Pauling Institute, Oregon State University, United States
- Department of Animal Sciences, Linus Pauling Institute, Oregon State University, United States
- Department of Pharmaceutical Sciences, Linus Pauling Institute, Oregon State University, United States
- Department of Microbiology, Oregon State University, United States
- Department of Biochemistry and Biophysics, Oregon State University, United States
- Department of Biomedical Science, Carlson College of Veterinary Medicine, United States
- School of Biological and Population Health Sciences, Kinesiology Program, Oregon State University, United States
- Department of Microbiology, Department of Statistics, Oregon State University, United States
- Department of Chemistry, Linus Pauling Institute, Oregon State University, United States
- Linus Pauling Institute, Department of Biochemistry and Biophysics, Oregon State University, United States
Figures
Figure 1
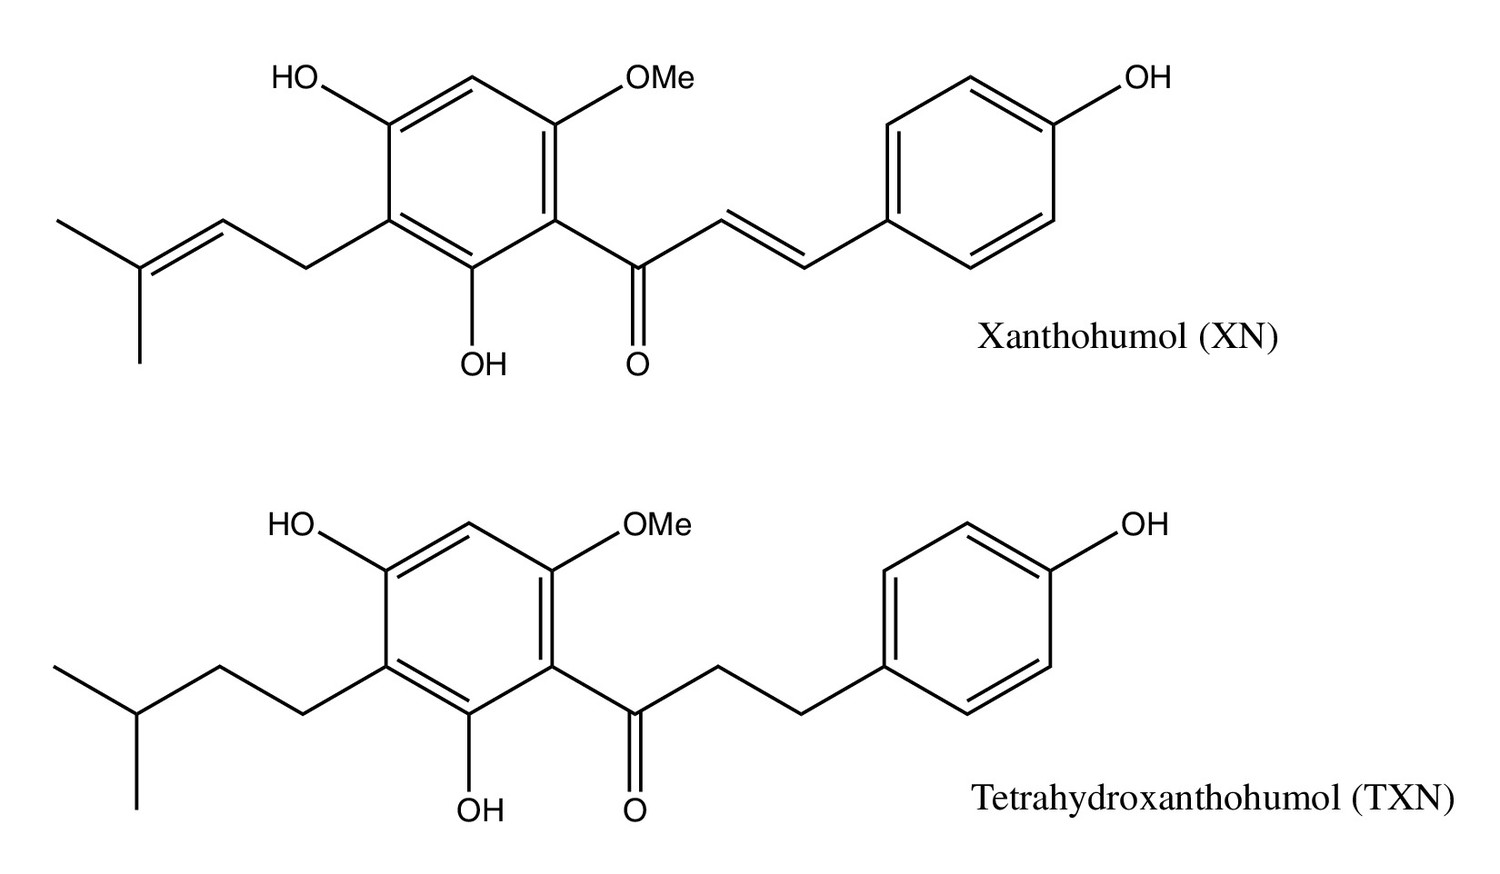
Structures of XN and its synthetic derivative, TXN.
Figure 2 with 1 supplement
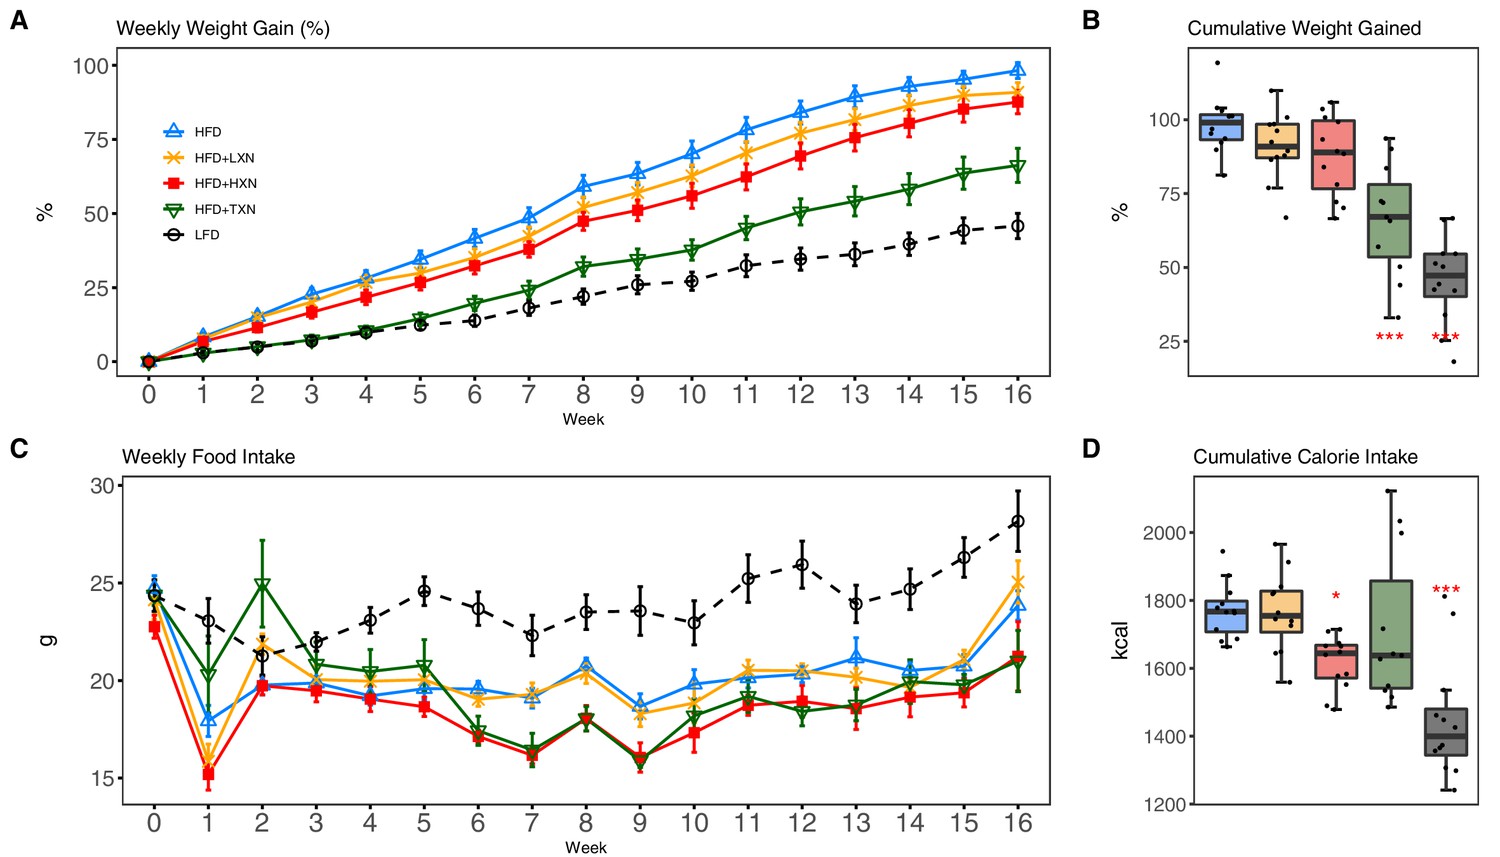
TXN and HXN suppress HFD-induced BW gain independent of caloric intake.
Mice were fed either a LFD (black dashed line with empty circles, n = 12), a HFD (blue solid line with empty triangles, n = 12), HFD+LXN (yellow solid line with crosses, n = 12), HFD+HXN (red solid line with squares, n = 12), or HFD+TXN (green solid line with empty triangles, n = 11) for 16 weeks. (A) BW gain was assessed once per week. Data is expressed as means ± SEM. Repeated measurement of ANOVA was used to calculate p-values for the percentage of weight gained weekly. (B) Total percent BW gained at the end of the 16-week feeding period. Data is expressed as quartiles. (C) Food intake was assessed once per week during the 16 week feeding period. Data is expressed as means ± SEM. Repeated measurement of ANOVA was used to calculate p-values for weekly food intake. (D) Total calories consumed at the end of 16 week f eeding period. Data are expressed as quartiles. Source files of data used for the analysis and visualization are available in the Figure 2—source data 1.
-
Figure 2—source data 1
Source files.
This zip archive contains the following: (1) One Comma Separated Values file named ‘phenome_feeding.csv’ contains food intake and weight entries. (2) One Excel workbook named ‘2019TXN_repeated_measures_YZGB.xlsx’ contains repeated measures analyses. (3) The Jupyter Notebook contains scripts used for statistical analysis and generation of Figure 2. (4) Figure 2—figure supplement 1 folder. A Comma Separated Values file named ‘AUC2.csv’ phenotypic data directly pertaining to Figure 2—figure supplement 1. • A Comma Separated Values file named ‘fast.csv’ phenotypic data directly pertaining to Figure 2—figure supplement 1. A Jupyter Notebook file contains scripts used for statistical analysis and generation of Figure 2—figure supplement 1. A Comma Separated Values file named ‘GTT2.csv’ phenotypic data directly pertaining to Figure 2—figure supplement 1. A pdf file named ‘GTT.pdf’.
- https://cdn.elifesciences.org/articles/66398/elife-66398-fig2-data1-v1.zip
Figure 2—figure supplement 1

TXN supplementation significantly improves glucose homeostasis in HFD-induced obese mice.
(A) IP-GTT at week 9. Mice (n = 11–12) were fasted for 5 hr and received a glucose bolus (2 g/kg; 20% glucose solution, w/v) through i.p. injection. Average injection volume was 80.7 ± 2.0 µl, 79.6 ± 2.3 µl, 74.5 ± 2.1 µl, 67.1 ± 2.0 µl, and 62.8 ± 1.3 µl for HFD, HFD+LXN, HFD+HXN, HFD+TXN, and LFD mice, respectively. Circulating glucose levels were measured with AlphaTRAK2 blood glucose test strips and AlphaTRAK2 glucometer with cat setting (Zoetis Inc, MI) at 0 (before the injection), 15 min, 30 min, 1 hr, and 2 hr after the injection by tail puncture with a 28-gauge lancet. Data is expressed as means ± se. (B) Total area under the curve (AUC) was calculated using the trapezoid rule and expressed in the unit ‘mg/dl x min’. Data is expressed as means ± se. Pre-planned general linear model with contrasts were used on the squared root of the total AUCs to calculate p-values. *p<0.05, **p<0.01, ***p≤0.001. (C) Fasting plasma glucose level, (D) fasting insulin level, and (E) HOMA-IR at week 16 of feeding. Data is expressed as quartiles. Pre-planned general linear model with contrasts was used to calculate p-values. *p<0.05, **p<0.01, ***p≤0.001.
Figure 3 with 2 supplements
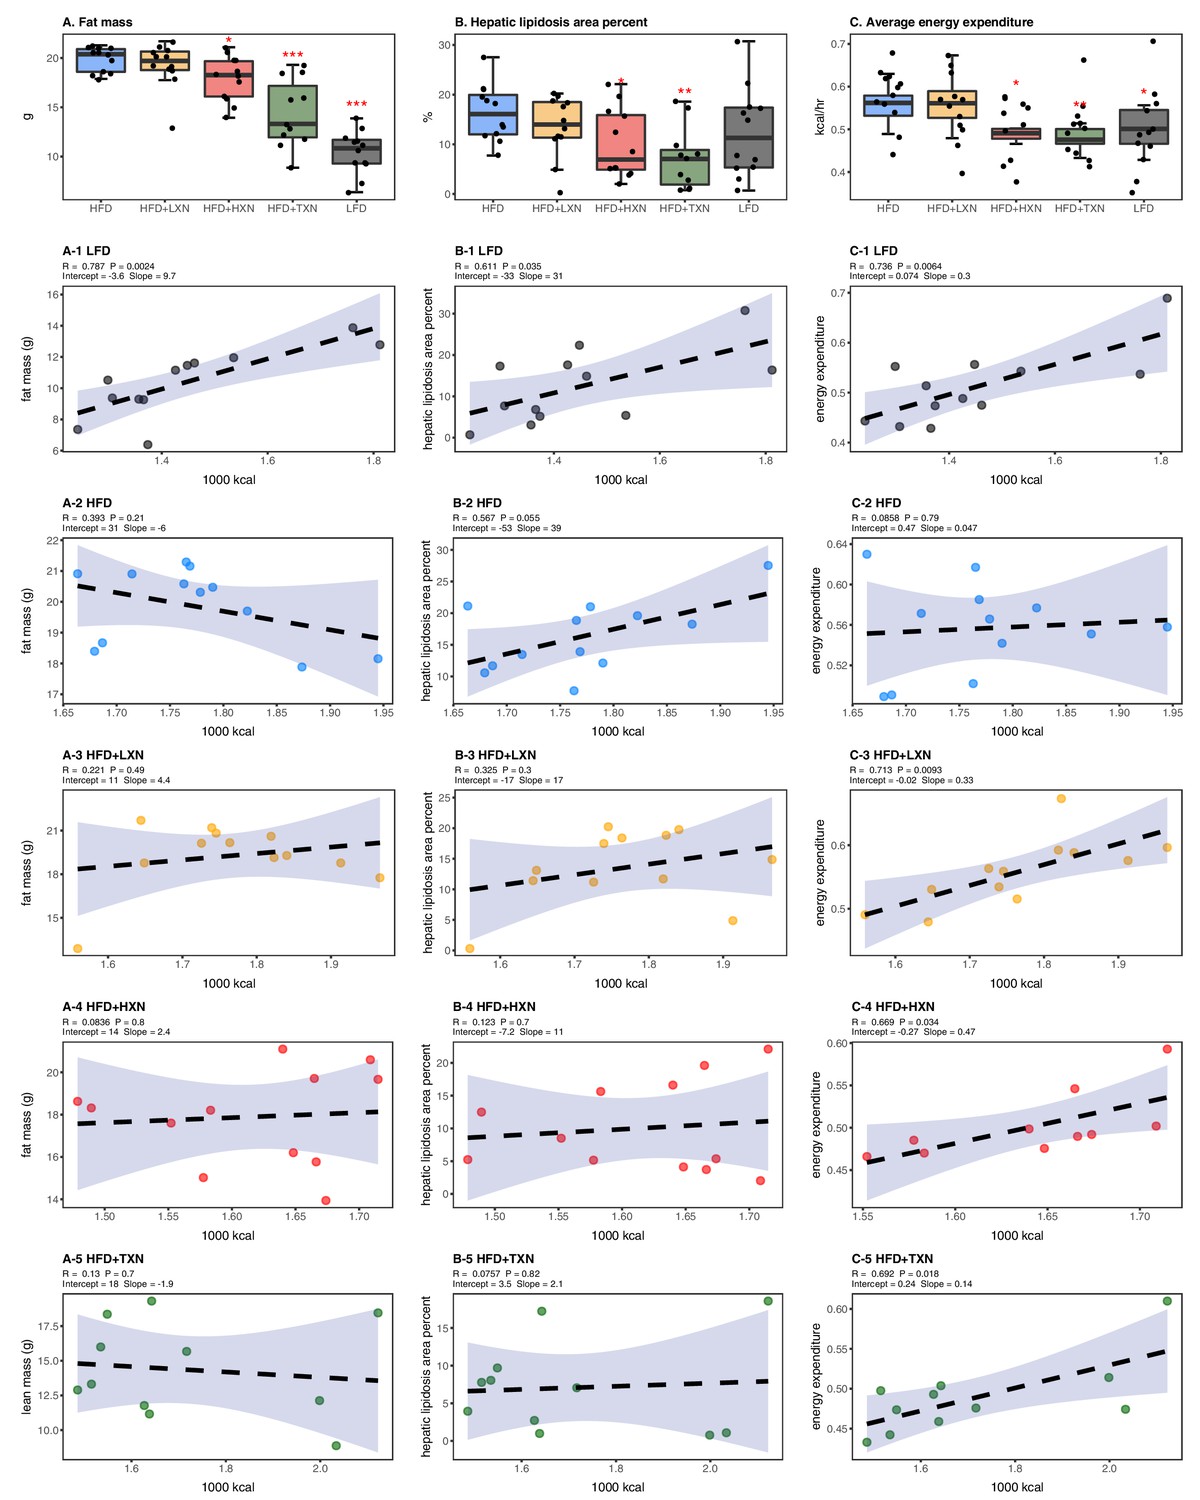
Energy homeostasis imbalance induced by HFD is prevented by XN and TXN supplementation.
Mice were fed either a LFD (black, n = 12), a HFD (blue, n = 12), HFD+LXN (yellow, n = 12), HFD+HXN (red, n = 12), or HFD+TXN (green, n = 11) for 16 weeks. (A) Total fat mass measured by DXA scan 2 days prior to necropsy is expressed as quartiles. (A-1) Relationship between total fat mass and total caloric intake over 16 weeks of feeding for LFD; (A-2) HFD; (A-3) HFD+LXN; (A-4) HFD+HXN; and (A-5) HFD+TXN groups. (B) Hepatic lipidosis area percent expressed as quartiles. (B-1) Relationship between hepatic lipidosis area percent and total caloric intake over 16 weeks of feeding for LFD; (B-2) HFD; (B-3) HFD+LXN; (B-4) HFD+HXN; and (B-5) HFD+TXN groups. (C) Average energy expenditure over two light–dark cycles (48 hr) obtained using metabolic cages and expressed as quartiles. (C-1) Relationship between energy expenditure and total caloric intake over 16 weeks of feeding for LFD; (C-2) HFD; (C-3) HFD+LXN; (C-4) HFD+HXN (with removal of two outliers); (C-5) for HFD+TXN groups. Pre-planned general linear model with contrasts were used to calculate p-values in (A), (B), and (C). *p<0.05, **p<0.01, ***p<0.001. Linear regression analyses of total calories versus total fat mass (A1-5), hepatic lipidosis area percent (B1-5), and average energy expenditure (C1-5) in mice were done using stats package version 3.6.2 in R. Blue shading represents 95% CI of the regression line. Absolute values of R, p-value, intercept, and slope for the regression are reported above each corresponding panel. Source files of data used for the analysis are available in the Figure 3—source data 1.
-
Figure 3—source data 1
Source files.
This zip archive contains the following: (1) One Comma Separated Values file named ‘metabolicGasExchange.csv’ contains metabolic cage gas exchange data. (2) One Comma Separated Values file named ‘fig3_table.csv’ contains phenotypic data directly pertaining to Figure 3. (3) One Comma Separated Values file named ‘fig3_stat_corrected.csv’ contains corrected metabolic cage gas exchange data directly pertaining to Figure 3. (4) A Jupyter Notebook file contains scripts used for statistical analysis and generation of Figure 3. (5) An R script file ‘ggplotRegression.R’. (6) A folder named ‘Figure 3—figure supplement 1’ containing Figure 3—figure supplement 1. (a) One Comma Separated Values file named ‘metabolicGasExchange.csv’ contains metabolic cage gas exchange data. (b) One Comma Separated Values file named ‘supplement1Table.csv’ contains phenotypic data directly pertaining to Figure 3—figure supplement 1. (c) An R script file “ggplotRegression.R. (d) A Jupyter Notebook file contains scripts used for statistical analysis and generation of Figure 3—figure supplement 1. (7) A folder named ‘Fig3Sup2’ containing Figure 3—figure supplement 2. (a) One Comma Separated Values file named ‘supplement2Table.csv’ contains phenotypic data directly pertaining to Figure 3—figure supplement 2. (b) An R script file ggplotRegression.R. (c) A Jupyter Notebook file contains scripts used for statistical analysis and generation of Figure 3—figure supplement 2.
- https://cdn.elifesciences.org/articles/66398/elife-66398-fig3-data1-v1.zip
Figure 3—figure supplement 1

Relationship of body mass and energy expenditure between (A) LFD and HFD; (B) LXN and HFD; (C) HXN and HFD; (D) TXN and HFD.
Energy expenditure was measured between weeks 10 and 14. Data was analyzed using analysis of covariance (ANCOVA) of body mass upon entry into the cages and diet. No statistically significant effect from treatments was detected. HFD data are from the same group of mice and are displayed as a reference on all four panels. Source files of data used for the analysis are available in Figure 3—source data 1.
Figure 3—figure supplement 2

The effect of diet and intervention on fasting plasma and fecal TAG levels.
Mice were fed either a LFD (black, n = 12), a HFD (blue, n = 12), HFD+LXN (yellow, n = 12), HFD+HXN (red, n = 12), or HFD+TXN (green, n = 11) for 16 weeks. (A) Fasting plasma TAG levels are expressed as quartiles. (A-1) Relationship between fasting plasma TAG and total caloric intake over 16 weeks of feeding for LFD group; (A-2) for HFD group; (A-3) for HFD+LXN group; (A-4) for HFD+HXN group; and (A-5) for HFD+TXN group. (B) Three day total fecal triglycerides (TAGs) are expressed as quartiles. (B-1) Relationship between 3 day fecal TAG and total caloric intake over 16 weeks of feeding for LFD group; (B-2) for HFD group; (B-3) for HFD+LXN group; (B-4) for HFD+HXN group; (B-5) for HFD+TXN group. Pre-planned general linear model with contrasts were used to calculate p-values in (A) and (B). *p<0.05, **p<0.01, ***p<0.001. Linear regression analyses of total calories versus fasting plasma TAG (A1-5) or total fecal TAG (B1-5) in mice were done using lm function of stats package version 3.6.2 in R. Blue shading represents 95% CI of the regression line. Absolute values of R, p-value, intercept, and slope for the regression are reported above each corresponding panel.
Figure 4

Effects of XN and TXN on food intake frequency, physical activity, and energy expenditure.
Mice were fed either a LFD (black, n = 12), a HFD (blue, n = 12), HFD+LXN (yellow, n = 12), HFD+HXN (red, n = 12), or HFD+TXN (green, n = 11) for 16 weeks. (A) Directed ambulatory locomotion per 24 hr cycle obtained using a computer-controlled indirect calorimetry system. Data expressed as quartiles. (A-1) Relationship between directed ambulatory locomotion and energy expenditure for LFD; (A-2) HFD; (A-3) HFD+LXN; (A-4) HFD+HXN, and (A-5) HFD+TXN groups. (B) Fine movements per 24 hr cycle calculated by subtracting directed ambulatory locomotion from sum of all distances traveled within the beam-break system. Data is expressed as quartiles. (B-1) Relationship between fine movements and energy expenditure for LFD; (B-2) HFD; (B-3) HFD+LXN; (B-4) HFD+HXN; and (B-5) HFD+TXN groups. (C) Number of food intake events recorded in metabolic cages. Data expressed as quartiles. (C-1) Relationship between number of food intake events and directed ambulatory locomotion for LFD; (C-2) HFD; (C-3) HFD+LXN; (C-4) HFD+HXN; and (C-5) for HFD+TXN groups. Pre-planned general linear model with contrasts were used to calculate p-values in (A), (B), and (C). *p<0.05, **p<0.01, ***p<0.001. Linear regression analyses of energy expenditure versus directed ambulatory locomotion (A1-5), fine movements (B1-5), and number of food intake events (C1-5) in mice were done using stats package version 3.6.2 in R. Blue shading represents 95% CI of the regression line. Absolute values of R, p-value, intercept, and slope for the regression are reported above each corresponding panel. Source files of data used for the analysis are available in the Figure 4—source data 1.
-
Figure 4—source data 1
Source files.
- https://cdn.elifesciences.org/articles/66398/elife-66398-fig4-data1-v1.zip
Figure 5
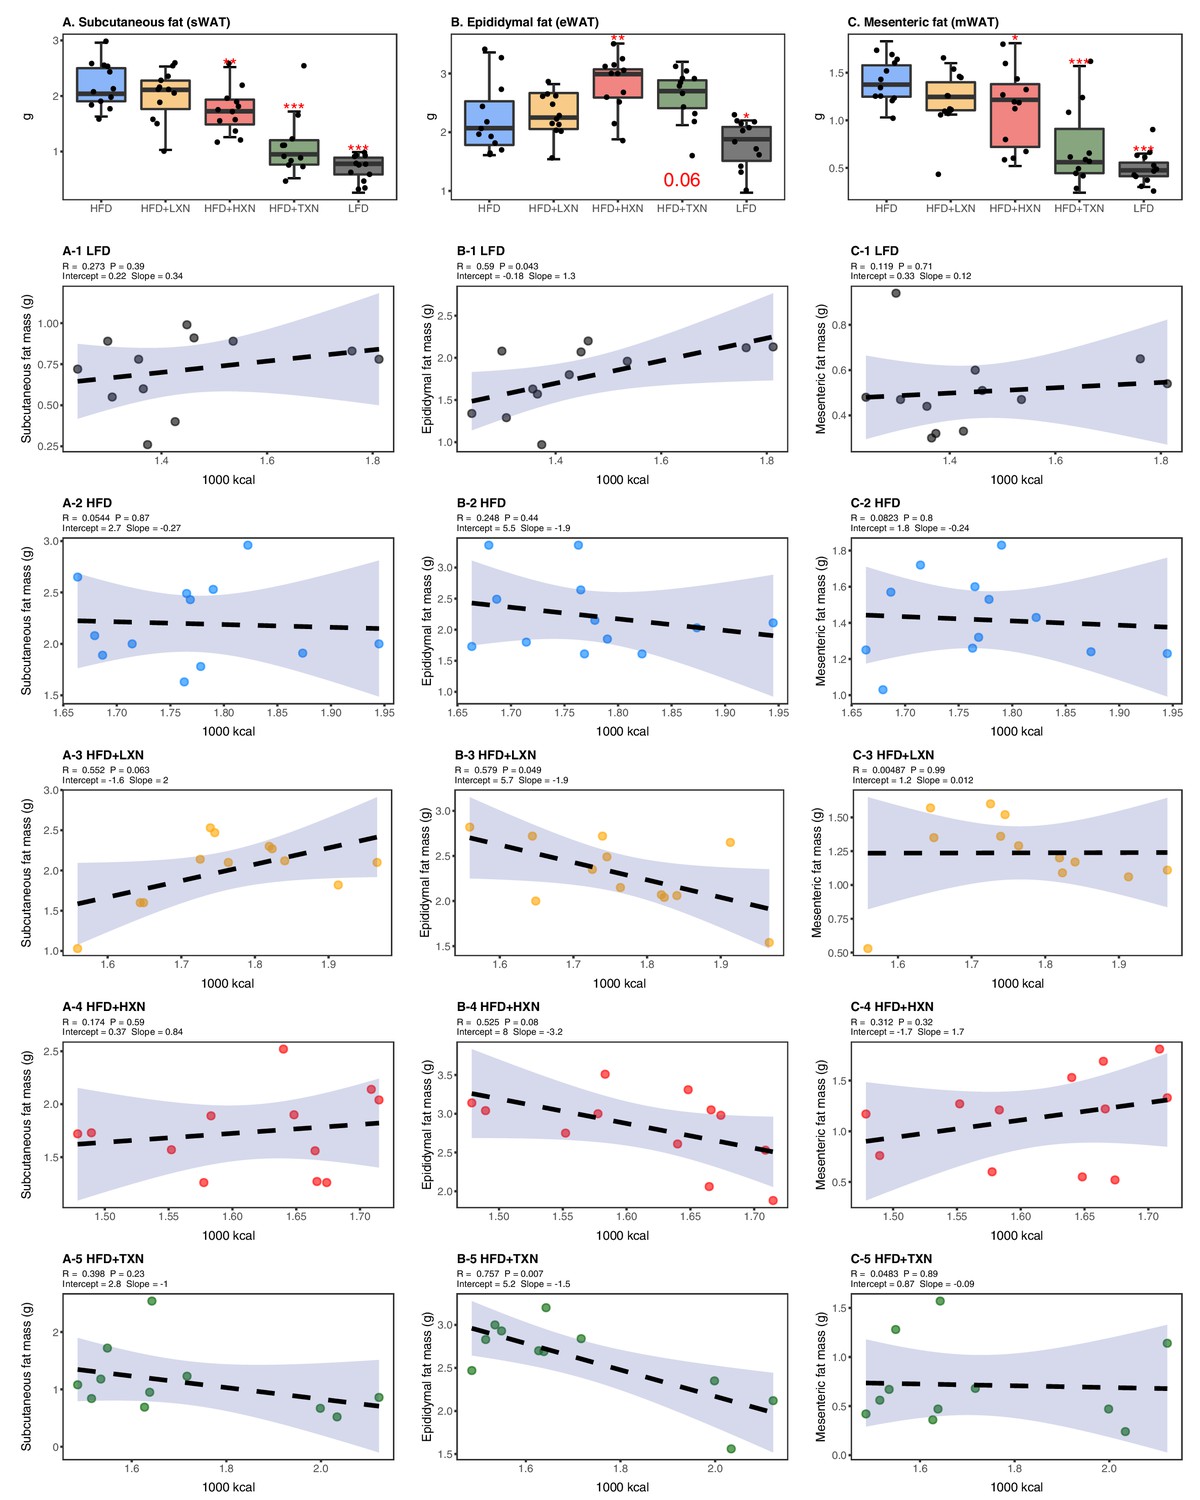
TXN decreases and alters the regional distribution of fat tissue accumulation.
Mice were fed either a LFD (black, n = 12), a HFD (blue, n = 12), HFD+LXN (yellow, n = 12), HFD+HXN (red, n = 12), or HFD+TXN (green, n = 11) for 16 weeks. All fat masses were weighed on day of necropsy. (A) sWAT fat mass expressed as quartiles. (A-1) Relationship between sWAT fat mass and total caloric intake over 16 weeks of feeding for LFD; (A-2) HFD; (A-3) HFD+LXN; (A-4) HFD+HXN; and (A-5) HFD+TXN groups. (B) eWAT fat mass expressed as quartiles. (B-1) Relationship between eWAT fat mass and total caloric intake over 16 weeks of feeding for LFD; (B-2) HFD; (B-3) HFD+LXN; (B-4) HFD+HXN; and (B-5) HFD+TXN groups. (C) mWAT fat mass expressed as quartiles. (C-1) Relationship between mWAT fat mass and total caloric intake over 16 weeks of feeding for LFD; (C-2) HFD; (C-3) HFD+LXN; (C-4) HFD+HXN (with removal of two outliers); and (C-5), and HFD+TXN groups. Pre-planned general linear model with contrasts were used to calculate p-values in (A), (B), and (C). *p<0.05, **p<0.01, ***p<0.001. Linear regression analyses of total calories versus sWAT (A1-5), eWAT (B1-5), and mWAT fat masses (C1-5) in mice were done using stats package version 3.6.2 in R. Blue shading represents 95% CI of the regression line. Absolute values of R, p-value, intercept, and slope for the regression are reported above each corresponding panel. Source files of data used for the analysis are available in Figure 5—source data 1.
-
Figure 5—source data 1
Source files.
- https://cdn.elifesciences.org/articles/66398/elife-66398-fig5-data1-v1.zip
Figure 6

TXN prevents HFD-induced liver steatosis in mice.
Mice were sacrificed at the end of the study and liver samples were freshly collected and processed. (A) Representative histological images of H and E staining of liver sections. An enlarged image representative of a liver section from a HFD-fed mouse is shown as a circle on the bottom right. Macrovesicular steatosis or large lipid droplets are indicated by the red bold arrow; microvesicular steatosis or small lipid droplets are indicated by the broken red line arrow. (B) Liver mass to BW ratio. (C) Hepatic triglyceride content. P-values of orthogonal a priori comparisons of the HFD versus each of the other groups are shown. **p<0.01, ***p<0.001. Source files of data used for the analysis are available in Figure 6—source data 1 and 2.
-
Figure 6—source data 1
Source files for histology data.
A folder called “TXN prevents HFD-induced liver steatosis in mice” containing histology images in TIFF format (n = 59), used for histology scoring and Excel spreadsheet with scores and sample IDs. Figshare link that contains raw images: https://doi.org/10.6084/m9.figshare.13619273.
- https://cdn.elifesciences.org/articles/66398/elife-66398-fig6-data1-v1.zip
-
Figure 6—source data 2
This zip archive contains the following.
- https://cdn.elifesciences.org/articles/66398/elife-66398-fig6-data2-v1.zip
Figure 7
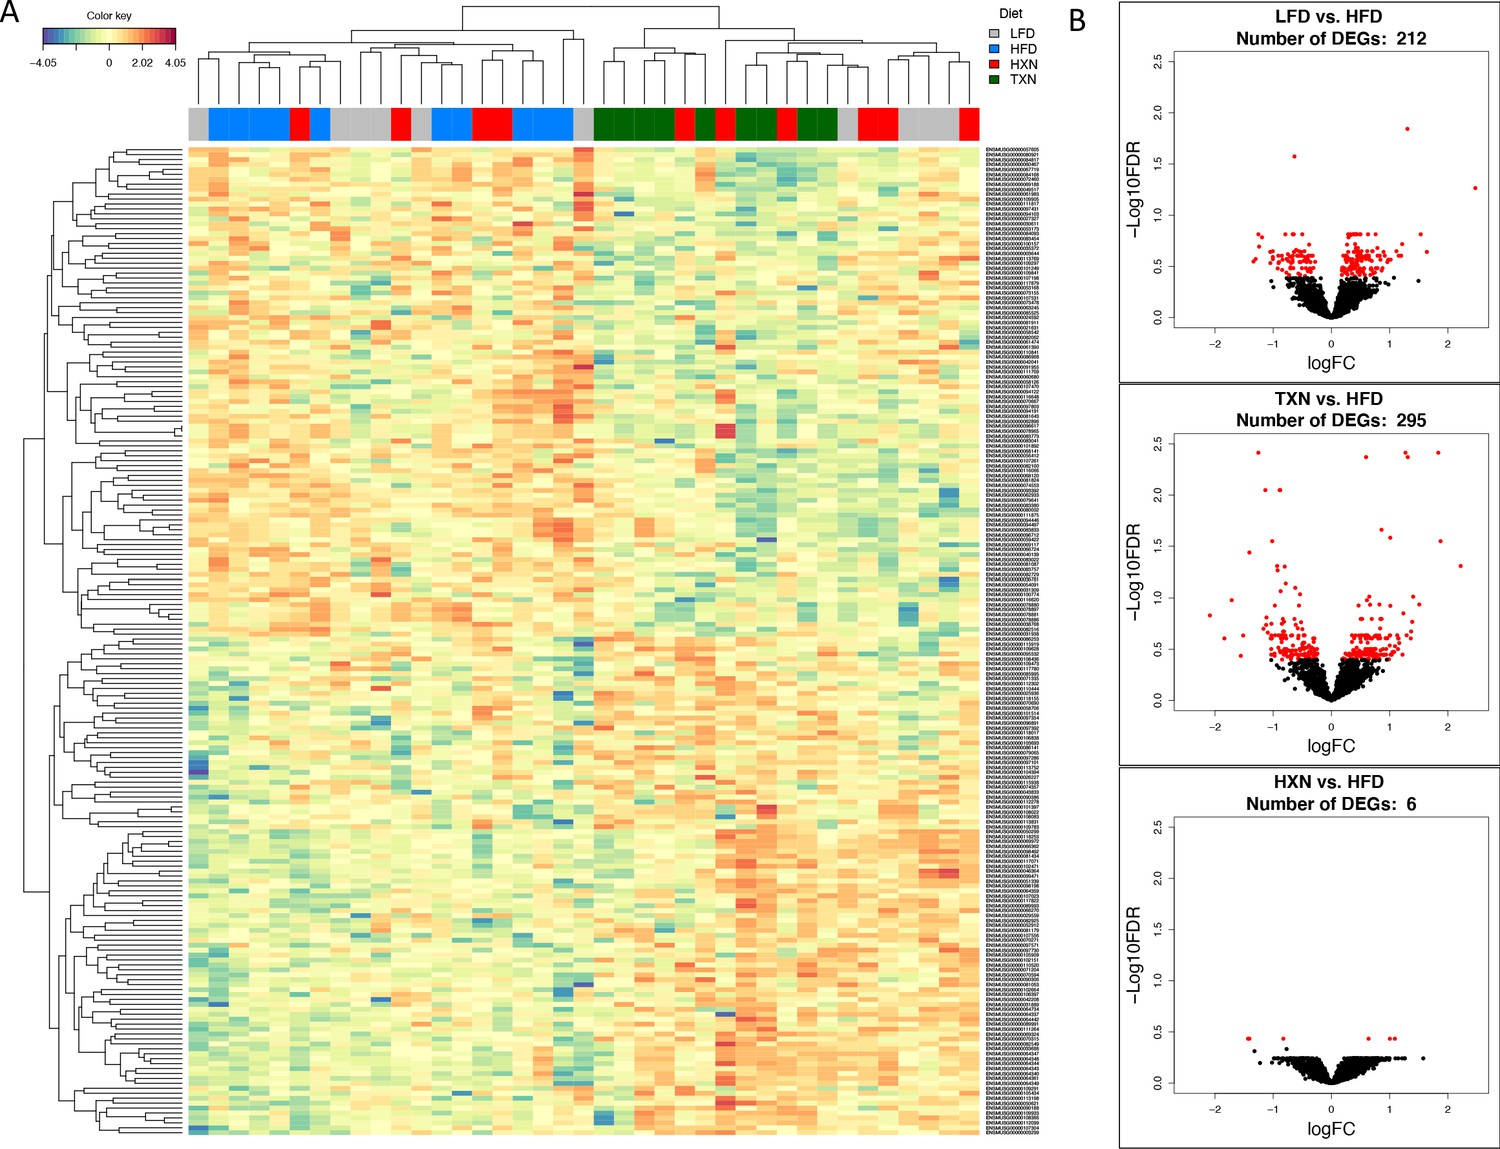
TXN treatment significantly alters liver transcriptome of mice after 16 weeks of feeding.
(A) Hierarchical clustering of the top 200 differentially expressed genes (DEGs) in each treatment group (labeled at the top right corner: gray indicates LFD group, blue indicates HFD, red indicates HXN, and green indicates TXN.) as determined by RNA-seq analysis. Color key is based on the log2 fold change. (B) Volcano plots show DEGs (red dots) in the comparison of different treatment groups. Source files of data used for the analysis are available in Figure 7—source data 1.
-
Figure 7—source data 1
Source files.
This zip archive contains the following: (1) A Jupyter Notebook file contains scripts used for statistical analysis and generation of Figure 7. (2) A R object file in Rds format named ‘y_keep.rds’. (3) An R script used to generate the ‘y_keep.rds’ file.
- https://cdn.elifesciences.org/articles/66398/elife-66398-fig7-data1-v1.zip
Figure 8

TXN decreases expression of numerous gene ontology and KEGG pathways.
Analysis of DEGs from the livers of mice that consumed a HFD+TXN versus a HFD revealed mostly downregulation of biological processes and KEGG pathways. The significant (adjusted p<0.05) enriched biological process terms in gene ontology (upper panel) and enriched KEGG pathways (lower panel) were selected by Enrichr Tools based on significance and combined scores. The number inside each lollipop represents the number of identified DEG genes in that specific biological process or KEGG pathway. Source files of data used for the analysis are available in the Figure 8—source data 1.
-
Figure 8—source data 1
Source files.
This zip archive contains the following: (1) A folder named ‘raw’, containing five Excel workbooks. (a) ‘DEGs_TXN_vs_HFD.xlsx’. (b) ‘DOWN-GO_Biological_Process_2018.xlsx’. (c) ‘UP-GO_Biological_Process_2018.xlsx’. (d) ‘DOWN-KEGG_2019_Mouse.xlsx’. (e) ‘UP-KEGG_2019_Mouse.xlsx’. (2) A folder named ‘processed’, containing two Comma Separated Values files: (a) ‘BPTerms.csv’ (b) ‘KEGGterms.csv’. (3) A Jupyter Notebook file contains scripts used for statistical analysis and generation of Figure 8. (4) A pdf file named ‘txnHFDGO.pdf’.
- https://cdn.elifesciences.org/articles/66398/elife-66398-fig8-data1-v1.zip
Figure 9
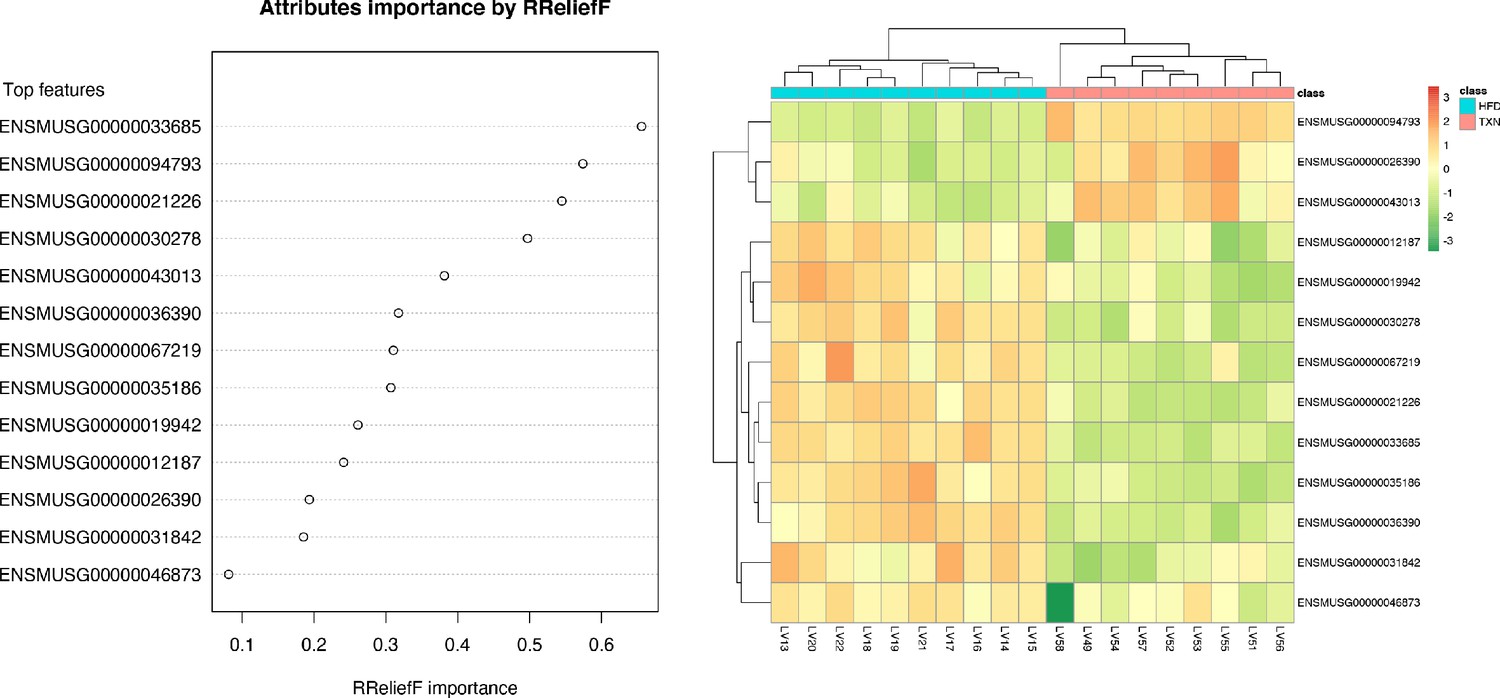
SVM identified signature genes that distinguish mice that consumed TXN.
Left panel: The dot chart shows the top 13 genes, sorted by RReliefF importance score. This plot was used to select the most important predictors to be used for classification. Right panel: Colors in the heatmap highlight the gene expression level in fold change: color gradient ranges from dark orange, meaning ‘upregulated’, to dark green, meaning ‘downregulated’. On the top of the heatmap, horizontal bars indicate HFD (blue) and HFD+TXN (pink) treatments. On the top and on the left side of the heatmap, the dendrograms obtained by Spearman’s correlation metric are shown. Plots were produced with DaMiRseq R package 1.10.0. Source files of data used for the analysis are available in Figure 9—source data 1.
-
Figure 9—source data 1
Source files.
This zip archive contains the following: (1) A Comma Separated Values file named ‘colData_hftxn.csv’ contains experiment metadata. (2) A Comma Separated Values file named ‘countMatrix_hftxn.csv’ contains raw counts in HFD and HFD+TXN groups. (3) A tab-delimited text file named ‘dfimportance_hftxn_lgcpm.txt’. (4) A Jupyter Notebook file contains scripts used for statistical analysis and generation of Figure 9. (5) A pdf file named ‘leftPanel.pdf’. (6) A pdf file named ‘rightPanel.pdf’. (7) A PowerPoint file named ‘fig9.pptx’. (8) A pdf file named ‘fig9.pdf’.
- https://cdn.elifesciences.org/articles/66398/elife-66398-fig9-data1-v1.zip
Figure 10
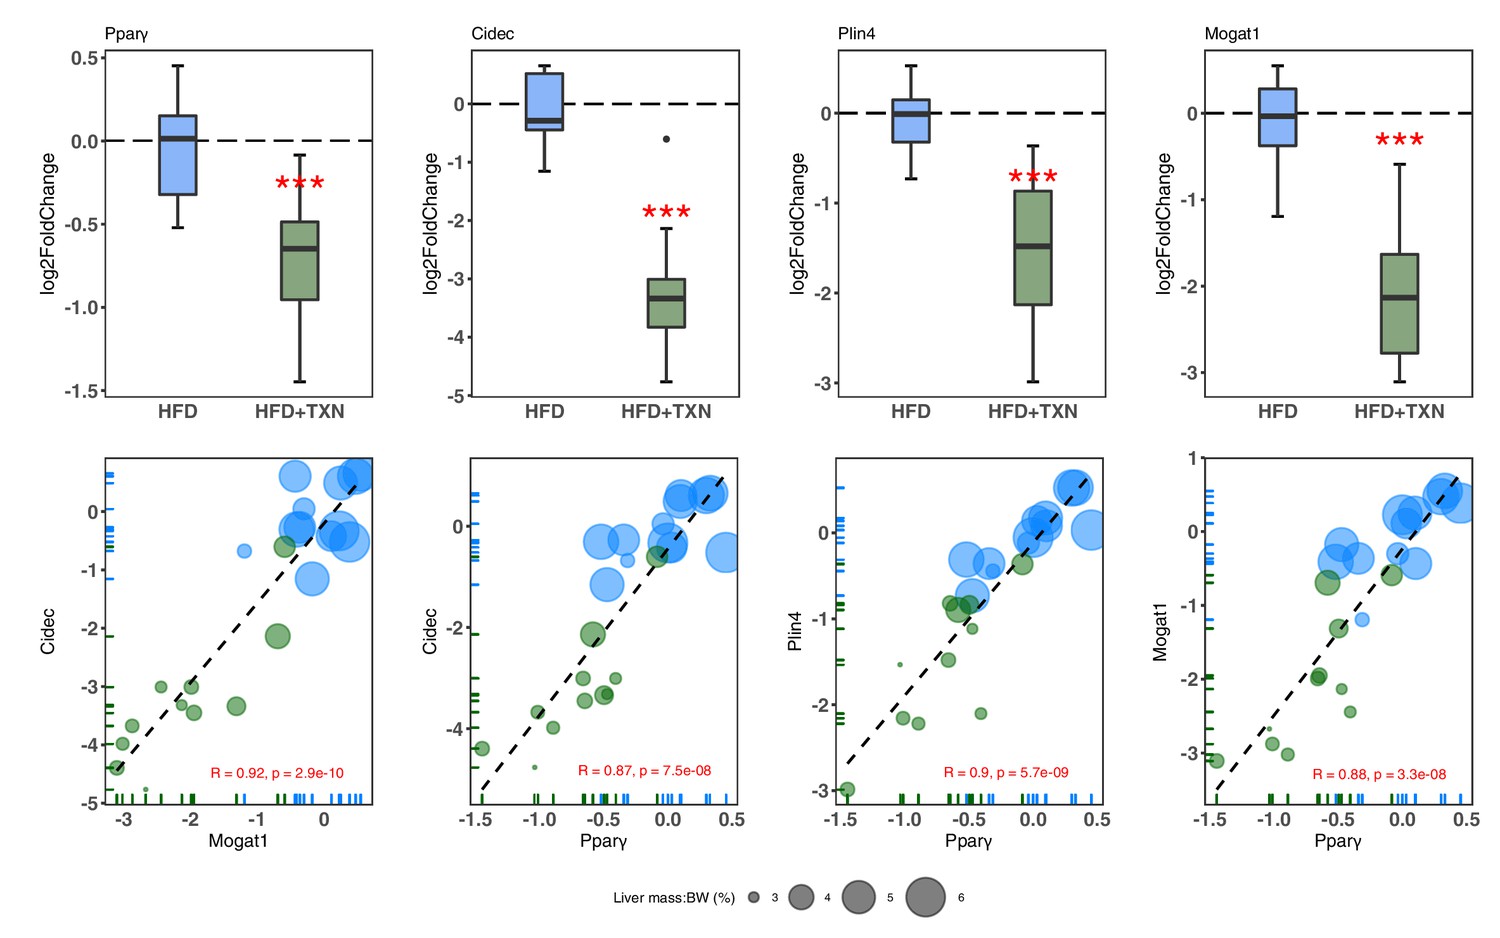
TXN-treated mice show significantly lower expression of PPARγ and target genes.
Top panel: Reduction of HFD-induced Pparg2, Cidec, Plin4, and Mogat1 expressions in the liver by TXN administration. Mice were sacrificed after 16 week of HFD (blue, n = 12) or HFD+TXN (dark green, n = 11) feeding. Liver tissues were harvested, and total RNA was extracted. Relative mRNA levels of selected genes were determined by real-time PCR. Gene expression is expressed in log2 fold change as quartiles. ***p≤0.001, t-test. Bottom panel: Pearson correlation between Pparγ2 and Cidec, Plin4 or Mogat1 expression. Data are presented in log2 fold change; bubble size represents liver mass to BW ratio. • indicates sample outside value, which is >1.5 times the interquartile range beyond upper end of the box. Source files of data used for the analysis are available in Figure 10—source data 1.
-
Figure 10—source data 1
Source files.
This zip archive contains the following: (1) A Comma Separated Values file named ‘fig10_table.csv’ phenotypic data directly pertaining to Figure 10. (2) A Excel workbook named ‘PCR_lv_raw.xlsx’ contains raw PCR cycle number data, and the calculation of fold change. (3) A Jupyter Notebook file contains scripts used for statistical analysis and generation of Figure 10. (4) A pdf file named ‘fig10.pdf’.
- https://cdn.elifesciences.org/articles/66398/elife-66398-fig10-data1-v1.zip
Figure 11

XN and TXN inhibit intracellular lipid accumulation in 3T3-L1 cells.
3T3-L1 cells (1 × 10⁶ per well) in 12-well plates were cultured with either DMEM (A1), differentiation medium (DM) (A2), DM plus DMSO (A3), DM plus 5 µM XN (B1), DM plus 10 µM XN (B2), DM plus 25 µM XN (B3), DM plus 5 µM TXN (C1), DM plus 10 µM TXN (C2), or DM plus 25 µM TXN (C3). Cells were stained with oil red O to identify lipids at day seven post-differentiation. DM: differentiation medium. Figshare link that contains raw images: https://doi.org/10.6084/m9.figshare.14744250.
Figure 12
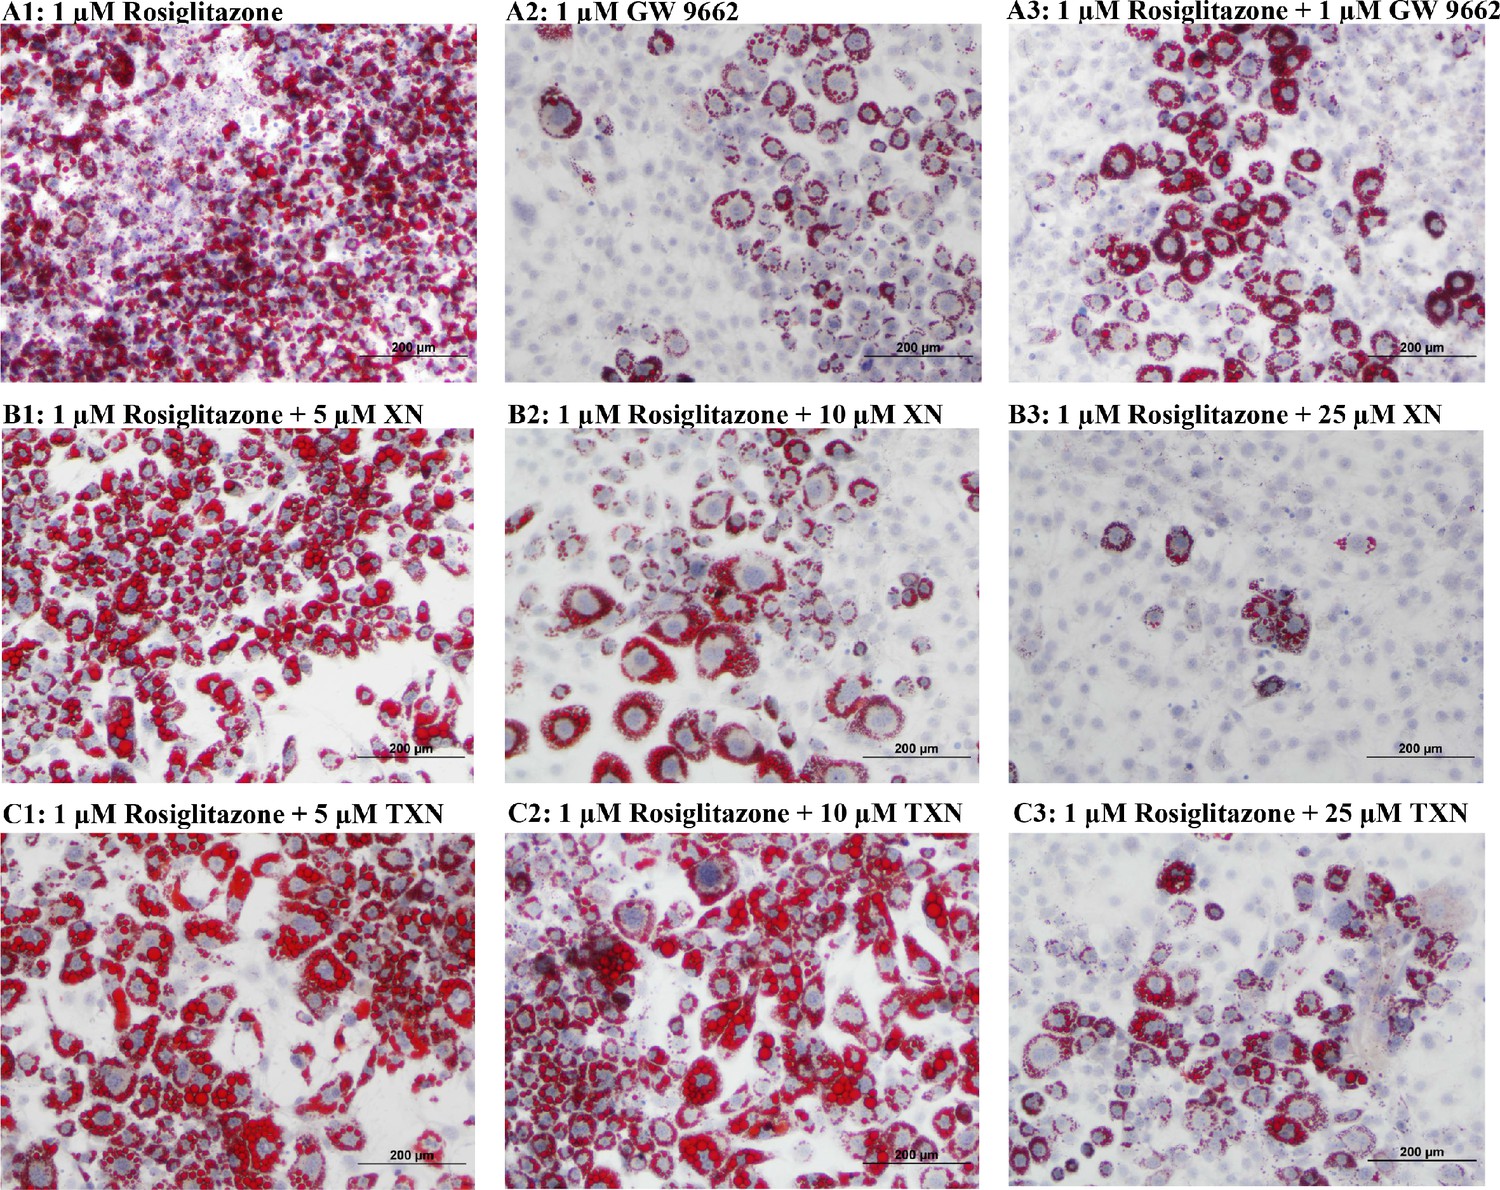
XN and TXN diminished the lipid accumulation in 3T3-L1 cells.
3T3-L1 cells (1 × 10⁶ per well) in 12-well plates were cultured with either DM plus 1 µM rosiglitazone (A1), DM plus 1 µM GW 9662 (A2), DM plus 1 µM rosiglitazone and 1 µM GW9662 (A3), DM plus 1 µM rosiglitazone and 5 µM XN (B1), DM plus 1 µM rosiglitazone and 10 µM XN (B2), DM plus 1 µM rosiglitazone and 25 µM XN (B3), DM plus 1 µM rosiglitazone and 5 µM TXN (C1), DM plus 1 µM rosiglitazone and 10 µM TXN (C2), or DM plus 1 µM rosiglitazone and 25 µM TXN (C3). Cells were stained with oil red O to identify lipids at day 7 post-differentiation. Figshare link that contains raw images: https://doi.org/10.6084/m9.figshare.14744250.
Figure 13
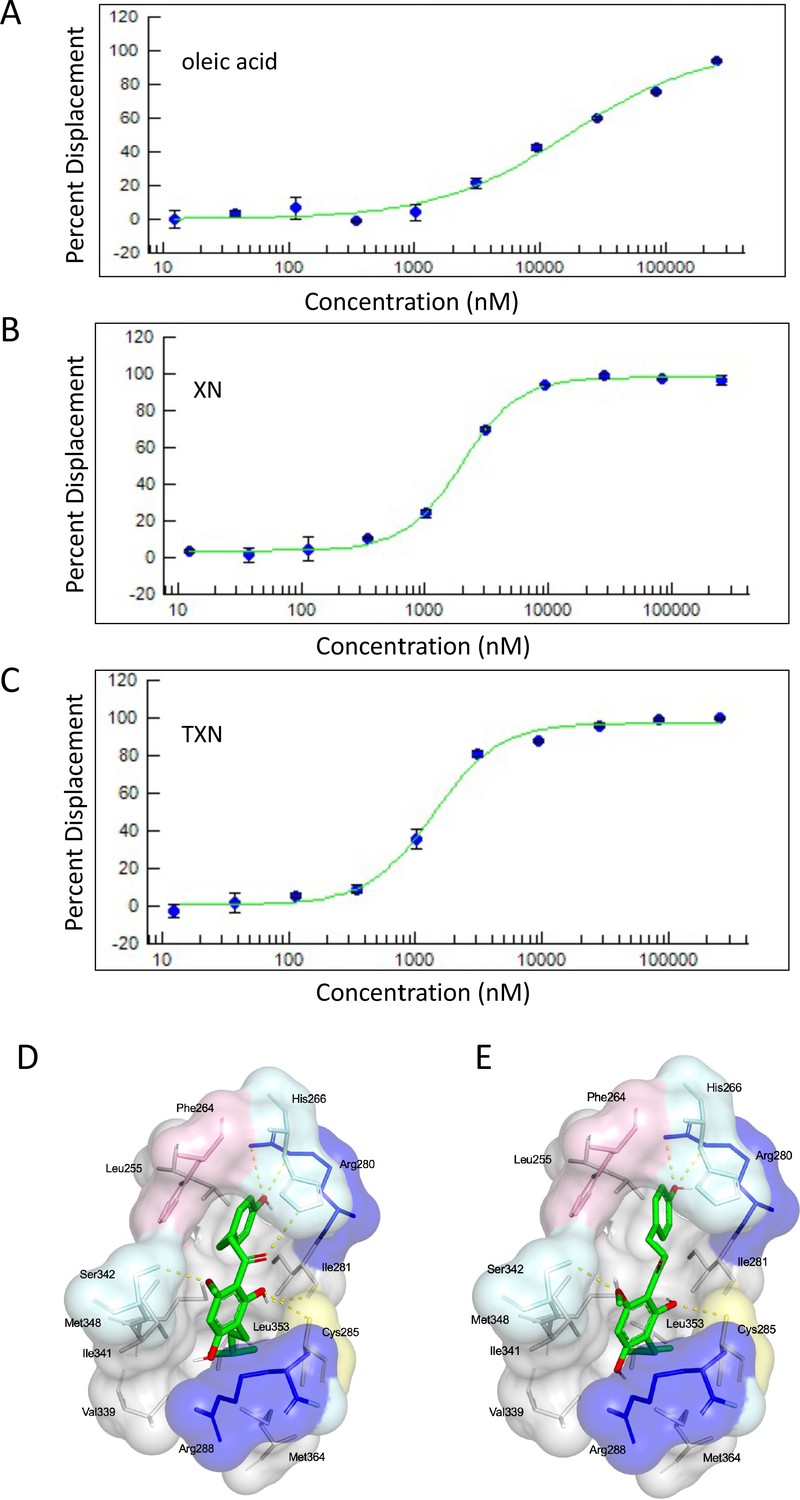
XN and TXN are ligands for PPARγ.
A PPARγ nuclear receptor competitive binding assay based on time-resolved fluorescence resonance energy transfer (TR-FRET) was performed. The IC50 values for each compound was determined by % displacement of a pan-PPARγ ligand. (A) Oleic acid IC5016.6 µM. (B) XN IC501.97 µM. (C) TXN IC501.38 µM. Molecular docking studies show TXN and XN fit into the human PPARγ binding site. PPARγ residues containing atoms involved in hydrophobic interactions are shown. Yellow dashes indicate hydrogen bonds, amino acids colored as hydrophobic (gray), aromatic (pink), polar (cyan), basic (blue), or cysteine (yellow). (D) TXN and (E) XN. Source files of data used for the analysis are available in Figure 13—source data 1.
-
Figure 13—source data 1
Source files: an Excel file named ‘SSBN12209_57828_10-point Titration_Inhibition_Results.xls’ containing results from ThermoFisher PPARγ nuclear receptor competitive binding assay.
- https://cdn.elifesciences.org/articles/66398/elife-66398-fig13-data1-v1.zip
Tables
Table 1
Changes in transcript levels for genes encoding lipocalin two and hepatic major urinary proteins.
| Gene name | Gene symbol | HFD vs. LFD log2FC | FDR | TXN vs. HFD log2FC | FDR |
|---|---|---|---|---|---|
| Lipocalin 2 | Lcn2 | 0.60 | 0.66 | −1.60 | 0.08 |
| Major urinary protein 1 | Mup1 | −1.72 | 0.04 | 2.19 | <0.01 |
| Major urinary protein 2 | Mup2 | −0.77 | 0.29 | 1.38 | 0.01 |
| Major urinary protein 3 | Mup3 | −0.51 | 0.54 | 0.83 | 0.17 |
| Major urinary protein 4 | Mup4 | −1.24 | 0.03 | 1.22 | 0.02 |
| Major urinary protein 5 | Mup5 | −1.27 | 0.05 | 1.31 | 0.03 |
| Major urinary protein 6 | Mup6 | −0.94 | 0.12 | 1.13 | 0.03 |
| Major urinary protein 7 | Mup7 | −2.03 | 0.05 | 2.73 | <0.01 |
| Major urinary protein 8 | Mup8 | −1.75 | 0.03 | 2.16 | <0.01 |
| Major urinary protein 9 | Mup9 | −1.82 | 0.03 | 2.10 | <0.01 |
| Major urinary protein 10 | Mup10 | −0.70 | 0.31 | 1.28 | 0.01 |
| Major urinary protein 11 | Mup11 | −1.45 | 0.12 | 1.81 | 0.02 |
| Major urinary protein 12 | Mup12 | −2.21 | 0.05 | 2.65 | 0.01 |
| Major urinary protein 13 | Mup13 | −0.84 | 0.24 | 1.37 | 0.01 |
| Major urinary protein 14 | Mup14 | −0.89 | 0.22 | 1.47 | 0.01 |
| Major urinary protein 15 | Mup15 | −1.93 | 0.07 | 2.63 | <0.01 |
| Major urinary protein 16 | Mup16 | −1.17 | 0.13 | 1.40 | 0.04 |
| Major urinary protein 17 | Mup17 | −1.72 | 0.06 | 1.74 | 0.04 |
| Major urinary protein 18 | Mup18 | −0.97 | 0.29 | 1.27 | 0.08 |
| Major urinary protein 20 | Mup20 | −1.14 | <0.001 | 0.15 | 0.79 |
| Major urinary protein 21 | Mup21 | −0.97 | 0.07 | 1.15 | 0.02 |
| Major urinary protein 22 | Mup22 | −0.70 | 0.32 | 1.27 | 0.02 |
-
Genes with significant change after HFD feeding and with TXN treatment are highlighted in red (FDR ≤ 0.05).
Table 2
Changes in transcript levels for gene markers of hepatic fibrosis.
| Gene name | Gene symbol | HFD vs. LFD log2FC | FDR | TXN vs. HFD log2FC | FDR |
|---|---|---|---|---|---|
| Collagen, type 1, alpha 1 | Col1a1 | −0.01 | 1.00 | −1.92 | 0.09 |
| Collagen, type 1, alpha 2 | Col1a2 | 0.05 | 0.98 | −1.51 | 0.11 |
| Lysyl oxidase-like 1 | Loxl1 | −0.63 | 0.55 | −0.42 | 0.68 |
| Lysyl oxidase-like 2 | Loxl2 | 0.48 | 0.60 | −0.77 | 0.26 |
| Lysyl oxidase-like 3 | Loxl3 | −0.39 | 0.78 | −0.54 | 0.62 |
| Matrix metallopeptidase 12 | Mmp12 | 0.42 | 0.83 | −2.82 | 0.02 |
| Matrix metallopeptidase 14 | Mmp14 | −0.19 | 0.67 | −0.04 | 0.93 |
| Matrix metallopeptidase 15 | Mmp15 | −0.27 | 0.44 | 0.11 | 0.78 |
| Matrix metallopeptidase 19 | Mmp19 | 0.38 | 0.29 | −0.08 | 0.87 |
| Matrix metallopeptidase 2 | Mmp2 | −0.04 | 0.98 | −0.99 | 0.36 |
| Transforming growth factor alpha | Tgfa | 0.23 | 0.68 | 0.05 | 0.94 |
| Transforming growth factor beta 1 | Tgfb1 | 0.02 | 0.99 | 0.23 | 0.83 |
| Transforming growth factor beta 1 induced transcript 1 | Tgfb1i1 | 0.07 | 0.96 | −0.18 | 0.87 |
| Transforming growth factor beta 2 | Tgfb2 | −0.65 | 0.68 | −0.84 | 0.55 |
| Transforming growth factor beta 2 induced | Tgfbi | −0.08 | 0.92 | −0.53 | 0.26 |
| Transforming growth factor beta receptor I | Tgfbr1 | −0.24 | 0.70 | −0.20 | 0.73 |
| Transforming growth factor beta receptor II | Tgfbr2 | 0.14 | 0.85 | −0.68 | 0.15 |
| Transforming growth factor beta receptor III | Tgfbr3 | 0.17 | 0.79 | 0.004 | 1.00 |
| Tissue inhibitor of metalloproteinase 2 | Timp2 | −0.34 | 0.65 | −1.92 | 0.09 |
| Tissue inhibitor of metalloproteinase 3 | Timp3 | −0.48 | 0.31 | −1.51 | 0.11 |
-
Genes with significant change after HFD feeding and with TXN treatment are highlighted in red (FDR ≤ 0.05).
Table 3
Changes in transcript levels for gene markers of hepatic inflammation.
| Gene name | Gene symbol | HFD vs. LFD log2FC | FDR | TXN vs. HFD log2FC | FDR |
|---|---|---|---|---|---|
| Adhesion G protein-coupled receptor E1 | Adgre | 0.13 | 0.87 | −0.37 | 0.50 |
| Chemokine ligand 2 | Ccl2 | 0.87 | 0.50 | −1.40 | 0.16 |
| Chemokine receptor 2 | Ccr2 | 0.86 | 0.32 | −1.84 | <0.01 |
| Fibroblast growth factor 21 | Fgf21 | 1.00 | 0.34 | −1.73 | 0.04 |
| Prostaglandin-endoperoxide synthase 1 | Ptgs1 | −0.08 | 0.92 | −0.09 | 0.89 |
-
Genes with significant change after HFD feeding and with TXN treatment are highlighted in red (FDR ≤ 0.05).
Table 4
Changes in transcript levels for genes encoding proteins involved in hepatic lipid oxidation, VLDL export, and lipid storage pathways.
| Gene name | Gene symbol | HFD vs. LFD log2FC | FDR | TXN vs. HFD log2FC | FDR |
|---|---|---|---|---|---|
| Lipid oxidation | |||||
| Acyl-CoA thioesterase 1 | Acot1 | −0.80 | 0.02 | 0.05 | 0.93 |
| Acyl-CoA oxidase 1 | Acox1 | 0.28 | 0.31 | −0.13 | 0.66 |
| Acyl-CoA oxidase 2 | Acox2 | 0.14 | 0.63 | 0.18 | 0.42 |
| Acyl-CoA oxidase 3 | Acox3 | 0.08 | 0.87 | −0.09 | 0.84 |
| Carnitine palmitoyltransferase 1a | Cpt1a | −0.08 | 0.81 | −0.16 | 0.46 |
| Carnitine palmitoyltransferase 2 | Cpt2 | −0.01 | 0.98 | 0.19 | 0.51 |
| ELOVL family member 5, elongation of long-chain fatty acids | Elovl5 | 0.40 | 0.32 | −0.89 | <0.01 |
| Elongation of very long-chain fatty acids | Elovl2 | −0.34 | 0.34 | 0.02 | 0.98 |
| 3-Hydroxy-3-methylglutaryl-Coenzyme A synthase 2 | Hmgcs2 | 0.26 | 0.25 | −0.06 | 0.84 |
| Peroxisome proliferator activated receptor alpha | Ppara | −0.23 | 0.77 | 0.35 | 0.56 |
| Solute carrier family 25 member 20 | Slc25a20 | 0.08 | 0.80 | −0.14 | 0.56 |
| VLDL export | |||||
| Apolipoprotein B | Apob | −0.07 | 0.86 | 0.02 | 0.95 |
| Diacylglycerol O-acyltransferase 1 | Dgat1 | −0.01 | 0.98 | −0.09 | 0.83 |
| Microsomal triglyceride transfer protein | Mttp | −0.20 | 0.81 | 0.41 | 0.48 |
| Lipid storage | |||||
| Cell death-inducing DFFA-like effector c | Cidec | 1.09 | 0.30 | −2.41 | <0.01 |
| Monoacylglycerol O-acyltransferase 1 | Mogat1 | 1.71 | <0.01 | −1.62 | 0.01 |
| Perilipin 2 | Plin2 | −0.11 | 0.82 | −0.30 | 0.33 |
| perilipin 3 | Plin3 | 0.20 | 0.66 | −0.51 | 0.08 |
| Perilipin 4 | Plin4 | 0.86 | 0.13 | −1.11 | 0.02 |
| Perilipin 5 | Plin5 | −0.39 | 0.19 | 0.01 | 0.98 |
| Peroxisome proliferator activated receptor gamma | Pparg | 0.97 | 0.44 | −1.14 | 0.26 |
| Peroxisome proliferator activated receptor gamma coactivator 1 alpha | Ppargc1a | −0.01 | 0.99 | −0.18 | 0.62 |
| Peroxisome proliferator activated receptor gamma coactivator 1 beta | Ppargc1b | −0.32 | 0.42 | 0.07 | 0.88 |
-
Genes with significant change after HFD feeding and with TXN treatment are highlighted in red (FDR ≤ 0.05).
Table 5
Thirteen genesª used to distinguish TXN transcriptome from HFD transcriptome.
| Ensemble ID | Gene name | Gene symbol | TXN vs. HFD (log2 fold change) | p-value | FDR |
|---|---|---|---|---|---|
| 00000094793 | Major urinary protein 12 | Mup12 | 2.65 | 0.000 | 0.011 |
| 00000033685 | Uncoupling protein 2 | Ucp2 | −1.07 | 0.005 | 0.109 |
| 00000036390 | Growth arrest and DNA-damage-inducible 45 alpha | Gadd45α | −0.73 | 0.083 | 0.402 |
| 00000021226 | Acyl-CoA thioesterase 2 | Acot2 | −1.33 | 0.000 | 0.003 |
| 00000030278 | Cell death-inducing DFFA-like effector c | Cidec | −2.41 | 0.000 | 0.006 |
| 00000043013 | One cut domain, family member 1 | Onecut1 | 1.53 | 0.004 | 0.098 |
| 00000067219 | NIPA-like domain containing 1 | Nipal1 | −0.63 | 0.197 | 0.567 |
| 00000035186 | Ubiquitin D | Ubd | −2.51 | 0.002 | 0.068 |
| 00000031842 | Phosphodiesterase 4C, cAMP specific | Pde4c | −0.00 | 0.996 | 0.999 |
| 00000026390 | Macrophage receptor with collagenous structure | Marco | 0.69 | 0.149 | 0.510 |
| 00000012187 | Monoacylglycerol O-acyltransferase 1 | Mogat1 | −1.62 | 0.000 | 0.011 |
| 00000019942 | Cyclin-dependent kinase 1 | Cdk1 | −1.53 | 0.009 | 0.139 |
| 00000046873 | Membrane-bound transcription factor peptidase | Mbtps2 | −0.36 | 0.251 | 0.616 |
-
aGenes were ranked according to their RReliefF importance score using a multivariate filter technique (i.e., RReliefF) (Chiesa et al., 2018). Also shown is the log2 fold changes, p-values, and FDR values when HFD-TXN samples were compared with HFD samples using edgeR package Robinson et al., 2010 in R. Negative values indicate genes downregulated in the liver with TXN supplementation. Source files of data used for the analysis are available in Table 5—source data 1.
-
Table 5—source data 1
Source files.
This zip archive contains the following: (1) An Excel workbook named ‘DEG_HFD_vs_TXN.xlsx’ contains all differentially expressed genes identified. Genes listed in the table were highlighted in yellTable 1ow in the Excel workbook.
- https://cdn.elifesciences.org/articles/66398/elife-66398-table5-data1-v1.zip
Table 6
Adipocyte gene expression at day seven post-differentiation.
| Gene | Log2 (fold change) | p-values vs. RGZ | |||||
|---|---|---|---|---|---|---|---|
| RGZ (cont) | RGZ + GW9662 | RGZ + XN | RGZ + TXN | RGZ + GW9662 | RGZ + XN | RGZ + TXN | |
| Pparg2 | Ref. | −0.11 | −1.93 | −1.53 | 0.30 | <0.001 | <0.001 |
| Cd36 | −0.18 | −9.10 | −4.36 | 0.25 | <0.001 | <0.001 | |
| Fabp4 | −0.12 | −7.94 | −4.08 | 0.43 | <0.001 | <0.001 | |
| Mogat1 | −0.11 | −4.16 | −3.59 | 0.42 | <0.001 | <0.01 | |
| Cidec | −0.18 | −10.10 | −4.46 | 0.40 | <0.001 | <0.001 | |
| Plin4 | −0.10 | −3.01 | −2.32 | 0.48 | <0.001 | <0.001 | |
| Fgf21 | 0.03 | −0.99 | −1.08 | 0.40 | <0.01 | <0.01 | |
-
3T3-L1 differentiation was induced by IBMX, dexamethasone, insulin, and 1 µM RGZ plus the addition of 1 µM GW9662, 25 µM XN, or 25 µM TXN for 48 hr. After 48 hr, the old media was removed and fresh DMEM was replenished for continuing differentiation. Gene expression was measured at day 7 post-differentiation using qRT-PCR. ΔCT = CT(target gene) – CT(reference gene). ΔΔCT = ΔCT(treated sample) – ΔCT(untreated sample/control average). Fold change = 2−ΔΔCT. Statistics were performed on ΔΔCT values. Source files of data used for the analysis are available in the Table 6—source data 1.
-
Table 6—source data 1
Source files.
This zip archive contains the following: (2) An Excel workbook named ‘7 days.xlsx’ contains raw PCR cycle numbers, fold change, log(2) fold change, p-values, and how these are calculated.
- https://cdn.elifesciences.org/articles/66398/elife-66398-table6-data1-v1.zip
Table 7
Composition of dietsa.
| HFD | HFD + LXN | HFD + HXN | HFD + TXN | LFD | |
|---|---|---|---|---|---|
| Ingredient (g/100 g) | |||||
| Casein | 2.58 | 2.58 | 2.58 | 2.58 | 1.89 |
| L-Cystine | 0.04 | 0.04 | 0.04 | 0.04 | 0.03 |
| Sucrose | 0.89 | 0.89 | 0.89 | 0.89 | 0.89 |
| Cornstarch | 0.00 | 0.00 | 0.00 | 0.00 | 4.02 |
| Cellulose | 0.54 | 0.54 | 0.54 | 0.54 | 0.47 |
| Dyetrose | 1.62 | 1.62 | 1.62 | 1.62 | 1.62 |
| Soybean oil | 0.32 | 0.32 | 0.32 | 0.32 | 0.24 |
| Lard | 3.17 | 3.17 | 3.17 | 3.17 | 0.19 |
| Mineral Mix #210088 | 0.13 | 0.13 | 0.13 | 0.13 | 0.10 |
| Dicalcium phosphate | 0.17 | 0.17 | 0.17 | 0.17 | 0.12 |
| Calcium carbonate | 0.07 | 0.07 | 0.07 | 0.07 | 0.05 |
| Potassium citrate H2O | 0.21 | 0.21 | 0.21 | 0.21 | 0.16 |
| Vitamin mix #300050 | 0.13 | 0.13 | 0.13 | 0.13 | 0.10 |
| Choline bitartrate | 0.03 | 0.03 | 0.03 | 0.03 | 0.02 |
| Test compound | 0.00 | 0.003 | 0.006 | 0.003 | 0.00 |
| OPT | 0.10 | 0.10 | 0.10 | 0.10 | 0.10 |
| Composition (kcal%) | |||||
| Protein | 20 | 20 | 20 | 20 | 20 |
| Carbohydrates | 20 | 20 | 20 | 20 | 70 |
| Lipids | 60 | 60 | 60 | 60 | 10 |
| Energy density (kcal/g) | 5.12 | 5.12 | 5.12 | 5.12 | 3.55 |
-
aLXN provides 0.035% xanthohumol (XN), HXN (0.07% XN), and 0.035% TXN per day. The test compounds were dissolved in an isotropic mixture of oleic acid: propylene glycol: Tween 80 (OPT) 0.9:1:1 by weight before incorporation into the diets. All diets were purchased from Dyets Inc, Bethlehem, PA.
Table 8
Fatty acid composition (% of the total fat) of the low-fat diet (LFD) and high-fat diet (HFD).
| Fatty acids | % of the total fat | g/kg diet | ||
|---|---|---|---|---|
| LFD | HFD | LFD | HFD | |
| 14:0 Myristic | 0.7 | 1.4 | 0.29 | 4.75 |
| 16:0 Palmitic | 17.0 | 24.2 | 7.28 | 84.34 |
| 16:1 Palmitoleic | 1.5 | 3.1 | 0.65 | 10.76 |
| 18:0 Stearic | 8.3 | 12.3 | 3.56 | 42.92 |
| 18:1 Oleic | 32.2 | 42.1 | 13.76 | 146.95 |
| 18:2 Linoleic | 35.2 | 14.9 | 15.04 | 51.89 |
| 18:3 Linolenic | 5.0 | 2.1 | 2.14 | 7.27 |
| SFAs | 26.0 | 37.9 | 11.13 | 132.01 |
| MUFAs | 33.7 | 45.2 | 14.41 | 157.71 |
| PUFAs | 40.2 | 17.0 | 17.18 | 59.16 |
| Total n-6 PUFA | 35.2 | 14.9 | 15.04 | 51.89 |
| Total n-3 PUFA | 5.0 | 2.1 | 2.14 | 7.27 |
-
Abbreviations: SFA: saturated fatty acids; MUFAs: monounsaturated fatty acids; PUFAs: polyunsaturated fatty acids; n-6: omega-6 fatty acids; n-3: omega-3 fatty acids.
Table 9
Primer probe information.
| Gene name | IDT assay name | RefSeq number |
|---|---|---|
| Cd36 | Mm.PT.58.12375764 | NM_007643 |
| Cidec/Fsp27 | Mm.PT.58.6462335 | NM_178373 |
| Fabp4 | Mm.PT.58.43866459 | NM_024406 |
| Fgf21 | Mm.PT.58.29365871.g | NM_020013 |
| Il6 | Mm.PT.58.10005566 | NM_031168 |
| Lpl | Mm.PT.58.46006099 | NM_008509 |
| Mogat1 | Mm.PT.58.41635461 | NM_026713 |
| Pparg2 | Mm.PT.58.31161924 | NM_011146 |
| Plin4 | Mm.PT.58.43717773 | NM_020568 |
Additional files
-
Source data 1
- https://cdn.elifesciences.org/articles/66398/elife-66398-data1-v1.xlsx
-
Transparent reporting form
- https://cdn.elifesciences.org/articles/66398/elife-66398-transrepform-v1.pdf
Download links
A two-part list of links to download the article, or parts of the article, in various formats.
Downloads (link to download the article as PDF)
Open citations (links to open the citations from this article in various online reference manager services)
Cite this article (links to download the citations from this article in formats compatible with various reference manager tools)
Tetrahydroxanthohumol, a xanthohumol derivative, attenuates high-fat diet-induced hepatic steatosis by antagonizing PPARγ
eLife 10:e66398.
https://doi.org/10.7554/eLife.66398


