OPA1 deletion in brown adipose tissue improves thermoregulation and systemic metabolism via FGF21
- Fraternal Order of Eagles Diabetes Research Center and Division of Endocrinology and Metabolism, Roy J. and Lucille A. Carver College of Medicine, University of Iowa, United States
- Department of Obstetrics and Gynecology, Reproductive Endocrinology and Infertility, Roy J. and Lucille A. Carver College of Medicine, United States
- Department of Neuroscience and Pharmacology, Roy J. and Lucille A. Carver College of Medicine, University of Iowa, United States
Figures
Figure 1 with 2 supplements
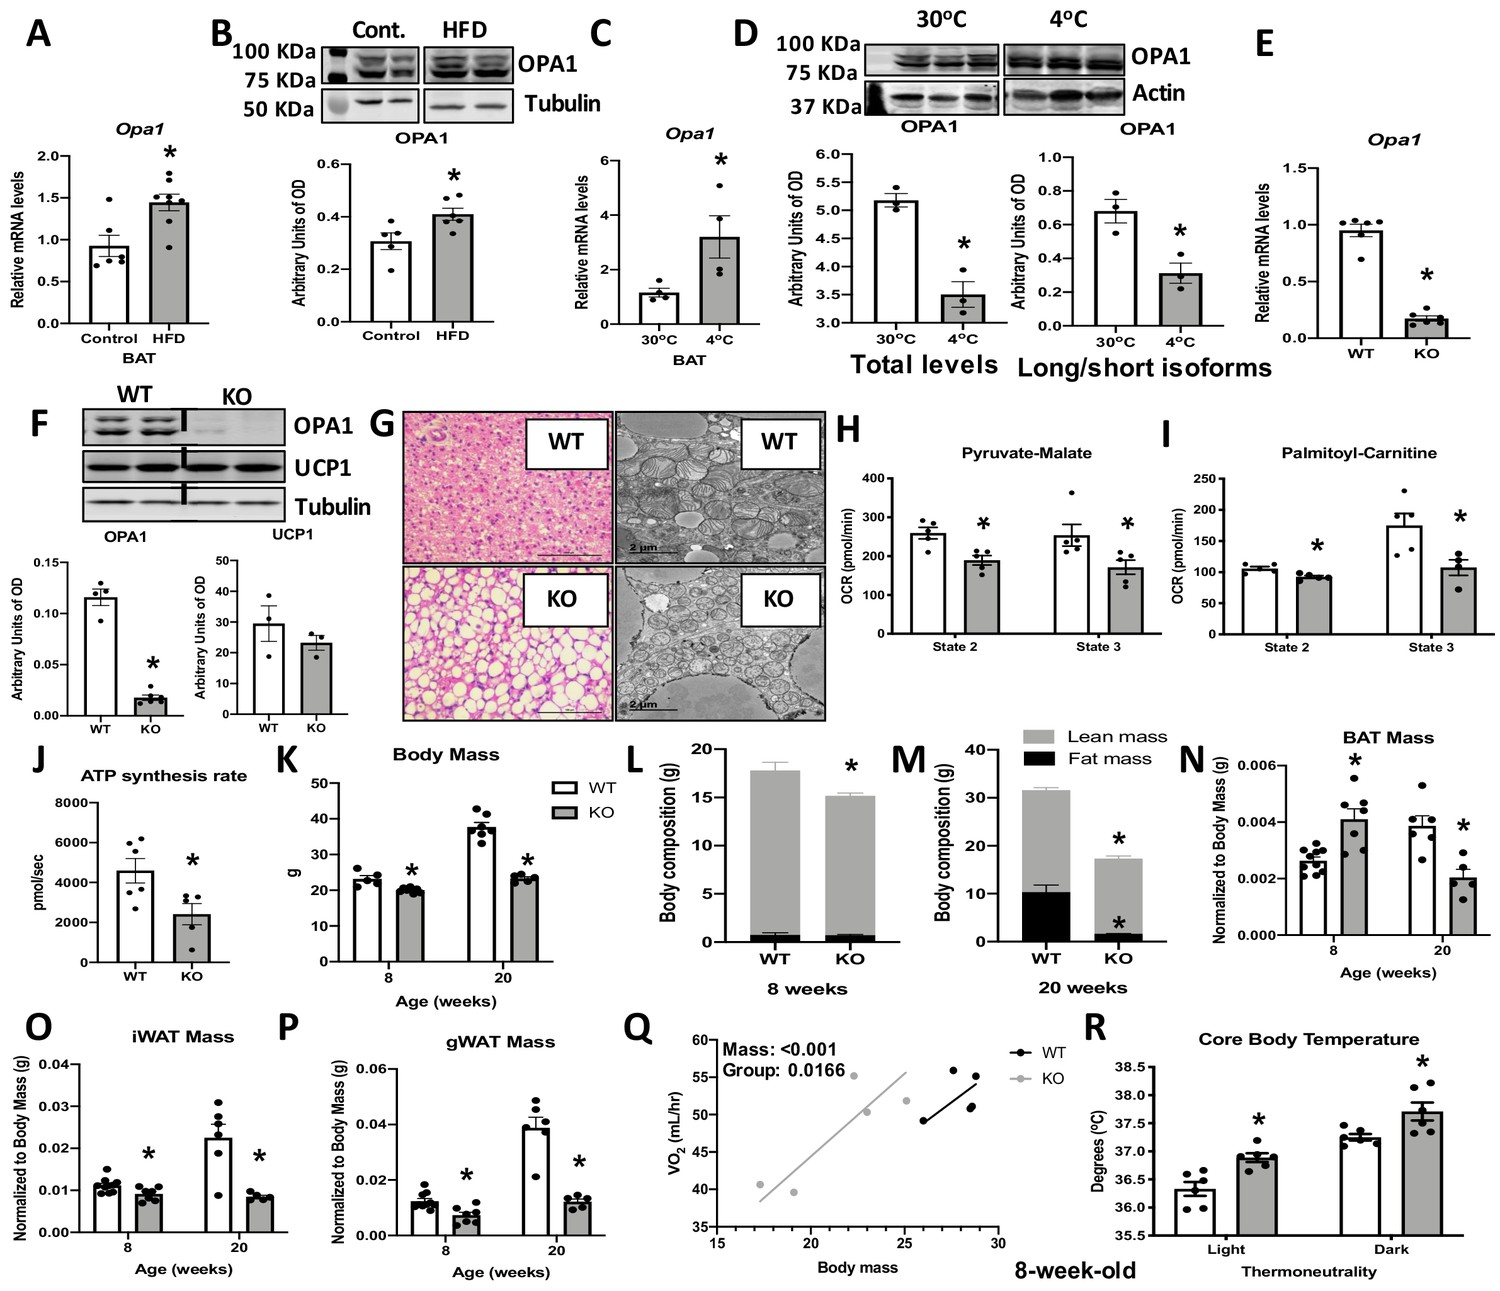
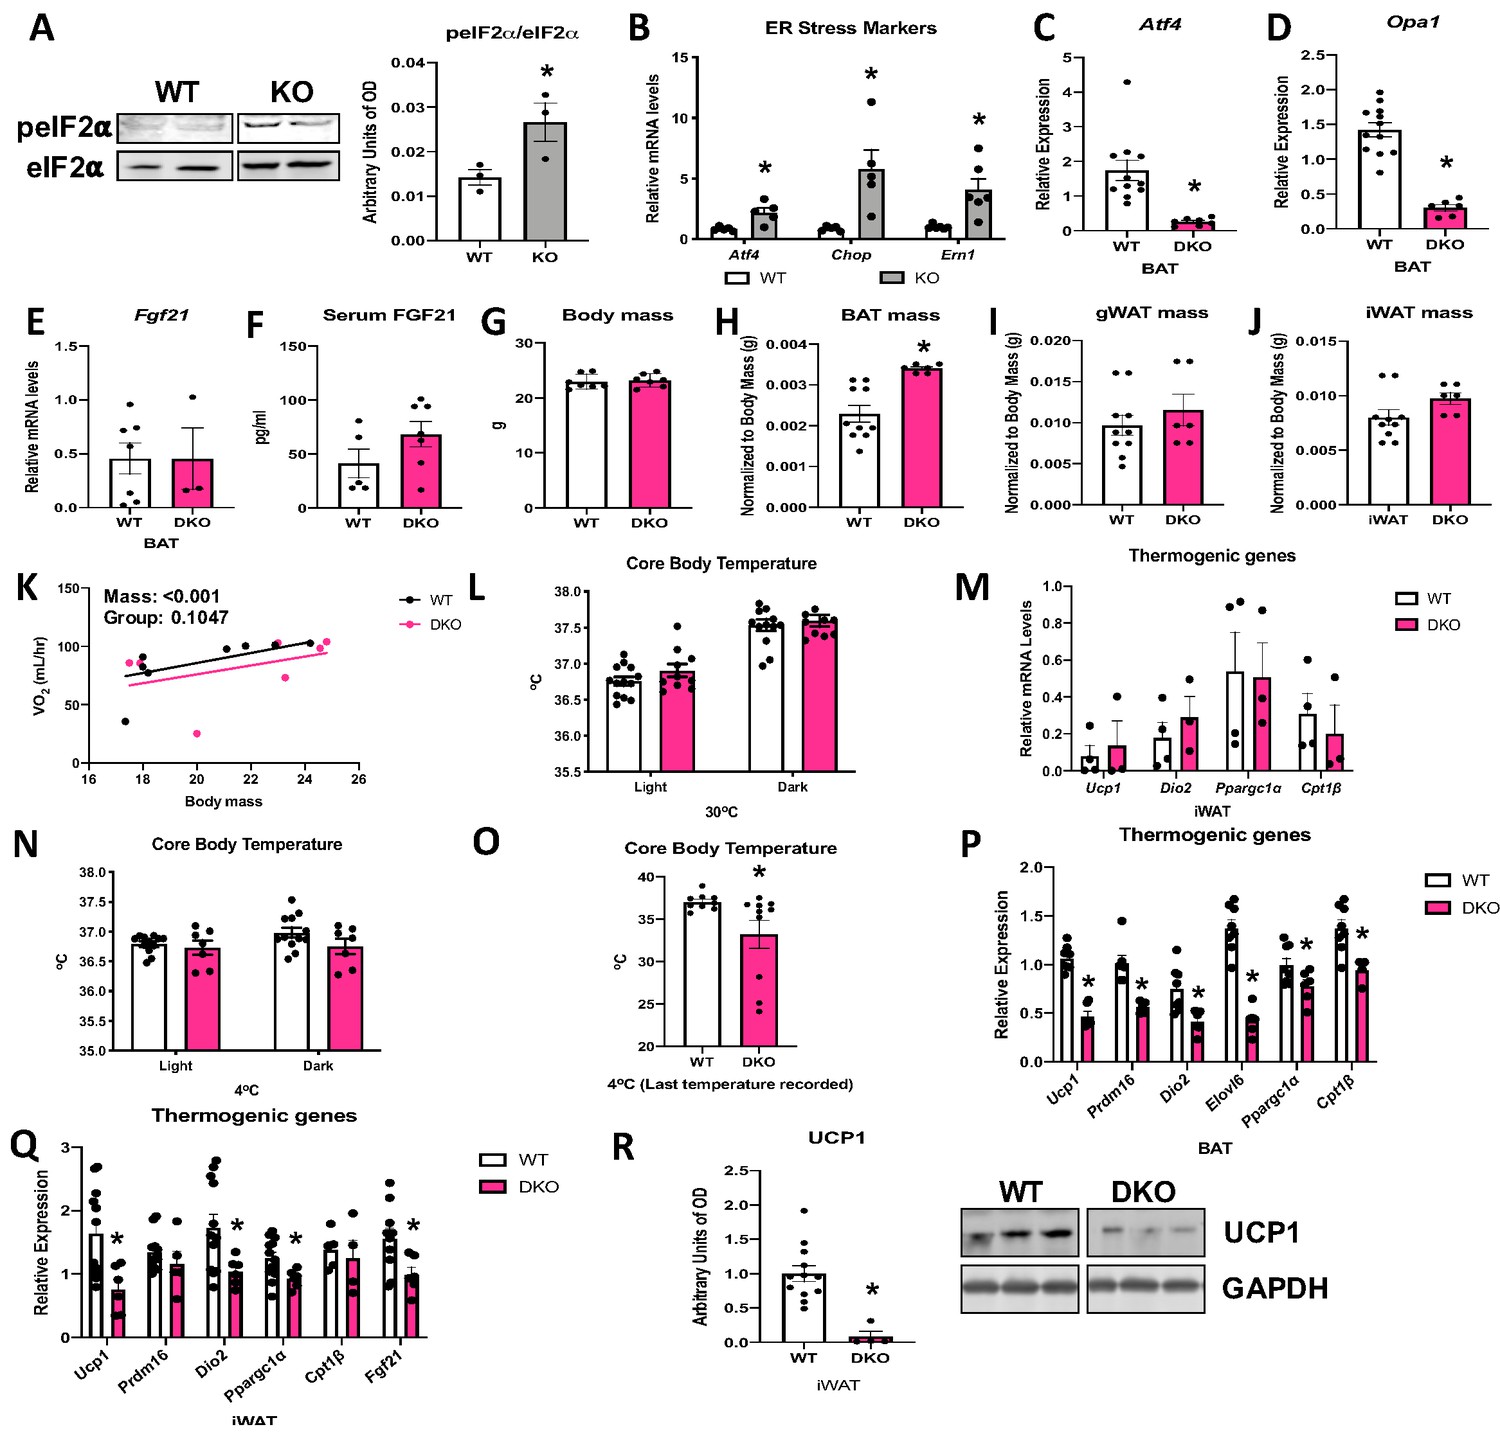
Optic atrophy 1 (OPA1) deficiency leads to mitochondrial dysfunction in brown adipose tissue (BAT), while improving energy balance and thermoregulation in mice.
(A, B) OPA1 expression in BAT of wild-type (WT) mice fed either control (10% fat) or a high-fat diet (HFD 60% fat) for 12 weeks. (A) Opa1 mRNA expression in BAT. (B) Representative immunoblot of OPA1 and densitometric analysis of OPA1 normalized by tubulin (images were cropped from the same membrane). (C, D) OPA1 expression in BAT of WT mice maintained at 30°C or 4°C for 3 days. (C) Opa1 mRNA expression in BAT. (D) Representative immunoblot of OPA1 and densitometric analysis of OPA1 (total levels and long/short isoforms – images were cropped from the same membrane). (E–J) Morphological and functional characterization of BAT from 8-week-old OPA1 BAT KO mice (KO). (E) Opa1 mRNA expression in BAT. (F) Representative immunoblot in BAT of OPA1 and UCP1 and densitometric analysis normalized to tubulin (dashed line separates genotypes). (G) Representative images of H&E-stained histological sections and electron micrographs of BAT from 8-week-old WT and KO mice (n = 3). Scale bar = 100 μm and 2 μm, respectively. (H, I) Functional analysis of mitochondria isolated from BAT of WT and KO mice. (H) Basal (state 2) and ADP-stimulated (state 3) pyruvate-malate-supported oxygen consumption rates (OCRs). (I) State 2 and state 3 palmitoyl-carnitine-supported OCR. (J) Palmitoyl-carnitine-supported ATP synthesis rates. (K–P) Body mass and body composition in 8- and 20 week-old WT and KO mice. (K) Body mass (8 and 20 weeks of age). (L) Body composition (8 weeks of age). (M) Body composition (20 weeks of age). (N) BAT mass. (O) Inguinal white adipose tissue (iWAT) mass. (P) Gonadal white adipose tissue mass (gWAT). (Q) Regression plot comparing oxygen consumption as a function of body mass in mice housed at 30°C. (R) Core body temperature in 8-week-old mice housed at 30°C. Data are expressed as means ± SEM. Significant differences were determined by Student's t‐test, using a significance level of p<0.05. *Significantly different vs. WT mice. VO2 data was analyzed by ANCOVA.
-
Figure 1—source data 1
Optic atrophy 1 (OPA1) deficiency leads to mitochondrial dysfunction in brown adipose tissue (BAT), while improving energy balance and thermoregulation in mice.
- https://cdn.elifesciences.org/articles/66519/elife-66519-fig1-data1-v2.xlsx
Figure 1—figure supplement 1
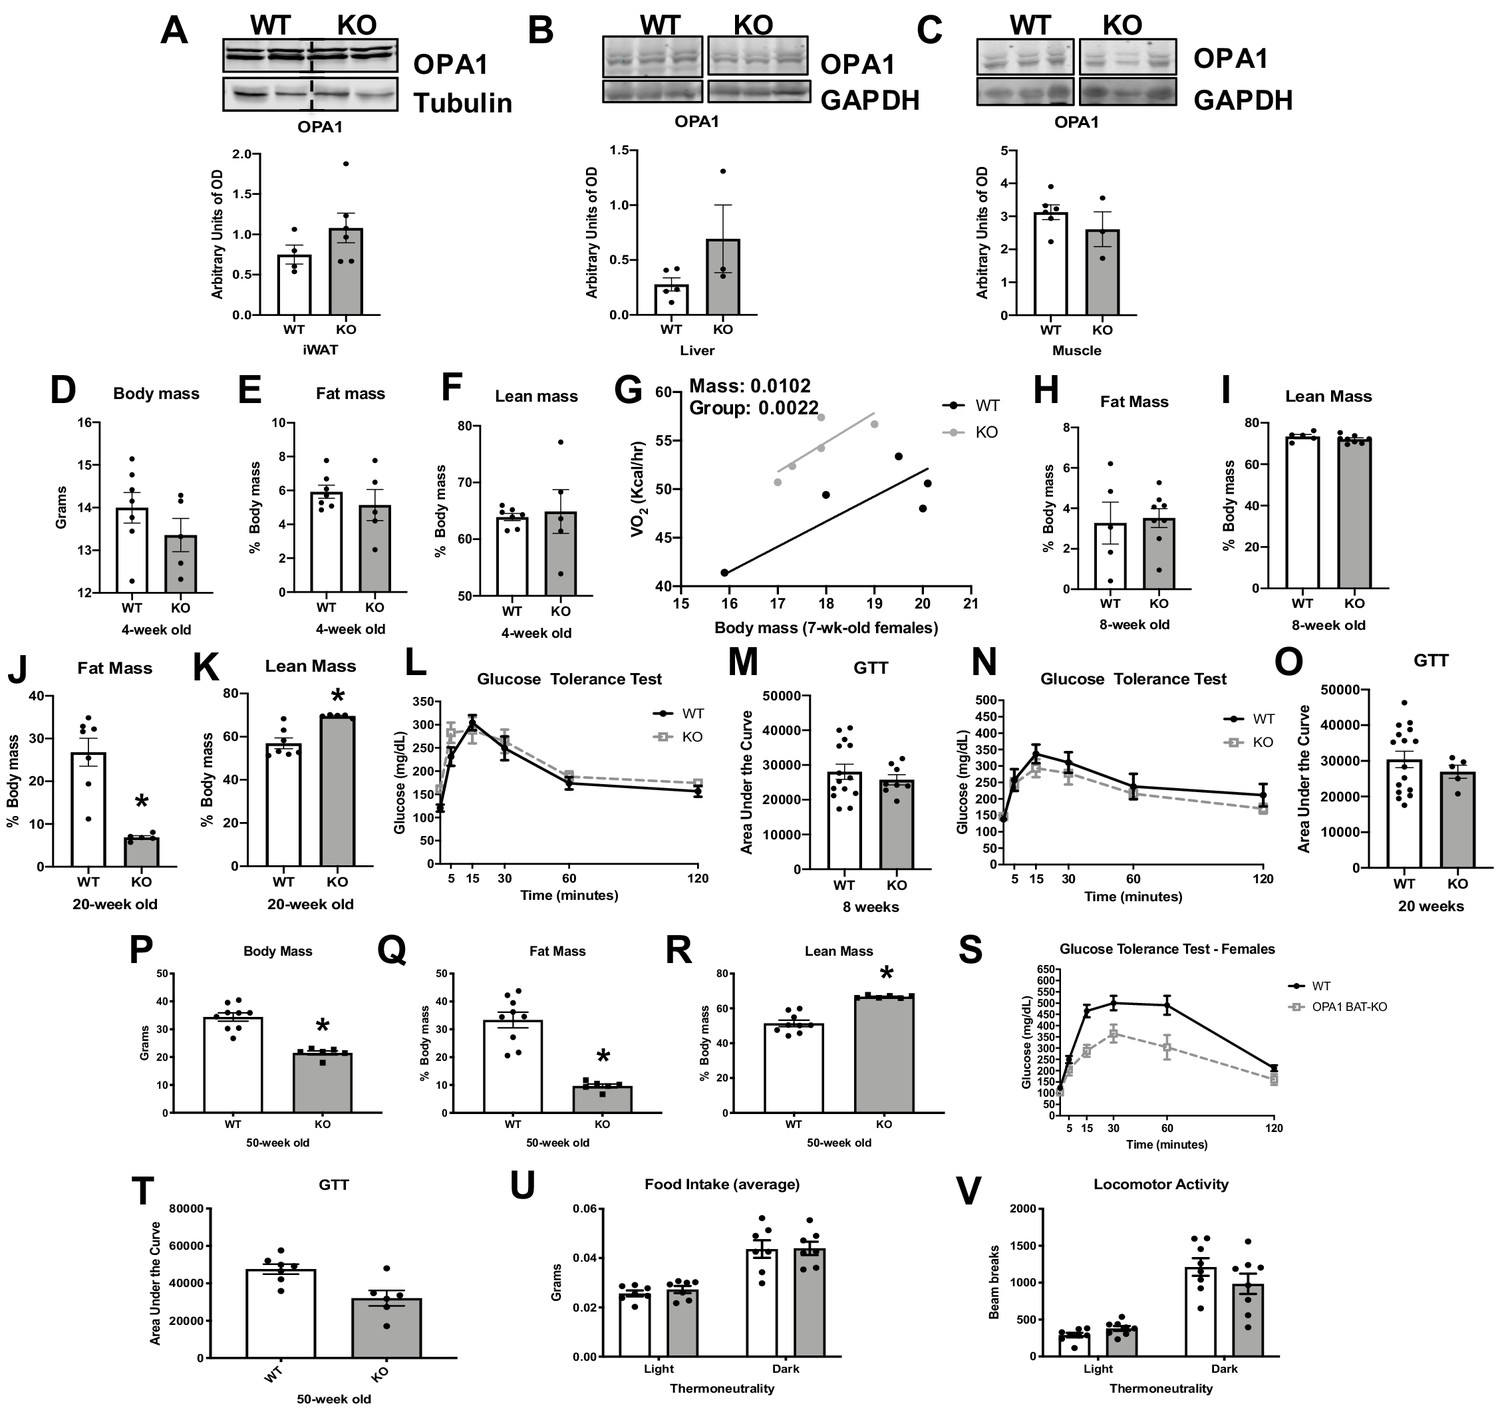
Age-dependent changes in body composition and glucose homeostasis in optic atrophy 1 (OPA1) brown adipose tissue (BAT) knockout (KO) mice.
Related to Figure 1. (A–C) Representative immunoblot of OPA1 and densitometric analysis of OPA1 normalized by tubulin or GAPDH. (A) Inguinal white adipose tissue (iWAT) (dashed line separates genotypes). (B) Liver (images were cropped from the same membrane). (C) Skeletal muscle. (D–F) Body composition in 4-week-old females. (D) Body mass. (E) Percent fat mass to body weight. (F) Percent lean mass to body weight. (G) Regression plot comparing oxygen consumption as a function of body mass. (H) Percent fat mass to body weight in 8-week-old mice. (I) Percent lean mass to body weight in 8-week-old mice. (J) Percent fat mass to body weight in 20-week-old mice. (K) Percent lean mass to body weight in 20-week-old mice. (L) Glucose tolerance test (GTT) in 8-week-old mice. (M) Area under the curve for the GTT performed at 8 weeks. (N) GTT in 20-week-old mice. (O) Area under the curve for the GTT performed at 20 weeks. (P–T) Body composition and glucose homeostasis in 50-week-old female mice. (P) Body mass. (Q) Percent fat mass to body weight. (R) Percent lean mass to body weight. (S) GTT in 50-week-old mice. (T) Area under the curve for the GTT performed at 50 weeks. (U) Food intake measured in 8-week-old mice under thermoneutral conditions. (V) Locomotor activity measured in 8-week-old mice under thermoneutral conditions. Data are expressed as means ± SEM. Data are expressed as means ± SEM. Significant differences were determined by Student's t‐test, using a significance level of p<0.05. * Significantly different vs. wild-type (WT) mice. VO2 data was analyzed by ANCOVA.
-
Figure 1—figure supplement 1—source data 1
Age-dependent changes in body composition and glucose homeostasis in optic atrophy 1 (OPA1) brown adipose tissue (BAT) knockout (KO) mice.
- https://cdn.elifesciences.org/articles/66519/elife-66519-fig1-figsupp1-data1-v2.xlsx
Figure 1—figure supplement 2
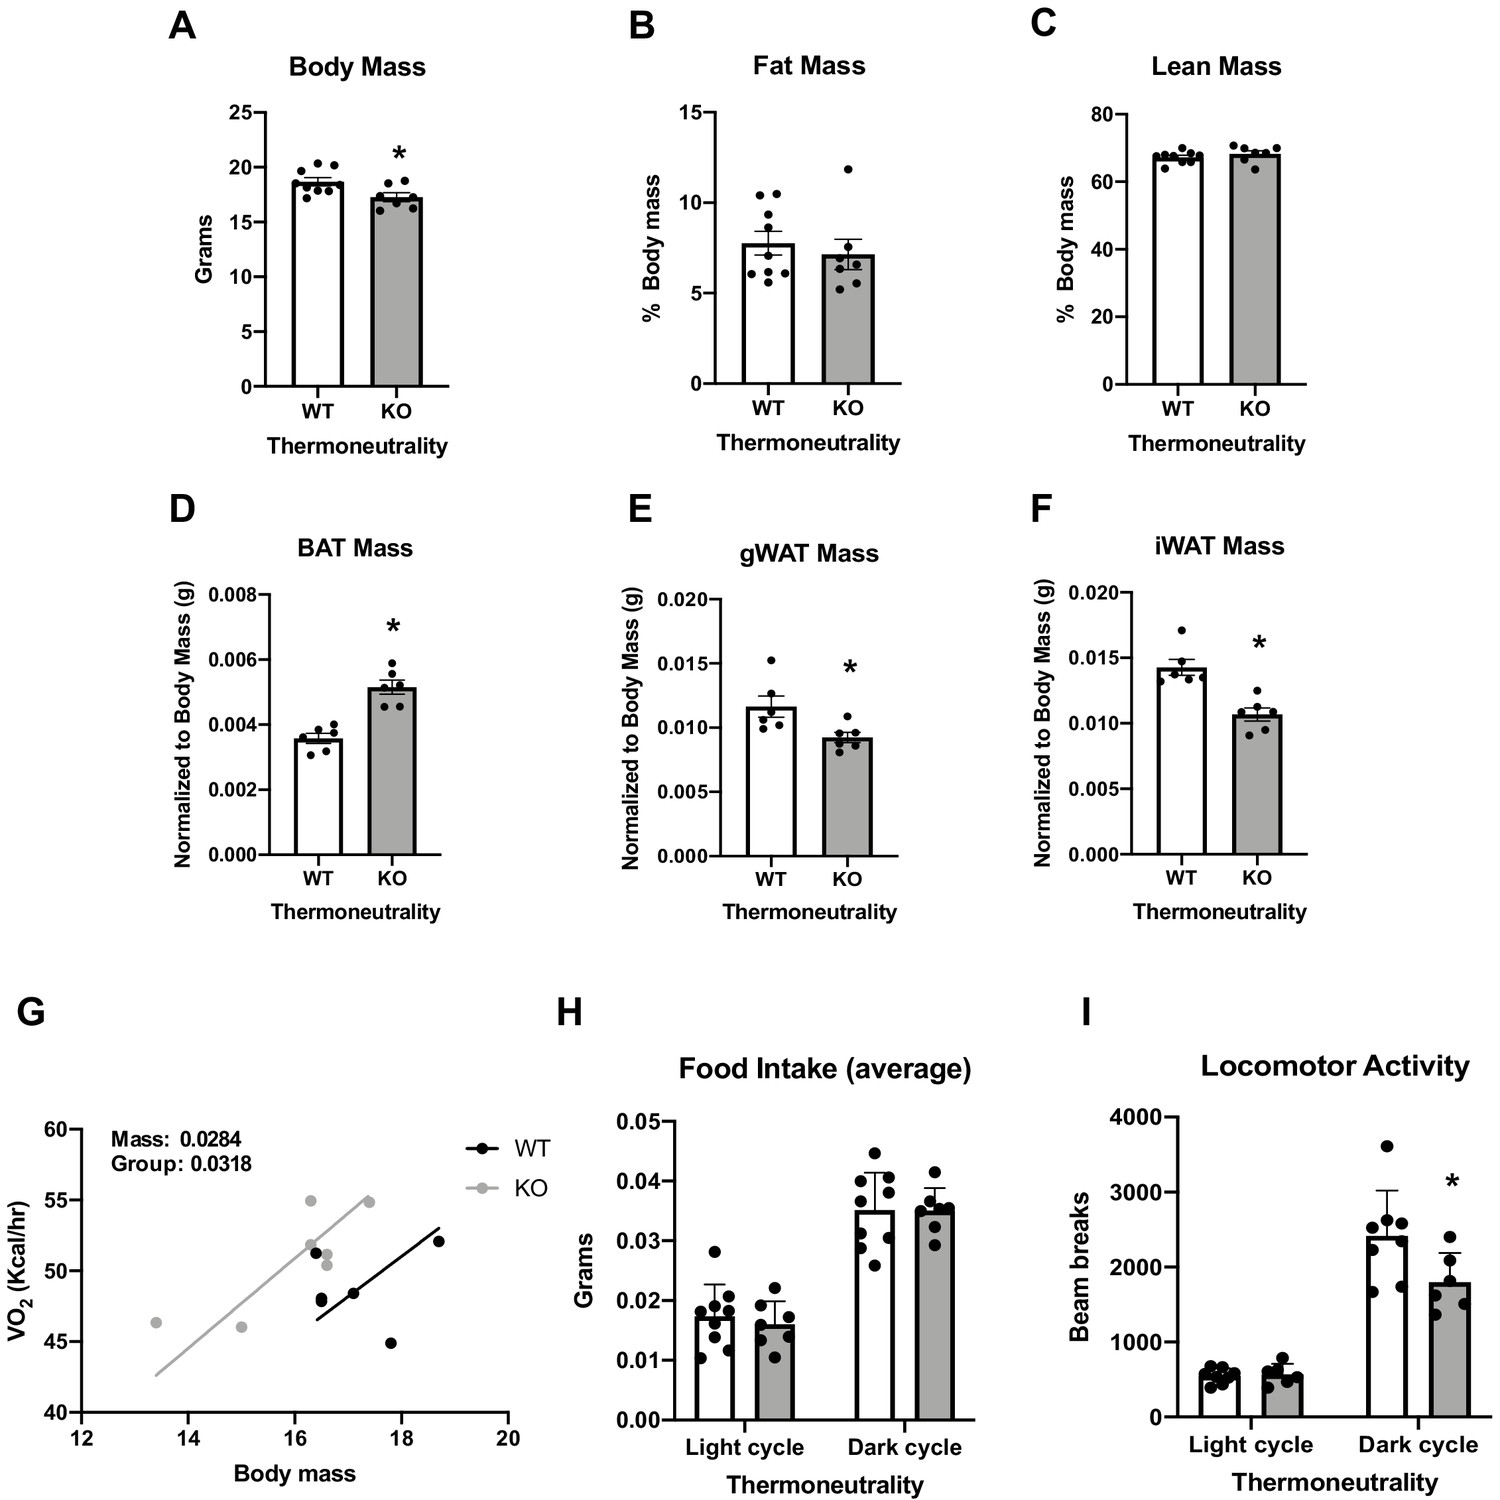
Data collected in 8-week-old optic atrophy 1 (OPA1) brown adipose tissue (BAT) knockout mice (KO) and their wild-type littermate controls (WT) reared at thermoneutrality.
Related to Figure 1. (A) Body mass. (B) Percent fat mass normalized to body weight. (C) Percent lean mass normalized to body weight. (D) BAT mass normalized by body weight. (E) Gonadal white adipose tissue (gWAT) mass normalized by body weight. (F) Inguinal white adipose tissue (iWAT) mass normalized to body weight. (G) Regression plot comparing oxygen consumption as a function of body mass. (H) Average food intake. (I) Locomotor activity. Data are expressed as means ± SEM. Significant differences were determined by Student's t‐test using a significance level of p<0.05. *Significantly different vs. WT mice. VO2 data was analyzed by ANCOVA.
-
Figure 1—figure supplement 2—source data 1
Data collected in 8-week-old optic atrophy 1 (OPA1) brown adipose tissue (BAT) knockout mice (KO) and their wild-type litter mate controls (WT) reared at thermoneutrality.
- https://cdn.elifesciences.org/articles/66519/elife-66519-fig1-figsupp2-data1-v2.xlsx
Figure 2
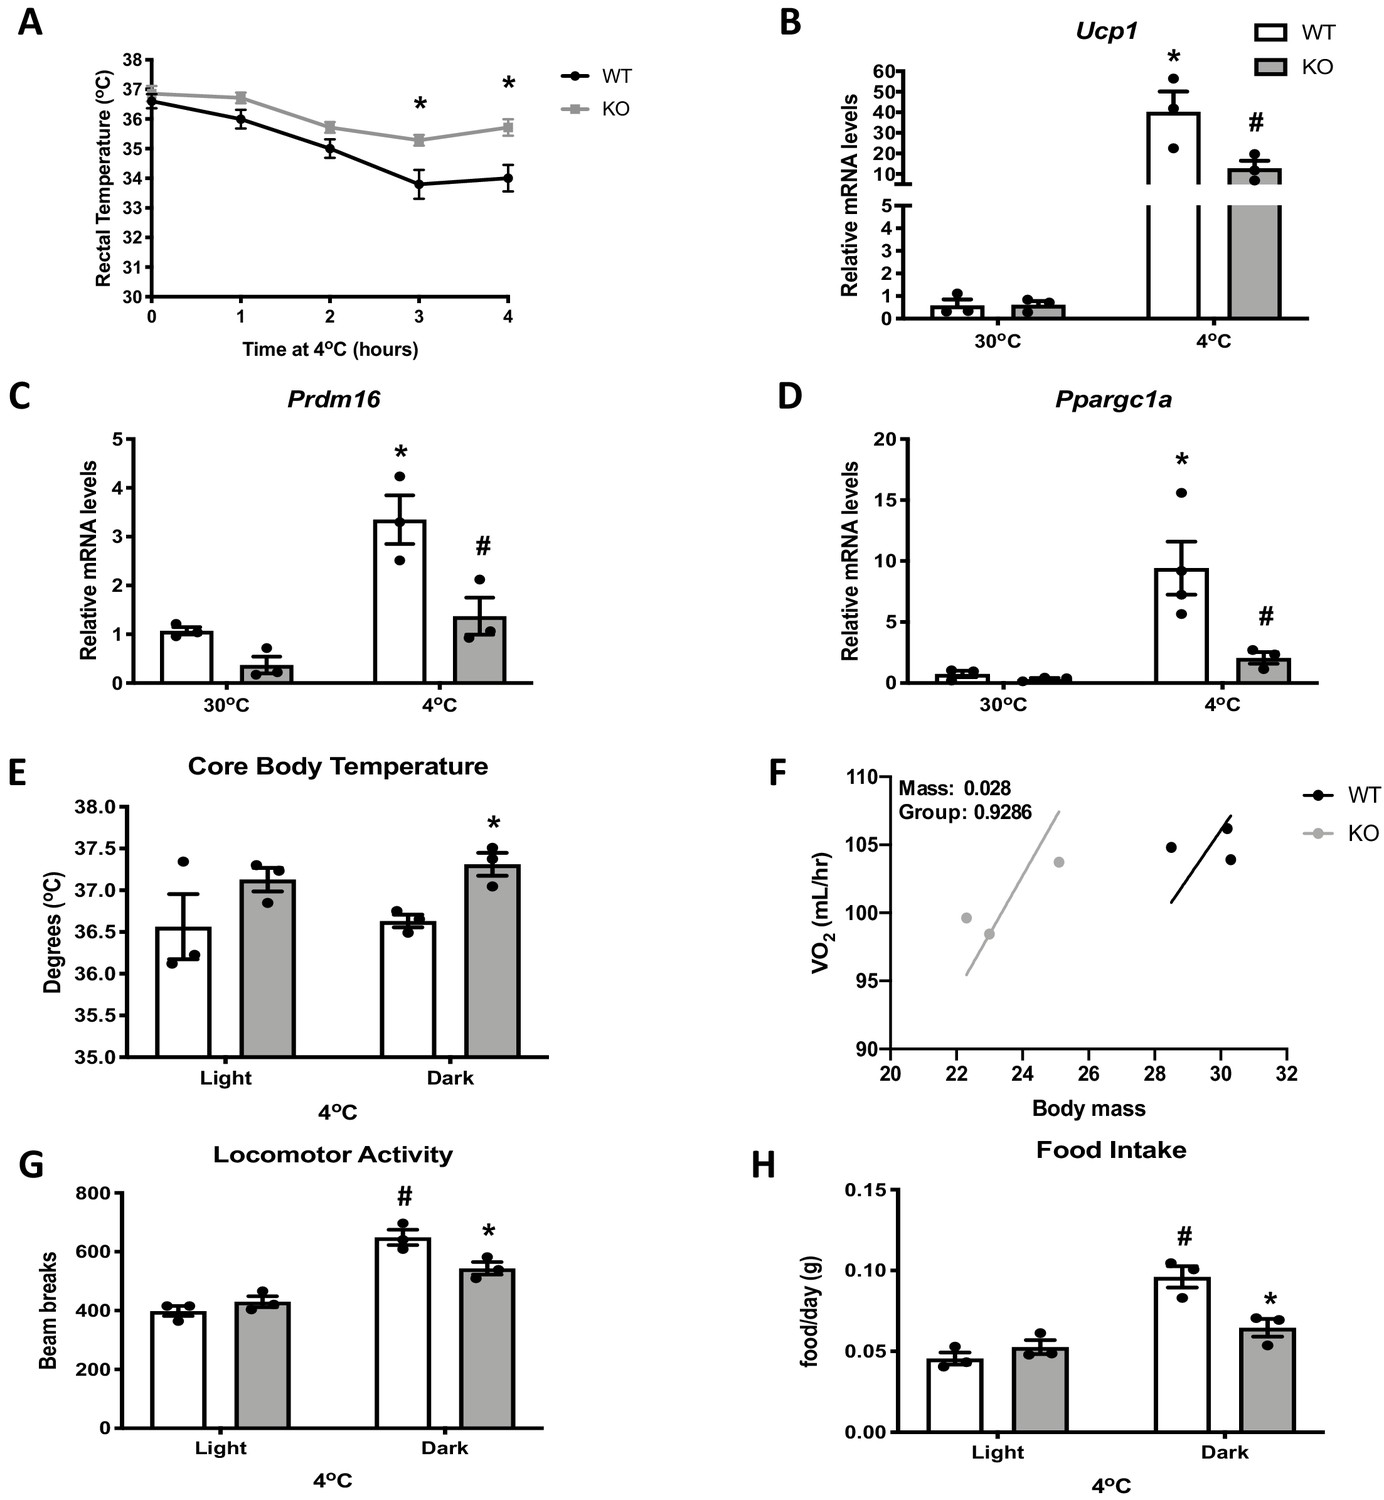
Optic atrophy 1 (OPA1) brown adipose tissue (BAT) knockout (KO) mice exhibit improved tolerance to cold despite impaired thermogenic activation of BAT.
(A) Rectal temperature in 8-week-old wild-type (WT) and KO mice exposed to acute cold stress (4°C) over the period of 4 hr. (B–D) mRNA expression of thermogenic genes in BAT of WT and KO mice housed at 30°C or 4°C for 3 days. (B) Relative Ucp1 mRNA levels. (C) Relative Prdm16 mRNA levels. (D) Relative Ppargc1α mRNA levels. mRNA expression was normalized to Gapdh. (E, F) Indirect calorimetry and core body temperature in WT and KO mice exposed to 4°C for 3 days. (E) Core body temperature. (F) Regression plot comparing oxygen consumption as a function of body mass in mice housed at 4°C. (G) Locomotor activity. (H) Food intake (average for each cycle). Data are expressed as means ± SEM. Significant differences were determined by two-Way ANOVA using a significance level of p<0.05. *Significantly different vs. WT mice or vs. 30°C, #significantly different from light cycle or WT mice at 4°C. VO2 data was analyzed by ANCOVA.
-
Figure 2—source data 1
Optic atrophy 1 (OPA1) brown adipose tissue (BAT) knockout (KO) mice exhibit improved tolerance to cold despite impaired thermogenic activation of BAT.
- https://cdn.elifesciences.org/articles/66519/elife-66519-fig2-data1-v2.xlsx
Figure 3 with 1 supplement

Optic atrophy 1 (OPA1) deletion in brown adipose tissue (BAT) results in compensatory browning of white adipose tissue (WAT).
(A–G) Morphological and functional characterization of inguinal white adipose tissue (iWAT) in 8-week-old wild-type (WT) and knockout (KO) mice. (A) Representative iWAT sections stained with H&E or after immunohistochemistry against uncoupling protein 1 (UCP1). Scale bar = 100 μm (n = 3). (B) Representative immunoblot (dashed line separates genotypes) and densitometric analysis of UCP1 and OPA1 in mitochondria isolated from iWAT normalized to VDAC. (C) Representative electron micrographs of iWAT from WT and KO mice. Scale bar = 2 µm (n = 3). (D) mRNA expression of thermogenic genes. (E, F) Functional analysis of mitochondria isolated from iWAT. (E) State 2 and state 3 pyruvate-malate-supported mitochondrial oxygen consumption rate (OCR). (F) State 2 and state 3 palmitoyl-carnitine-supported mitochondrial OCR. (G) Representative immunoblot (dashed line separates genotypes) and densitometric analysis of tyrosine hydroxylase (TH) normalized to tubulin. (H) Efferent nerve recording in iWAT. (I) mRNA levels of BATokines in BAT extracts from 8-week-old WT and KO mice. (J) Serum levels of fibroblast growth factor 21 (FGF21) in random-fed 8-week-old WT and KO mice. (K) Representative immunoblots of OPA1 normalized to actin in primary brown adipocytes (dashed line separates genotypes). (L) Densitometric analysis of OPA1 normalized to tubulin in brown adipocytes. (M) FGF21 levels measured in the culture media collected from WT and OPA1-deficient brown adipocytes. Data are expressed as means ± SEM. Significant differences were determined by Student's t‐test, using a significance level of p<0.05. *Significantly different vs. WT mice.
-
Figure 3—source data 1
Optic atrophy 1 (OPA1) deletion in brown adipose tissue (BAT) results in compensatory browning of white adipose tissue (WAT).
- https://cdn.elifesciences.org/articles/66519/elife-66519-fig3-data1-v2.xlsx
Figure 3—figure supplement 1
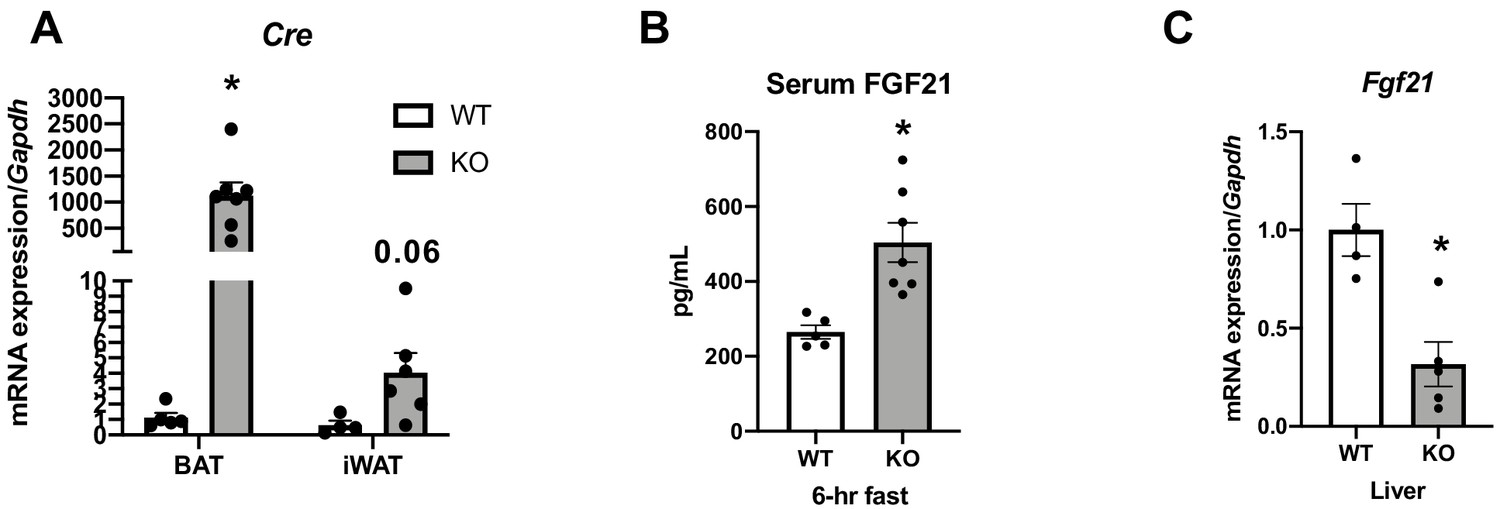
Data collected in 8-week-old optic atrophy 1 (OPA1) brown adipose tissue (BAT) knockout mice (KO) and their wild-type littermate controls (WT) at room temperature conditions.
Related to Figure 3. (A) Cre mRNA expression in BAT and inguinal white adipose tissue (iWAT) normalized to Gapdh expression. (B) Fasting fibroblast growth factor 21 (FGF21) serum levels (C) Fgf21 mRNA expression in livers normalized to Gapdh expression. Data are expressed as means ± SEM. Significant differences were determined by Student's t‐test using a significance level of p<0.05. *Significantly different vs. WT mice.
-
Figure 3—figure supplement 1—source data 1
Data collected in 8-week-old optic atrophy 1 (OPA1) brown adipose tissue (BAT) knockout KO mice (KO) and their wild-type littermate controls (WT) at room temperature conditions.
- https://cdn.elifesciences.org/articles/66519/elife-66519-fig3-figsupp1-data1-v2.xlsx
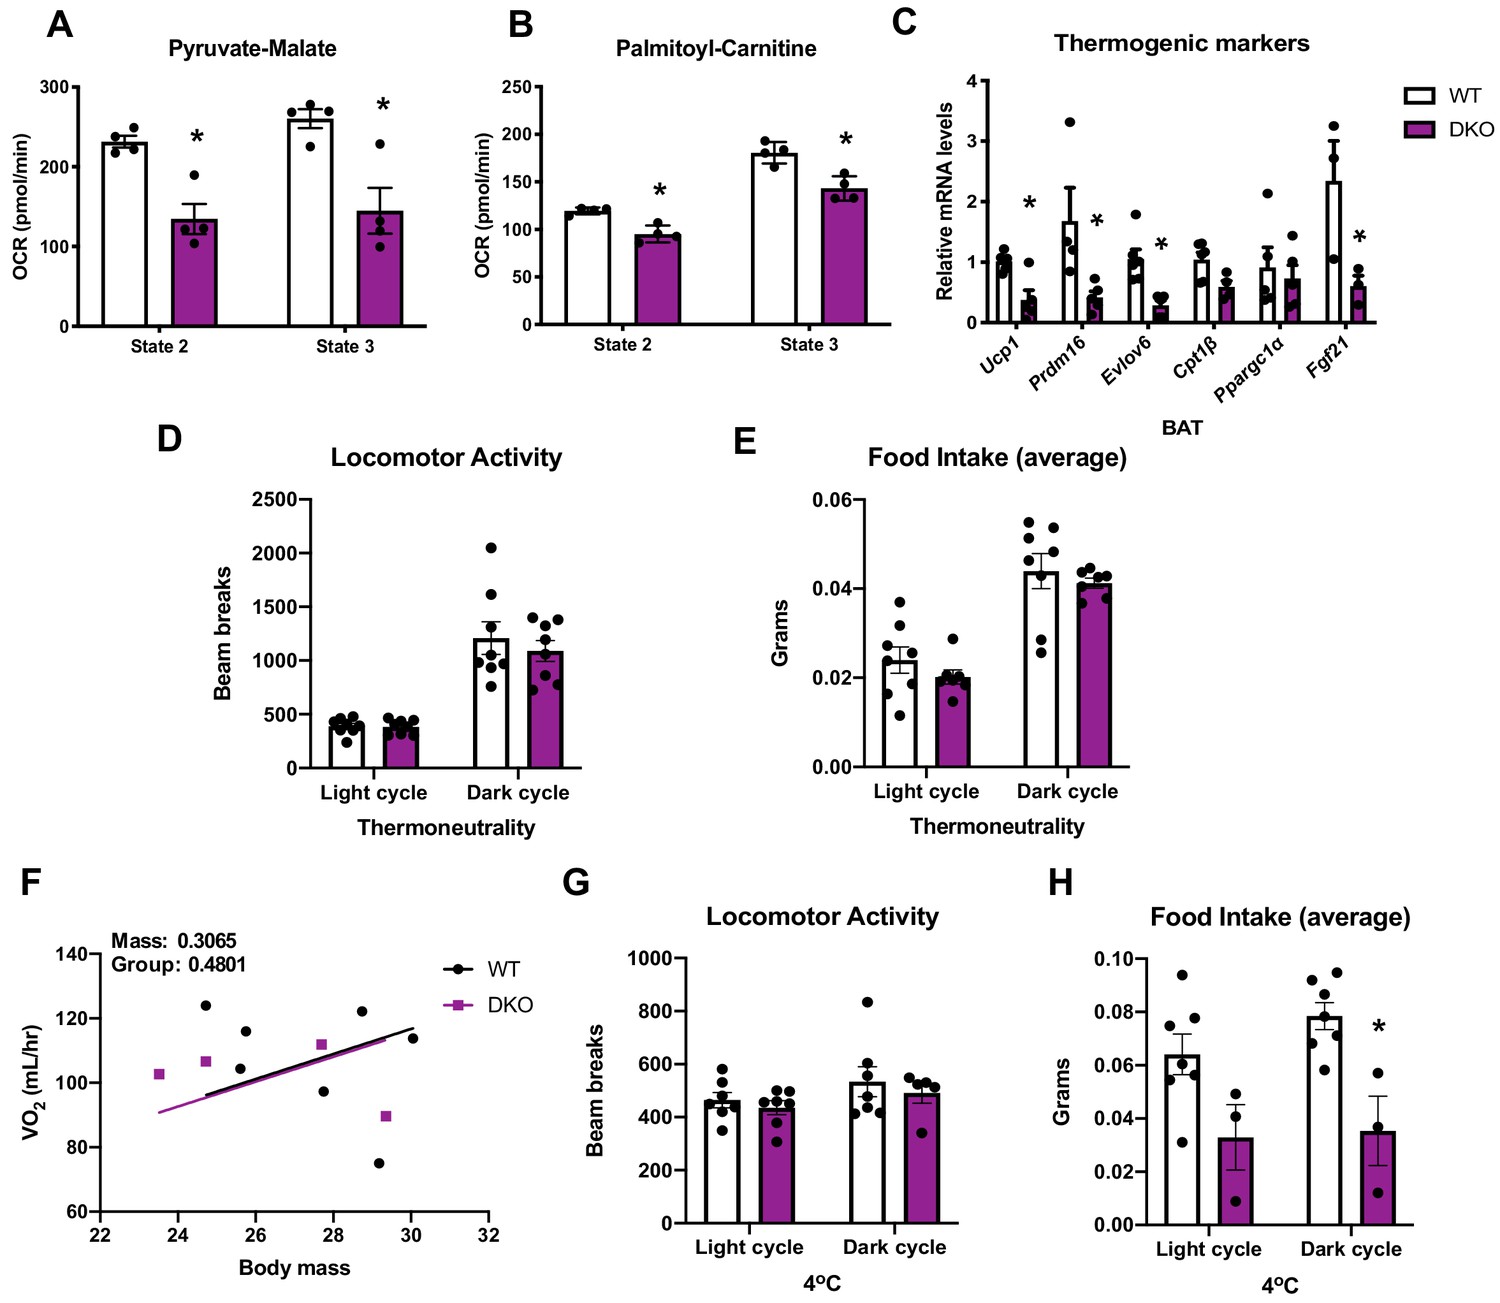
Figure 4 with 1 supplement
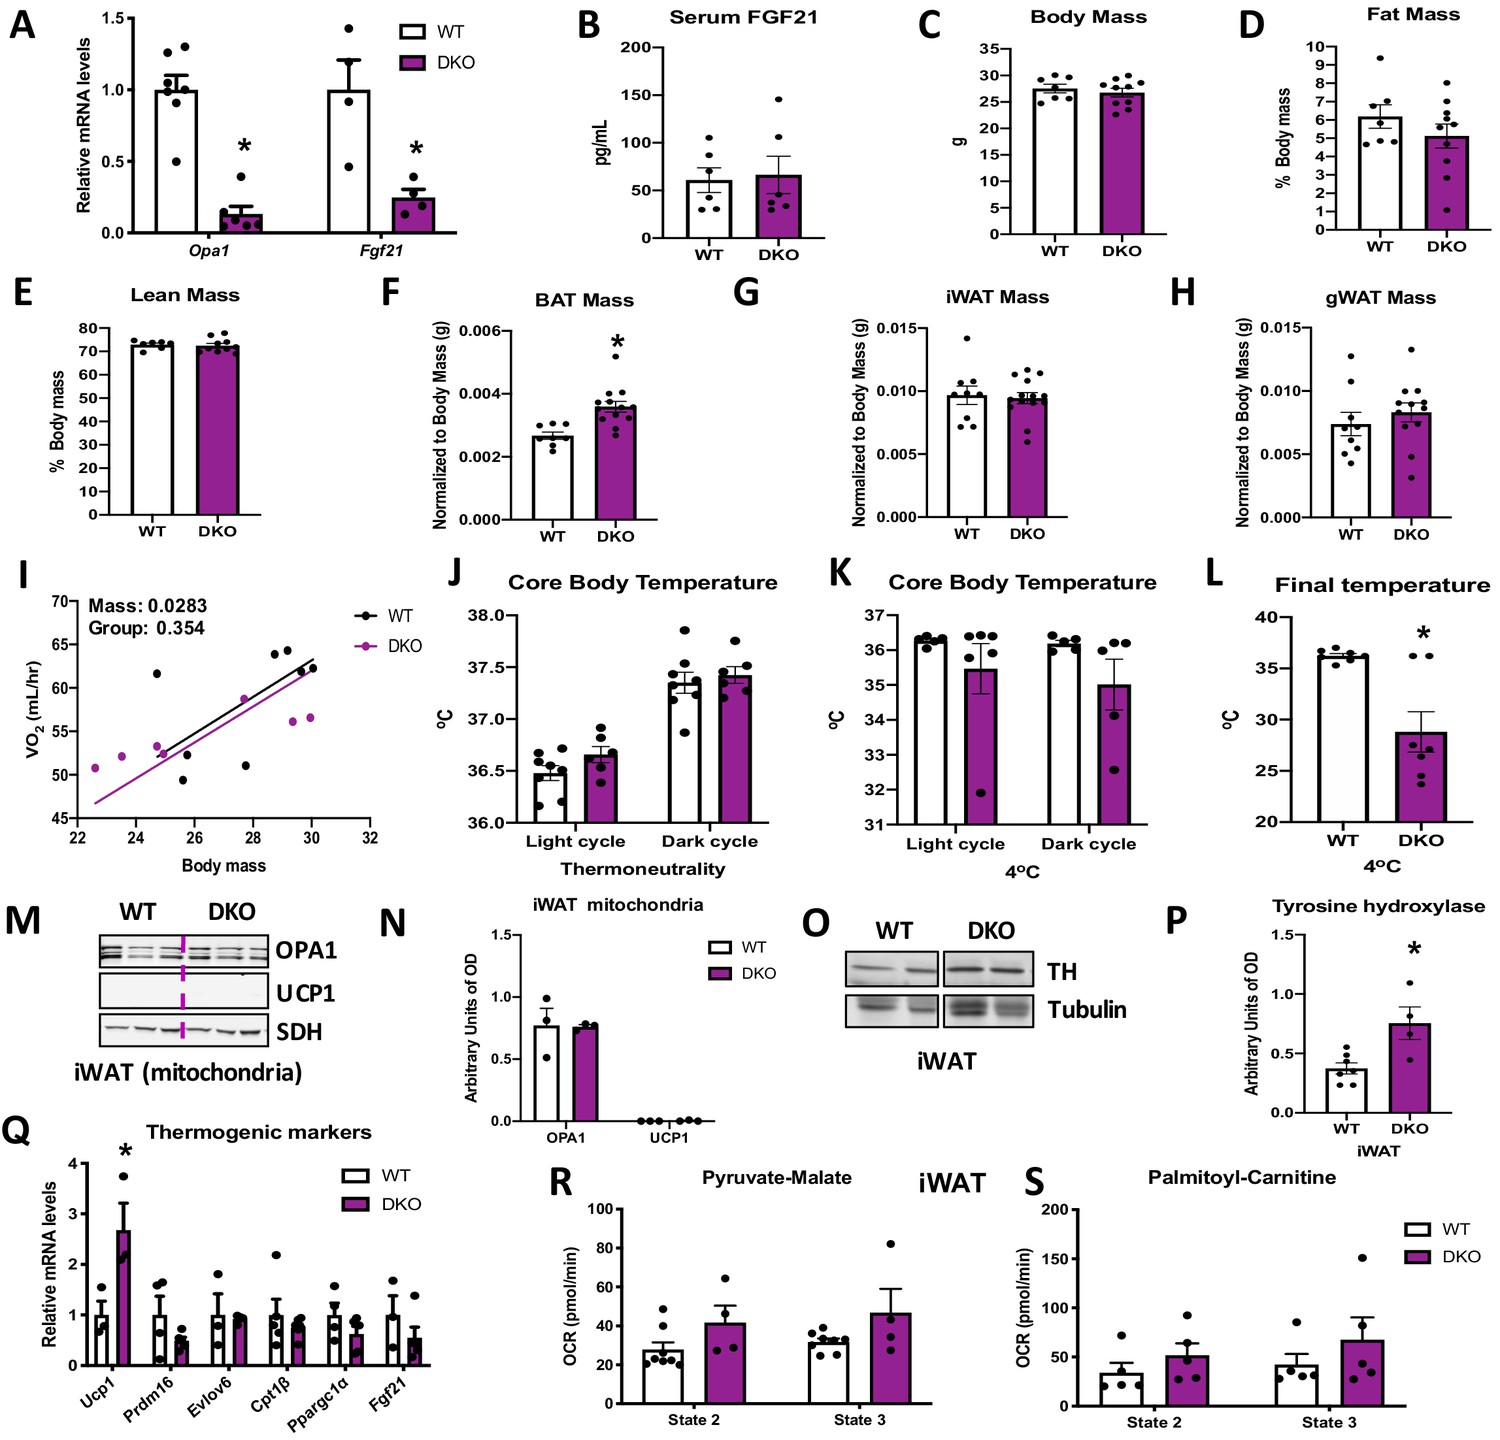
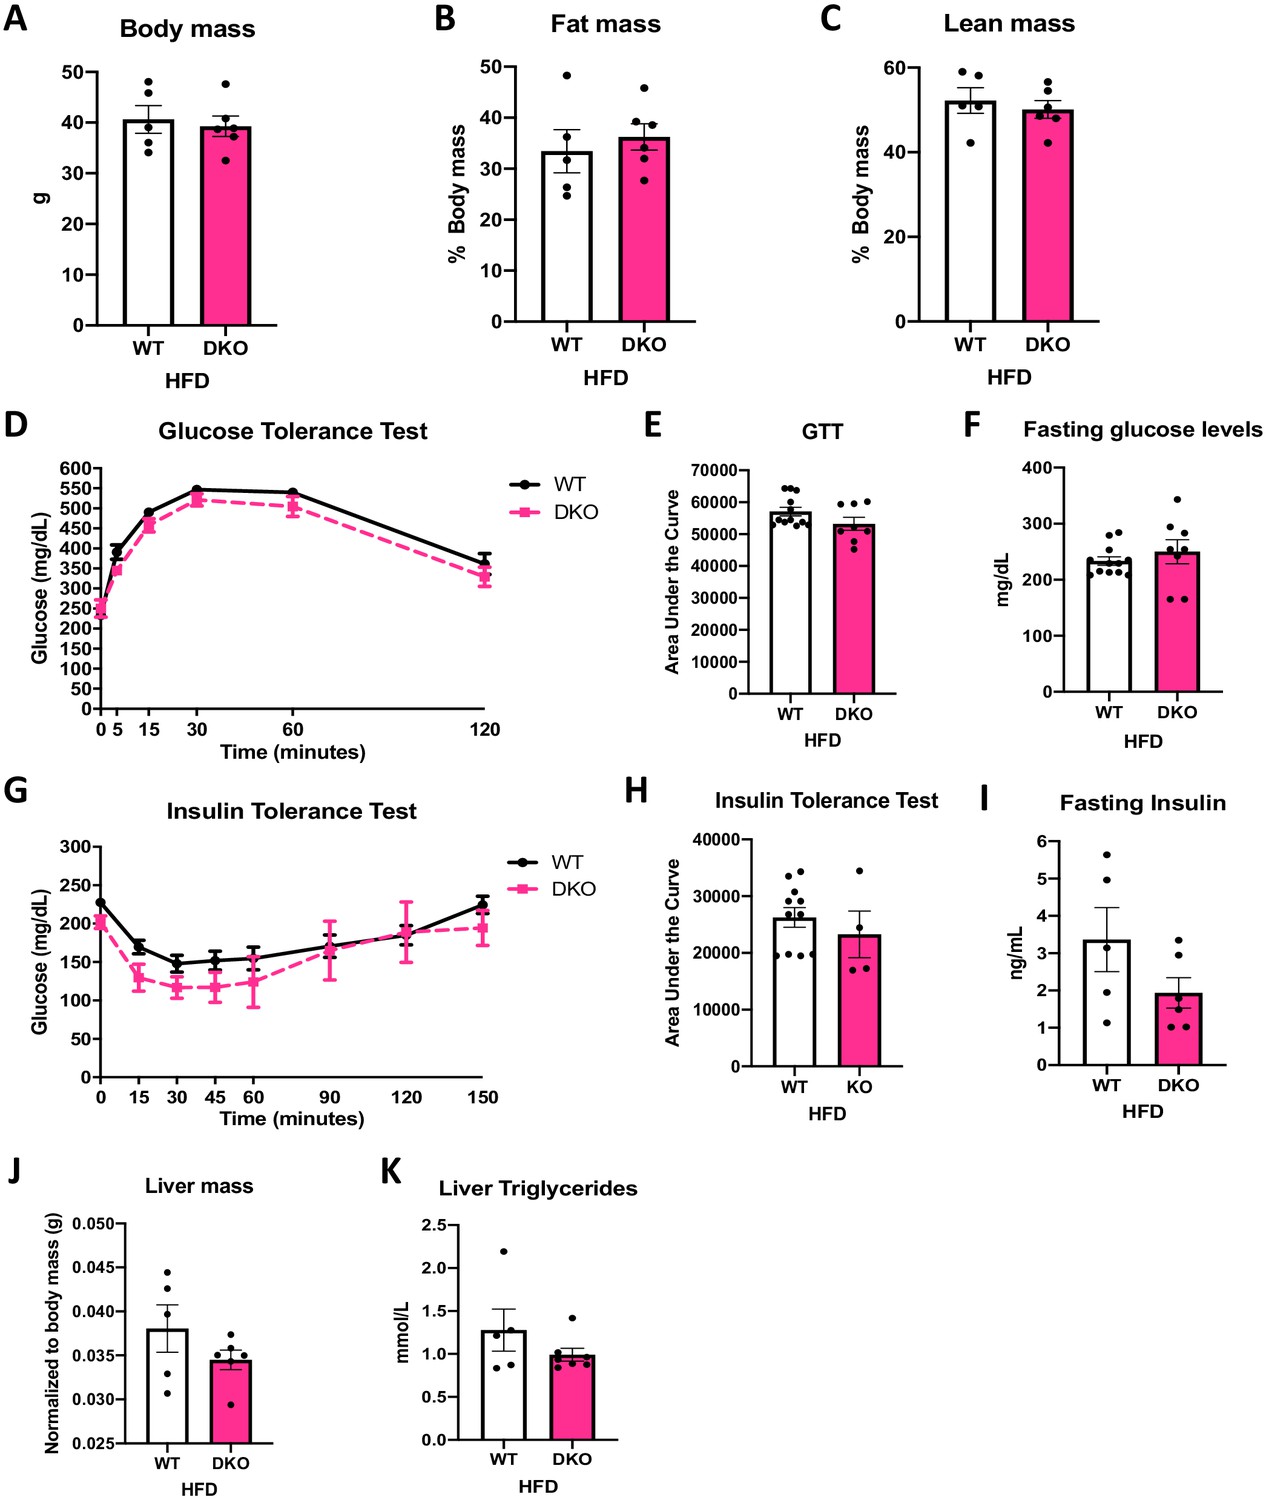
Brown adipose tissue (BAT)-derived fibroblast growth factor 21 (FGF21) is required for increased resting metabolic rates and improved thermoregulation in mice lacking optic atrophy 1 (OPA1) in BAT during isocaloric feeding.
(A–L) Data characterizing 8–12-week-old OPA1/FGF21 DKO mice. (A) mRNA expression of Opa1 and Fgf21 in BAT of DKO mice. (B) FGF21 serum levels collected under ad libitum-fed conditions. (C) Total body mass. (D) Percent fat mass. (E) Percent lean mass. (F) BAT mass. (G) Inguinal white adipose tissue (iWAT) mass. (H) Gonadal white adipose tissue (gWAT) mass. (I) Regression plot comparing oxygen consumption as a function of body mass in mice housed at 30°C. (J) Core body temperature (30°C). (K) Core body temperature (4°C) (data is represented as average core body temperature during the light and dark cycles over 3 days of continuous monitoring). (L) Final core body temperature recorded for each individual mouse (4°C). (M–S) Data of iWAT from 8-week-old DKO mice. (M). Representative immunoblot for OPA1 and uncoupling protein 1 (UCP1) in isolated mitochondria (dashed line separates genotypes). (N) Densitometric analysis of OPA1 and UCP1 protein levels normalized to succinate dehydrogenase (SDH). (O) Representative immunoblot for tyrosine hydroxylase (TH) in iWAT (images were cropped from the same membrane). (P) Densitometric analysis of TH protein levels normalized to tubulin. (Q) mRNA expression of thermogenic genes in iWAT. (R, S) Functional analysis of mitochondria isolated from iWAT. (R) State 2 and state 3 pyruvate-malate-supported mitochondrial OCR. (S) State 2 and state 3 palmitoyl-carnitine-supported mitochondrial oxygen consumption rate (OCR). Data are expressed as means ± SEM. Significant differences were determined by Student's t‐test or two-way ANOVA, using a significance level of p<0.05. *Significantly different vs. wild-type (WT) mice. VO2 data was analyzed by ANCOVA.
-
Figure 4—source data 1
Brown adipose tissue (BAT)-derived fibroblast growth factor 21 (FGF21) is required for increased resting metabolic rates and improved thermoregulation in mice lacking optic atrophy 1 (OPA1) in BAT during isocaloric feeding.
- https://cdn.elifesciences.org/articles/66519/elife-66519-fig4-data1-v2.xlsx
Figure 4—figure supplement 1
Data collected in optic atrophy 1 (OPA1)/fibroblast growth factor 21 (FGF21) brown adipose tissue (BAT) DKO mice and their wild-type littermate controls (WT).
Related to Figure 4. (A) State 2 and state 3 pyruvate-malate-supported oxygen consumption rates (OCRs) in mitochondria isolated from BAT. (B) State 2 and state 3 palmitoyl-carnitine-supported OCR in mitochondria isolated from BAT. (C) mRNA expression of thermogenic genes in BAT tissue collected from mice raised at room temperature (22°C). (D) Locomotor activity in 10-week-old male mice measured at thermoneutrality (30°C). (E) Average food intake in 10-week-old male mice measured at thermoneutrality. (F) Regression plot comparing oxygen consumption as a function of body mass in 10-week-old male mice housed at 4°C for 3 days. (G) Locomotor activity measured in 10-week-old male mice housed at 4°C for 3 days. (H) Average food intake measured in 10-week-old male mice housed at 4°C for 3 days. Data are expressed as means ± SEM. Significant differences were determined by Student's t‐test, using a significance level of p<0.05. *Significantly different vs. WT mice. VO2 data was analyzed by ANCOVA.
-
Figure 4—figure supplement 1—source data 1
Data collected in optic atrophy 1 (OPA1)/fibroblast growth factor 21 (FGF21) brown adipose tissue (BAT) DKO mice and their wild-type littermate controls (WT).
- https://cdn.elifesciences.org/articles/66519/elife-66519-fig4-figsupp1-data1-v2.xlsx
Figure 5 with 1 supplement

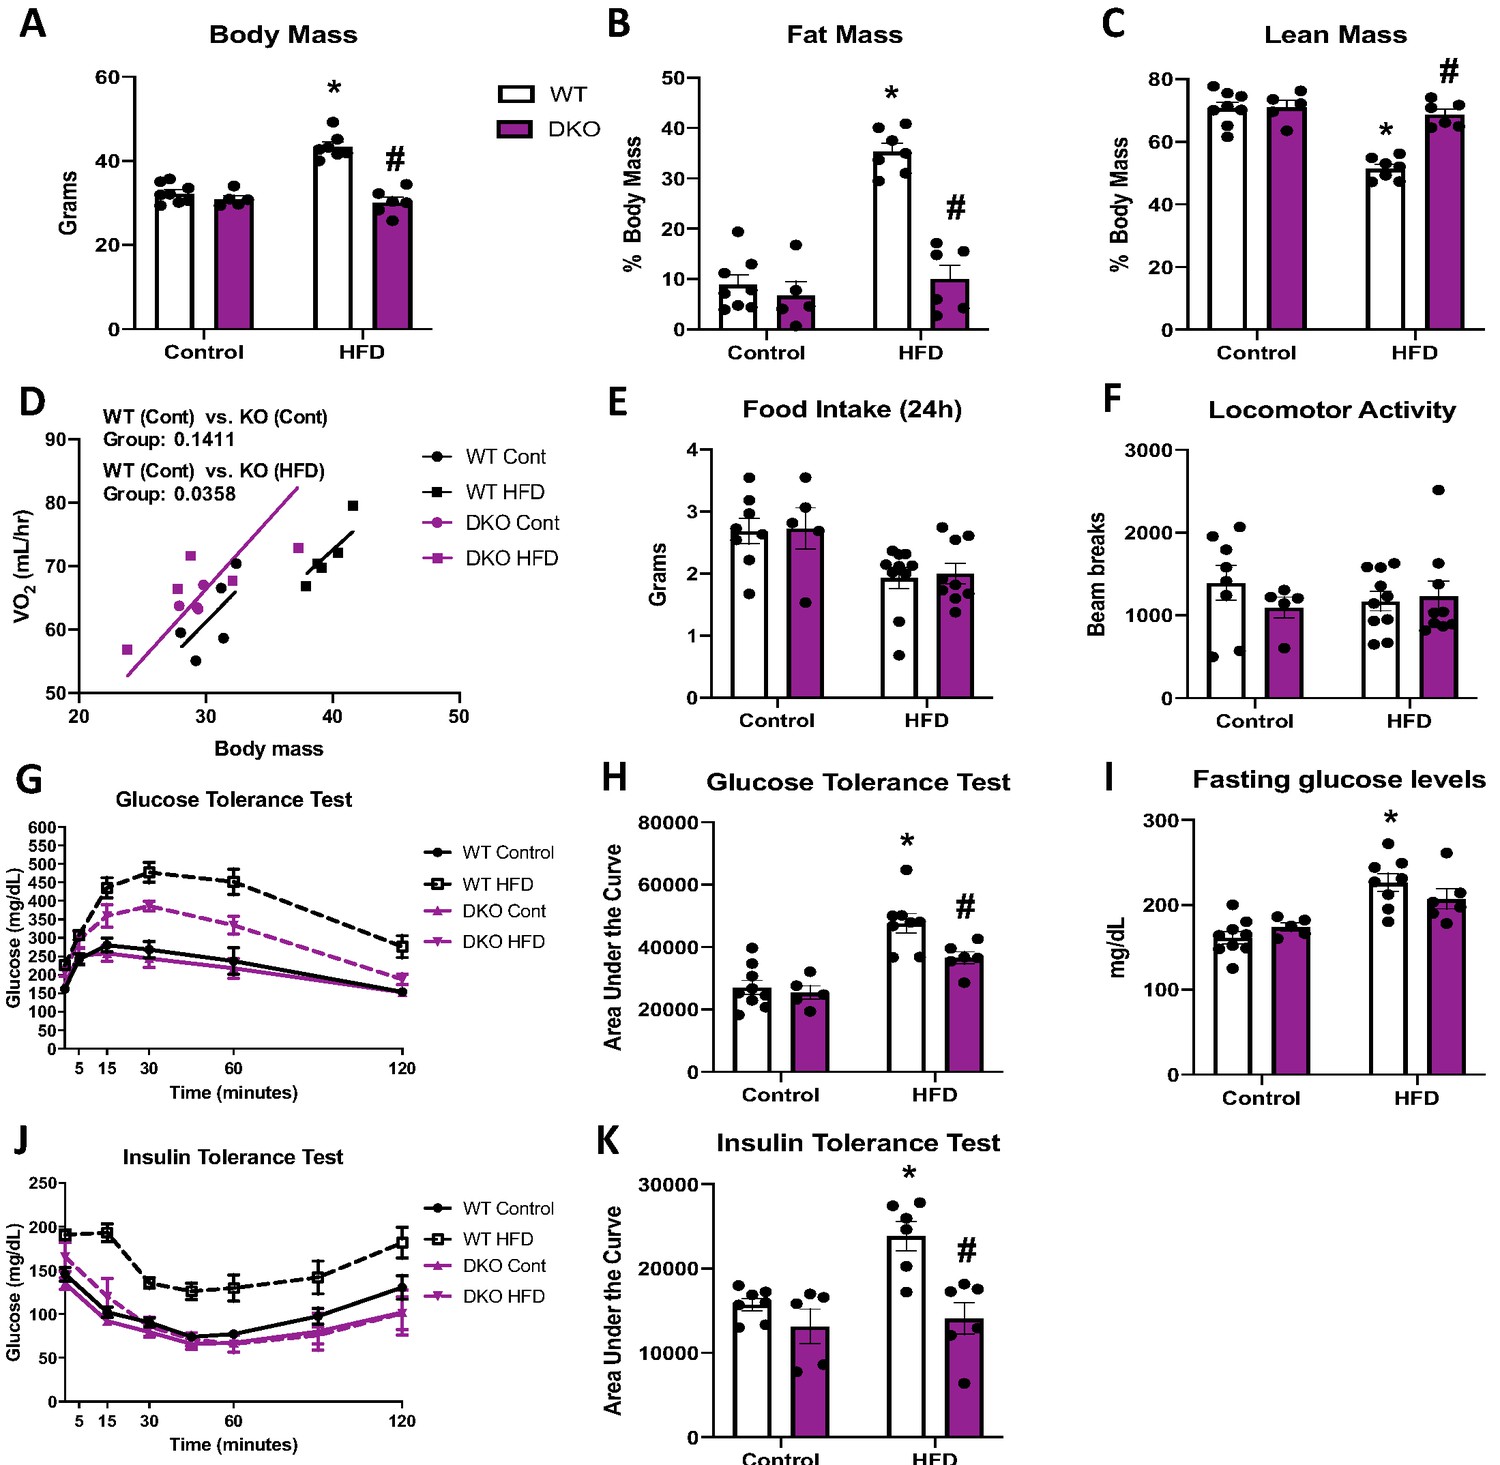
Optic atrophy 1 (OPA1) deletion in brown adipose tissue (BAT) prevents diet-induced obesity and insulin resistance.
(A–O) Data from wild-type (WT) and OPA1 BAT knockout (KO) mice fed either a control diet (Cont) or a high-fat diet (HFD) for 12 weeks. (A) Total body mass. (B) Percent ratio of fat mass to body mass. (C) Percent ratio of lean mass to body mass. (D) BAT mass. (E) Gonadal white adipose tissue (gWAT) mass. (F) Inguinal white adipose tissue (iWAT) mass. (G) Regression plot comparing oxygen consumption as a function of body mass. (H) Food intake during a 24 hr period. (I) Locomotor activity. (J) Glucose tolerance test (GTT). (K) Area under the curve for the GTT. (L) Fasting glucose levels. (M) Insulin tolerance test (ITT). (N) Area under the curve for the ITT. (O) Fasting insulin levels. Data are expressed as means ± SEM. Significant differences were determined by two-way ANOVA, using a significance level of p<0.05. *Significantly different vs. WT control, #significantly different vs. WT HFD. VO2 data was analyzed by ANCOVA.
-
Figure 5—source data 1
Optic atrophy 1 (OPA1) deletion in brown adipose tissue (BAT) prevents diet-induced obesity and insulin resistance.
- https://cdn.elifesciences.org/articles/66519/elife-66519-fig5-data1-v2.xlsx
Figure 5—figure supplement 1
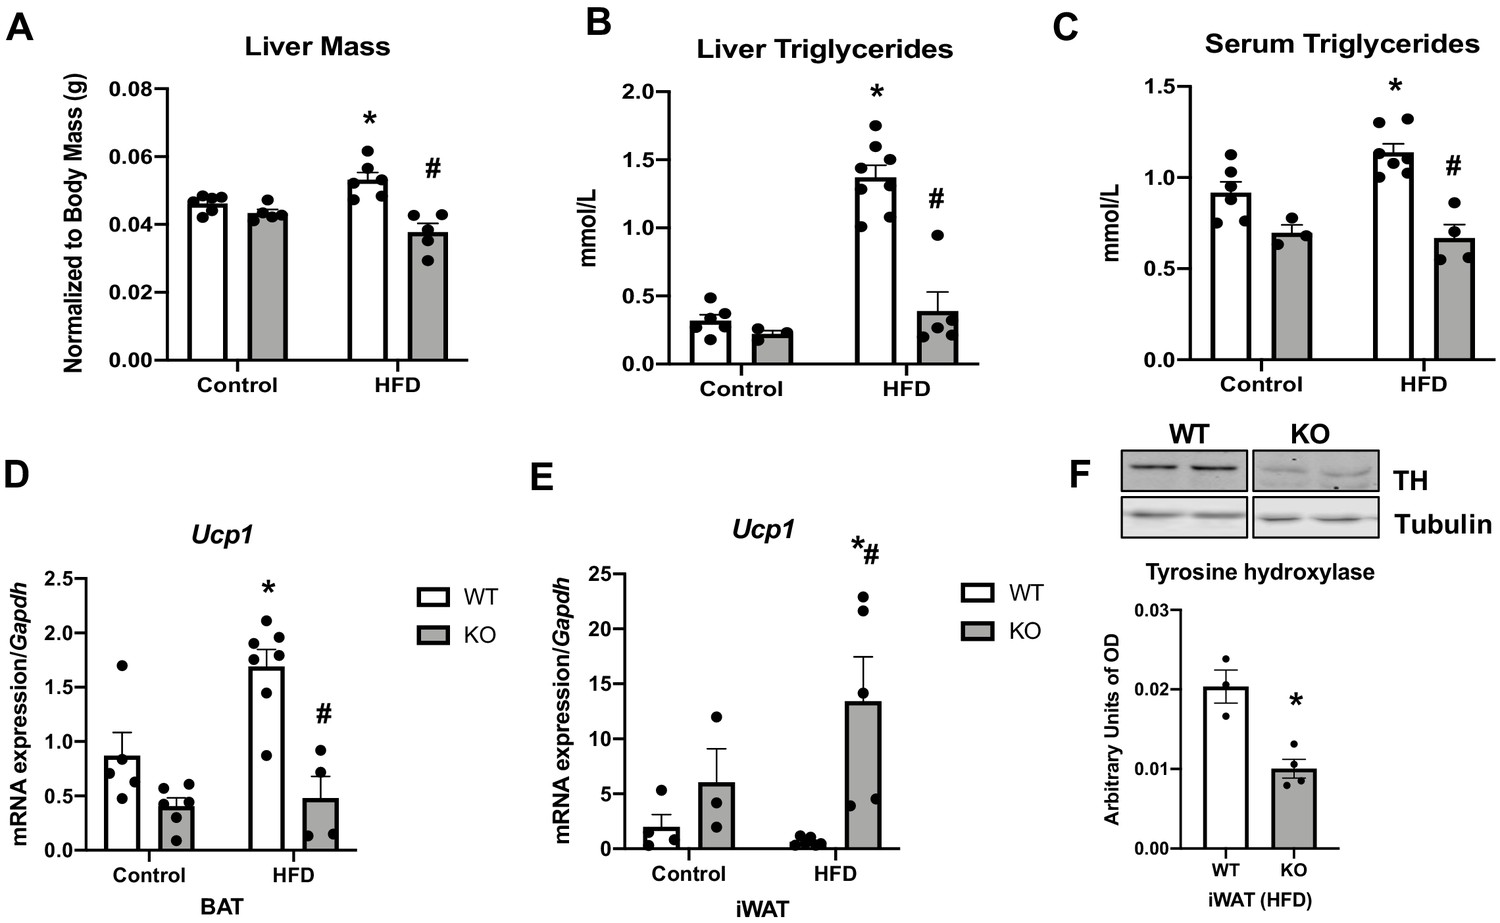
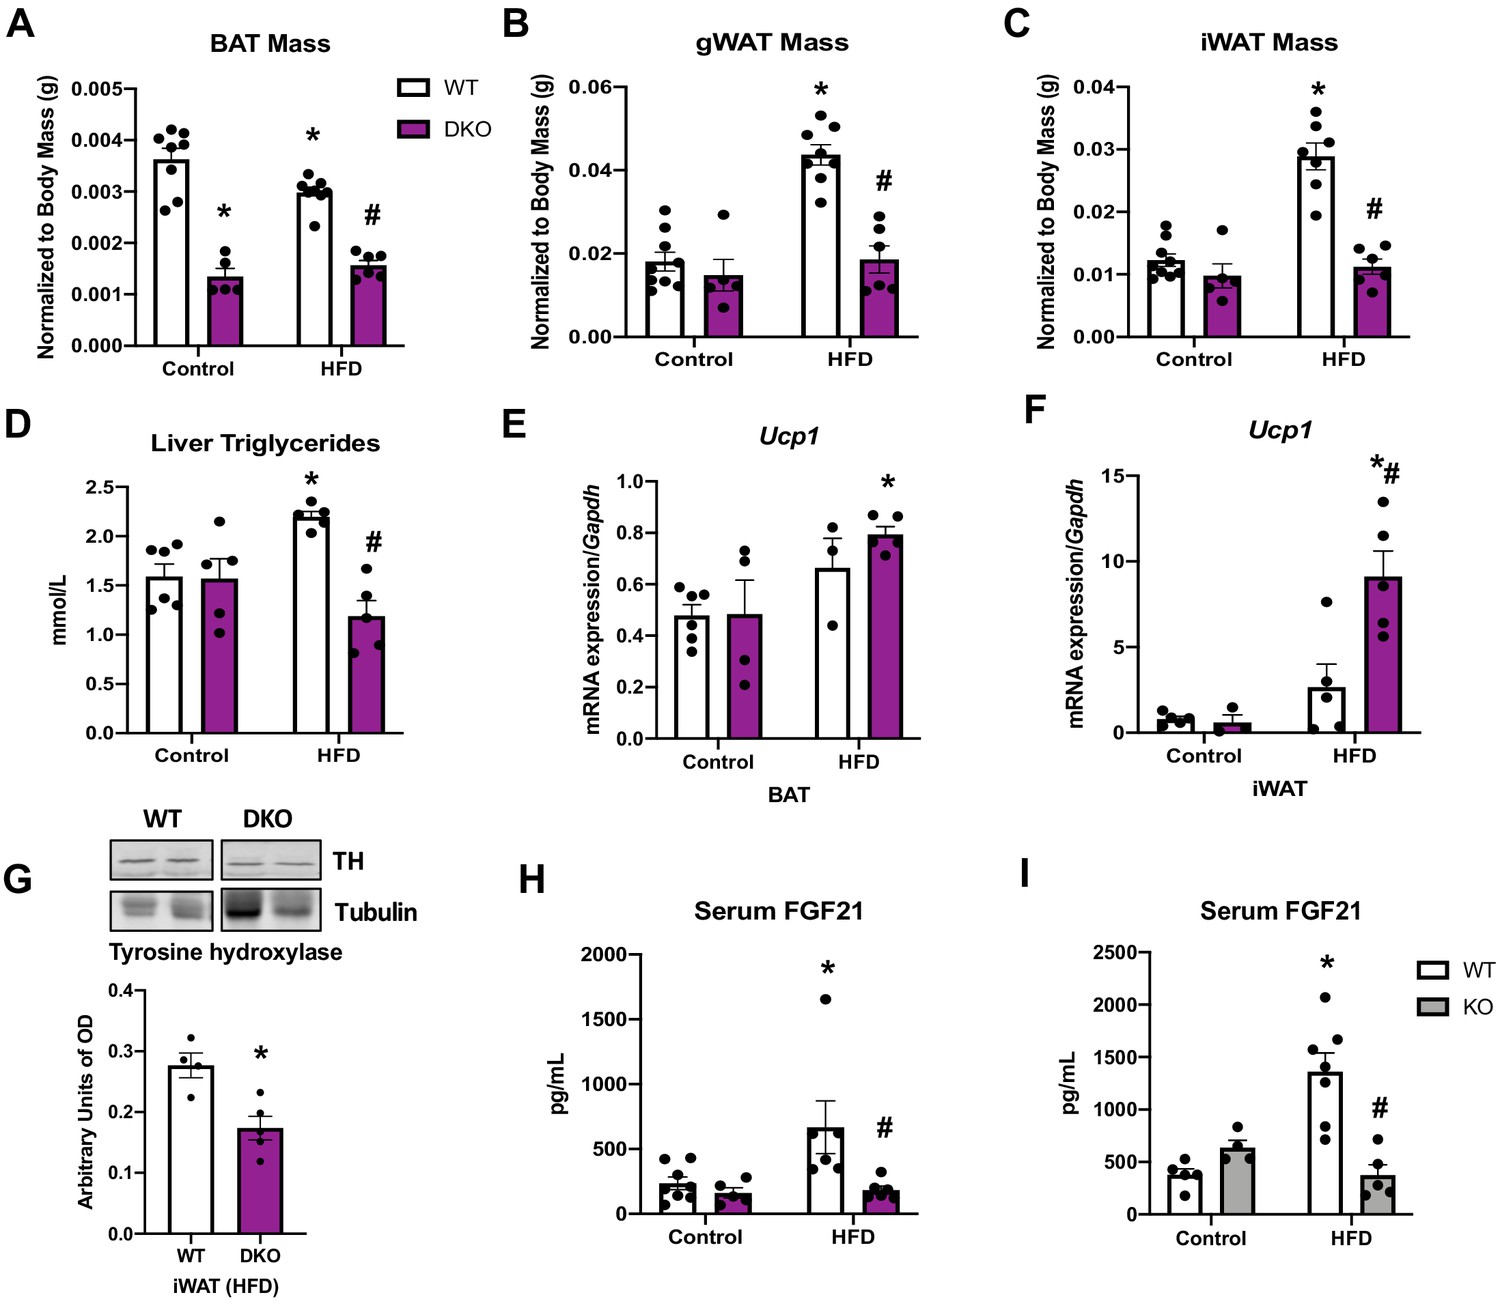
Data collected in optic atrophy 1 (OPA1) brown adipose tissue (BAT) knockout mice (KO) and their wild-type littermate controls (WT) fed either control (10% fat content) or high-fat diet (HFD) (60% fat content) for 12 weeks.
Related to Figure 5. (A) Liver mass. (B) Liver triglycerides levels. (C) Serum triglycerides levels. (D) mRNA expression of Ucp1 in BAT. (E) mRNA expression of Ucp1 in inguinal white adipose tissue (iWAT). (F) Representative immunoblot of tyrosine hydroxylase (TH) levels in iWAT of mice fed a HFD and densitometric quantification normalized by tubulin (images were cropped from the same membrane). Data are expressed as means ± SEM. Significant differences were determined by two-way ANOVA, using a significance level of p<0.05. *Significantly different vs. WT control, #significantly different vs. WT HFD.
-
Figure 5—figure supplement 1—source data 1
Data collected in optic atrophy 1 (OPA1) brown adipose tissue (BAT) knockout KO mice (KO) and their wild-type litter mate controls (WT) fed either control (10% fat content) or high-fat diet (HFD) (60% fat content) for 12 weeks.
- https://cdn.elifesciences.org/articles/66519/elife-66519-fig5-figsupp1-data1-v2.xlsx
Figure 6 with 1 supplement
Brown adipose tissue (BAT)-derived fibroblast growth factor 21 (FGF21) does not mediate resistance to diet-induced obesity in optic atrophy 1 (OPA1) BAT knockout (KO) mice.
(A–K) Data from wild-type (WT) and OPA1/FGF21 DKO mice fed either a control diet (Cont) or a high-fat diet (HFD) for 12 weeks. (A) Total body mass. (B) Percent ratio of fat mass to body mass. (C) Percent ratio of lean mass to body mass. (D) Regression plot comparing oxygen consumption as a function of body mass. (E) Food intake during a 24 hr period. (F) Locomotor activity. (G) Glucose tolerance test. (H) Area under the curve for the glucose tolerance test. (I) Fasting glucose levels. (J) Insulin tolerance test. (K) Area under the curve for the insulin tolerance test. Data are expressed as means ± SEM. Significant differences were determined by two-way ANOVA, using a significance level of p<0.05. *Significantly different vs. WT control, #significantly different vs. WT HFD. VO2 data was analyzed by ANCOVA.
-
Figure 6—source data 1
Brown adipose tissue (BAT)-derived fibroblast growth factor 21 (FGF21) does not mediate resistance to diet-induced obesity in optic atrophy 1 (OPA1) BAT knockout (KO) mice.
- https://cdn.elifesciences.org/articles/66519/elife-66519-fig6-data1-v2.xlsx
Figure 6—figure supplement 1
Data collected in optic atrophy 1 (OPA1) brown adipose tissue (BAT) knockout mice (KO), OPA1/fibroblast growth factor 21 (FGF21) DKO mice or their respective wild-type littermate controls (WT) fed either control (10% fat content) or high-fat diet (HFD) (60% fat content) for 12 weeks.
Related to Figure 6. (A) BAT mass normalized to body mass. (B) Gonadal white adipose tissue (gWAT) mass normalized to body mass. (C) Inguinal white adipose tissue (iWAT) mass normalized to body mass. (D) Liver triglyceride levels. (E) mRNA expression of Ucp1 in BAT normalized to Gapdh. (F) mRNA expression of Ucp1 in iWAT. (G) Representative immunoblot of tyrosine hydroxylase (TH) levels in iWAT of mice fed a HFD and densitometric quantification normalized by tubulin (images were cropped from the same membrane). (H) Serum FGF21 level in WT and DKO mice. (I) Serum FGF21 levels in WT and OPA1 BAT KO mice (KO). Data are expressed as means ± SEM. Significant differences were determined by two-way ANOVA, using a significance level of p<0.05. *Significantly different vs. WT control, #significantly different vs. WT HFD.
-
Figure 6—figure supplement 1—source data 1
Data collected in optic atrophy 1 (OPA1) brown adipose tissue (BAT) knockout mice (KO), OPA1/fibroblast growth factor 21 (FGF21) DKO mice or their respective wild-type littermate controls (WT) fed either control (10% fat content) or high-fat diet (HFD) (60% fat content) for 12 weeks.
- https://cdn.elifesciences.org/articles/66519/elife-66519-fig6-figsupp1-data1-v2.xlsx
Figure 7
Activating transcription factor 4 (ATF4) is required for fibroblast growth factor 21 (FGF21) induction in optic atrophy 1 (OPA1) brown adipose tissue (BAT) knockout (KO) mice.
(A, B) Analysis of endoplasmic reticulum (ER) stress in BAT tissue from wild-type (WT) and OPA1 BAT KO mice (KO). (A) Representative immunoblot for phosphorylated eukaryotic translation initiation factor 2A (eIF2α) over total eIF2α and respective densitometric quantification (images were cropped from the same membrane). (B) mRNA expression of ER stress markers. (C–R) Data collected in 8–10-week-old OPA1/ATF4 BAT DKO mice. (C) mRNA expression of Atf4 in BAT. (D) mRNA expression of Opa1 in BAT. (E) Fgf21 mRNA expression in BAT. (F) FGF21 serum levels at ambient temperature and ad libitum-fed conditions. (G) Body mass. (H) BAT mass normalized to body mass. (I) Gonadal white adipose tissue (gWAT) mass normalized to body mass. (J) Inguinal white adipose tissue (iWAT) mass normalized to body mass. (K) Regression plot comparing oxygen consumption as a function of body mass in mice housed at 30°C. (L) Core body temperature measured at 30°C. (M) mRNA expression of thermogenic genes in iWAT samples collected at ambient temperature. (N) Core body temperature in DKO mice exposed to 4°C (data is represented as average core body temperature during the light and dark cycles over 3 days of continuous monitoring). (O) Final core body temperature recorded for each individual mouse (4°C). (P) mRNA expression of thermogenic genes in BAT samples. (Q) mRNA expression of thermogenic genes in iWAT samples. (R) Representative immunoblot for uncoupling protein 1 (UCP1) normalized to GAPDH (images were cropped from the same membrane) in iWAT and respective densitometric quantification (P–R collected after 3 days at 4°C). Data are expressed as means ± SEM. Significant differences were determined by Student’s t-test, using a significance level of p<0.05. *Significantly different vs. WT. VO2 data was analyzed by ANCOVA.
-
Figure 7—source data 1
Activating transcription factor 4 (ATF4) is required for fibroblast growth factor 21 (FGF21) induction in optic atrophy 1 (OPA1) brown adipose tissue (BAT) knockout (KO) mice.
- https://cdn.elifesciences.org/articles/66519/elife-66519-fig7-data1-v2.xlsx
Figure 8
Activating transcription factor 4 (ATF4) induction in brown adipose tissue (BAT) is necessary for the resistance to diet-induced obesity (DIO) and insulin resistance (IR) in optic atrophy 1 (OPA1) BAT knockout (KO) mice.
(A–K) Data from wild-type (WT) and OPA1/ATF4 BAT DKO mice fed a high-fat diet (HFD) for 12 weeks. (A) Total body mass. (B) Percent ratio of fat mass to body mass. (C) Percent ratio of lean mass to body mass. (D) Glucose tolerance test. (E) Area under the curve for the glucose tolerance test. (F) Fasting glucose levels. (G) Insulin tolerance test. (H) Area under the curve for the insulin tolerance test. (I) Fasting insulin levels. (J) Liver mass normalized to body mass. (K) Liver triglycerides levels. Data are expressed as means ± SEM. Significant differences were determined by Student's t‐test, using a significance level of p<0.05.
-
Figure 8—source data 1
Activating transcription factor 4 (ATF4) induction in brown adipose tissue (BAT) is necessary for the resistance to diet-induced obesity (DIO) and insulin resistance (IR) in optic atrophy 1 (OPA1) BAT knockout (KO) mice.
- https://cdn.elifesciences.org/articles/66519/elife-66519-fig8-data1-v2.xlsx
Tables
Key resources table
| Reagent type (species) or resource | Designation | Source or reference | Identifiers | Additional information |
|---|---|---|---|---|
| Strain, strain background (mouse, C57Bl/6J) | Murine models | Jackson Laboratories | JAX Stock #024670 RRID:IMSR_JAX:024670 | Tg (Ucp1-cre)1Evdr; male and female |
| Strain, strain background (mouse, C57Bl/6J) | Murine models | Jackson Laboratories | JAX Stock #025124 RRID:IMSR_JAX:025124 | C57BL/6-Tg(Adipoq-cre/ERT2)1Soff/J; male and female |
| Antibody | Anti-OPA1 (Mouse monoclonal) | BD Biosciences | #612606 RRID:AB_399888 | WB (1:1000), primary |
| Antibody | Anti-FGF21(Rabbit monoclonal) | Abcam | #ab171941 | WB (1:1000), primary |
| Antibody | Anti-GAPDH (Rabbit monoclonal) | Cell Signaling Technology | #2118 RRID:AB_561053 | WB (1:1000), primary |
| Antibody | Anti-VDAC (Rabbit polyclonal) | Thermo Scientific | #PA1‐954A RRID:AB_2304154 | WB (1:1000), primary |
| Antibody | Anti-UCP1 (Rabbit polyclonal) | Abcam | #Ab10983 RRID:AB_2241462 | WB (1:1000), primary Histology 1:250 |
| Antibody | Anti-SDH (Mouse monoclonal) | Abcam | #Ab14714 | WB (1:1000), primary |
| Antibody | Anti-α-tubulin (Mouse monoclonal) | Sigma | #T9026 | WB (1:1000), primary |
| Antibody | Anti-β-actin (Rabbit polyclonal) | Sigma | #A2066 RRID:AB_476693 | WB (1:1000), primary |
| Antibody | Anti-tyrosine hydroxylase (Rabbit polyclonal) | Cell Signaling Technology | #2792 RRID:AB_2303165 | WB (1:1000), primary |
| Antibody | Anti-phosphorylated eIF2α serine 51 (Rabbit monoclonal) | Cell Signaling Technology | #3597 | WB (1:1000), primary |
| Antibody | anti-eIF2α (Mouse monoclonal) | Santa Cruz Biotechnology | #SC81261 | WB (1:1000), primary |
| Antibody | IRDye 800CW anti‐mouse | LI-COR | #925‐32212 RRID:AB_2716622 | WB (1:10,000), secondary |
| Antibody | Alexa Fluor anti‐rabbit 680 | Invitrogen | #A27042 | WB (1:10,000), secondary |
| Antibody | Anti-rabbit biotinylated secondary antibody | Cell Signaling Technology | #14708 | Histology (1:500) |
| Chemical compound, drug | 5-hydroxytamoxifen | Sigma | T176 | Used in vitro |
| Commercial assay or kit | RNeasy kit | Qiagen Inc | #74104 | |
| Commercial assay or kit | EnzyChrom Triglyceride Assay Kit | BioAssay Systems | #ETGA-200 | |
| Commercial assay or kit | Mouse/rat fibroblast growth factor 21 ELISA | Biovendor | #RD291108200R | |
| Commercial assay or kit | Ultra-Sensitive Mouse Insulin ELISA Kit | Chrystal Chem | #90080 | |
| Commercial assay or kit | High-Capacity cDNA reverse Transcription Kit | Applied Biosystems | #4368814 | |
| Commercial assay or kit | Hematoxylin and Eosin Stain Kit | Vector Laboratories | #H3502 | |
| Software, algorithm | GraphPad Prism Software | GraphPad Software, La Jolla, CA, USA | Version 8.0.0 for Windows RRID:SCR_002798 | |
| Other | 2920X, standard chow | Harlan Teklad | 2920X | |
| Other | Chow, 60% HFD | Research Diets | D12492 | |
| Other | Chow, 10% Control | Research Diets | D12450J | |
| Sequence-based reagent | Fgf21_F | Integrated DNA Technologies, Inc | PCR primers | TGACGACCAAGACACTGAAGC |
| Sequence-based reagent | Fgf21_R | Integrated DNA Technologies, Inc | PCR primers | TTTGAGCTCCAGGAGACTTTCTG |
| Sequence-based reagent | Atf4_F | Integrated DNA Technologies, Inc | PCR primers | AGCAAAACAAGACAGCAGCC |
| Sequence-based reagent | Atf4_R | Integrated DNA Technologies, Inc | PCR primers | ACTCTCTTCTTCCCCCTTGC |
| Sequence-based reagent | Chop_F | Integrated DNA Technologies, Inc | PCR primers | GTCCCTAGCTTGGCTGACAGA |
| Sequence-based reagent | Chop _R | Integrated DNA Technologies, Inc | PCR primers | TGGAGAGCGAGGGCTTTG |
| Sequence-based reagent | Ern1_F | Integrated DNA Technologies, Inc | PCR primers | TGAAACACC CCTTCTTCTGG |
| Sequence-based reagent | Ern1_R | Integrated DNA Technologies, Inc | PCR primers | CCT CCT TTT CTA TTC GGT CAC TT |
| Sequence-based reagent | Opa1_F | Integrated DNA Technologies, Inc | PCR primers | ATACTGGGATCTGCTGTTGG |
| Sequence-based reagent | Opa1_R | Integrated DNA Technologies, Inc | PCR primers | AAGTCAGGCACAATCCACTT |
| Sequence-based reagent | Ucp1_F | Integrated DNA Technologies, Inc | PCR primers | GTGAAGGTCAGAATGCAAGC |
| Sequence-based reagent | Ucp1_R | Integrated DNA Technologies, Inc | PCR primers | AGGGCCCCCTTCATGAGGTC |
| Sequence-based reagent | Prdm16_F | Integrated DNA Technologies, Inc | PCR primers | CAGCACGGTGAAGCCATTC |
| Sequence-based reagent | Prdm16_R | Integrated DNA Technologies, Inc | PCR primers | GCGTGCATCCGCTTGTG |
| Sequence-based reagent | Gapdh_F | Integrated DNA Technologies, Inc | PCR primers | AACGACCCCTTCATTGAC |
| Sequence-based reagent | Gapdh_R | Integrated DNA Technologies, Inc | PCR primers | TCCACGACATACTCAGCAC |
| Sequence-based reagent | Ppargc1a_F | Integrated DNA Technologies, Inc | PCR primers | GTAAATCTGCGGGATGATGG |
| Sequence-based reagent | Ppargc1a_R | Integrated DNA Technologies, Inc | PCR primers | AGCAGGGTCAAAATCGTCTG |
| Sequence-based reagent | Dio2_F | Integrated DNA Technologies, Inc | PCR primers | AATTATGCCTCGGAGAAGACCG |
| Sequence-based reagent | Dio2_R | Integrated DNA Technologies, Inc | PCR primers | GGCAGTTGCCTAGTGAAAGGT |
| Sequence-based reagent | Nrg4_F | Integrated DNA Technologies, Inc | PCR primers | ACTCACTAAGCCAGAGTGAAGCAGG |
| Sequence-based reagent | Nrg4_R | Integrated DNA Technologies, Inc | PCR primers | CATGTCGTCTCTACAGGTGCTCTGC |
| Sequence-based reagent | Cre_F | Integrated DNA Technologies, Inc | PCR primers | AATGCTTCTGTCCGTTTGCC |
| Sequence-based reagent | Cre_R | Integrated DNA Technologies, Inc | PCR primers | ACATCTTCAGGTTCTGCGGG |
| Sequence-based reagent | Cpt1b_F | Integrated DNA Technologies, Inc | PCR primers | TGCCTTTACATCGTCTCCAA |
| Sequence-based reagent | Cpt1b_R | Integrated DNA Technologies, Inc | PCR primers | AGACCCCGTAGCCATCATC |
| Sequence-based reagent | Ppara_F | Integrated DNA Technologies, Inc | PCR primers | GAGAATCCACGAAGCCTACC |
| Sequence-based reagent | Ppara_R | Integrated DNA Technologies, Inc | PCR primers | ATTCGGACCTCTGCCTCTTT |
| Sequence-based reagent | Acadm_F | Integrated DNA Technologies, Inc | PCR primers | ACTGACGCCGTTCAGATTTT |
| Sequence-based reagent | Acadm_R | Integrated DNA Technologies, Inc | PCR primers | GCTTAGTTACACGAGGGTGATG |
| Sequence-based reagent | Metrnl_F | Integrated DNA Technologies, Inc | PCR primers | CTGGAGCAGGGAGGCTTATTT |
| Sequence-based reagent | Metrnl_R | Integrated DNA Technologies, Inc | PCR primers | GGACAACAAAGTCACTGGTACAG |
| Sequence-based reagent | Bmp8b_F | Integrated DNA Technologies, Inc | PCR primers | CAACCACGCCACTATGCA |
| Sequence-based reagent | Bmp8b_R | Integrated DNA Technologies, Inc | PCR primers | CACTCAGCTCAGTAGGCACA |
| Sequence-based reagent | Slit2-c_F | Integrated DNA Technologies, Inc | PCR primers | GCTGTGAACCATGCCACAAG |
| Sequence-based reagent | Slilt2-c_R | Integrated DNA Technologies, Inc | PCR primers | CACACATTTGTTTCCGAGGCA |
| Sequence-based reagent | Evlov6_F | Integrated DNA Technologies, Inc | PCR primers | TCAGCAAAGCACCCGAAC |
| Sequence-based reagent | Evlov6_R | Integrated DNA Technologies, Inc | PCR primers | AGCGACCATGTCTTTGTAGGAG |
| Sequence-based reagent | Il6_F | Integrated DNA Technologies, Inc | PCR primers | TGGGAAATCGTGGAAATGAG |
| Sequence-based reagent | Il6_R | Integrated DNA Technologies, Inc | PCR primers | GAAGGACTCTGGCTTTGTCTT |
Additional files
Download links
A two-part list of links to download the article, or parts of the article, in various formats.
Downloads (link to download the article as PDF)
Open citations (links to open the citations from this article in various online reference manager services)
Cite this article (links to download the citations from this article in formats compatible with various reference manager tools)
OPA1 deletion in brown adipose tissue improves thermoregulation and systemic metabolism via FGF21
eLife 10:e66519.
https://doi.org/10.7554/eLife.66519


