Ketogenic diet restrains aging-induced exacerbation of coronavirus infection in mice
- Department of Comparative Medicine, Yale School of Medicine, United States
- Department of Immunobiology, Yale School of Medicine, United States
- Department of Pathology and Immunology, Washington University School of Medicine, United States
- Department of Internal Medicine, Yale School of Medicine, United States
- Program in Integrative Cell Signaling and Neurobiology of Metabolism, Yale School of Medicine, United States
- Department of Microbiology, New York University Langone Health, United States
- Yale Center for Research on Aging, United States
Figures
Figure 1 with 1 supplement
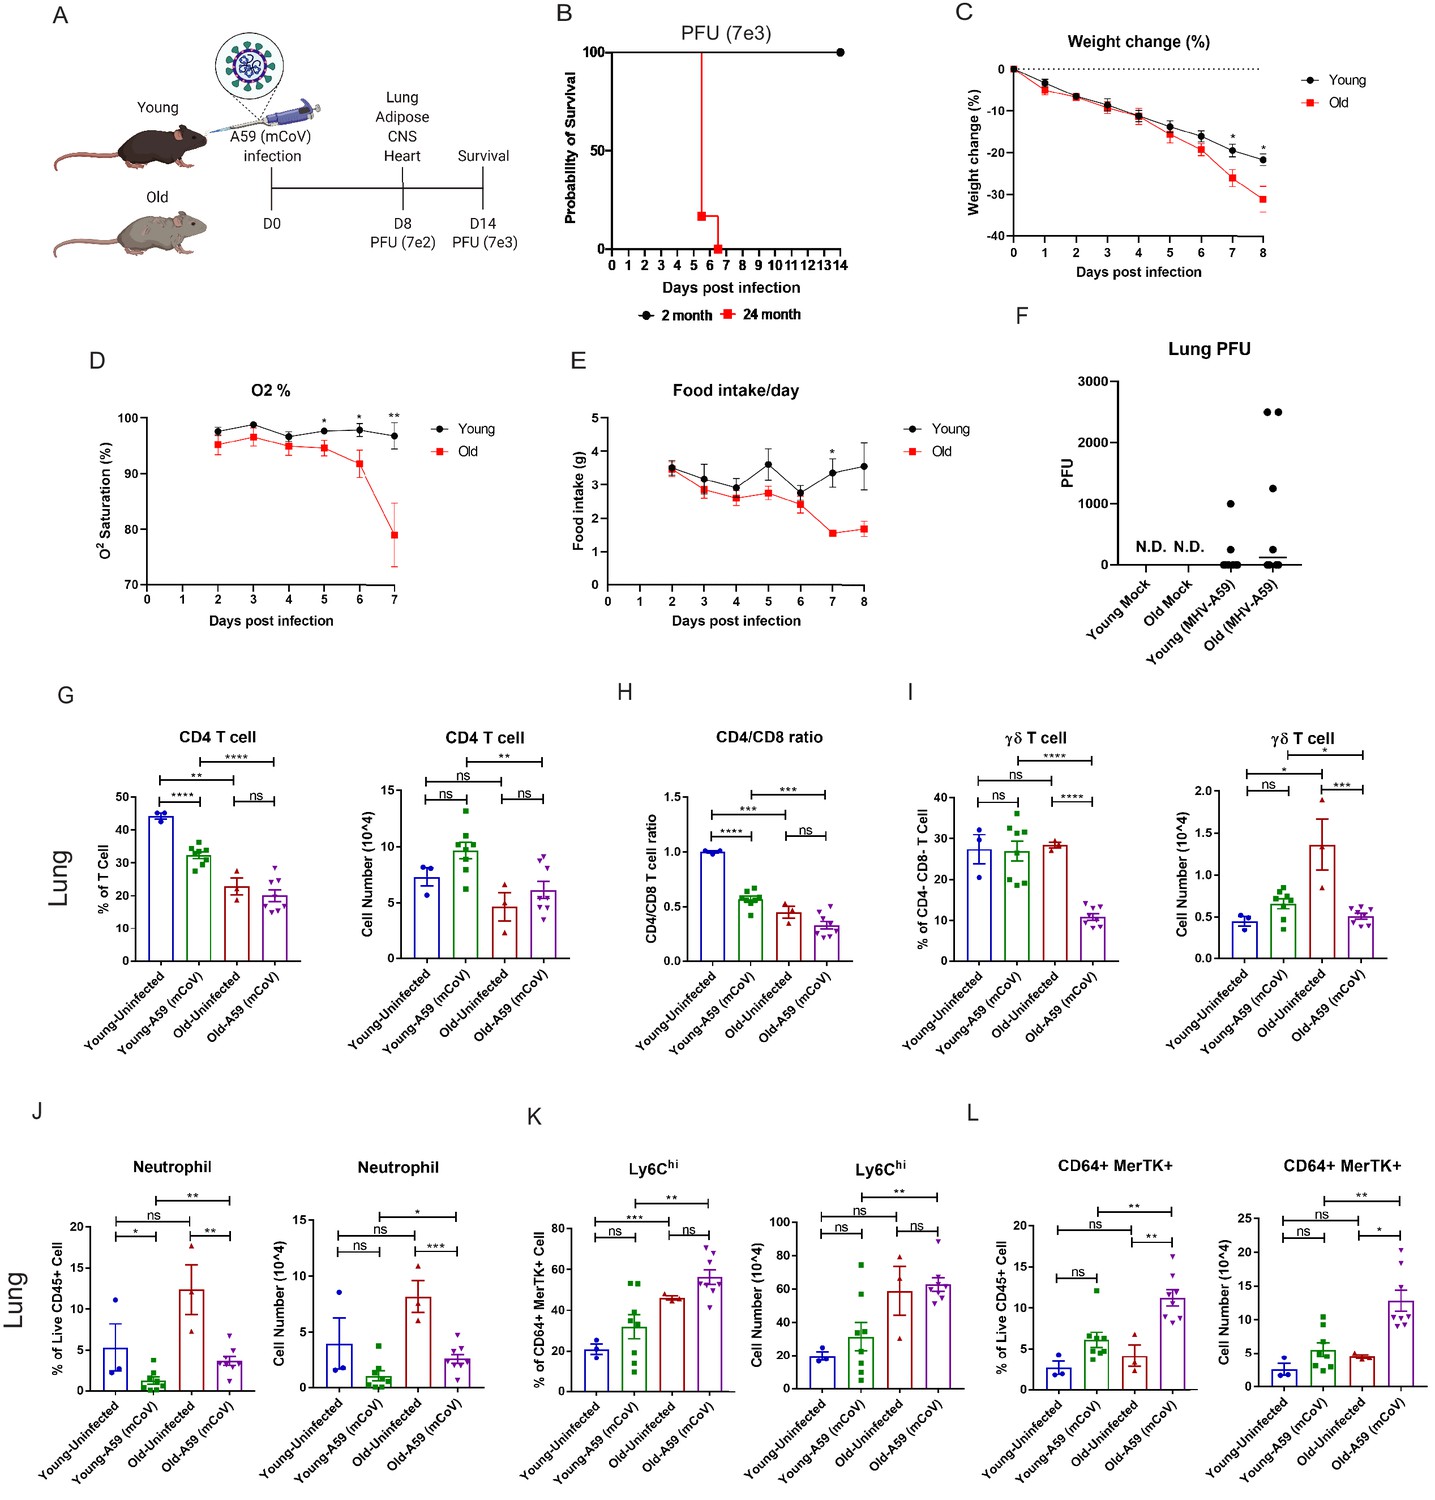
Aging exacerbates A59 (mCoV) infection.
(A) Schematic of A59 (mCoV) infection experiment with young (2–6 months) and old mice (20–24 months). (B) Probability of survival of young (n = 6) and old (n = 6) infected mice. Survival of mice was examined after infection with high dose of virus (PFU 7e3) up to 14 days. (C–E) Young (n = 8) and old mice (n = 8) were infected with low dose of virus (PFU 7e2), and weight change (%) (C), O2 saturation (D), and daily food intake (E) were recorded. (F) Plaque assay of lung from uninfected, infected young and old mice. (G–L) Flow cytometry analysis of CD4 T cell (G), CD4/CD8 T cell ratio (H), γδ T cell (I), neutrophil (J), Ly6Chi cell (K), and CD64+ MerTK+ cell (L) on day 8 post (PFU 7e2) infection. Error bars represent the mean ± S.E.M. Two-tailed unpaired t-tests were performed for statistical analysis. *p<0.05; **p<0.01; ***p<0.001; ****p<0.0001.
Figure 1—figure supplement 1
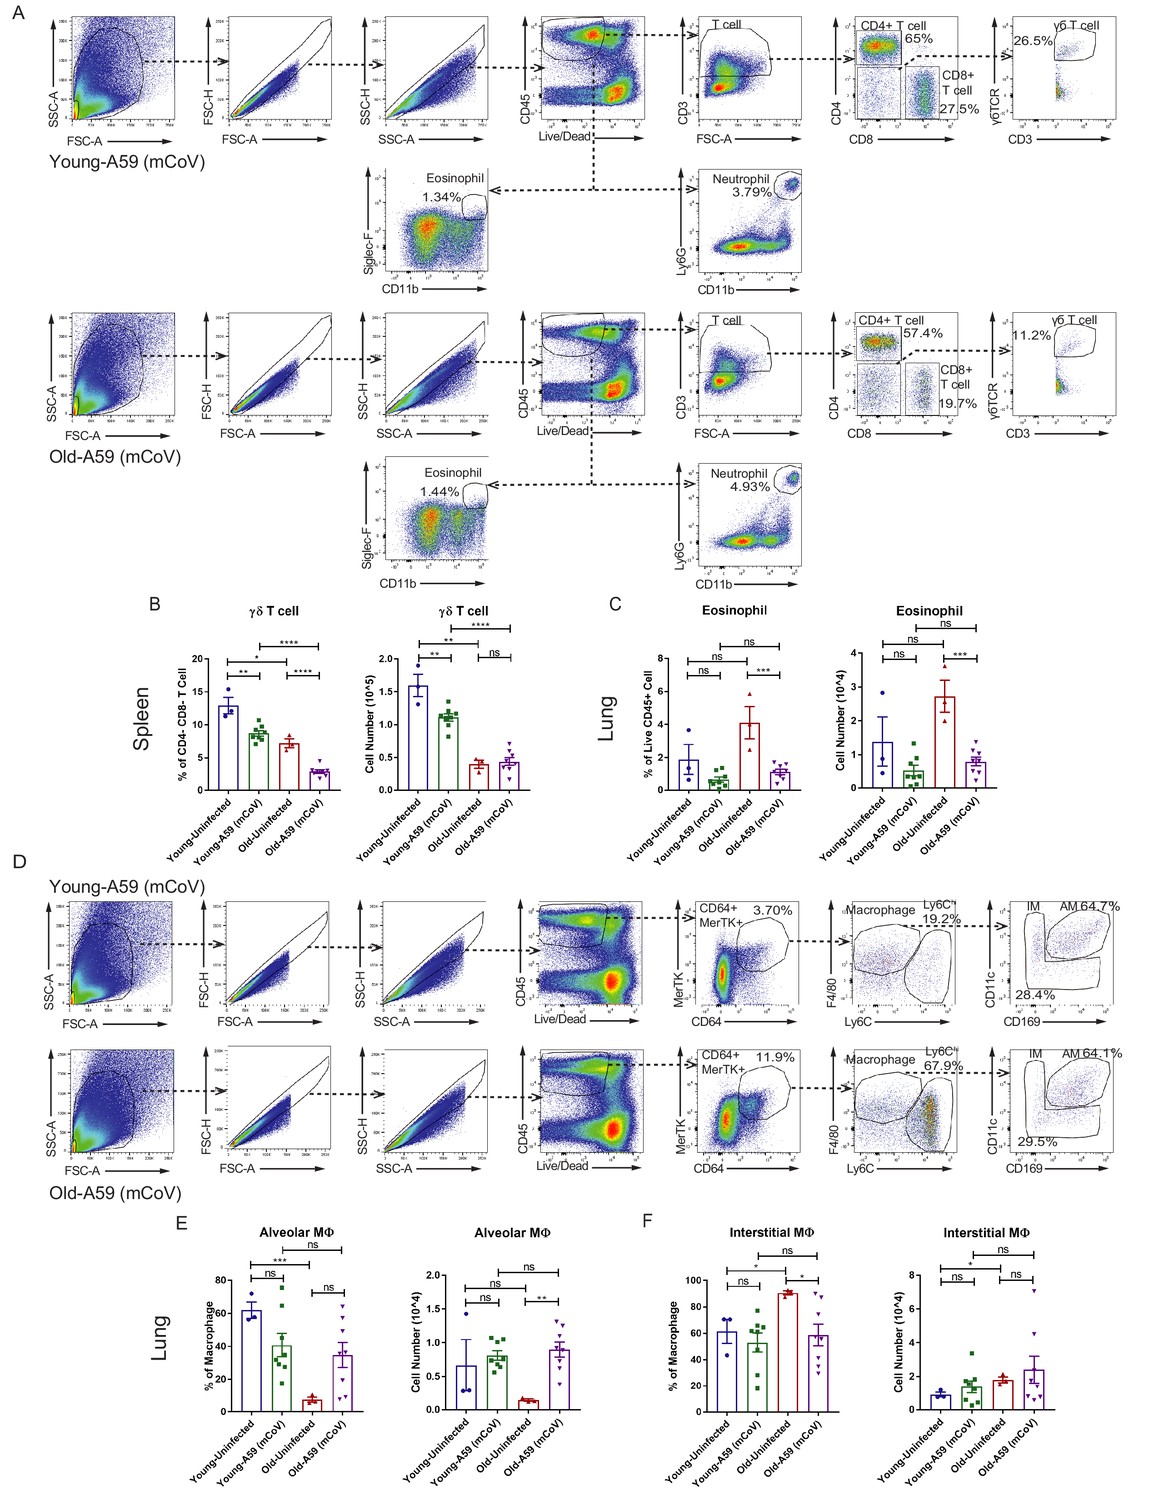
Characterization of immune cell population in young and old mice infected with A59 (mCoV).
(A) Representative flow cytometry gating plot to analyze T lymphocytes, eosinophils, and neutrophils in lung of A59 (mCoV) infected young and old mice. (B) Flow cytometry analysis result of γδ T cell in spleen of uninfected, infected young and old mice. (C) Flow cytometry analysis result of eosinophil in lung of uninfected, infected young and old mice. (D) Representative flow cytometry gating plot to analyze myeloid cells in lung of A59 (mCoV) infected young and old mice. (E, F) Flow cytometry analysis results of alveolar macrophage (AM) (E), and interstitial macrophage (IM) (F) population in lung of uninfected, infected young and old mice. Error bars represent the mean ± S.E.M. Two-tailed unpaired t-tests were performed for statistical analysis. *p<0.05; **p<0.01; ***p<0.001; ****p<0.0001.
Figure 2
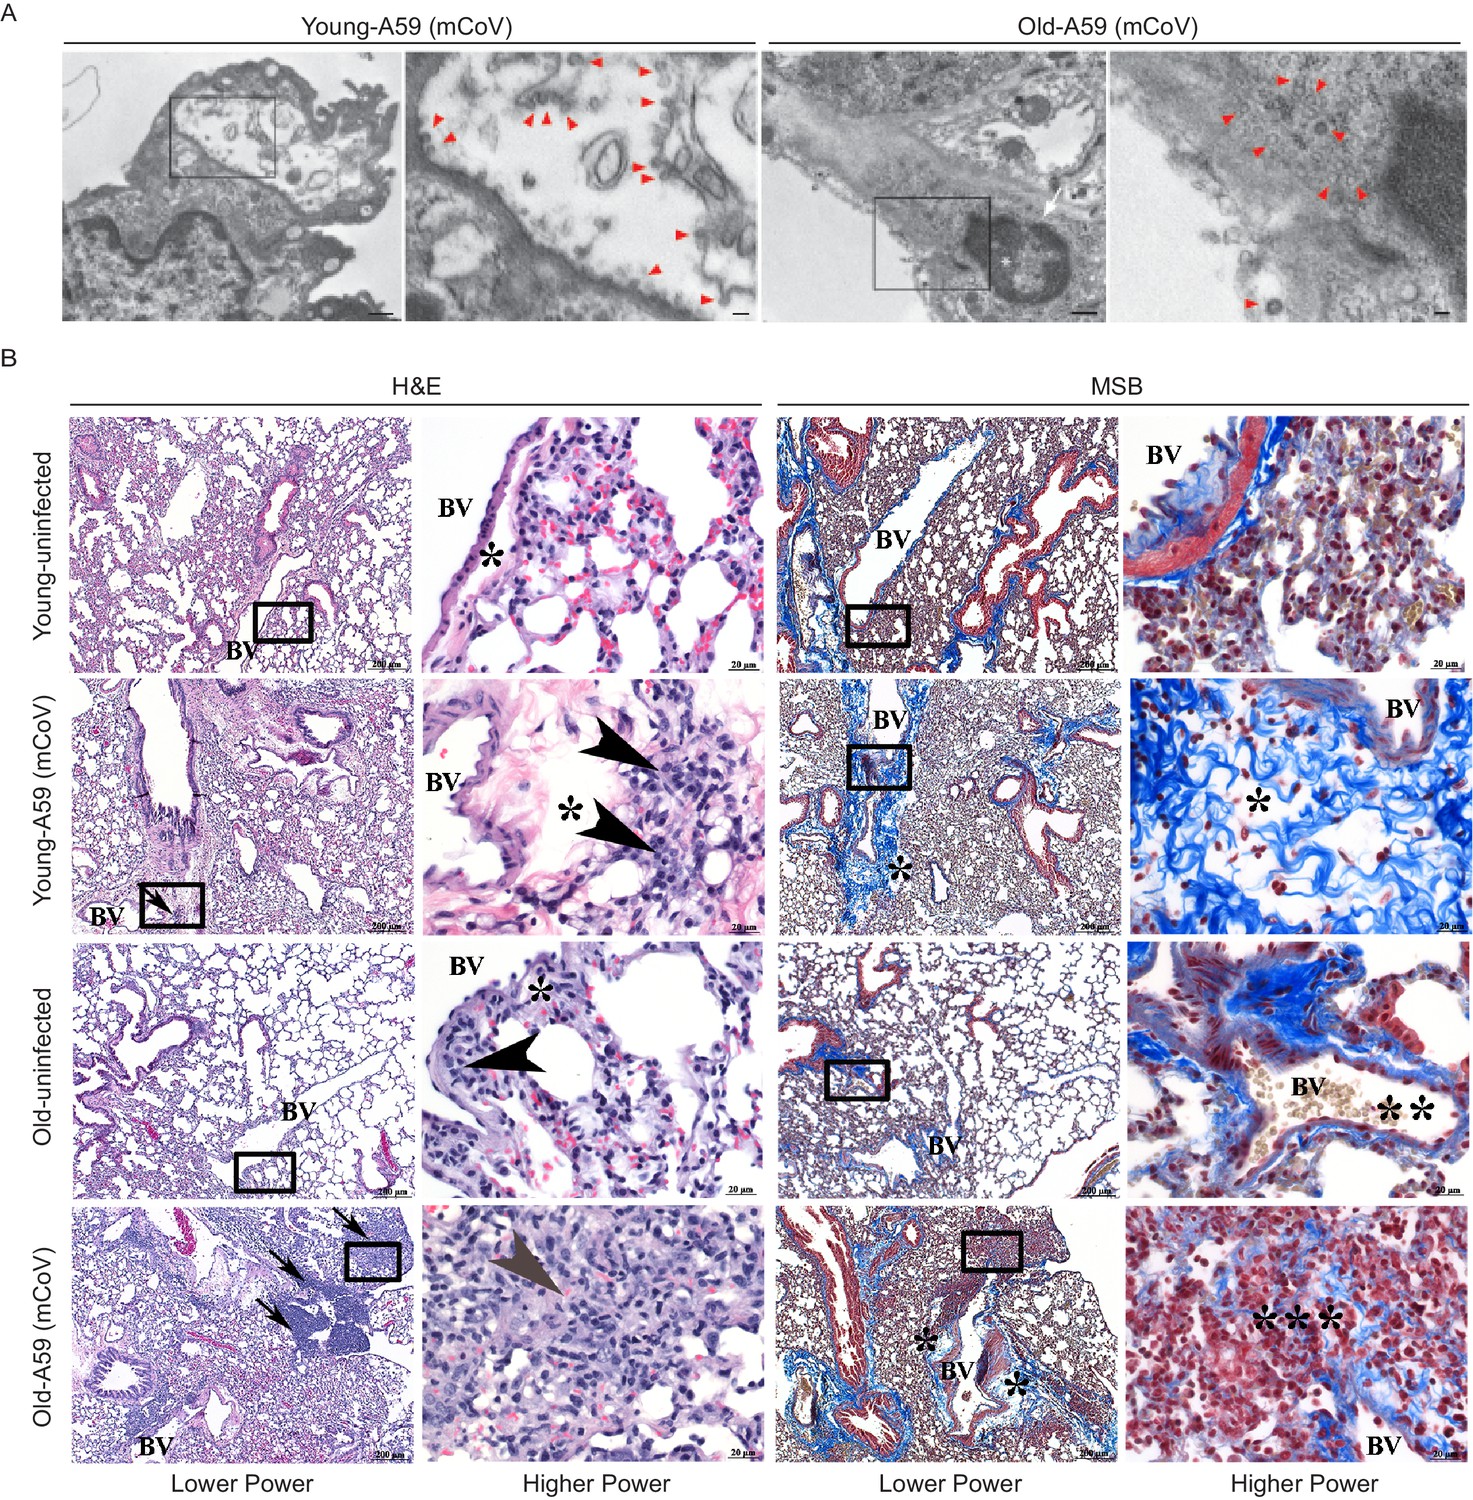
A59 (mCoV) infection significantly affects lung phenotype in old mice.
(A) Transmission electron microscopic images of A59 (mCoV) particles in pneumocytes. Left panels show pneumocyte of an infected young (left) and old (right) mice. Bar scale represents 500 nm. Right panels show zoomed-in images of boxed areas of left panels. Pneumocyte with budding viral particles was indicated by red arrowheads. Bar scale represents 100 nm. Apoptotic pneumocyte of an infected old mouse showed the shrunken and degraded nucleus (white arrow) and chromatin condensation (white asterisk). (B) Representative photomicrographs of hematoxylin and eosin (H and E)-stained (left) and Martius scarlet blue trichrome (MSB)-stained (right) sections of lung from young and old mice 8 days post infection with A59 (mCoV), along with lung from uninfected young and old mice. There are foci of inflammation (arrow), perivascular edema (*), and perivascular lymphocytes and plasma cells (arrow head). Boxed areas in low power images were used for high power imaging. BV indicates small blood vessel.
Figure 3 with 1 supplement
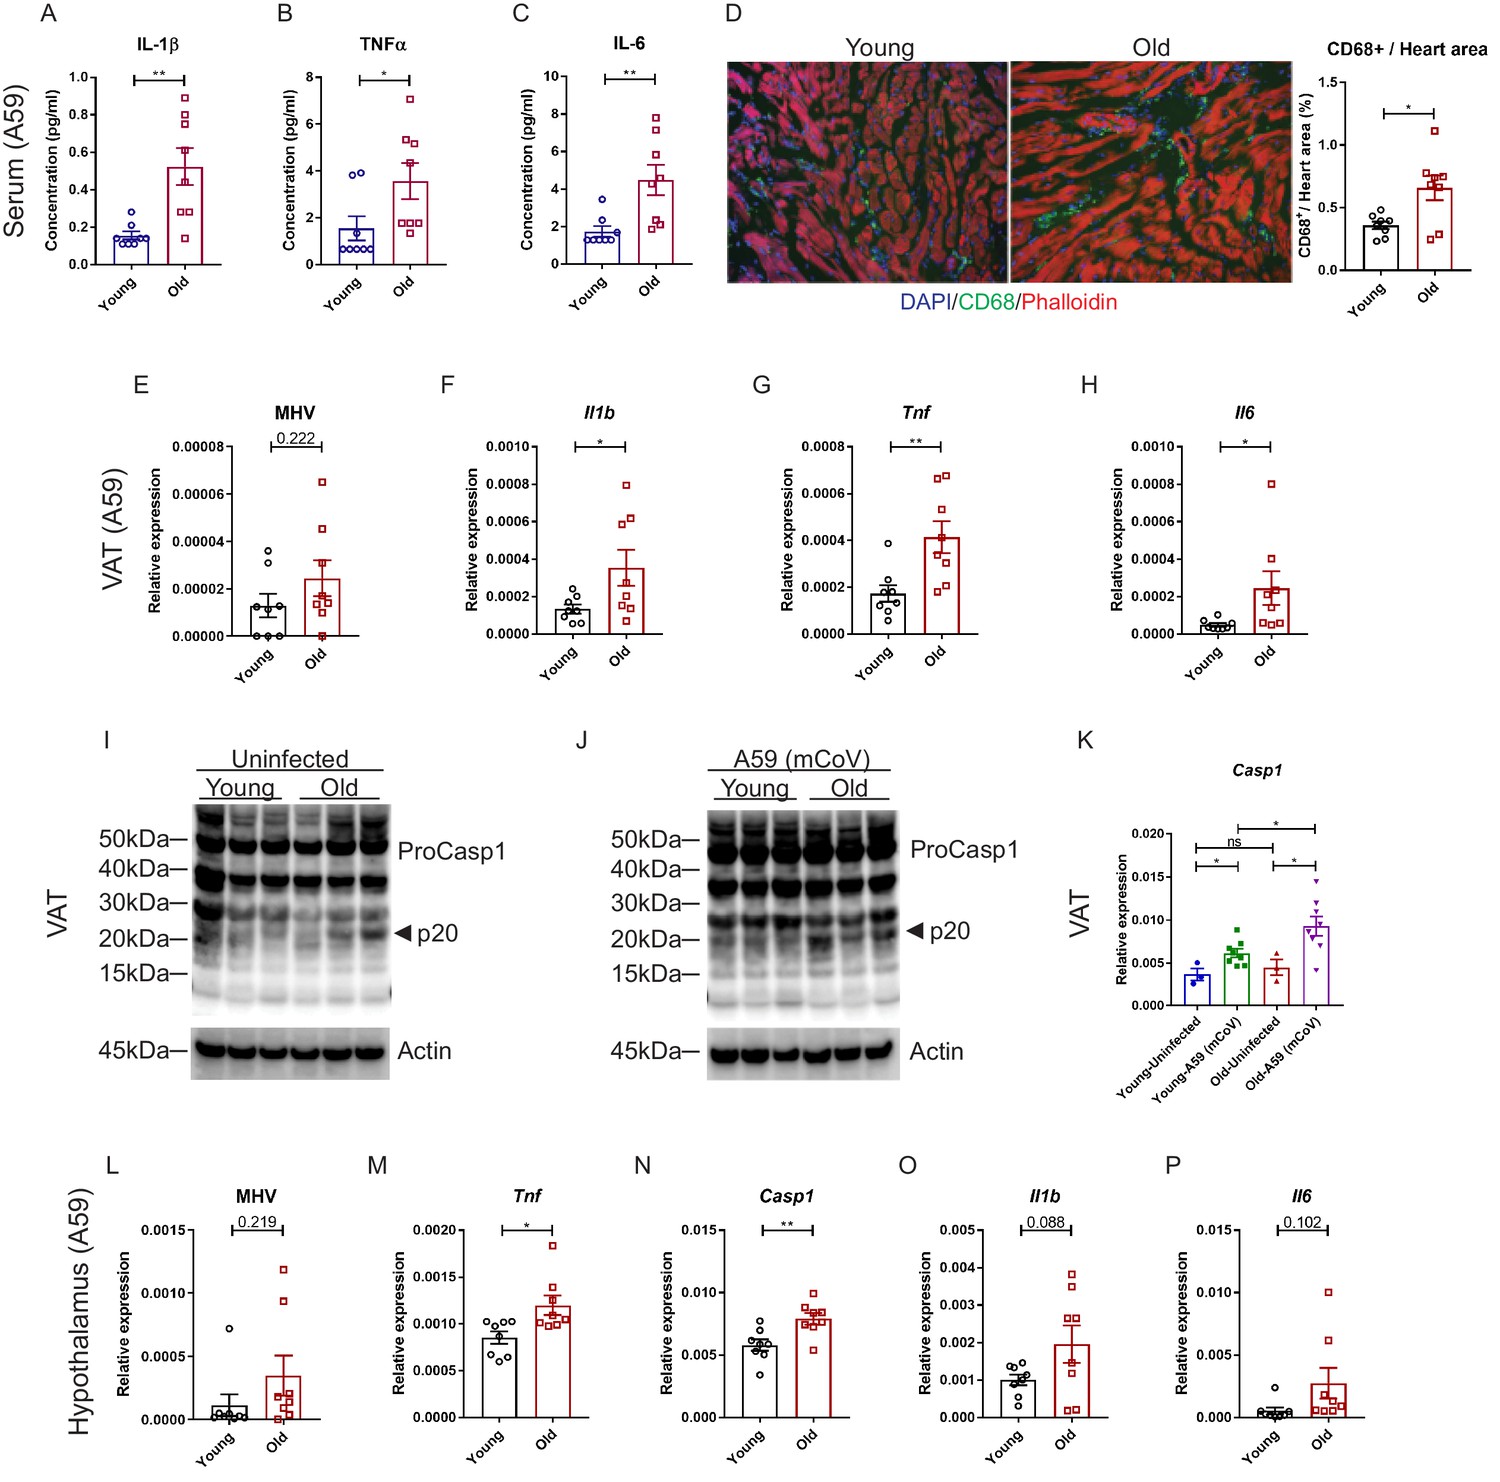
Aging induces systemic hyperinflammatory response in A59 (mCoV) infection.
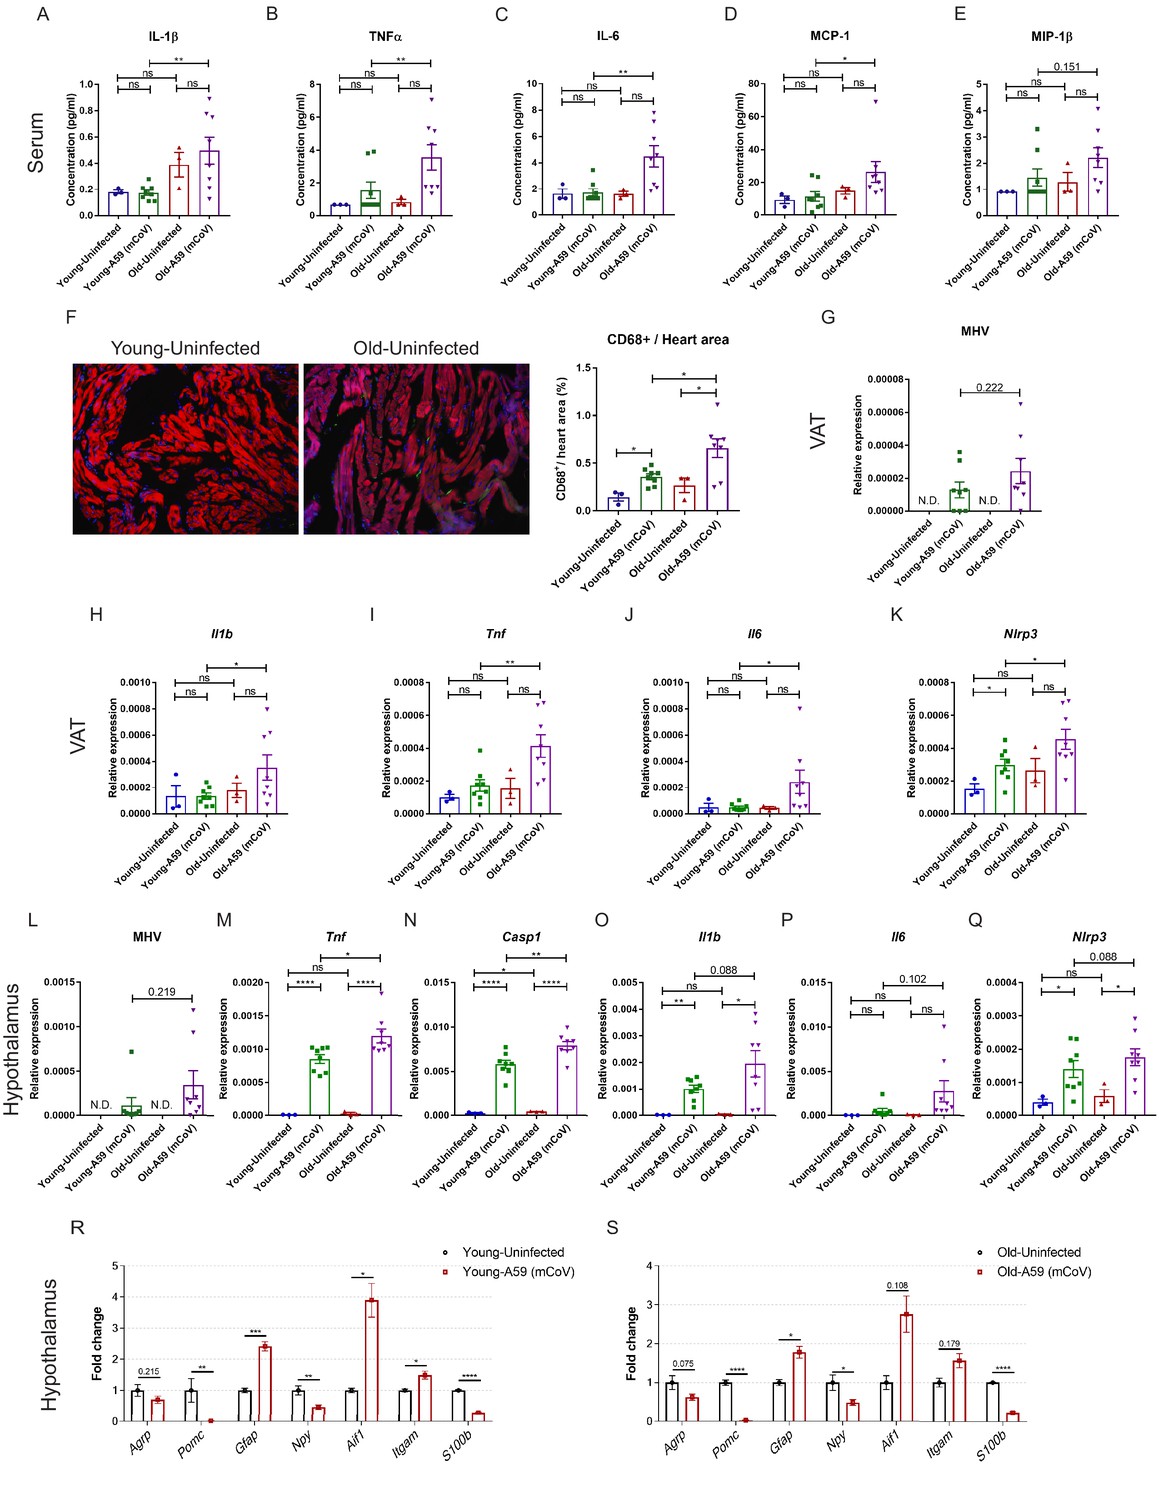
(A–C) Serum levels of inflammatory cytokines IL-1β (A), TNFα (B), and IL-6 (C) of young (6 months old) and old (24 months old) infected mice on day 8 post (PFU 7e2) infection. (D) Representative immunofluorescence analysis of CD68 expression, phalloidin, and DAPI in hearts isolated from young and old mice. CD68+ cells/heart area analysis was shown in right panel. (E) Quantification of MHV-A59 (mCoV) in visceral adipose tissue (VAT) of young and old infected mice by quantitative PCR (qPCR) of a gene expressing A59 M protein. (F–H) qPCR analysis of Il1b (F), Tnf (G), and Il6 (H) in VAT of young and old infected mice. (I) Western blot analysis of caspase-1 inflammasome activation in VAT of uninfected young and old mice. (J) Immunoblot analysis of caspase-1 cleavage showing higher inflammasome activation in VAT in aged mice post-infection. (K) Quantification of gene expression of Casp1 in VAT by qPCR. (L) Quantification of MHV-A59 (mCoV) in hypothalamus of young and old infected mice by qPCR. (M–P) Gene expression analysis of Tnf (M), Casp1 (N), Il1b (O), and Il6 (P) in hypothalamus of young and old mice 8 days post-infection. Error bars represent the mean ± S.E.M. Two-tailed unpaired t-tests were performed for statistical analysis. *p<0.05; **p<0.01.
Figure 3—figure supplement 1
Inflammatory response in young and old mice infected with A59 (mCoV).
(A–E) Serum levels of inflammatory cytokine and chemokines of young and old uninfected and A59 (mCoV) infected mice. Analysis results of IL-1β (A), TNFα (B), IL-6 (C), MCP-1 (D), and MIP-1β (E) were shown. (F) Representative immunofluorescence images of CD68 expression, phalloidin, and DAPI in hearts isolated from uninfected young and old mice (left) and CD68+ cells/heart area analysis in heart from uninfected, infected young and old mice (right). (G) Quantification of MHV-A59 (mCoV) in visceral adipose tissue (VAT) of uninfected, infected young and old mice by qPCR. (H–K) qPCR analysis of Il1b (H), Tnf (I), Il6 (J), and Nlrp3 (K) in VAT of uninfected, infected young and old mice. (L) Quantification of MHV-A59 (mCoV) in hypothalamus of uninfected, infected young and old mice by qPCR. (M–Q) Gene expression analysis of inflammatory genes and inflammasome component genes in hypothalamus of uninfected, infected young and old mice. (R, S) Gene expression analysis in hypothalamus of uninfected, infected young mice (R) and uninfected, infected old mice (S). Error bars represent the mean ± S.E.M. Two-tailed unpaired t-tests were performed for statistical analysis. *p<0.05; **p<0.01; ***p<0.001; ****p<0.0001.
Figure 4 with 1 supplement
Ketogenic diet reduces the severity of A59 (mCoV) infection in old mice.
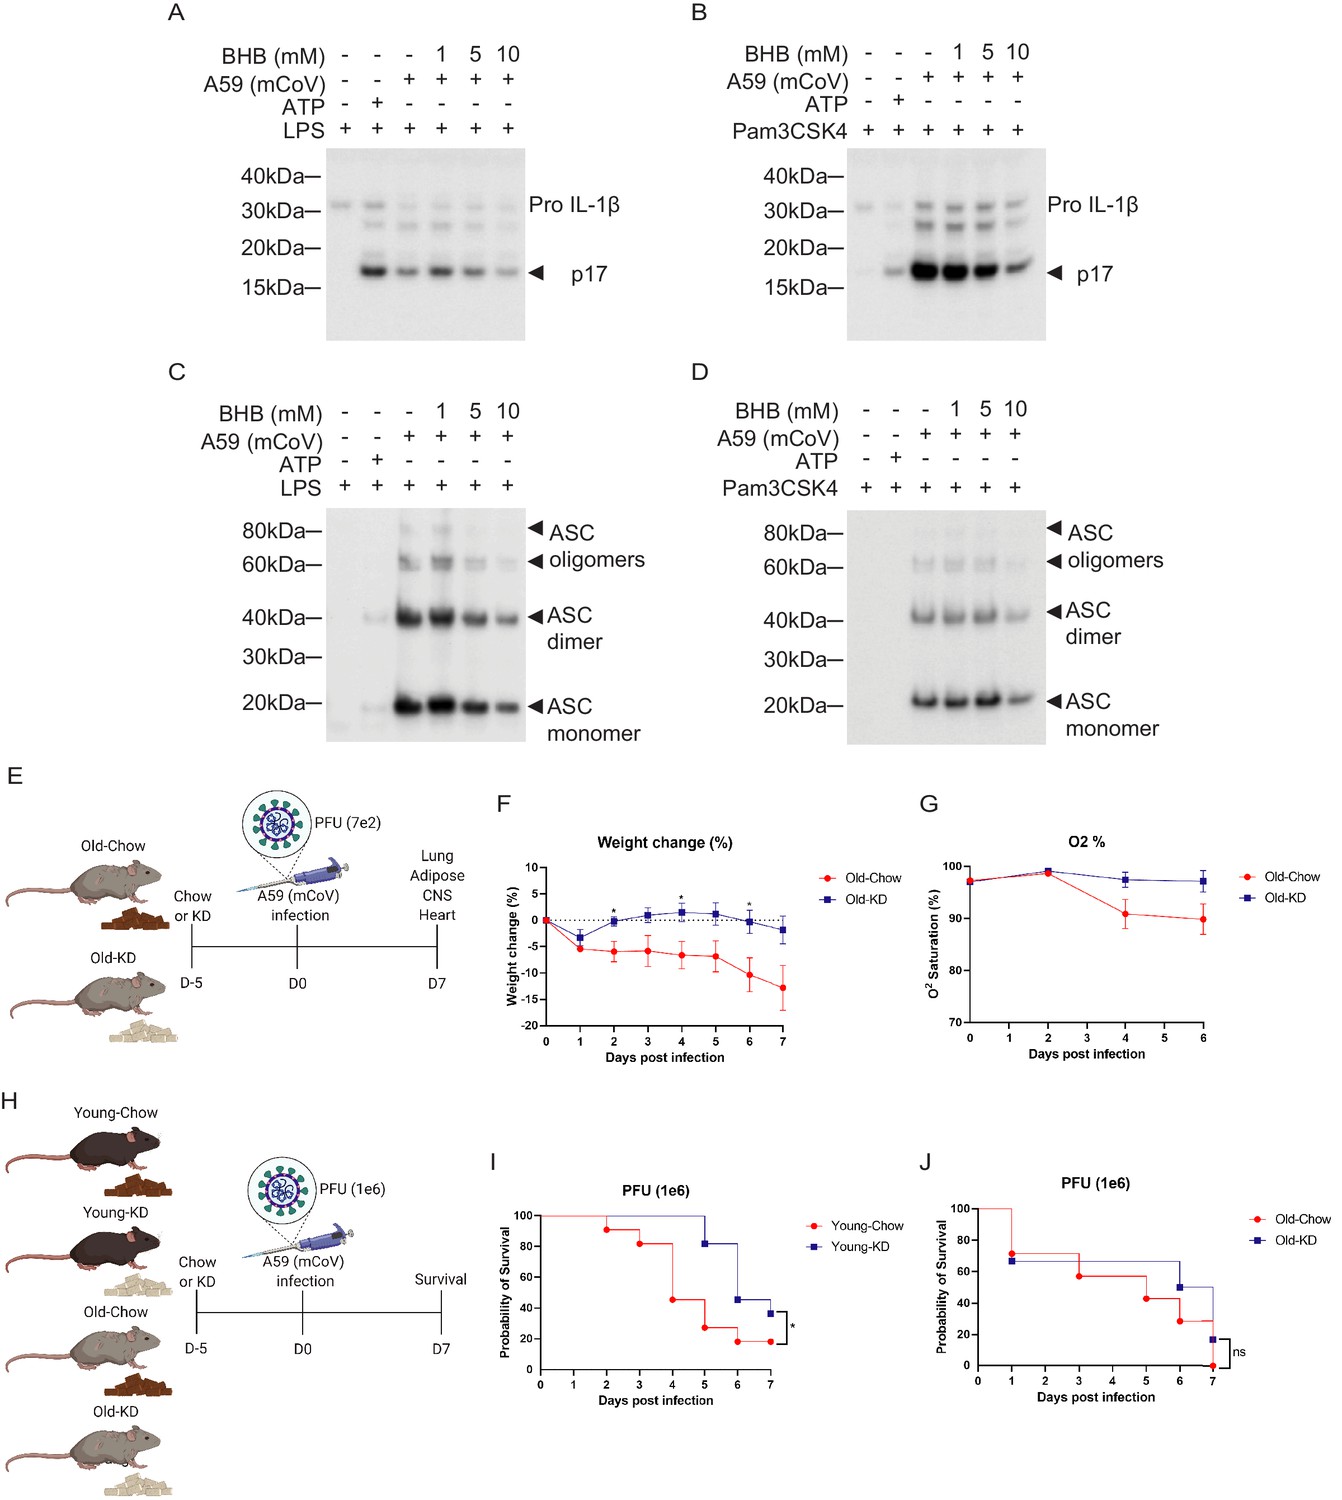
(A, B) Western blot analysis about pro and active cleaved p17 form of IL-1β from supernatant of A59 (mCoV)-infected BMDMs co-treated with priming reagents such as LPS (A) and Pam3CSK4 (B), and BHB with indicated concentration. (C, D) Western blot analysis of ASC monomer, dimer, and oligomers from insoluble pellet of A59 (mCoV) infected BMDMs co-treated with priming reagents such as LPS (C) and Pam3CSK4 (D), and BHB with indicated concentration. (E) Schematic of non-lethal dose (PFU 7e2) of A59 (mCoV) infection experiment with old mice (20–21 month) fed chow (Old-Chow, n = 6) or ketogenic diet (Old-KD, n = 5). The mice were provided with diet from 5 days before infection. (F, G) After infection, the phenotype was evaluated until 7 days post-infection. Weight change (%) (F), and % O2 saturation (G) in old mice fed chow or KD. (H) Schematic of lethal dose (PFU 1e6) of A59 (mCov) infection experiment with young (4 months) and old (24 months) mice fed chow (Young-Chow, n = 11; Old-Chow, n = 7) or KD (Young-KD, n = 11; Old-KD, n = 6). The mice were provided with diet from 5 days before infection. After infection, the survival was evaluated until 7 days post-infection. (I) Probability of survival of lethal dose A59 (mCoV)-infected young mice fed chow or KD. (J) Probability of survival of lethal dose A59 (mCoV)-infected old mice fed chow or KD. Error bars represent the mean ± S.E.M. Two-tailed unpaired t-tests were performed for statistical analysis. Gehan–Breslow–Wilcoxon tests were performed for survival analysis. *p<0.05.
Figure 4—figure supplement 1
Protective effect of BHB in BMDM against A59 (mCoV) and phenotype of A59 (mCoV) infected old mice fed chow or KD.
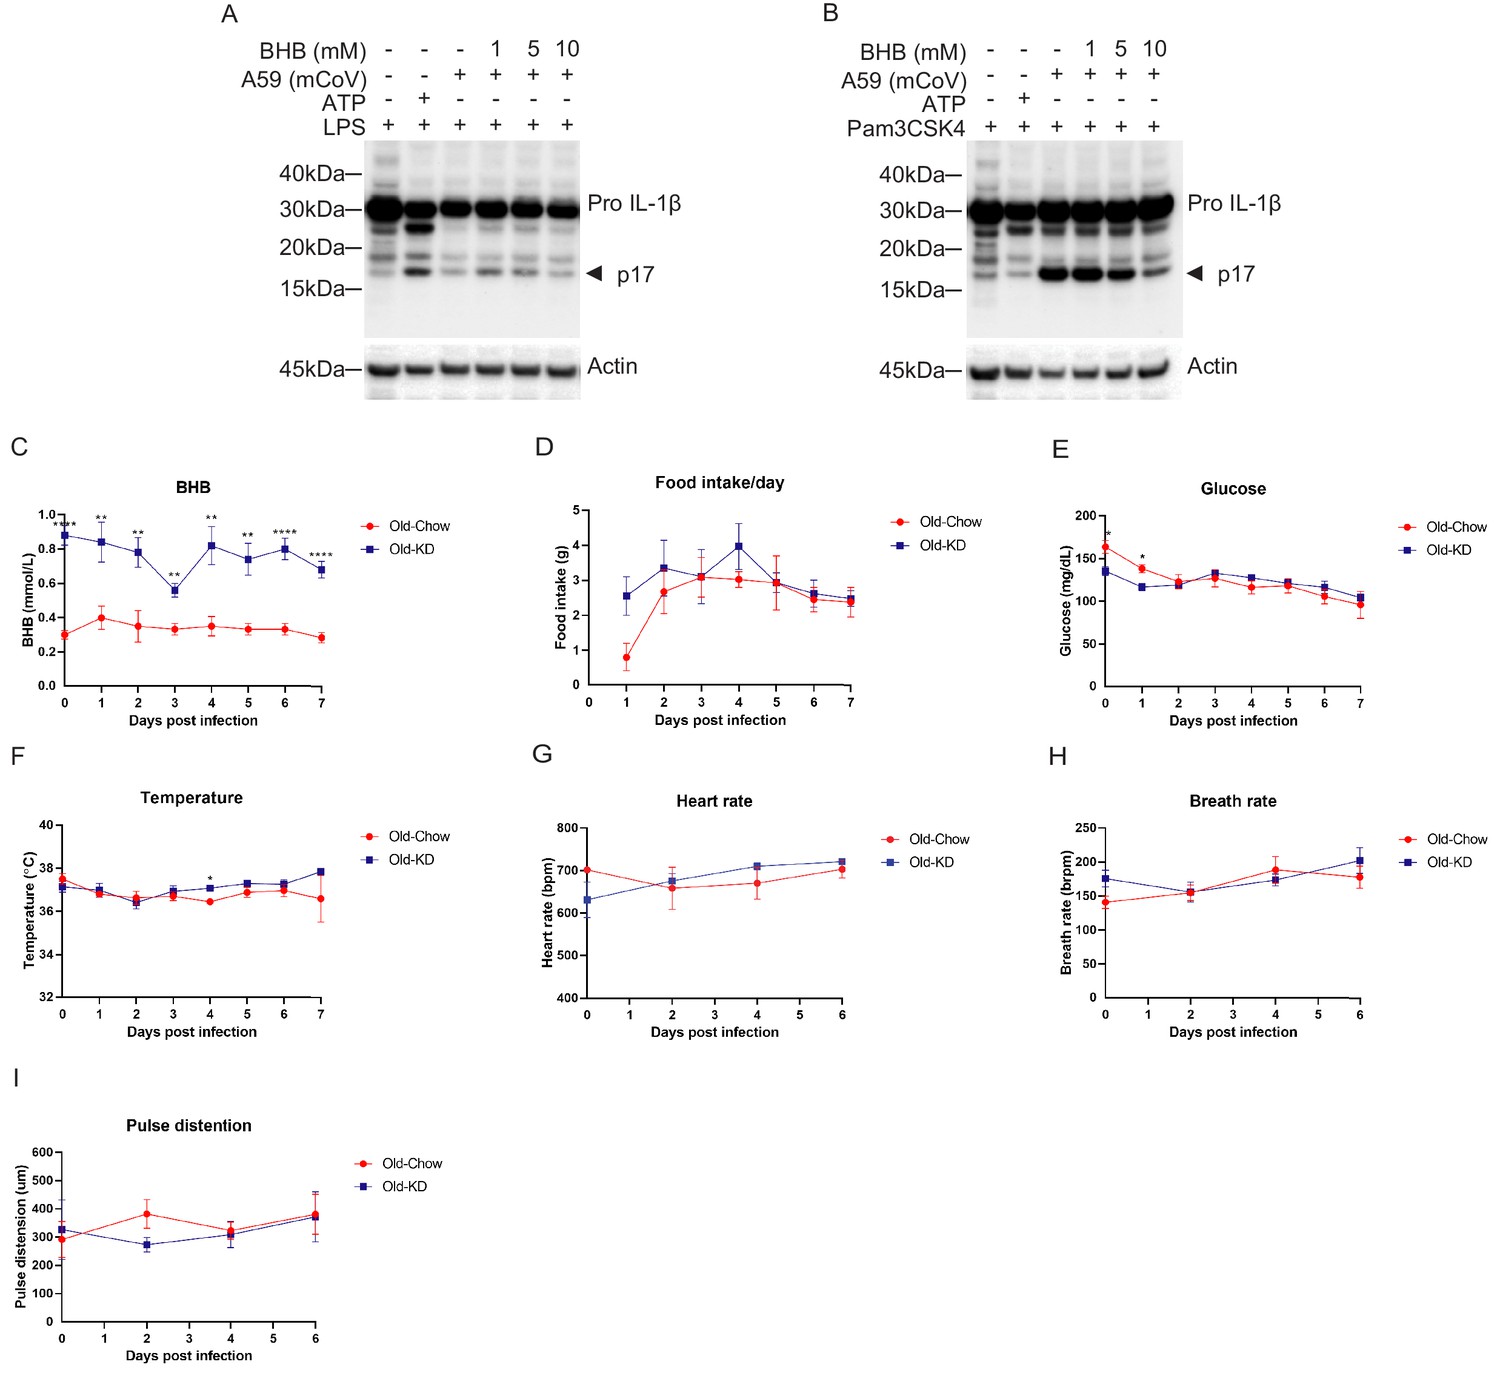
(A, B) Western blot analysis about pro and active cleaved p17 form of IL-1β from cell lysate of A59 (mCoV) infected BMDMs co-treated with priming reagents such as LPS (A) and Pam3CSK4 (B), and BHB with indicated concentration. (C–F) Physiological phenotype of Old-Chow- (20–21 months, n = 6) and Old-KD-infected mice (20–21 months, n = 5). Analysis results of β-hydroxybutyrate (BHB) level (C), food intake per day (D), glucose level (E), and core body temperature (F) were shown until 7 days post-infection. (G–I) Measurement of vital signs of Old-Chow- and Old-KD-infected mice. Analysis results of heart rate (G), breath rate (H), and pulse distention (I) were indicated. Error bars represent the mean ± S.E.M. Two-tailed unpaired t-tests were performed for statistical analysis. *p<0.05; **p<0.01; ****p<0.0001.
Figure 5 with 2 supplements
Ketogenic diet protects old mice from A59 (mCoV) infection by alleviation of inflammation.
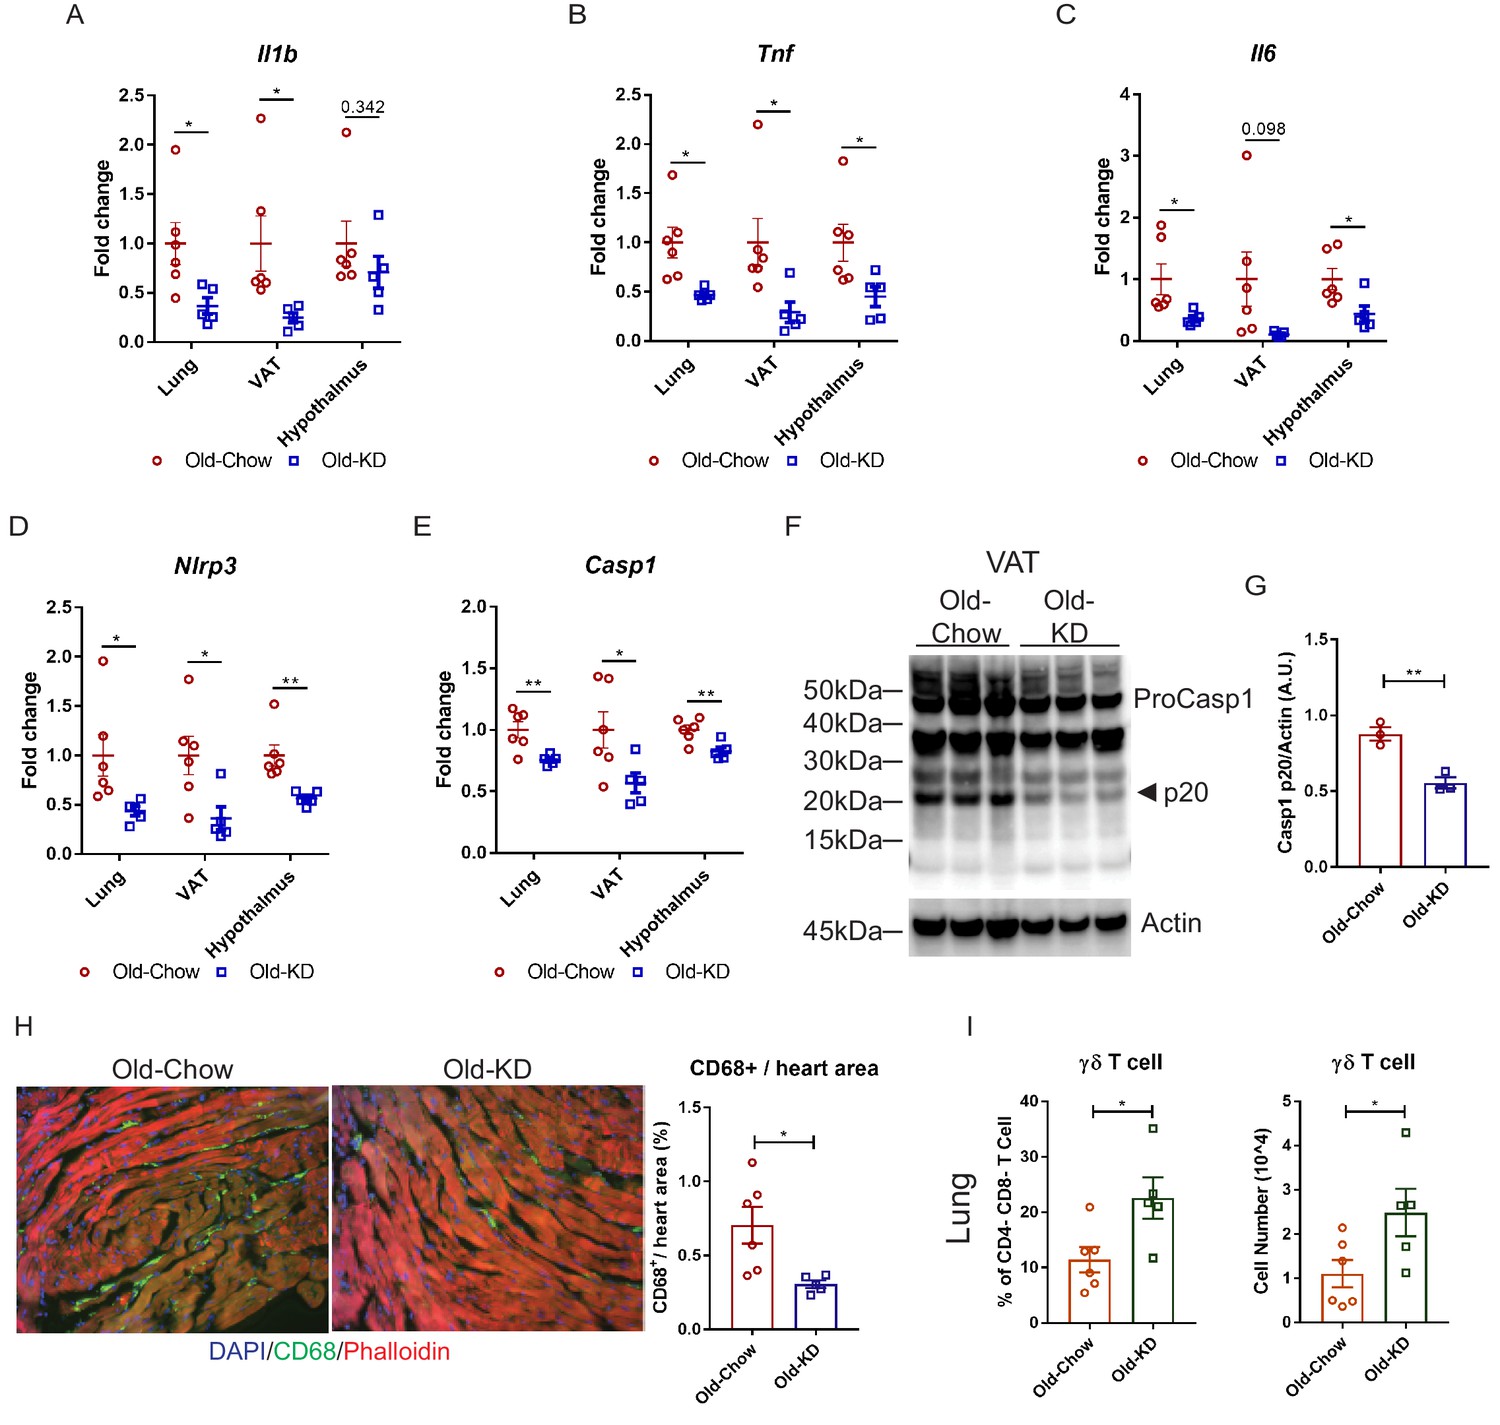
(A–E) Gene expression analysis of inflammatory cytokines (A–C) and components of inflammasome (D, E) in lung, VAT, and hypothalamus of A59 (mCoV)-infected old mice fed chow (Old-Chow, 20–21 months, n = 6) or KD (Old-KD, 20–21 months, n = 5). (F, G) Western blot analysis of caspase-1 inflammasome activation (F) in VAT of infected Old-Chow and Old-KD mice with quantification (G). (H) Representative immunofluorescence images of CD68 expression, phalloidin, and DAPI in hearts isolated from Old-Chow and Old-KD mice (left) and CD68+ cells/heart area analysis in heart of infected Old-Chow and Old-KD mice (right). (I) Flow cytometry analysis of γδ T cell in lung of infected Old-Chow and Old-KD mice. Error bars represent the mean ± S.E.M. Two-tailed unpaired t-tests were performed for statistical analysis. *p<0.05; **p<0.01.
Figure 5—figure supplement 1
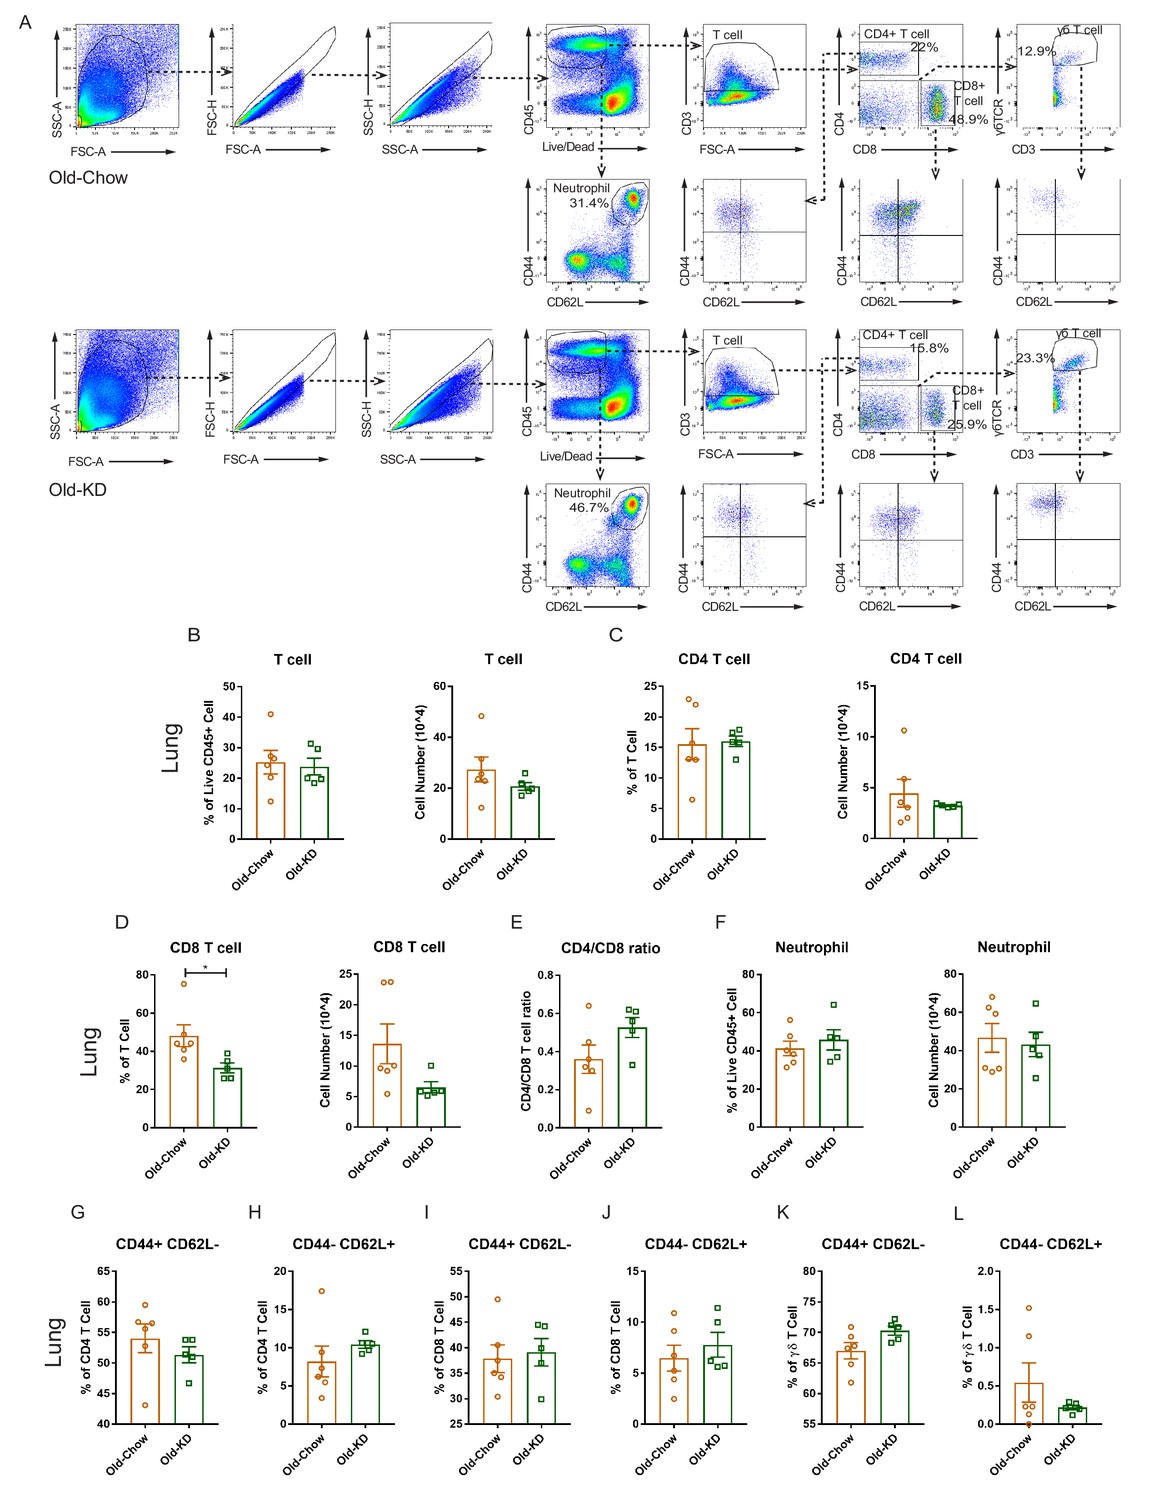
Immune cell population profile in lung of infected old mice provided with chow or ketogenic diet.
(A) Representative flow cytometry gating plot to analyze T lymphocytes, neutrophils in lung from infected Old-Chow and Old-KD mice. (B–F) Flow cytometry analysis of T lymphocytes and neutrophil in lung of infected Old-Chow (20–21 months, n = 6) and Old-KD (20–21 months, n = 5) mice. Analysis results of T cell (B), CD4 T cell (C), CD8 T cell (D), CD4/CD8 T cell ratio (E), and neutrophil (F). (G–L) Sub-population analysis of T cells in lung of infected Old-Chow and Old-KD mice by flow cytometry analysis. CD44 +CD62L− (G) and CD44−CD62+ (H) cell population in CD4 T cells. CD44+CD62L− (I) and CD44−CD62+ (J) cell population in CD8 T cells. CD44+CD62L− (K) and CD44−CD62+ (L) cell population in γδ T cells. Error bars represent the mean ± S.E.M. Two-tailed unpaired t-tests were performed for statistical analysis. *p<0.05.
Figure 5—figure supplement 2
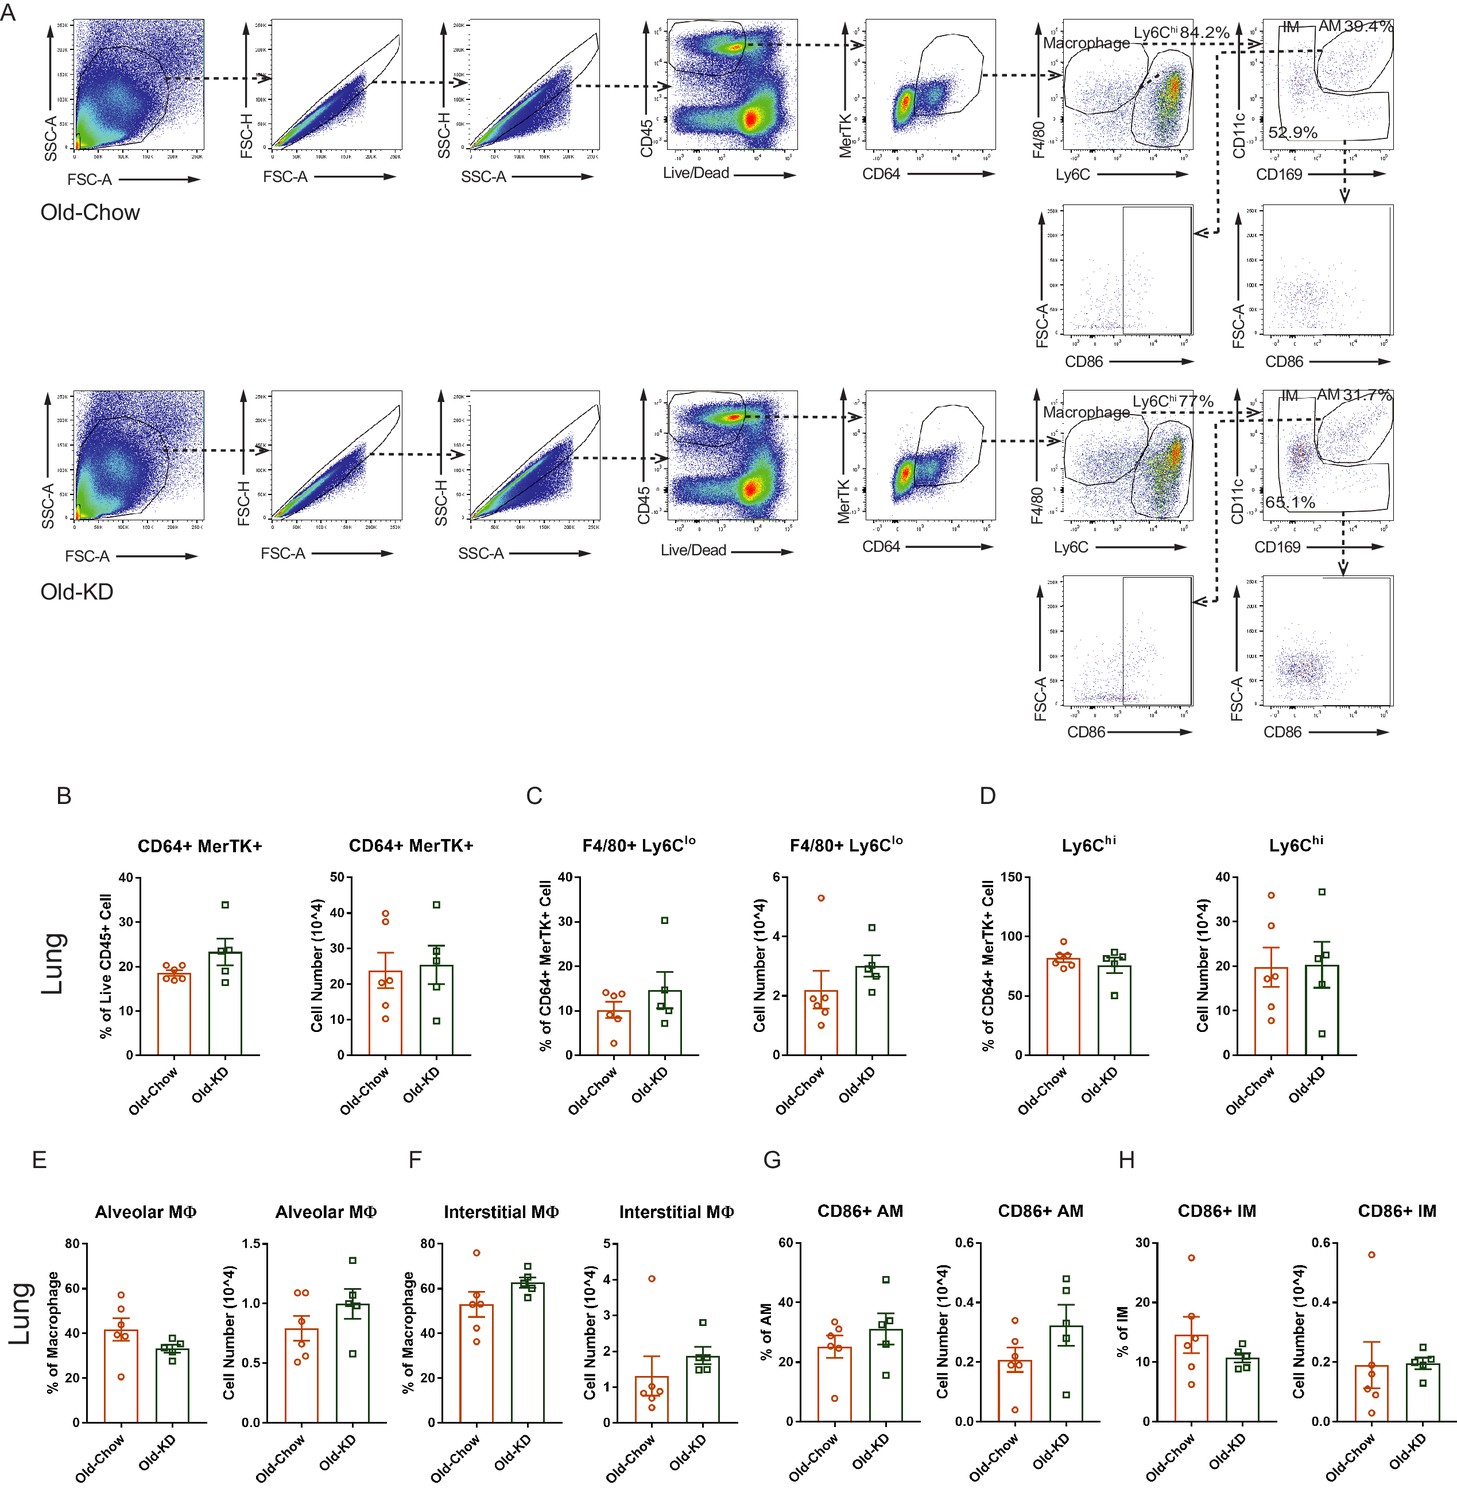
Myeloid cell population profile in lung of infected old mice provided with chow or ketogenic diet.
(A) Representative flow cytometry gating plot to analyze myeloid cells in lung from infected Old-Chow and Old-KD mice. (B–F) Flow cytometry analysis of myeloid cells in lung of infected Old-Chow (20–21 months, n = 6) and Old-KD (20–21 months, n = 5) mice. Analysis results of CD64+ MerTK+ cell (B), F4/80 + Ly6 Clo cell (C), Ly6Chi cell (D), alveolar macrophage (E), and interstitial macrophage (F). (G–H) Sub-population analysis of macrophages in lung of infected Old-Chow and Old-KD mice by flow cytometry analysis. CD86+ alveolar macrophage (AM) (G) and interstitial macrophage (IM) (H). Error bars represent the mean ± S.E.M. Two-tailed unpaired t-tests were performed for statistical analysis.
Figure 6 with 2 supplements
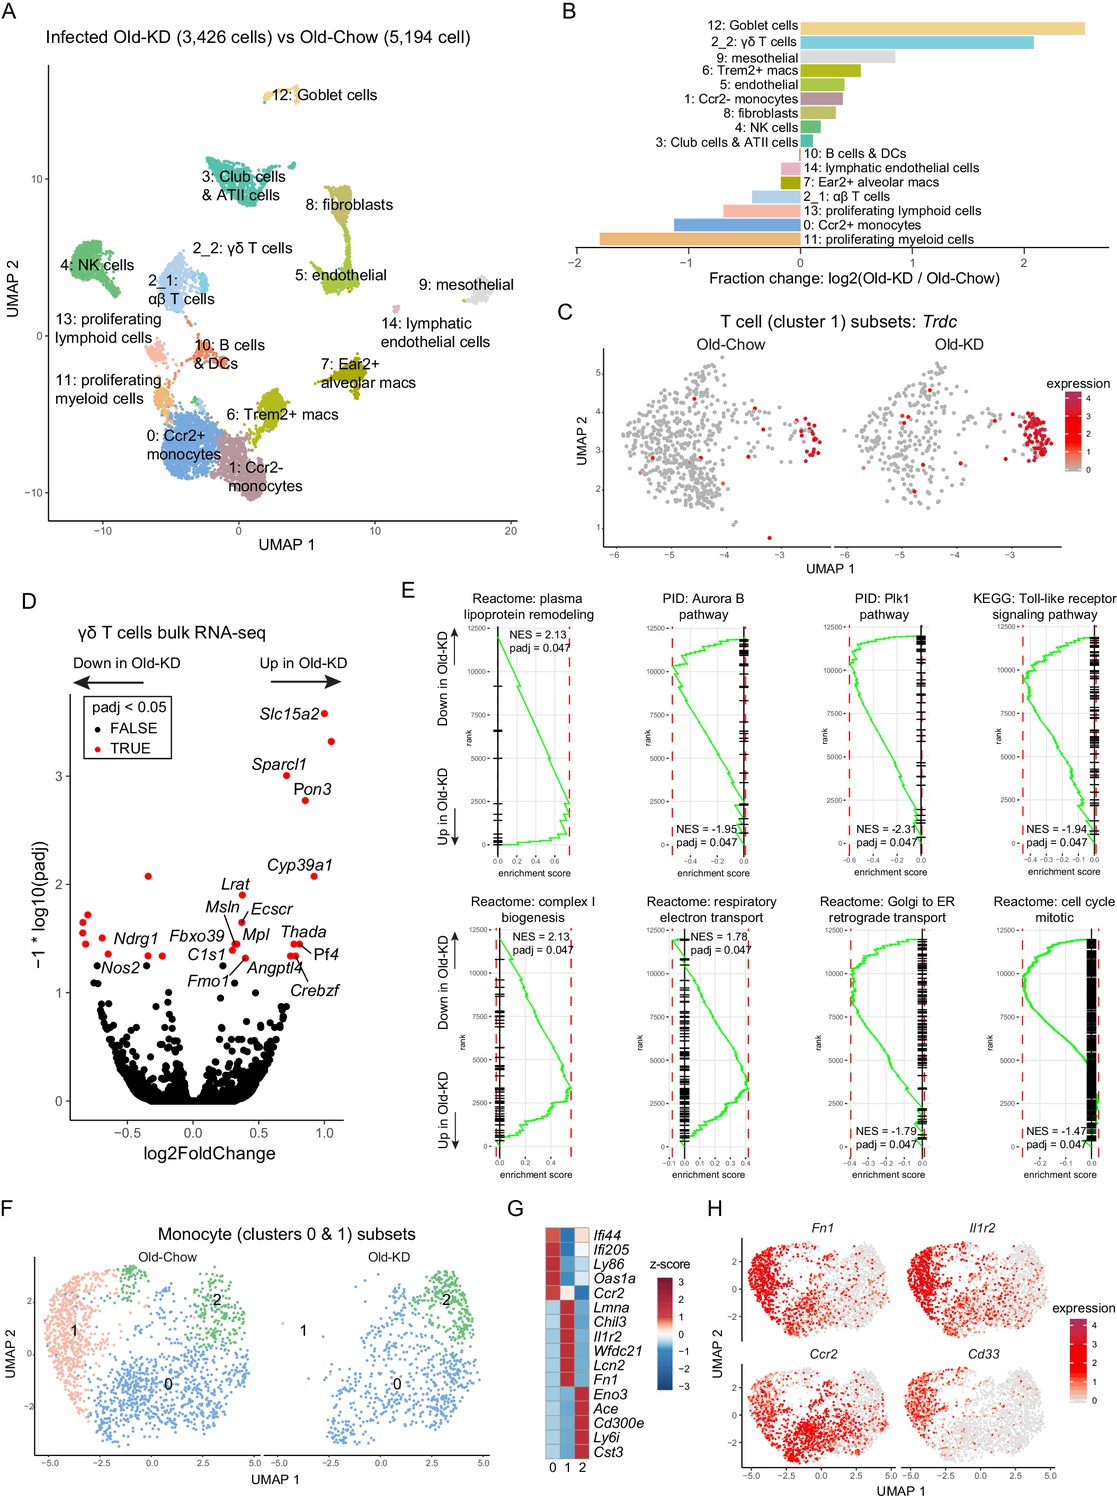
Ketogenesis induces protective γδ T cell expansion and inhibits myeloid cell activation in aged mice with mCoV infection.
(A) Uniform Manifold Approximation and Projection (UMAP) plot of lung cells from Old-KD and Old-Chow samples as described in Figure 4E. (B) Bar chart shows population fold-changes in relative abundance of each cluster. (C) Zoom into UMAP plot from A showing T cells (cluster 1) split by sample. Color represents expression of Trdc. (D) Volcano plot identifying significantly regulated genes (5% FDR) within sorted γσ T cells from lungs of Old-KD and Old-Chow mice. Increase in expression corresponds to ketogenic diet-induced genes. (E) GSEA enrichment curve based on differential expression analysis results shown in (D). (F) Monocyte cluster 0 and 1 from (A) were subset and analyzed separately. UMAP plot of monocytes split by samples. (G) Heatmap of normalized within row gene expression values of selected markers of three monocyte subsets. (H) UMAP as in (F). Color represents expression of selected genes. For (A–C, F–H), expression values were obtained by pooling data from Old-Chow and Old-KD samples (each containing n = 6 chow and n = 5 KD pooled biological samples into one technical sample for each diet).
Figure 6—figure supplement 1
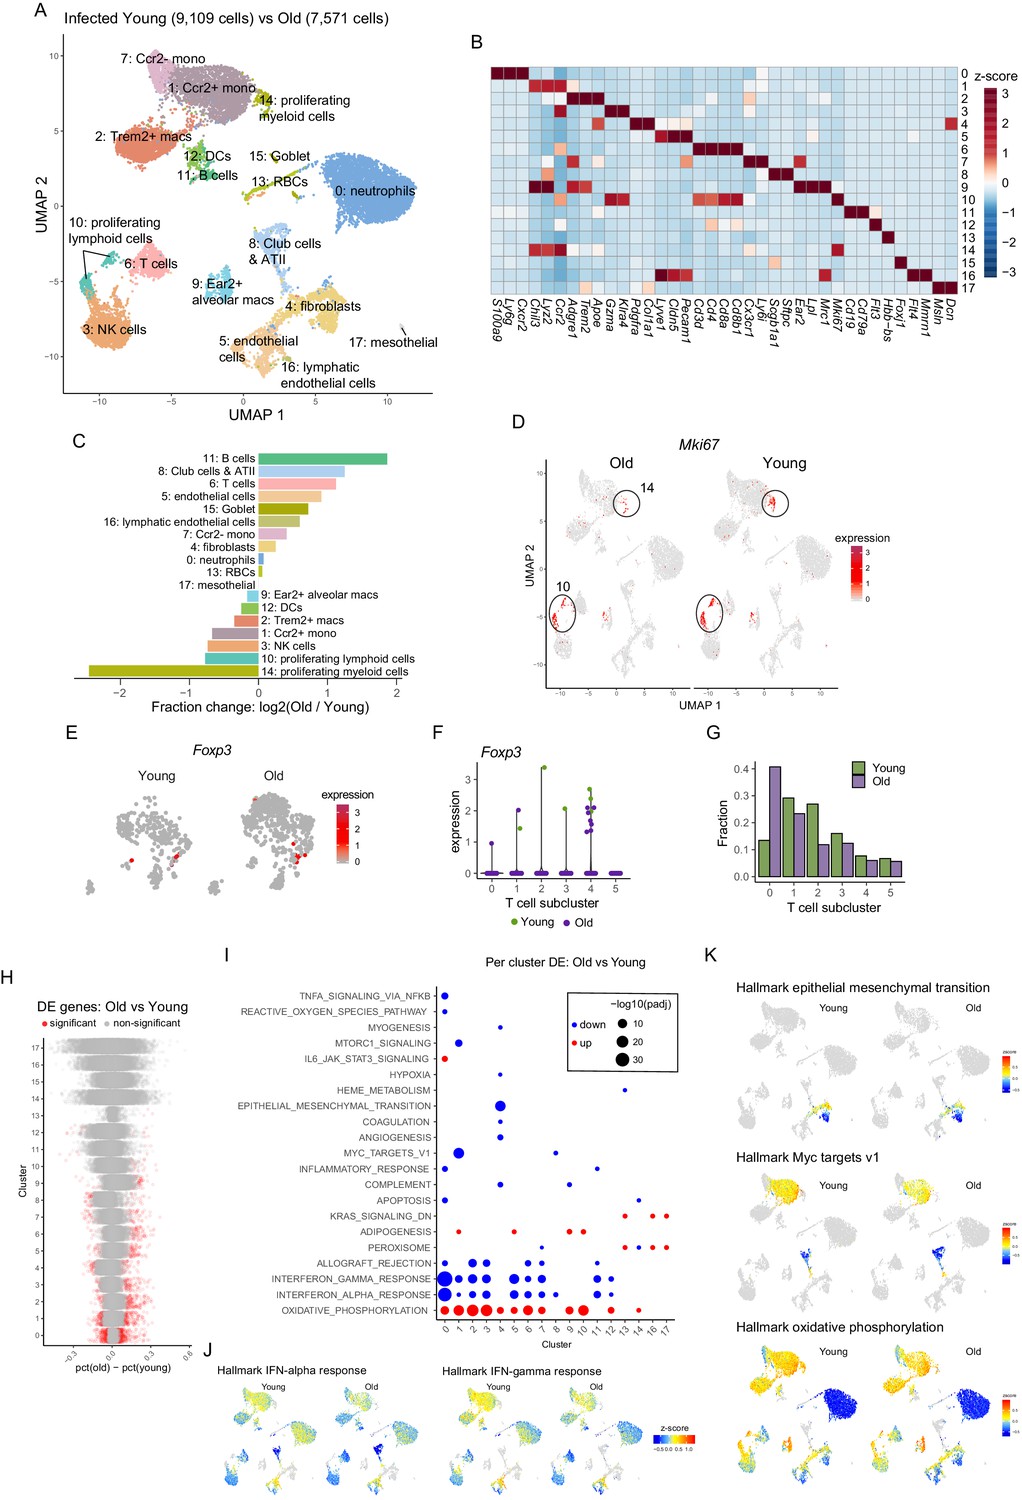
Single-cell RNA-sequencing analysis of lung from young and old A59 (mCoV)-infected mice.
(A) UMAP plot of lung cells from infected young and old samples as described in Figure 1A. (B) Heatmap of normalized gene expression values of selected genes to identify major lineages. (C) Bar chart shows population fold-changes in relative abundance of each cluster. (D) UMAP as in (A) split by sample. Color represents expression of Mki67. (E) Foxp3 expressing Treg population in T cells in young and old infected mice. (F) Expression level of Foxp3 in subclusters of T cells in young and old infected mice. (G) Fraction of T cell subclusters in young and old infected mice. (H) Summary of cluster-by-cluster differential expression comparison of infected young and old samples. Each dot represents a gene, and significant genes are shown in red. (I) Gene set enrichment analysis of significantly up- and downregulated genes described in (H). (J, K) UMAP as in (A) split by sample. Color shows average z-scores of genes in selected pathways.
Figure 6—figure supplement 2
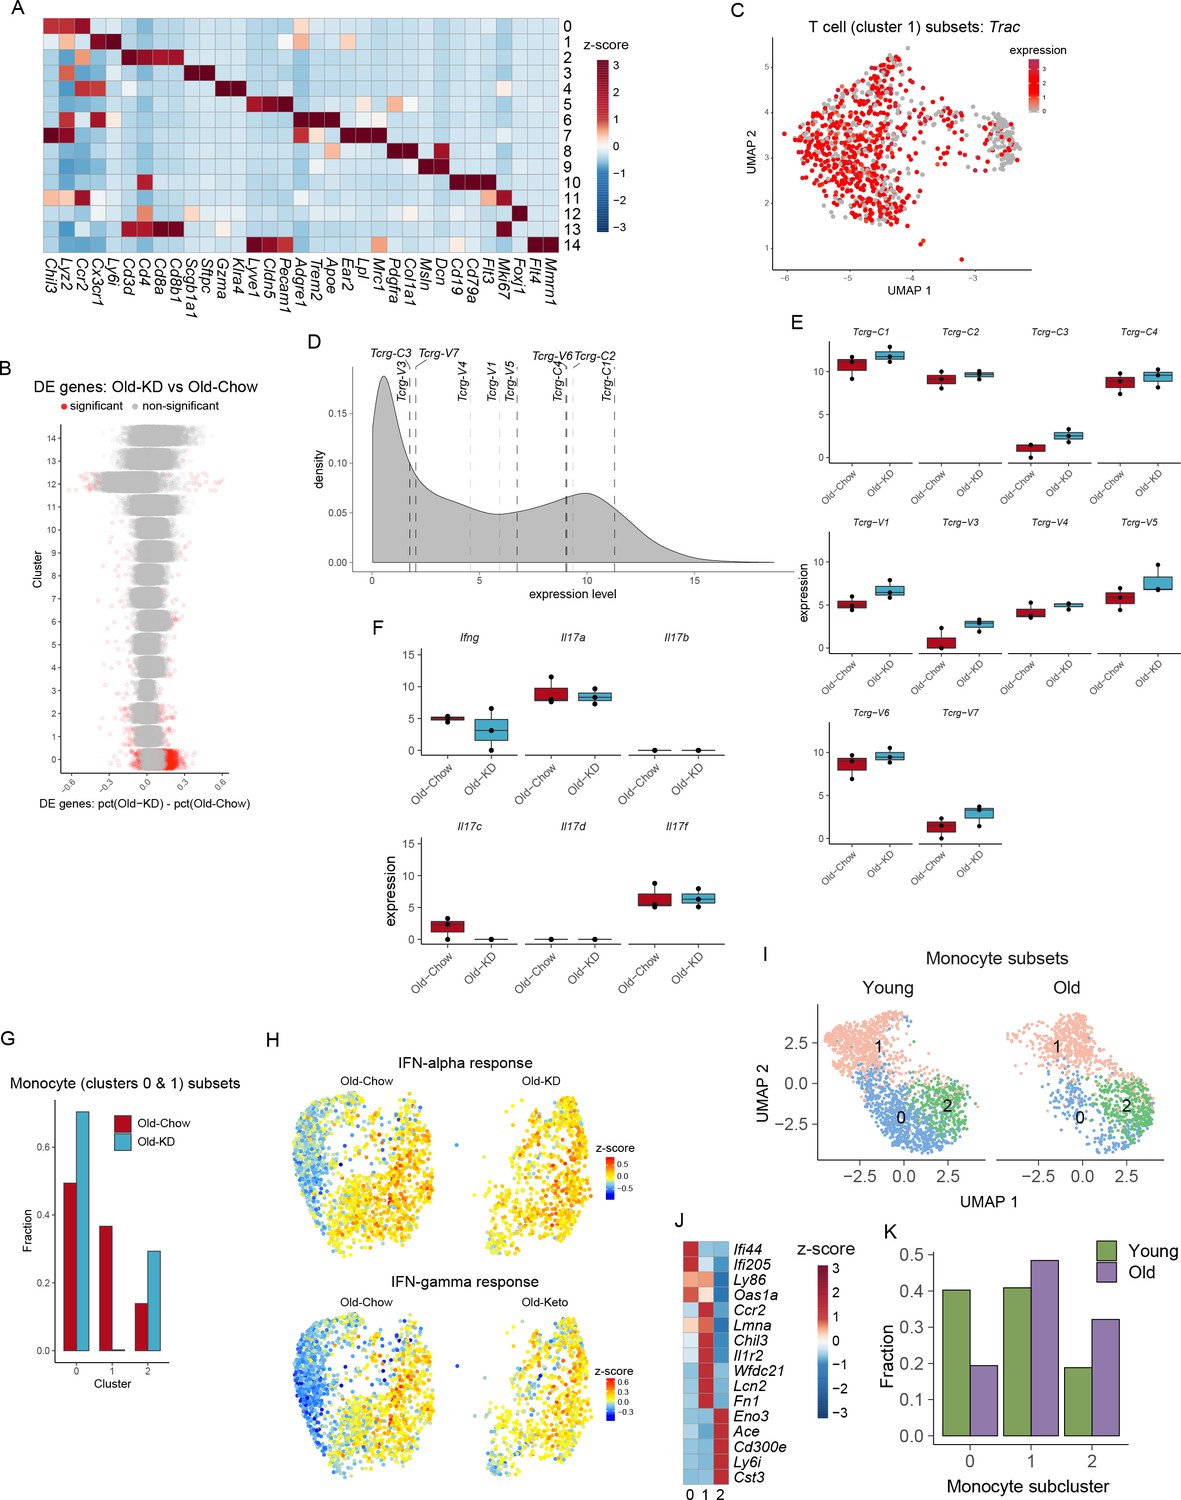
The lung RNA-sequencing analysis of old infected mice fed chow or ketogenic diet.
(A) Heatmap of normalized gene expression values of selected genes to identify major lineages. (B) Summary of cluster-by-cluster differential expression comparison of Old-KD and Old-Chow. Each dot represents a gene, and significant genes are shown in red. (C) UMAP plot of T cell cluster as in Figure 6C. Color represents expression of Trac. (D) Density plot of expression levels of Vγ chain genes. (E) Expression levels of Vγ chains genes in lung of Old-Chow and Old-KD mice. (F) Expression levels of Ifng and Il17 family genes in lung of Old-Chow and Old-KD mice. (G) Percentage of each monocyte subset as identified in Figure 6F relative to total number of monocytes in the corresponding sample. (H) UMAP plot as in Figure 6F showing average z-scores of genes in IFN-alpha and IFN-gamma pathways. (I) Monocyte clusters 1 and 7 from Figure 6—figure supplement 1A were subset and analyzed separately. UMAP plot of monocytes split by samples. (J) Heatmap of normalized within row gene expression values of selected markers of three monocyte subsets in lung of infected young and old mice. (K) Fraction of monocyte subclusters in lung of infected young and old mice.
Author response image 1
Author response image 2

Tables
Key resources table
| Reagent type (species) or resource | Designation | Source or reference | Identifiers | Additional information | |
|---|---|---|---|---|---|
| Strain, strain background (mouse, male) | C57BL/6 | NIA | |||
| Strain, strain background (Murine Coronavirus) | MHV-A59 | Bei resources | NR-43000 | ||
| Cell line (Rattus norvegicus) | L2 | ATCC | CCL-149 | ||
| Cell line (Mus musculus) | L929 | ATCC | CCL1 | ||
| Biological sample (Mus musculus) | Primary BMDM | This paper | Freshly isolated from mouse | ||
| Antibody | Rat anti-Caspase-1 | Genentech | N/A | WB (1:250) | |
| Antibody | Rabbit polyclonal anti-β actin | Cell Signaling Technology | Cat#4967L; RRID:AB_330288 | WB (1:1000) | |
| Antibody | Rabbit polyclonal anti-IL-1β | GeneTex | Cat#GTX74034; RRID:AB_378141 | WB (1:1000) | |
| Antibody | Rabbit polyclonal anti-ASC | AdipoGen | Cat#AG-25B-0006; RRID:AB_2490440 | WB (1:1000) | |
| Antibody | BV711 Rat monoclonal anti-CD45 | BioLegend | Cat#103147; RRID:AB_2564383 | FACS (1:100) | |
| Antibody | FITC Rat monoclonal anti-MERTK | BioLegend | Cat#151504; RRID:AB_2617035 | FACS (1:100) | |
| Antibody | BV605 Mouse monoclonal anti-CD64 | BioLegend | Cat#139323; RRID:AB_2629778 | FACS (1:100) | |
| Antibody | eFluor 450 Rat monoclonal anti-F4/80 | Thermo Fisher Scientific | Cat#48-4801-82; RRID:AB_1548747 | FACS (1:100) | |
| Antibody | PerCP-Cy5.5 Rat monoclonal anti-Ly-6C | Thermo Fisher Scientific | Cat#45-5932-82; RRID:AB_2723343 | FACS (1:100) | |
| Antibody | APC Hamster monoclonal anti-CD11c | BioLegend | Cat#117310; RRID:AB_313779 | FACS (1:100) | |
| Antibody | PE Rat monoclonal anti-CD169 | Thermo Fisher Scientific | Cat#12-5755-82; RRID:AB_2572625 | FACS (1:100) | |
| Antibody | PE/Cy7 Rat monoclonal anti-CD86 | BioLegend | Cat#105014; RRID:AB_439783 | FACS (1:100) | |
| Antibody | BV605 Rat monoclonal anti-CD3 | BioLegend | Cat#100237; RRID:AB_2562039 | FACS (1:100) | |
| Antibody | PE-Cy7 Rat monoclonal anti-CD4 | Thermo Fisher Scientific | Cat#25-0042-82; RRID:AB_469578 | FACS (1:100) | |
| Antibody | eFluor 450 Rat monoclonal anti-CD8a | Thermo Fisher Scientific | Cat#48-0081-82; RRID:AB_1272198 | FACS (1:100) | |
| Antibody | PE Hamster monoclonal anti-TCR γ/δ | BioLegend | Cat#118108; RRID:AB_313832 | FACS (1:100) | |
| Antibody | APC Rat monoclonal anti-Ly-6G | Thermo Fisher Scientific | Cat#17-9668-82; RRID:AB_2573307 | FACS (1:100) | |
| Antibody | PerCP-Cy5.5 Rat monoclonal anti-Siglec-F | BD Biosciences | Cat#565526; RRID:AB_2739281 | FACS (1:100) | |
| Antibody | PerCP-Cy5.5 Rat monoclonal anti-CD62L | BioLegend | Cat#104432; RRID:AB_2285839 | FACS (1:100) | |
| Antibody | APC/Cy7 Rat monoclonal anti-CD44 | BioLegend | Cat#103028; RRID:AB_830785 | FACS (1:100) | |
| Antibody | Rat monoclonal anti-CD68 | Bio-Rad | Cat#MCA1957; RRID:AB_322219 | IF (1:100) | |
| Peptide, recombinant protein | Recombinant Mouse M-CSF Protein | R and D Systems | Cat#416 ML-050 | ||
| Commercial assay or kit | RNeasy Plus micro kit | Qiagen | Cat#74034 | ||
| Commercial assay or kit | Direct-zol RNA Miniprep Plus kit | Zymo Research | Cat#R2072 | ||
| Commercial assay or kit | iScript cDNA synthesis kit | Bio-Rad | Cat#1708891 | ||
| Commercial assay or kit | Power SYBR Green PCR Master Mix | Thermo Fisher Scientific | Cat#4367659 | ||
| Commercial assay or kit | ProcartaPlex multiplex assay | Thermo Fisher Scientific | Cat#PPX | ||
| Chemical compound, drug | Alexa Fluor 594 Phalloidin | Thermo Fisher Scientific | Cat#A12381, RRID:AB_2315633 | ||
| Chemical compound, drug | LPS | Sigma | Cat#L3024 | ||
| Chemical compound, drug | Pam3CSK4 | Invivogen | Cat#tlrl-pms | ||
| Chemical compound, drug | (R)-Hydroxybutyric Acid (BHB) | Sigma | Cat#54920–1 G-F | ||
| Chemical compound, drug | Disuccinimidyl suberate (DSS) | Thermo Fisher Scientific | Cat#21655 | ||
| Software, algorithm | Image J | NIH | https://imagej.nih.gov/ij/ | ||
| Software, algorithm | Prism 7 | Graphpad | https://www.graphpad.com/ | ||
| Software, algorithm | FlowJo | Treestar | https://www.flowjo.com/ | ||
| Software, algorithm | Cell Ranger Single-Cell Software Suite (v3.0.2) | 10x genomics | https://support.10xgenomics.com | ||
| Software, algorithm | R (v3.5.0) package Seurat (v3.1.1) | Butler et al., 2018 | https://cran.r-project.org/web/packages/Seurat/index.html | ||
| Software, algorithm | MAST | Finak et al., 2015 | https://github.com/RGLab/MAST | ||
| Software, algorithm | clusterProfiler package (v3.12.0) | Yu et al., 2012 | http://bioconductor.org/packages/release/bioc/html/clusterProfiler.html | ||
| Software, algorithm | STAR (v2.7.3a) | Dobin et al., 2013 | http://code.google.com/p/rna-star/ | ||
| Software, algorithm | MultiQC (v1.9) | Ewels et al., 2016 | http://multiqc.info | ||
| Software, algorithm | HTSeq framework (v0.11.2) | Anders et al., 2015 | http://www-huber.embl.de/HTSeq | ||
| Software, algorithm | DeSeq2 package (v1.24.0) | Love et al., 2014 | http://www.bioconductor.org/packages/release/bioc/html/DESeq2.html | ||
| Software, algorithm | fgsea R package (v1.10.0) | Sergushichev, 2016 | https://github.com/ctlab/fgsea | ||
Additional files
-
Supplementary file 1
Primer information for qPCR.
The table includes information about forward and reverse primers for genes used in qPCR experiments.
- https://cdn.elifesciences.org/articles/66522/elife-66522-supp1-v2.docx
-
Transparent reporting form
- https://cdn.elifesciences.org/articles/66522/elife-66522-transrepform-v2.docx
Download links
A two-part list of links to download the article, or parts of the article, in various formats.
Downloads (link to download the article as PDF)
Open citations (links to open the citations from this article in various online reference manager services)
Cite this article (links to download the citations from this article in formats compatible with various reference manager tools)
Ketogenic diet restrains aging-induced exacerbation of coronavirus infection in mice
eLife 10:e66522.
https://doi.org/10.7554/eLife.66522


