Future life expectancy in Europe taking into account the impact of smoking, obesity, and alcohol
- Netherlands Interdisciplinary Demographic Institute - KNAW/University of Groningen, Netherlands
- Population Research Centre, Faculty of Spatial Sciences, University of Groningen, Netherlands
Figures
Figure 1 with 2 supplements
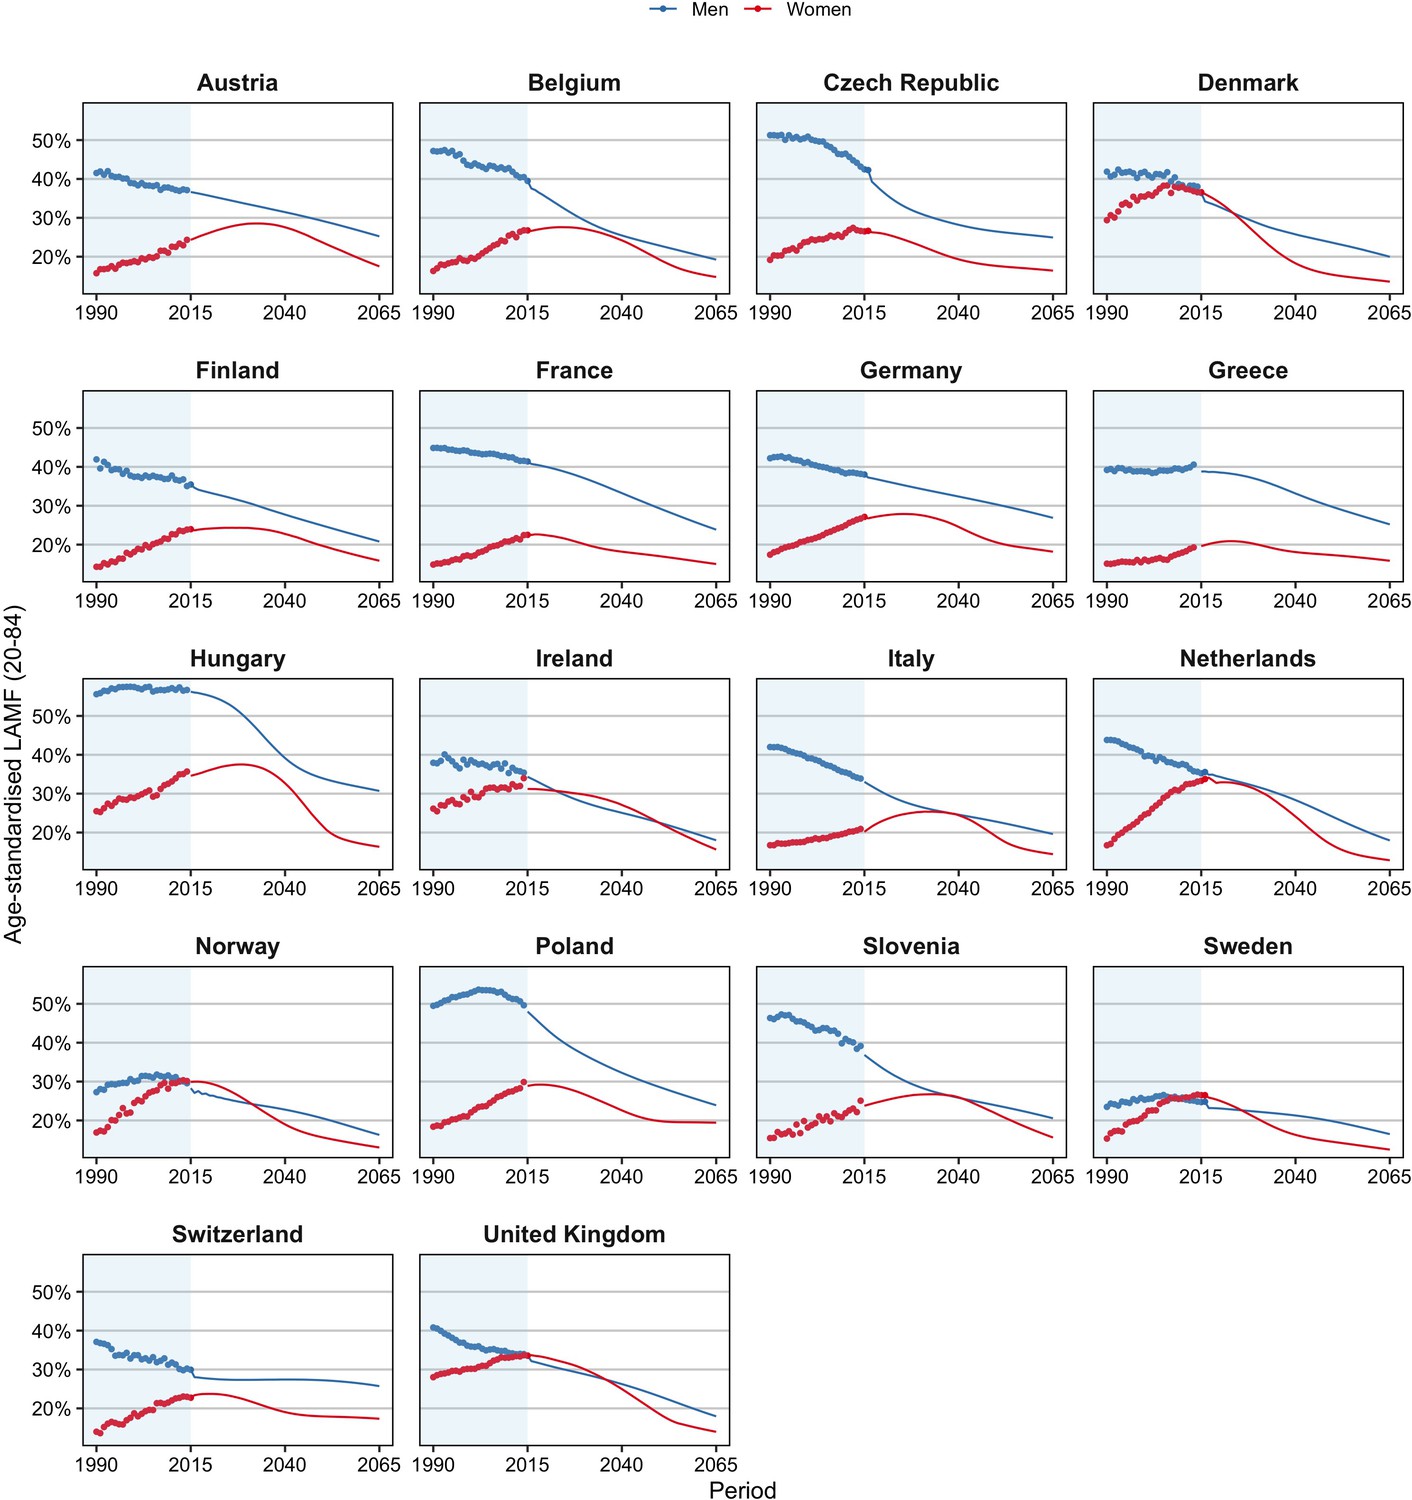
Past and projected age-standardised lifestyle-attributable mortality fractions (LAMF) (20–84), 1990–2065, by sex, for 18 European countries.
-
Figure 1—source data 1
Data behind Figure 1.
- https://cdn.elifesciences.org/articles/66590/elife-66590-fig1-data1-v2.xlsx
Figure 1—figure supplement 1
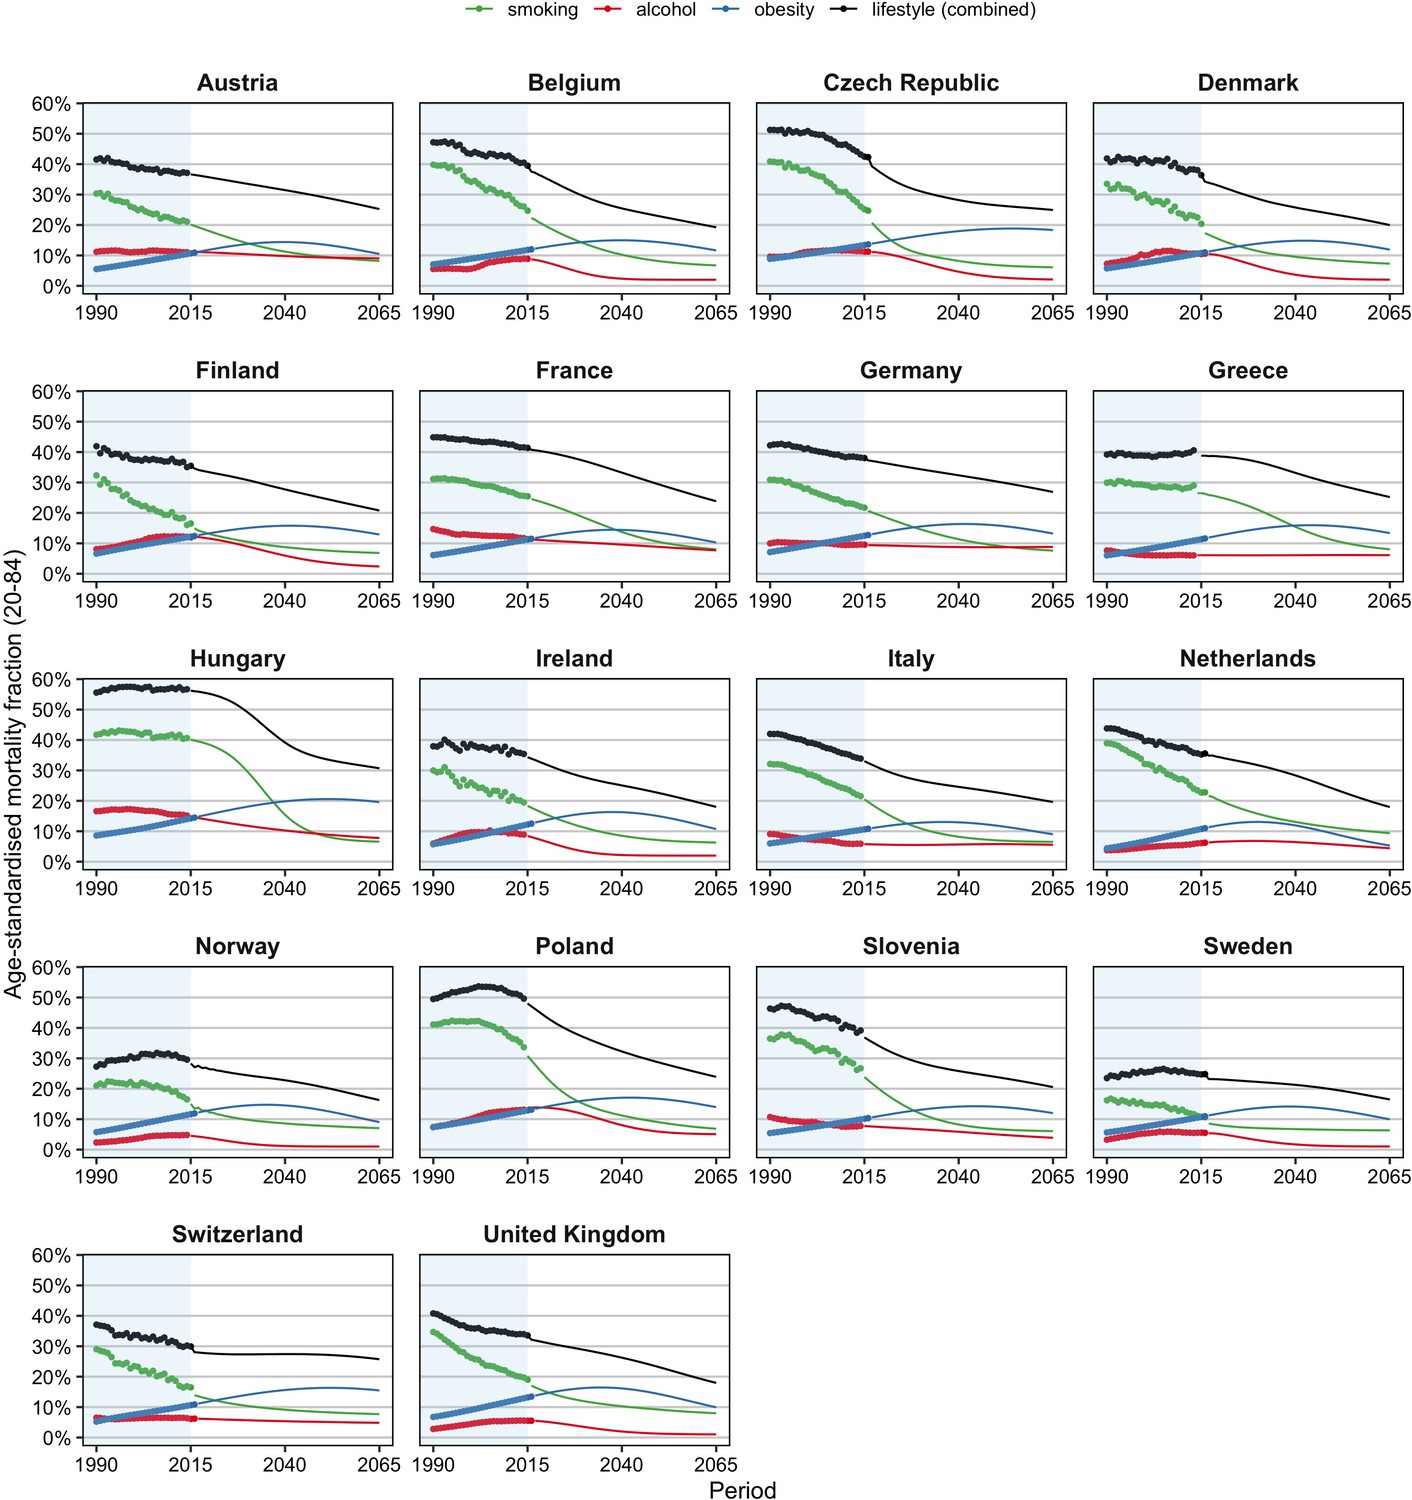
Past and projected (=median) age-standardised lifestyle-attributable mortality fractions (20–84) (smoking, alcohol, obesity, combined), 1990–2065, by country, men.
-
Figure 1—figure supplement 1—source data 1
Data behind Figure 1—figure supplement 1.
- https://cdn.elifesciences.org/articles/66590/elife-66590-fig1-figsupp1-data1-v2.xlsx
Figure 1—figure supplement 2
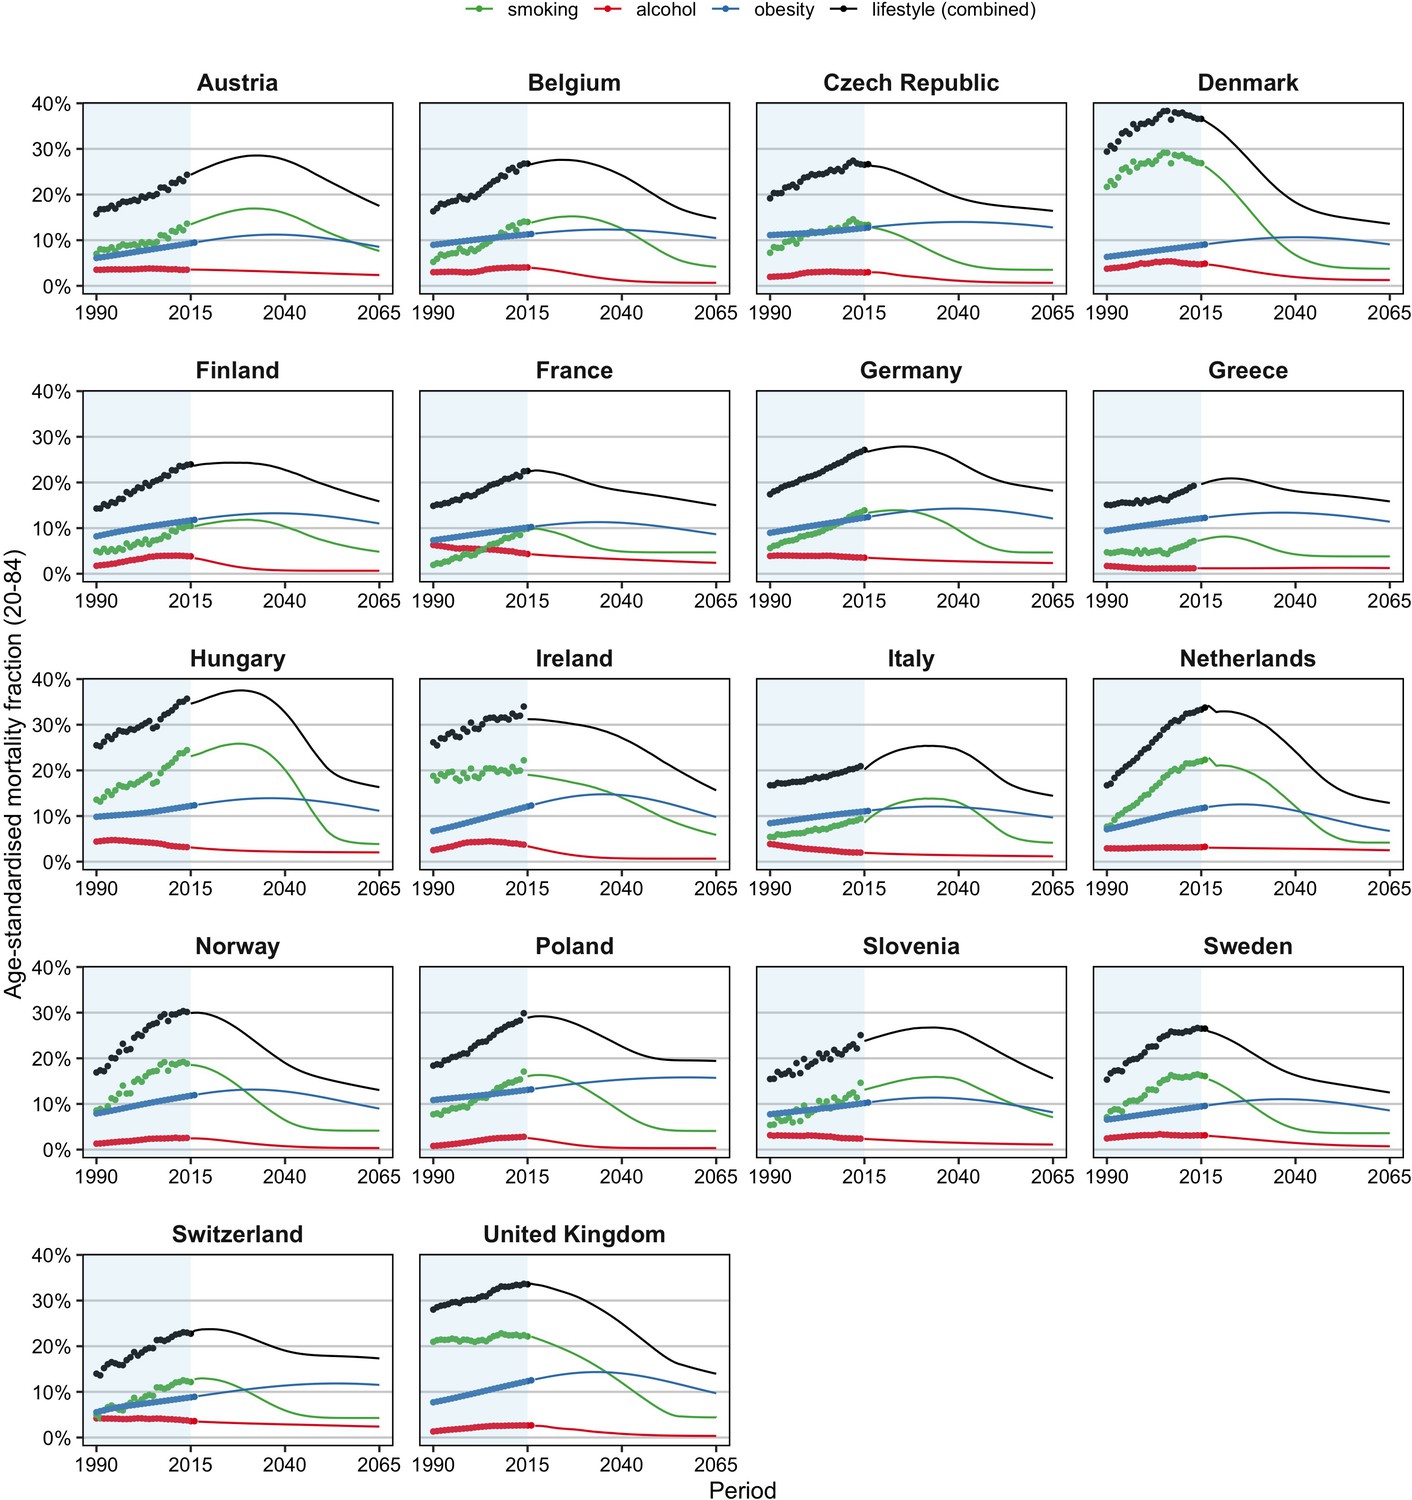
Past and projected (=median) age-standardised lifestyle-attributable mortality fractions (20–84) (smoking, alcohol, obesity, combined), 1990–2065, by country, women.
-
Figure 1—figure supplement 2—source data 1
Data behind Figure 1—figure supplement 2.
- https://cdn.elifesciences.org/articles/66590/elife-66590-fig1-figsupp2-data1-v2.xlsx
Figure 2 with 1 supplement

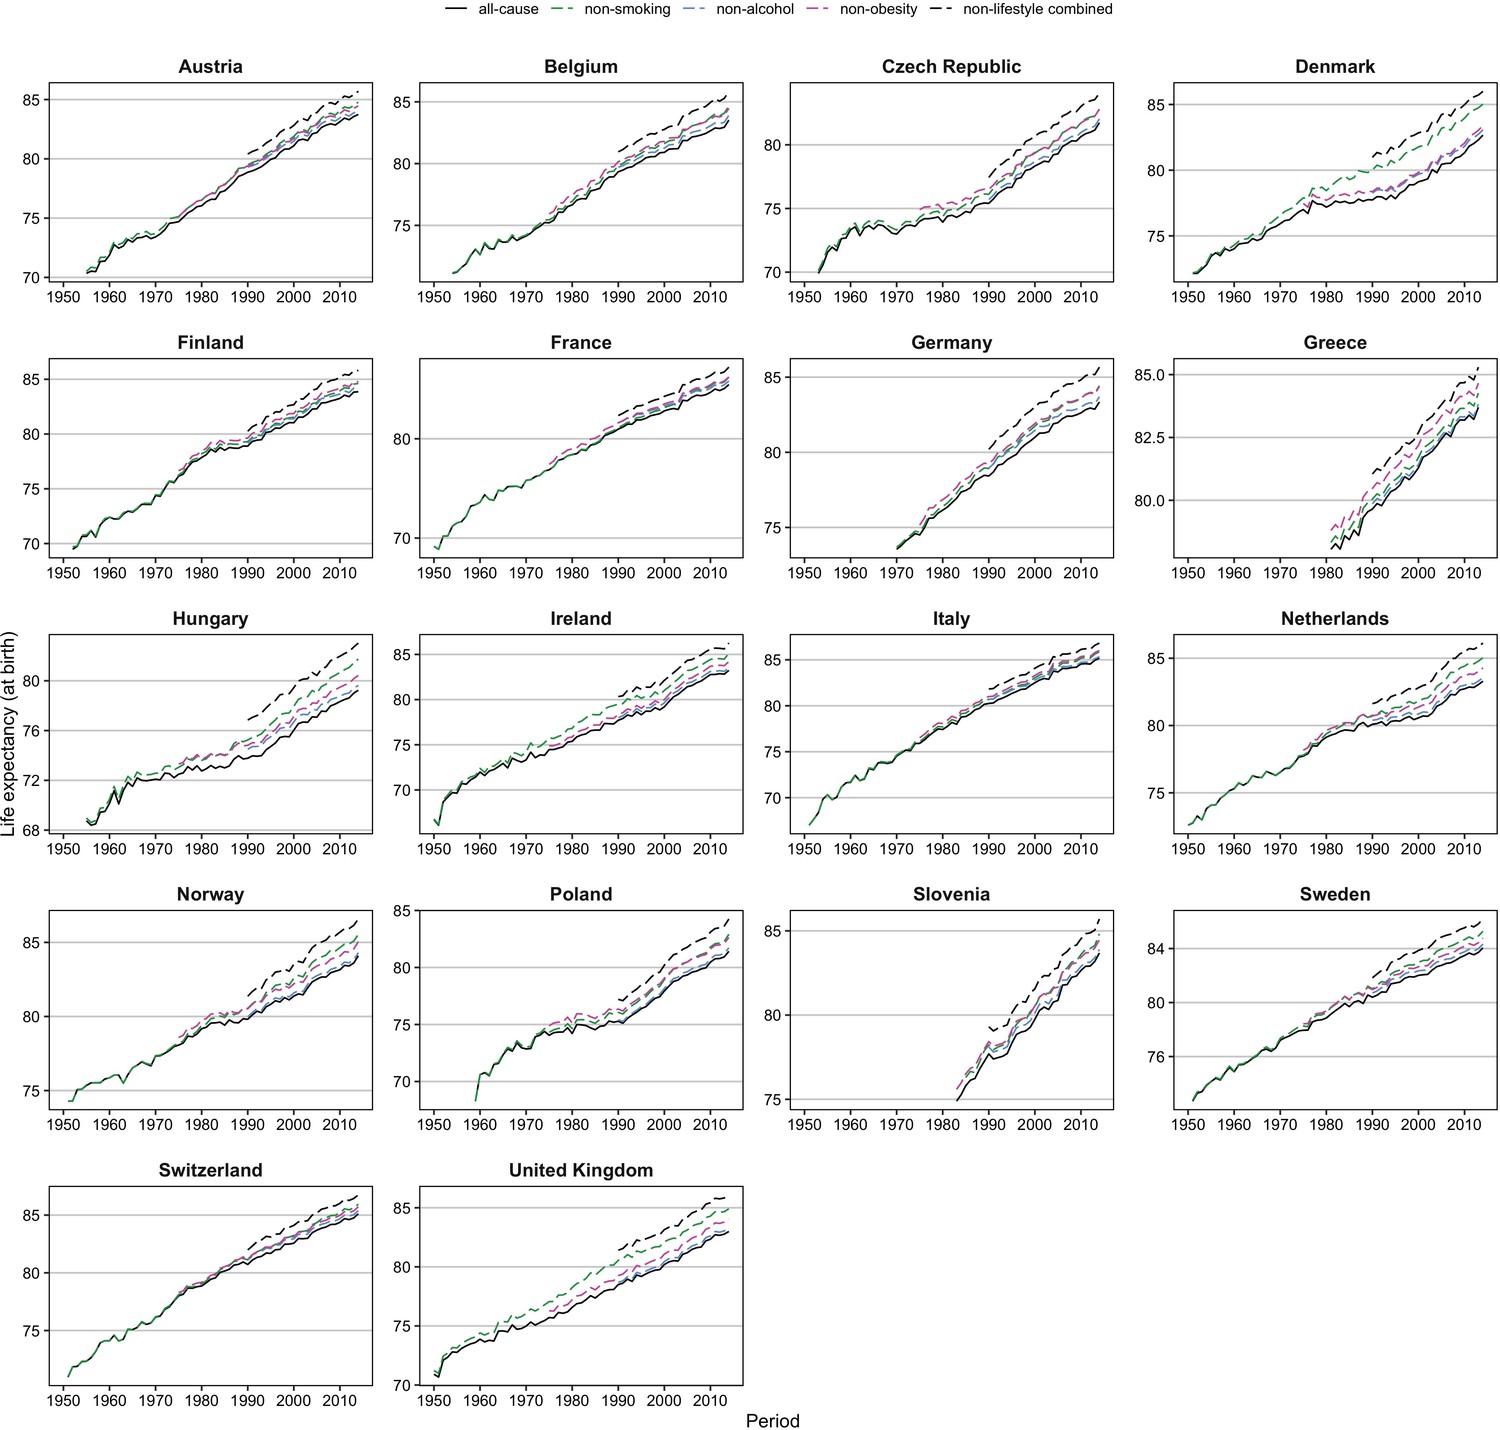
Comparison of trends in observed life expectancy at birth (e0) ( = all-cause) with trends in e0 when the effects of smoking, obesity and/or alcohol are removed ( = non-smoking, non-obesity, non-alcohol, non-lifestyle combined), 1950–2014*, men.
*Based on the available information. Reproduced from various panels in Supplementary Figure 3a from Janssen et al., 2021, under the terms of a Creative Commons Attribution License (CC-BY 4.0; https://creativecommons.org/licenses/by/4.0/).
-
Figure 2—source data 1
Data behind Figure 2.
- https://cdn.elifesciences.org/articles/66590/elife-66590-fig2-data1-v2.xlsx
Figure 2—figure supplement 1
Comparison of trends in observed life expectancy at birth (e0) ( = all-cause) with trends in e0 when the effects of smoking, obesity and/or alcohol are removed ( = non-smoking, non-obesity, non-alcohol, non-lifestyle combined), 1950–2014*, women.
*Based on the available information. Reproduced from various panels in Supplementary Figure 3b from Janssen et al., 2021, under the terms of a Creative Commons Attribution License (CC-BY 4.0; https://creativecommons.org/licenses/by/4.0/).
-
Figure 2—figure supplement 1—source data 1
Data behind Figure 2—figure supplement 1.
- https://cdn.elifesciences.org/articles/66590/elife-66590-fig2-figsupp1-data1-v2.xlsx
Figure 3 with 3 supplements
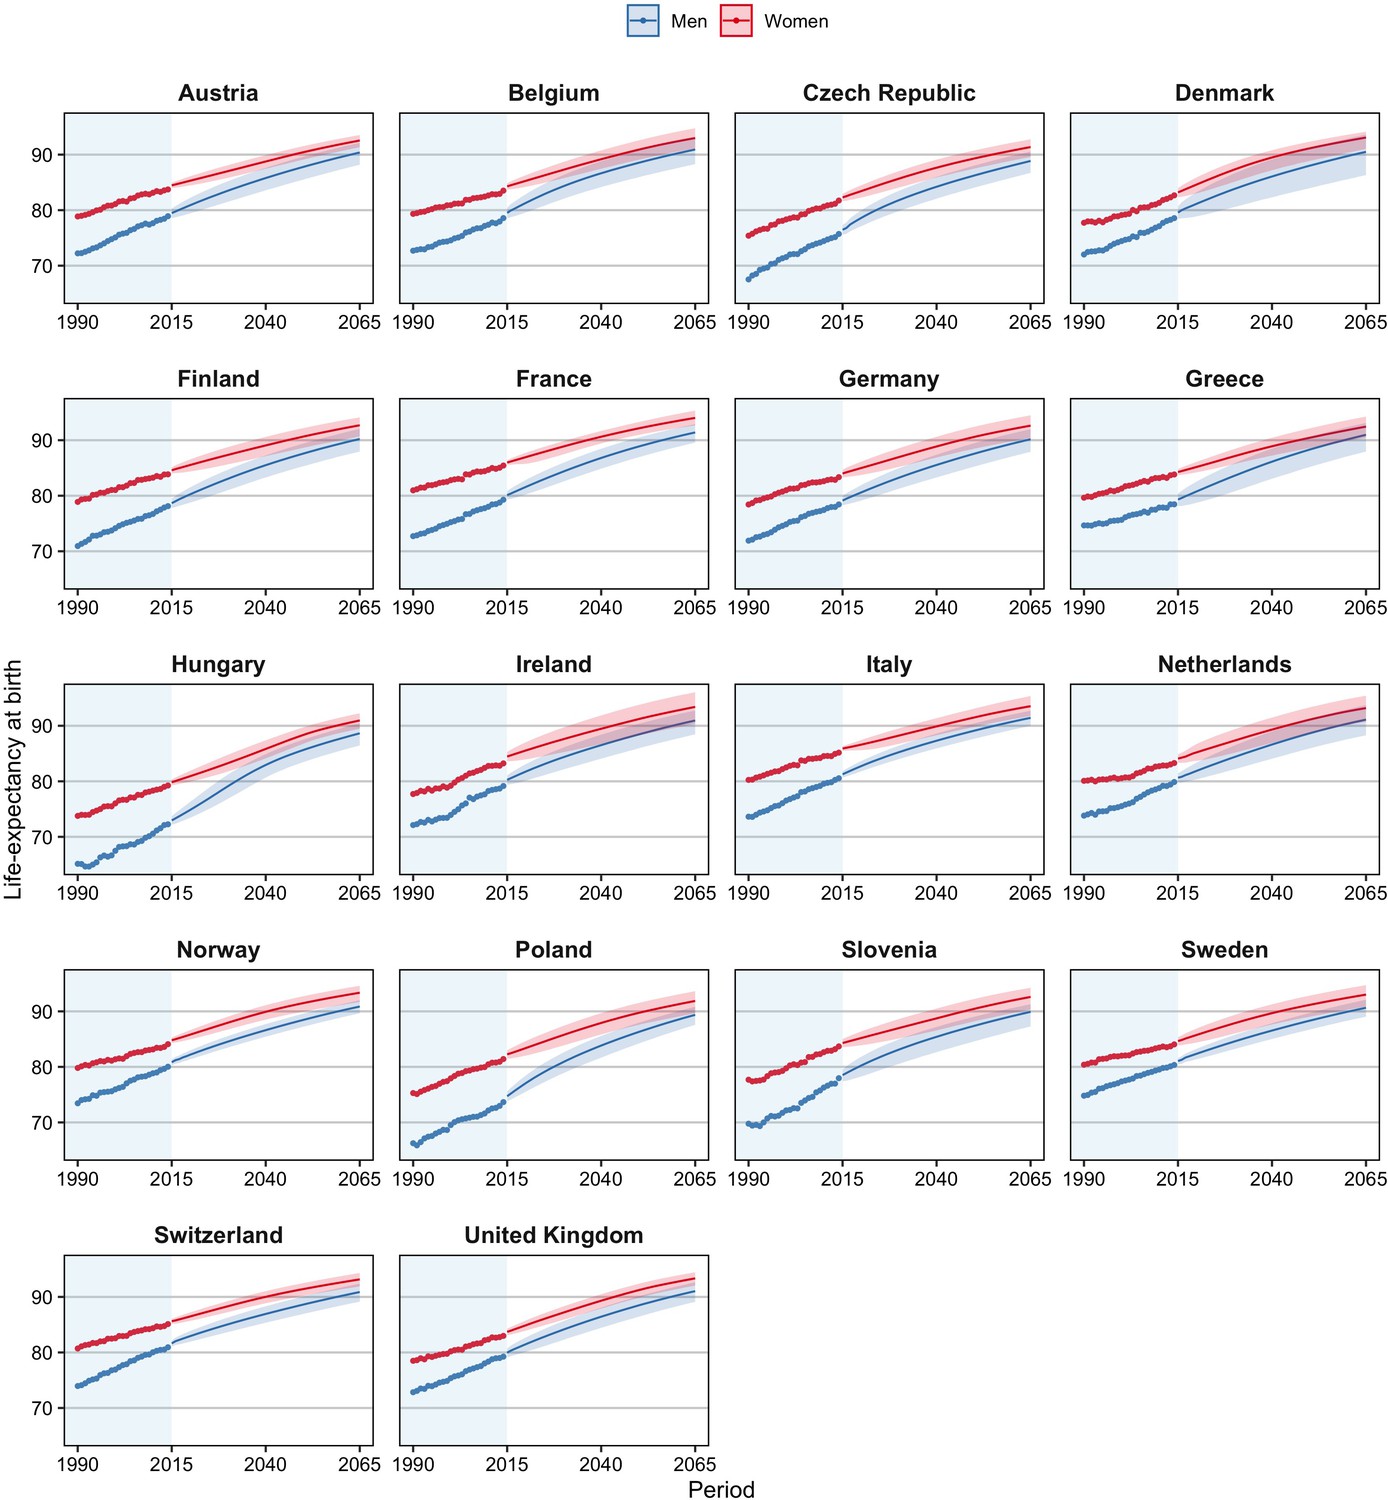
Observed and projected life expectancy at birth (including 95% projection intervals) using our projection approach, which takes into account the impact of smoking, obesity, and alcohol on past and future mortality trends, and the mortality experiences of forerunner countries, 18 European countries, by country and sex, 1990–2065.
-
Figure 3—source data 1
Data behind Figure 3.
- https://cdn.elifesciences.org/articles/66590/elife-66590-fig3-data1-v2.xlsx
Figure 3—figure supplement 1
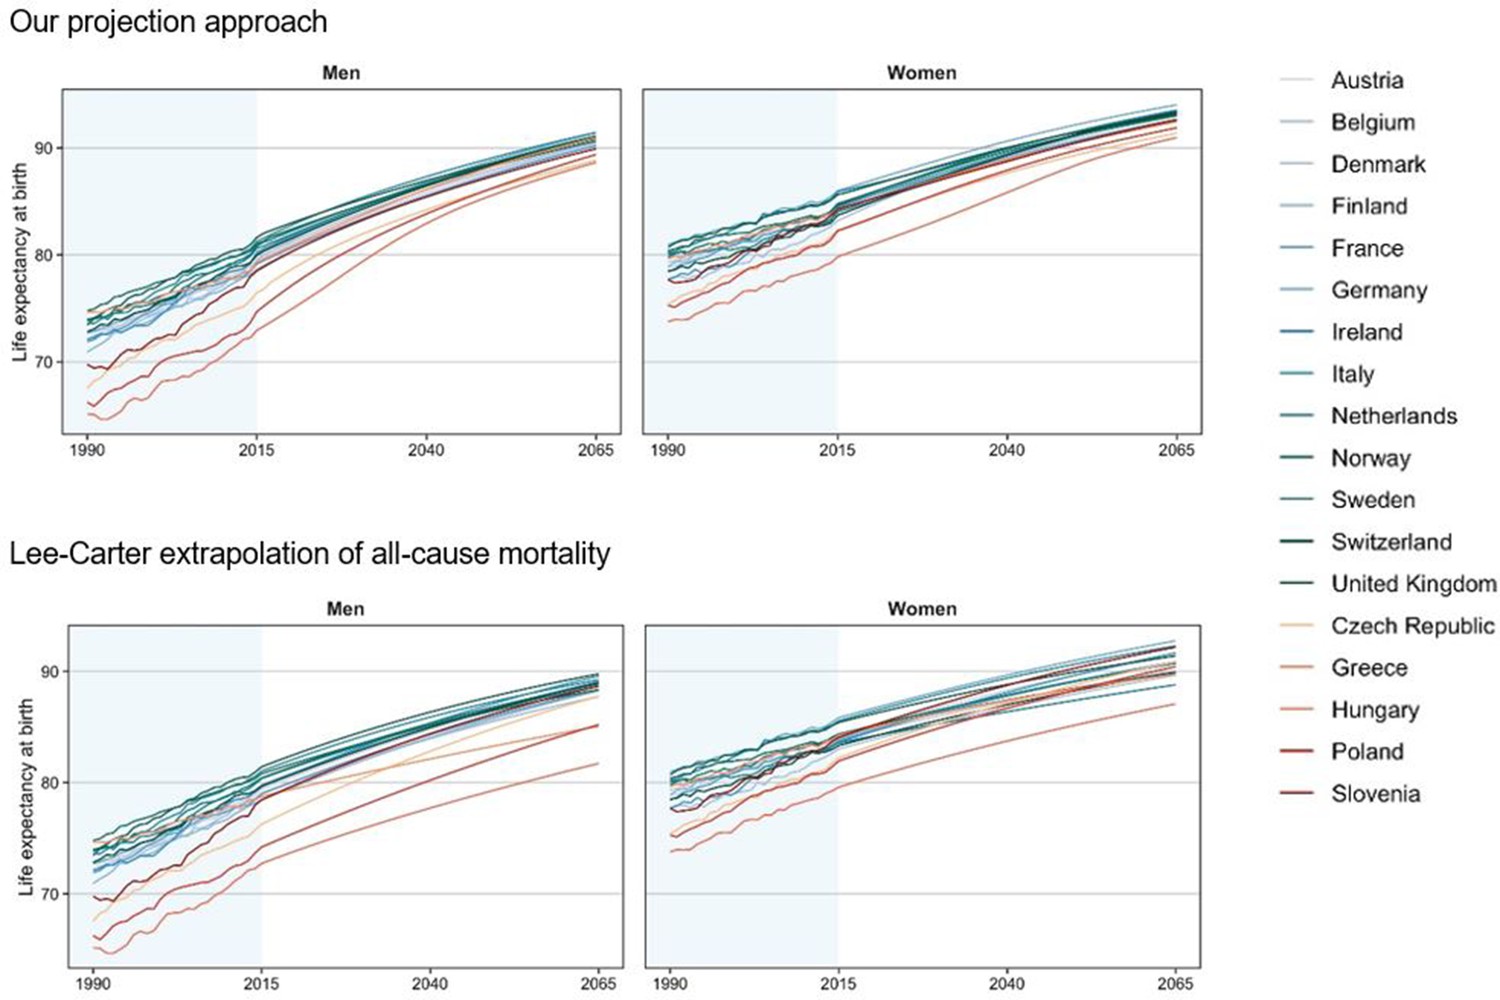
Comparison between countries of observed and projected life expectancy at birth, for our projection approach and the Lee–Carter extrapolation of all-cause mortality, 18 European countries, by sex, 1990–2065.
-
Figure 3—figure supplement 1—source data 1
Data behind Figure 3—figure supplement 1.
- https://cdn.elifesciences.org/articles/66590/elife-66590-fig3-figsupp1-data1-v2.xlsx
Figure 3—figure supplement 2
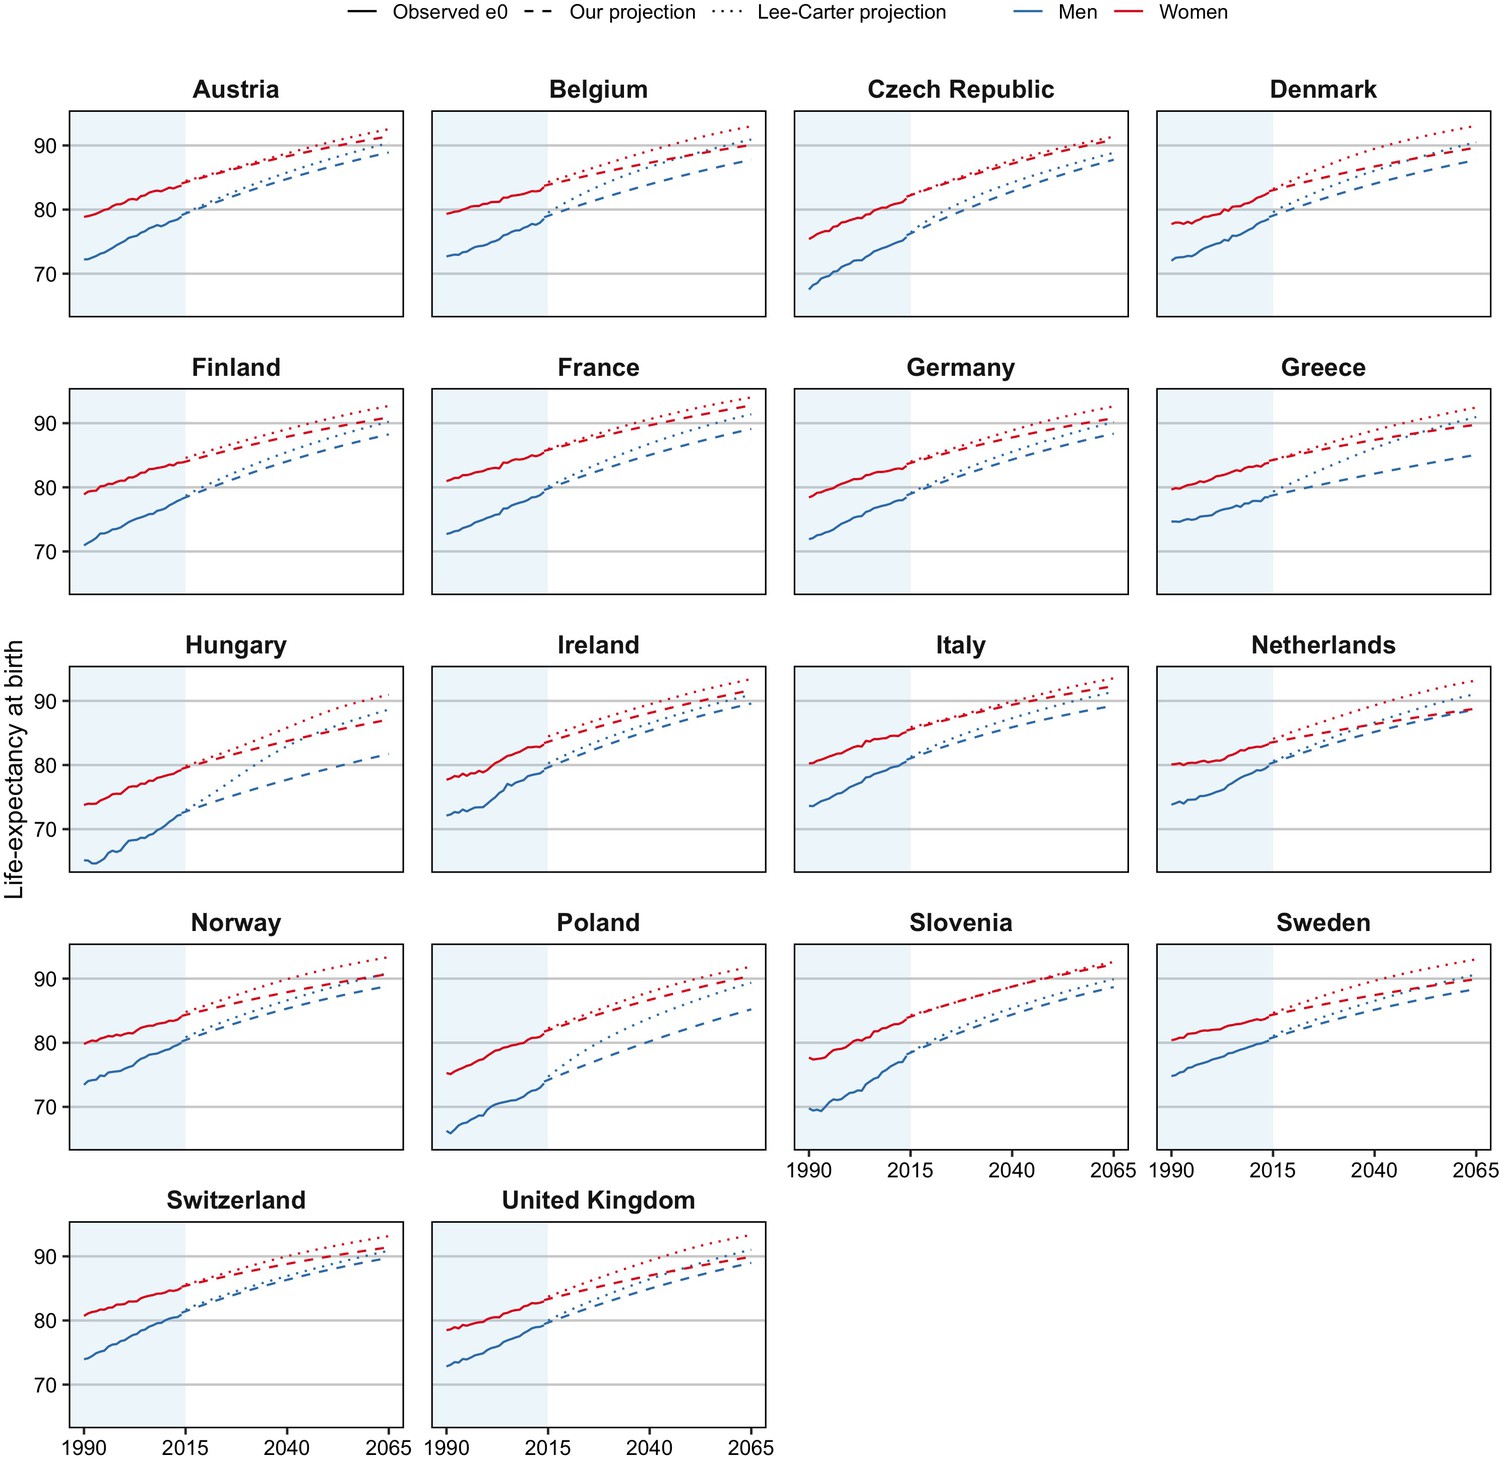
Observed and projected life expectancy at birth (e0), by country and sex, 1990–2065, for our projection approach, which takes into account the impact of smoking, obesity, and alcohol and the mortality experiences of forerunner countries, and for the Lee–Carter mortality projection applied to all-cause mortality.
-
Figure 3—figure supplement 2—source data 1
Data behind Figure 3—figure supplement 2.
- https://cdn.elifesciences.org/articles/66590/elife-66590-fig3-figsupp2-data1-v2.xlsx
Figure 3—figure supplement 3
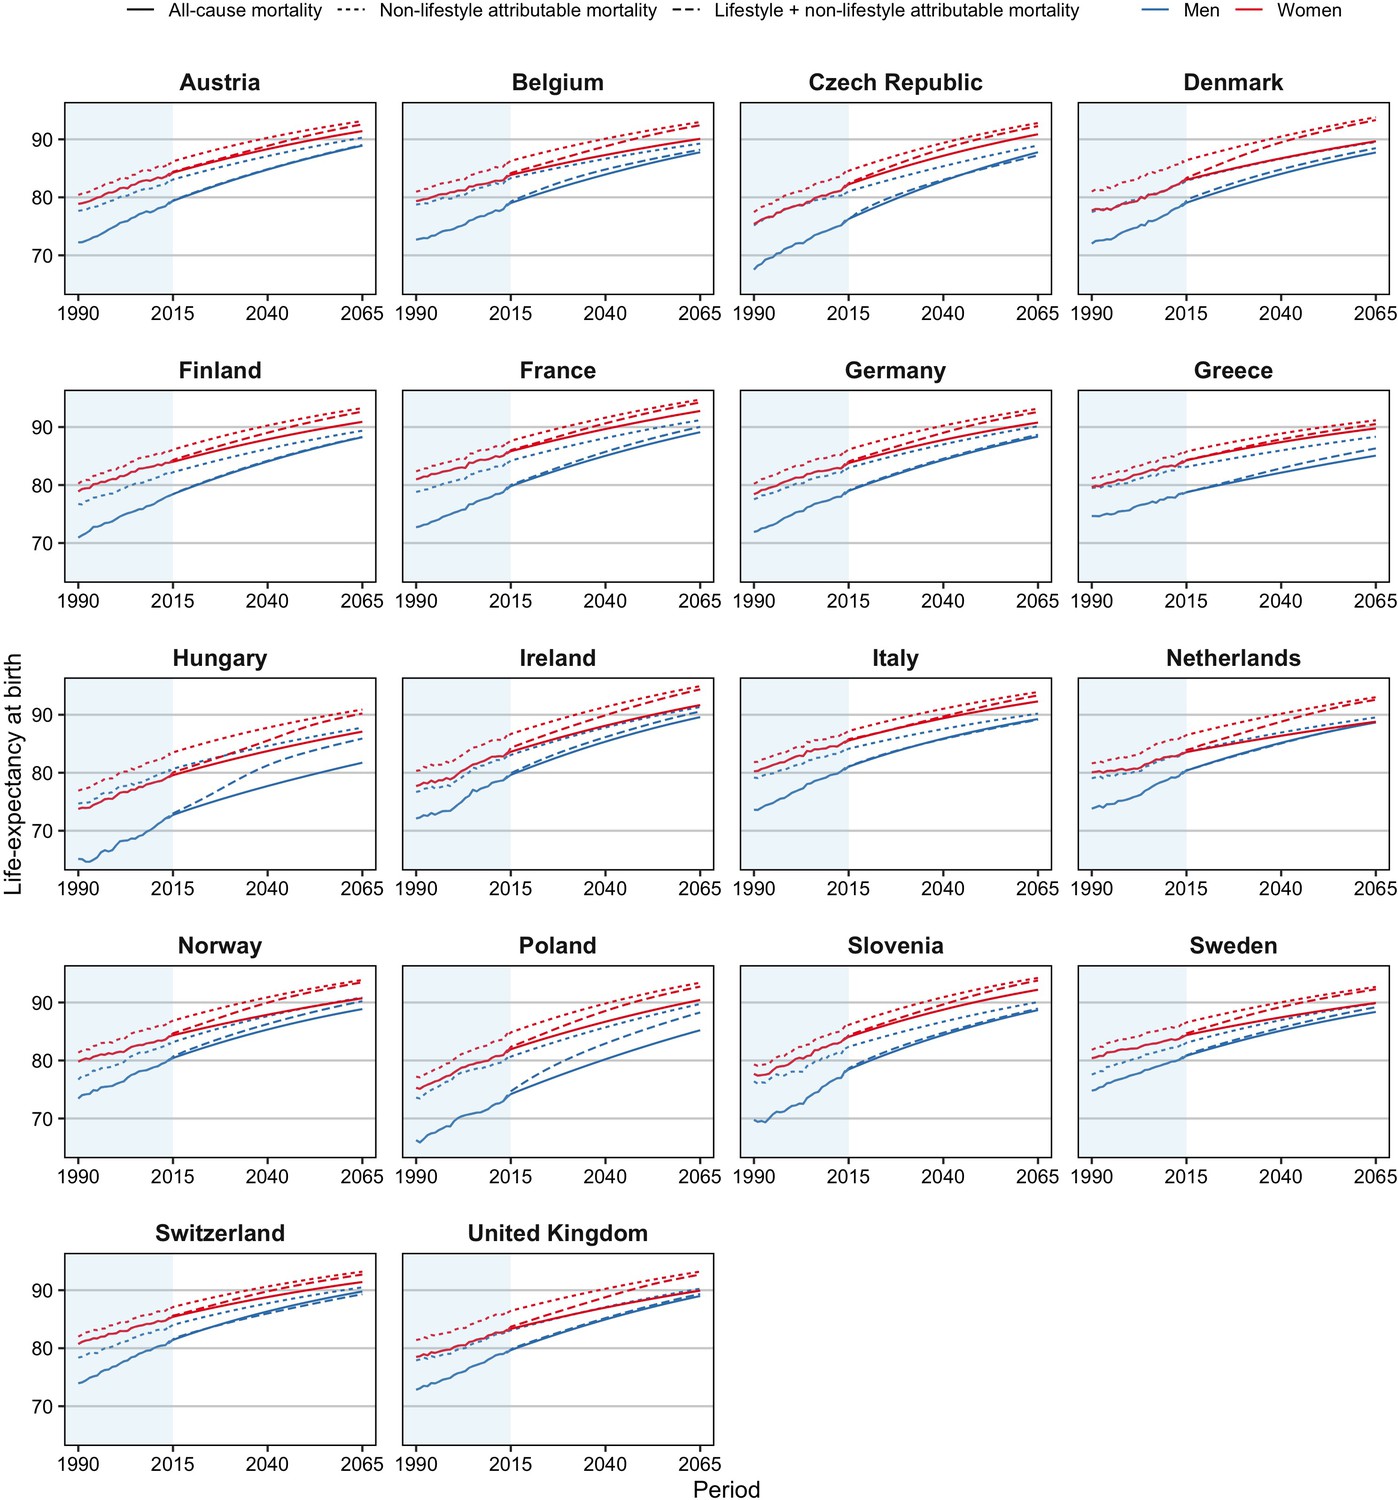
Observed and individually projected life expectancy at birth (e0) for all-cause mortality, non-lifestyle-attributable mortality, and the combined projection of lifestyle- and non-lifestyle-attributable mortality, 18 European countries, by sex, 1990–2065.
-
Figure 3—figure supplement 3—source data 1
Data behind Figure 3—figure supplement 3.
- https://cdn.elifesciences.org/articles/66590/elife-66590-fig3-figsupp3-data1-v2.xlsx
Author response image 1
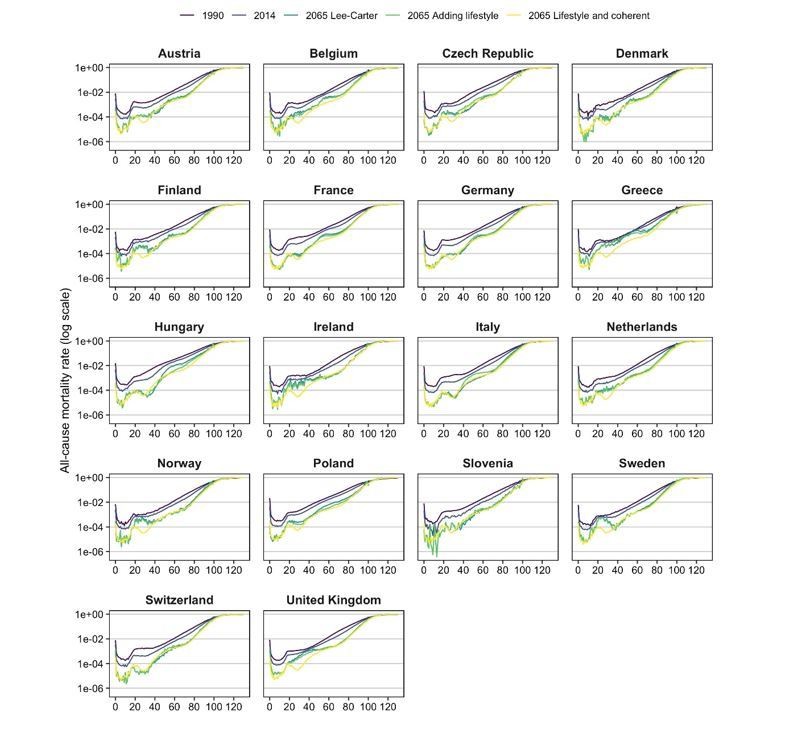
Age-specific mortality pattern in 1990*, 2014*, and for different projections in 2065, by country, ages 0-130, men. * based on the adjusted rates up to 130 (because of zeros in the observed rates).
Author response image 2

Age-specific mortality pattern in 1990*, 2014*, and for different projections in 2065, by country, ages 0-130, women. * based on the adjusted rates up to 130 (because of zeros in the observed rates).
Tables
Table 1
Comparison of observed gains in life expectancy at birth (e0) between 1990 and 2014 with the gains when the effects of smoking, obesity, and alcohol are removed ( = for non-lifestyle-attributable mortality), 18 European countries, by country and sex.
| Country | Gain e0 1990–2014 | |||
|---|---|---|---|---|
| Observed | Non-lifestyle-attributable mortality | |||
| Men | Women | Men | Women | |
| Austria | 6.69 | 4.87 | 5.05 | 5.29 |
| Belgium | 5.88 | 4.18 | 4.22 | 4.90 |
| Czech Republic | 8.19 | 6.33 | 5.50 | 6.62 |
| Denmark | 6.54 | 4.94 | 4.98 | 5.01 |
| Finland | 7.19 | 4.96 | 5.19 | 5.56 |
| France | 6.56 | 4.47 | 4.95 | 4.84 |
| Germany | 6.52 | 4.92 | 4.99 | 5.45 |
| Greece | 3.80 | 4.18 | 3.44 | 4.23 |
| Hungary | 7.12 | 5.47 | 5.61 | 6.16 |
| Ireland | 7.03 | 5.52 | 5.97 | 5.90 |
| Italy | 6.92 | 4.91 | 4.67 | 4.97 |
| Netherlands | 6.05 | 3.20 | 4.20 | 4.50 |
| Norway | 6.58 | 4.29 | 6.10 | 5.21 |
| Poland | 7.41 | 6.13 | 6.56 | 7.04 |
| Slovenia | 8.20 | 6.00 | 5.62 | 6.39 |
| Sweden | 5.54 | 3.66 | 5.09 | 4.35 |
| Switzerland | 6.98 | 4.40 | 5.25 | 4.76 |
| United Kingdom | 6.41 | 4.49 | 4.89 | 4.67 |
| Average | 6.64 | 4.83 | 5.13 | 5.33 |
| Min | 3.80 | 3.20 | 3.44 | 4.23 |
| Max | 8.20 | 6.33 | 6.56 | 7.04 |
| Variance | 0.92 | 0.66 | 0.51 | 0.62 |
| Annual change | 0.28 | 0.20 | 0.21 | 0.22 |
| Forerunners* | 4.81 | 4.81 | 5.00 | 5.00 |
-
*French, Italian, and Spanish women (unweighted average). For Spanish women, the gain in e0 (1990–2014) was 5.05 years for all-cause mortality and 5.20 years for non-lifestyle-attributable mortality.
-
Table 1—source data 1
Data behind Table 1.
- https://cdn.elifesciences.org/articles/66590/elife-66590-table1-data1-v2.xlsx
Table 2
Observed (2014) and projected (2065) life expectancy at birth (e0), by country and sex, according to our projection methodology, which takes into account the impact of smoking, obesity, and alcohol and the mortality experiences of forerunner countries (‘lifestyle and coherent’); the benchmark Lee–Carter extrapolative mortality projection applied to all-cause mortality (‘Lee–Carter’); and when purely accounting for smoking, obesity, and alcohol (‘adding lifestyle’).
| Country | Men | Women | ||||||
|---|---|---|---|---|---|---|---|---|
| e0 2014 | e0 2065 | e0 2014 | e0 2065 | |||||
| Lee–Carter | Adding lifestyle | Lifestyle and coherent | Lee–Carter | Adding lifestyle | Lifestyle and coherent | |||
| Austria | 78.91 | 88.91 | 89.02 | 90.38 | 83.73 | 91.42 | 92.57 | 92.54 |
| Belgium | 78.57 | 87.76 | 88.20 | 90.93 | 83.52 | 90.09 | 92.43 | 92.98 |
| Czechia | 75.72 | 87.77 | 87.23 | 88.86 | 81.73 | 90.87 | 92.28 | 91.37 |
| Denmark | 78.56 | 87.72 | 88.48 | 90.50 | 82.67 | 89.66 | 93.33 | 93.08 |
| Finland | 78.13 | 88.25 | 88.30 | 90.22 | 83.85 | 90.90 | 92.65 | 92.69 |
| France | 79.28 | 89.11 | 90.03 | 91.40 | 85.44 | 92.77 | 94.24 | 94.01 |
| Germany | 78.43 | 88.36 | 88.67 | 90.18 | 83.35 | 90.78 | 92.60 | 92.62 |
| Greece | 78.46 | 85.07 | 86.32 | 90.97 | 83.83 | 89.75 | 90.51 | 92.44 |
| Hungary | 72.26 | 81.74 | 85.89 | 88.64 | 79.24 | 87.09 | 90.21 | 90.96 |
| Ireland | 79.15 | 89.59 | 90.57 | 90.95 | 83.23 | 91.67 | 94.38 | 93.40 |
| Italy | 80.55 | 89.25 | 89.14 | 91.43 | 85.16 | 92.30 | 93.34 | 93.53 |
| Netherlands | 79.87 | 88.67 | 88.73 | 91.11 | 83.29 | 88.80 | 92.59 | 93.18 |
| Norway | 80.03 | 88.86 | 90.23 | 90.87 | 84.09 | 90.72 | 93.48 | 93.35 |
| Poland | 73.66 | 85.21 | 88.28 | 89.37 | 81.41 | 90.44 | 92.74 | 91.88 |
| Slovenia | 77.96 | 88.68 | 88.95 | 89.91 | 83.69 | 92.20 | 93.79 | 92.60 |
| Sweden | 80.35 | 88.37 | 89.18 | 90.64 | 84.05 | 89.92 | 92.27 | 93.01 |
| Switzerland | 80.93 | 89.77 | 89.31 | 90.88 | 85.11 | 91.41 | 92.70 | 93.16 |
| United Kingdom | 79.25 | 88.99 | 89.35 | 91.04 | 82.99 | 89.93 | 92.70 | 93.34 |
| Average | 78.34 | 87.89 | 88.66 | 90.46 | 83.35 | 90.59 | 92.71 | 92.78 |
| Min | 72.26 | 81.74 | 85.89 | 88.64 | 79.24 | 87.09 | 90.21 | 90.96 |
| Max | 80.93 | 89.77 | 90.57 | 91.43 | 85.44 | 92.77 | 94.38 | 94.01 |
| Variance | 4.98 | 3.77 | 1.41 | 0.62 | 2.02 | 1.73 | 1.07 | 0.55 |
-
Table 2—source data 1
Data behind Table 2.
- https://cdn.elifesciences.org/articles/66590/elife-66590-table2-data1-v2.xlsx
Appendix 1—table 1
Test for stationarity of k(t,i) within the coherent Li-Lee mortality projections, for all-cause mortality and non-lifestyle-attributable mortality in which French, Italian, and Spanish women are selected as the forerunner populations, for the 18 European countries, by sex.
| All-cause mortality | Non-lifestyle-attributable mortality | |||
|---|---|---|---|---|
| Men | Women | Men | Women | |
| Austria | 1 | 1 | 1 | 1 |
| Belgium | 1 | 1 | 1 | 1 |
| Czech Republic | 1 | 1 | 1 | 1 |
| Denmark | 1 | 1 | 1 | 1 |
| Finland | 1 | 1 | 1 | 1 |
| France | 0 | 1 | 1 | 1 |
| Germany | 1 | 1 | 1 | 0 |
| Greece | 1 | 1 | 1 | 1 |
| Hungary | 2 | 1 | 1 | 1 |
| Ireland | 1 | 1 | 1 | 1 |
| Italy | 1 | 0 | 1 | 0 |
| Netherlands | 1 | 1 | 1 | 0 |
| Norway | 1 | 1 | 1 | 1 |
| Poland | 1 | 1 | 1 | 1 |
| Slovenia | 2 | 1 | 1 | 1 |
| Sweden | 1 | 1 | 1 | 1 |
| Switzerland | 1 | 1 | 1 | 1 |
| United Kingdom | 1 | 1 | 1 | 1 |
-
0 = stationary time series; i.e., the time series does not exhibit a trend.
1 or 2 = non-stationary time series.
Appendix 1—table 2
Overview of the data used for the projections per lifestyle factor and combined.
| Age | Smoking-attributable mortality fractions (SAMF) | Alcohol-attributable mortality fractions (AAMF) | Obesity-attributable mortality fractions (OAMF)* | Lifestyle-attributable mortality fractions (LAMF)† | ||||
|---|---|---|---|---|---|---|---|---|
| 35–100 M; 40–100 F | 20–100 | 20–100 | 20–100‡ | |||||
| Years by country | ||||||||
| Austria | 1955 | 2014 | 1990 | 2014 | 1975 | 2016 | 1990 | 2014 |
| Belgium | 1954 | 2015 | 1990 | 2015 | 1975 | 2016 | 1990 | 2015 |
| Czech Republic | 1953 | 2016 | 1990 | 2016 | 1975 | 2016 | 1990 | 2016 |
| Denmark | 1951 | 2015 | 1990 | 2016 | 1975 | 2016 | 1990 | 2015 |
| Finland | 1952 | 2015 | 1990 | 2015 | 1975 | 2016 | 1990 | 2015 |
| France | 1950 | 2015 | 1990 | 2015 | 1975 | 2016 | 1990 | 2015 |
| Germany | 1970 | 2015 | 1990 | 2015 | 1975 | 2016 | 1990 | 2015 |
| Greece | 1961 | 2013 | 1990 | 2013 | 1981 | 2016 | 1990 | 2014§ |
| Hungary | 1955 | 2014 | 1990 | 2014 | 1975 | 2016 | 1990 | 2014 |
| Ireland | 1950 | 2014 | 1990 | 2014 | 1975 | 2016 | 1990 | 2014 |
| Italy | 1951 | 2014 | 1990 | 2014 | 1975 | 2016 | 1990 | 2014 |
| Netherlands | 1950 | 2016 | 1990 | 2016 | 1975 | 2016 | 1990 | 2016 |
| Norway | 1951 | 2014 | 1990 | 2014 | 1975 | 2016 | 1990 | 2014 |
| Poland | 1959 | 2014 | 1990 | 2014 | 1975 | 2016 | 1990 | 2014 |
| Slovenia | 1985 | 2014 | 1990 | 2014 | 1983 | 2016 | 1990 | 2014 |
| Sweden | 1951 | 2016 | 1990 | 2016 | 1975 | 2016 | 1990 | 2016 |
| Switzerland | 1951 | 2015 | 1990 | 2016 | 1975 | 2016 | 1990 | 2015 |
| United Kingdom | 1950 | 2015 | 1990 | 2016 | 1975 | 2016 | 1990 | 2015 |
-
*We projected obesity prevalence data (1975–2016) into the future. To obtain the OAMF, we only needed the RRs of dying from obesity. However, to obtain age-standardised fractions, we also needed all-cause mortality data.
†See projection step three for details on how we dealt with projections not being available for all the three lifestyle factors for the years 2015–2016.
-
‡By setting the SAMF for ages 20–34 (M) and ages 20–39 (F) to zero.
§We implemented the median projected AAMF and SAMF for Greece as the observed AAMF and SAMF in 2014 so that we could calculate the lifestyle-attributable mortality up until 2014, and so that we could apply it to the all-cause mortality rates to obtain non-lifestyle-attributable mortality rates. For this purpose, we used all-cause mortality from HMD from 26 February 2020.
Author response table 1
Effect of the inclusion of alternative reference populations within coherent mortality projections* on the coherently projected e0 values in 2065 for all-cause mortality and for non-lifestyle-attributable mortality.
| All-cause mortality | Non-lifestyle attributable mortality | |||||
|---|---|---|---|---|---|---|
| Country | Coh. Li-Lee: sensivity I | Coh. Li-Lee: sensivity II | Coh. Li-Lee: sensivity III | Coh. Li-Lee: sensivity I | Coh. Li-Lee: sensivity II | Coh. Li-Lee: sensivity III |
| Men | ||||||
| Austria | -0.20 | -2.19 | -0.76 | -0.13 | -0.77 | -0.94 |
| Belgium | -0.17 | -2.08 | -0.61 | -0.16 | -0.81 | -0.90 |
| Czech Republic | -0.24 | -2.33 | -0.71 | -0.23 | -0.76 | -1.09 |
| Denmark | -0.17 | -2.11 | -0.60 | -0.14 | -0.71 | -0.91 |
| Finland | -0.26 | -2.13 | -0.83 | -0.22 | -0.73 | -1.00 |
| France | -0.21 | -2.12 | -0.75 | -0.09 | -0.78 | -0.78 |
| Germany | -0.23 | -2.09 | -0.85 | -0.22 | -0.70 | -0.95 |
| Greece | -0.27 | -2.05 | -0.80 | -0.31 | -0.82 | -1.01 |
| Hungary | -0.19 | -2.11 | -0.65 | -0.24 | -0.83 | -1.14 |
| Ireland | -0.17 | -2.05 | -0.80 | -0.13 | -0.82 | -1.06 |
| Italy | -0.28 | -1.86 | -0.74 | -0.18 | -0.73 | -0.92 |
| Netherlands | -0.16 | -1.94 | -0.67 | -0.17 | -0.76 | -0.84 |
| Norway | -0.35 | -1.83 | -0.77 | -0.31 | -0.82 | -1.03 |
| Poland | -0.22 | -2.14 | -0.67 | -0.28 | -0.79 | -1.01 |
| Slovenia | -0.22 | -2.03 | -0.68 | -0.15 | -0.67 | -1.00 |
| Sweden | -0.27 | -1.79 | -0.71 | -0.29 | -0.64 | -0.89 |
| Switzerland | -0.23 | -1.82 | -0.67 | -0.19 | -0.69 | -0.89 |
| United Kingdom | -0.26 | -2.02 | -0.70 | -0.23 | -0.80 | -0.91 |
| Average | -0.23 | -2.04 | -0.72 | -0.21 | -0.76 | -0.96 |
| Women | ||||||
| Austria | -0.19 | -1.61 | -0.56 | -0.16 | -0.73 | -0.81 |
| Belgium | -0.21 | -1.67 | -0.72 | -0.09 | -0.76 | -0.83 |
| Czech Republic | -0.24 | -1.70 | -0.64 | -0.10 | -0.68 | -0.87 |
| Denmark | -0.19 | -1.77 | -0.66 | -0.08 | -0.53 | -0.58 |
| Finland | -0.22 | -1.69 | -0.69 | -0.14 | -0.73 | -0.86 |
| France | -0.23 | -1.37 | -0.54 | -0.12 | -0.71 | -0.77 |
| Germany | -0.21 | -1.55 | -0.66 | -0.16 | -0.66 | -0.82 |
| Greece | -0.27 | -1.52 | -0.72 | -0.13 | -0.69 | -0.85 |
| Hungary | -0.18 | -1.79 | -0.65 | -0.16 | -0.79 | -1.03 |
| Ireland | -0.28 | -1.83 | -0.77 | -0.18 | -0.81 | -0.80 |
| Italy | -0.25 | -1.59 | -0.65 | -0.16 | -0.70 | -0.85 |
| Netherlands | -0.25 | -1.57 | -0.68 | -0.15 | -0.66 | -0.75 |
| Norway | -0.24 | -1.67 | -0.66 | -0.09 | -0.66 | -0.85 |
| Poland | -0.18 | -1.85 | -0.69 | -0.19 | -0.71 | -0.90 |
| Slovenia | -0.20 | -1.62 | -0.68 | -0.14 | -0.60 | -0.85 |
| Sweden | -0.23 | -1.56 | -0.65 | -0.14 | -0.59 | -0.74 |
| Switzerland | -0.19 | -1.45 | -0.59 | -0.16 | -0.66 | -0.73 |
| United Kingdom | -0.23 | -1.65 | -0.68 | -0.18 | -0.56 | -0.70 |
| Average | -0.22 | -1.64 | -0.66 | -0.14 | -0.68 | -0.81 |
-
*original = using women in France, Spain and Italy as the reference population.
sensitivity 1 = using only women in France and Italy as the reference population.
-
sensitivity 2 = using women in Sweden, Norway and Switzerland as the reference population.
sensitivity 3 = using the average across the 18 countries included in the analysis as the reference population.
-
Note: the sensitivity analyses were all based on 1000 simulations, and we assumed non-stationarity for the remaining population-specific time trends k(t,i).
Author response table 2
Observed (2014) and projected (2065) lifespan variation from age zero onwards, by country and sex, according to our projection methodology, which takes into account the impact of smoking, obesity, and alcohol and the mortality experiences of forerunner countries (“lifestyle and coherent”); the benchmark Lee-Carter extrapolative mortality projection applied to all-cause mortality (“Lee-Carter”); and when purely accounting for smoking, obesity, and alcohol (“adding lifestyle”).
| MEN | WOMEN | |||||||
|---|---|---|---|---|---|---|---|---|
| Projected SD* 2065 | Projected SD* 2065 | |||||||
| Country | SD* 2014 | Lee-Carter | Adding lifestyle | Lifestyle and coherent | SD* 2014 | Lee-Carter | Adding lifestyle | Lifestyle and coherent |
| Austria | 14.33 | 10.88 | 11.11 | 10.31 | 13.05 | 9.69 | 8.73 | 8.91 |
| Belgium | 14.70 | 11.57 | 11.27 | 9.78 | 13.36 | 11.09 | 9.53 | 9.18 |
| Czechia | 14.36 | 10.96 | 12.02 | 10.69 | 12.61 | 9.23 | 8.53 | 9.22 |
| Denmark | 14.25 | 10.51 | 10.37 | 10.09 | 13.26 | 10.15 | 10.10 | 9.27 |
| Finland | 14.69 | 11.61 | 11.18 | 10.35 | 12.66 | 10.90 | 9.65 | 9.03 |
| France | 15.32 | 11.75 | 11.35 | 10.04 | 13.59 | 11.11 | 9.92 | 9.27 |
| Germany | 14.25 | 10.66 | 11.31 | 10.39 | 12.93 | 9.61 | 8.85 | 9.23 |
| Greece | 15.10 | 14.31 | 14.26 | 10.56 | 12.67 | 10.20 | 9.98 | 9.25 |
| Hungary | 15.11 | 12.77 | 11.23 | 11.21 | 13.90 | 11.38 | 9.33 | 10.01 |
| Ireland | 14.52 | 11.43 | 10.84 | 9.78 | 13.18 | 10.59 | 9.98 | 9.25 |
| Italy | 13.53 | 9.11 | 10.95 | 9.76 | 12.41 | 9.06 | 9.01 | 8.94 |
| Netherlands | 13.62 | 9.82 | 10.16 | 9.60 | 13.19 | 11.12 | 9.68 | 8.93 |
| Norway | 13.74 | 10.17 | 9.93 | 9.68 | 12.50 | 10.22 | 9.39 | 8.79 |
| Poland | 15.93 | 13.49 | 12.52 | 11.50 | 13.92 | 11.08 | 9.65 | 9.86 |
| Slovenia | 13.89 | 10.05 | 10.93 | 10.33 | 12.28 | 9.00 | 8.39 | 8.96 |
| Sweden | 13.60 | 10.31 | 10.13 | 9.47 | 12.49 | 9.88 | 9.15 | 8.69 |
| Switzerland | 13.84 | 9.45 | 10.29 | 9.81 | 12.59 | 9.37 | 8.79 | 8.66 |
| United Kingdom | 14.64 | 12.24 | 11.87 | 10.11 | 13.62 | 11.06 | 10.58 | 9.37 |
| Average | 14.41 | 11.17 | 11.21 | 10.19 | 13.01 | 10.26 | 9.40 | 9.16 |
| Min | 13.53 | 9.11 | 9.93 | 9.47 | 12.28 | 9.00 | 8.39 | 8.66 |
| Max | 15.93 | 14.31 | 14.26 | 11.50 | 13.92 | 11.38 | 10.58 | 10.01 |
| Variance | 0.42 | 1.81 | 0.99 | 0.28 | 0.25 | 0.61 | 0.34 | 0.12 |
-
* SD = Standard deviation of the age at death distribution (age 0-100).
Additional files
-
Supplementary file 1
(A) Sex differences in observed (2014) and projected (2065) life expectancy at birth (e0), by country and sex, according to our projection methodology, which takes into account the impact of smoking, obesity, and alcohol and the mortality experiences of forerunner countries (‘lifestyle and coherent’); the benchmark Lee–Carter extrapolative mortality projection applied to all-cause mortality (‘Lee–Carter’); and when purely accounting for smoking, obesity, and alcohol (‘adding lifestyle’). (B) Observed (2014) and projected (2065) life expectancy at birth (e0) according to different methodologies, by country and sex. (C) Comparison of projected life expectancy in 2065 between our final projection (‘we’) and the most recent projections by Eurostat and the United Nations (UN), by country and sex.
- https://cdn.elifesciences.org/articles/66590/elife-66590-supp1-v2.docx
-
Transparent reporting form
- https://cdn.elifesciences.org/articles/66590/elife-66590-transrepform-v2.docx
Download links
A two-part list of links to download the article, or parts of the article, in various formats.
Downloads (link to download the article as PDF)
Open citations (links to open the citations from this article in various online reference manager services)
Cite this article (links to download the citations from this article in formats compatible with various reference manager tools)
Future life expectancy in Europe taking into account the impact of smoking, obesity, and alcohol
eLife 10:e66590.
https://doi.org/10.7554/eLife.66590


