Respiratory and intestinal epithelial cells exhibit differential susceptibility and innate immune responses to contemporary EV-D68 isolates
- Department of Pediatrics, Division of Infectious Diseases, UPMC Children’s Hospital of Pittsburgh, United States
- Center for Microbial Pathogenesis, UPMC Children’s Hospital of Pittsburgh, United States
- Division of Viral Diseases, Centers for Disease Control and Prevention, United States
- Pulmonary, Allergy and Critical Care Medicine, University of Pittsburgh School of Medicine, United States
Figures
Figure 1
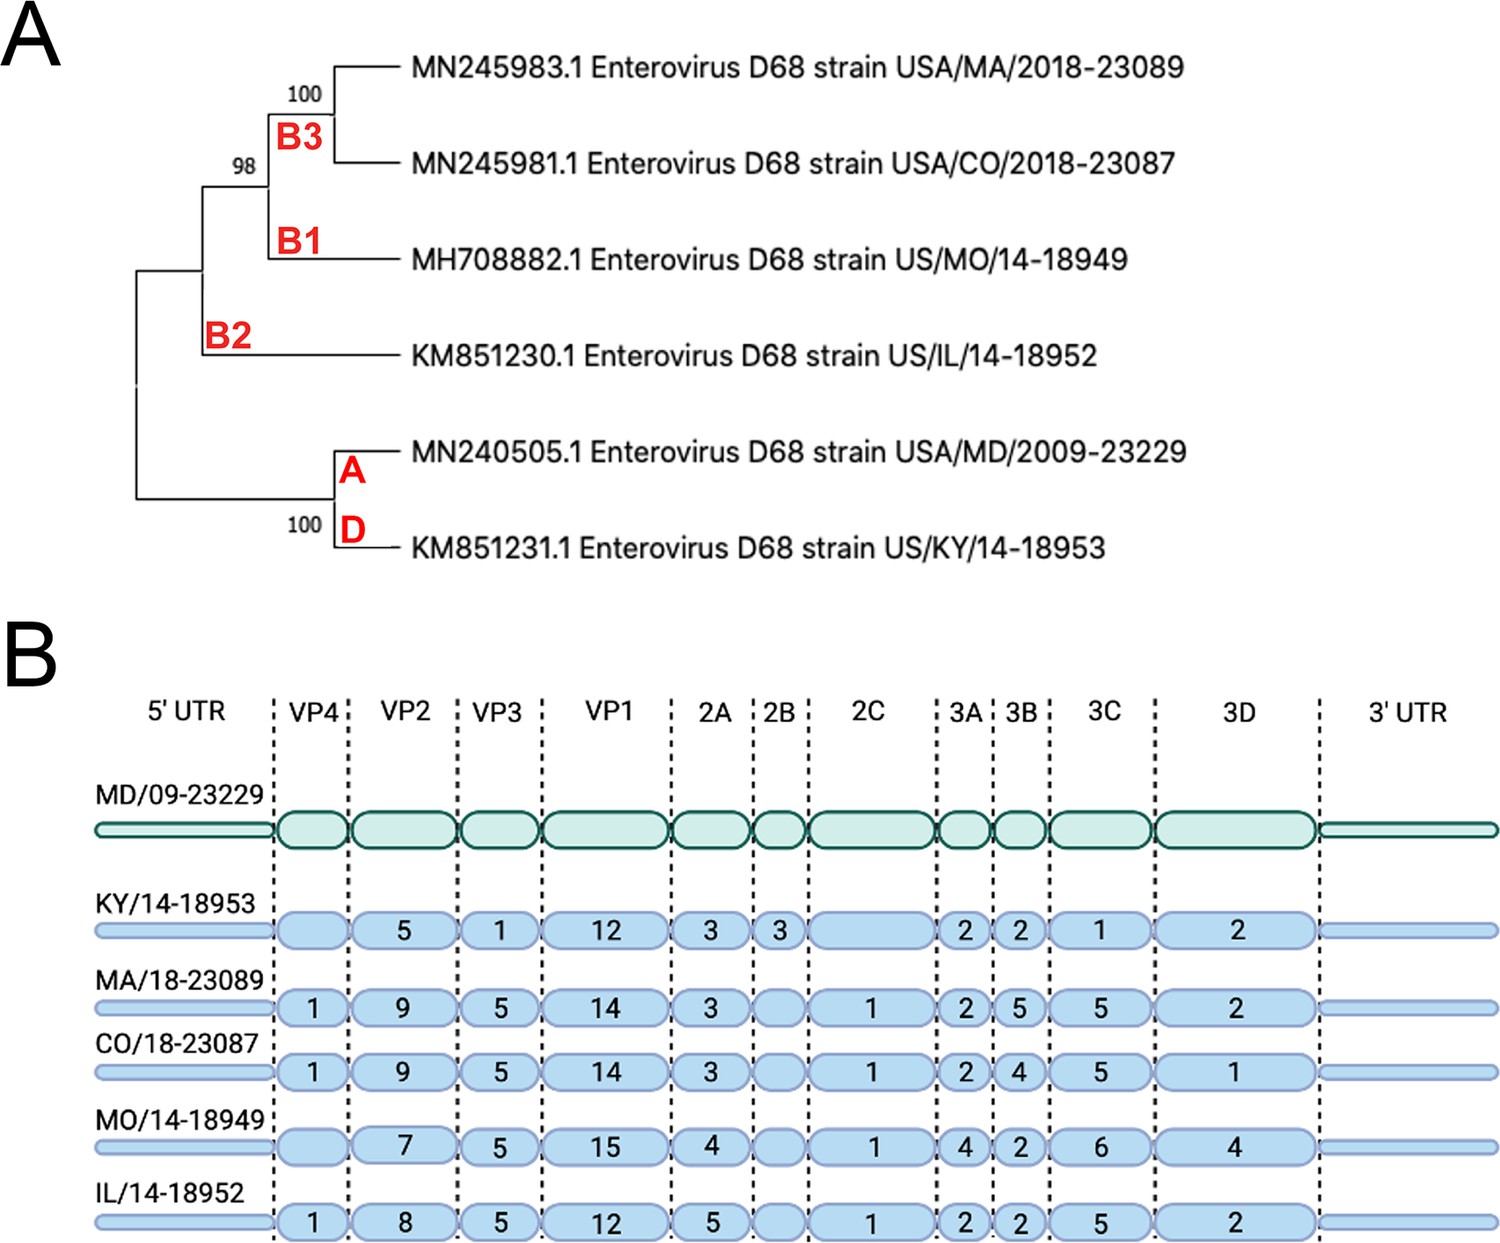
Evolutionary relationship of EV-D68 isolates.
(A) Phylogenetic tree of EV-D68 isolates used in this study. USA/MD/2009–23229 in clade A represents the pre-AFM isolate, while the isolates from clades B1, B2, B3, and D were circulating in peak AFM years. Optimal tree is shown and drawn to scale, with branch lengths in the same units (base substitutions per site) as the evolutionary distances used to construct the tree. Percentage next to the branches is replicate trees (1000 replicates) in which associated taxa clustered together via bootstrap test. Clade denoted in red. (B) Polyprotein diagram of EV-D68, with MD/09–23229 reference isolate represented on top in green. Isolates associated with AFM years are listed below in blue. Numbers within the protein schematic represent the number of amino acid mutations within that protein as compared to reference isolate.
Figure 2
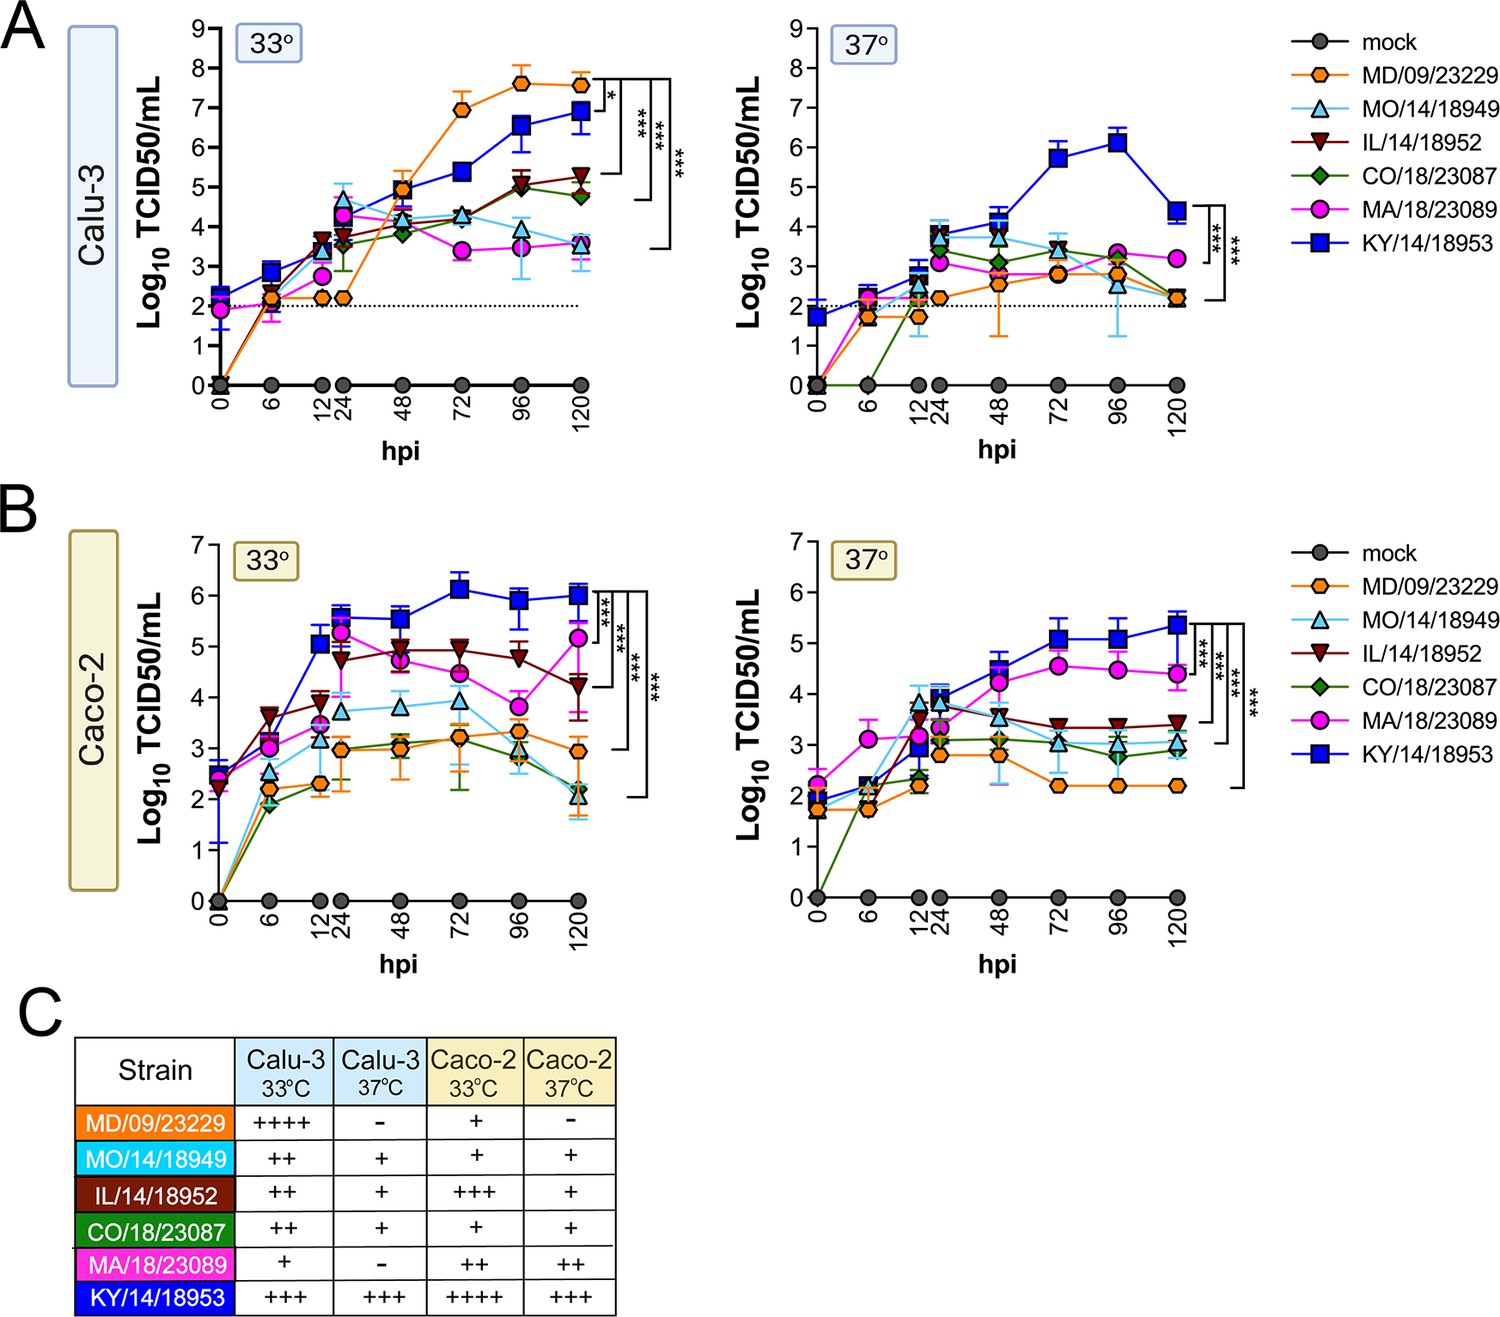
EV-D68 replication in lung and intestinal cell lines varies with strain and temperature.
Calu-3 cells (A) or Caco-2 cells (B) were infected with the EV-D68 strains MD/09/23229 (orange), MO/14/18949 (cyan), IL/14/18952 (burgundy), CO/18/23087 (green), MA/18/23089 (pink), or KY/14/18953 (blue) at an MOI of 5 and incubated at 33°C or 37°C. The supernatant was sampled at the indicated hours post-infection (hpi) and titrated by TCID50. Data are shown as mean ± standard deviation from three replicates. Dotted line denotes limit of assay detection. (C) Summary table denotes titers at 72 hpi, + corresponds to 103, ++ 104, +++ 105, and ++++ 106. Significance was determined by a two-way ANOVA with multiple comparisons. *p<0.05, **p<0.005, ***p<0.0005, ****p<0.0001 compared to the KY/14/18953, which exhibited the highest replication levels.
Figure 3
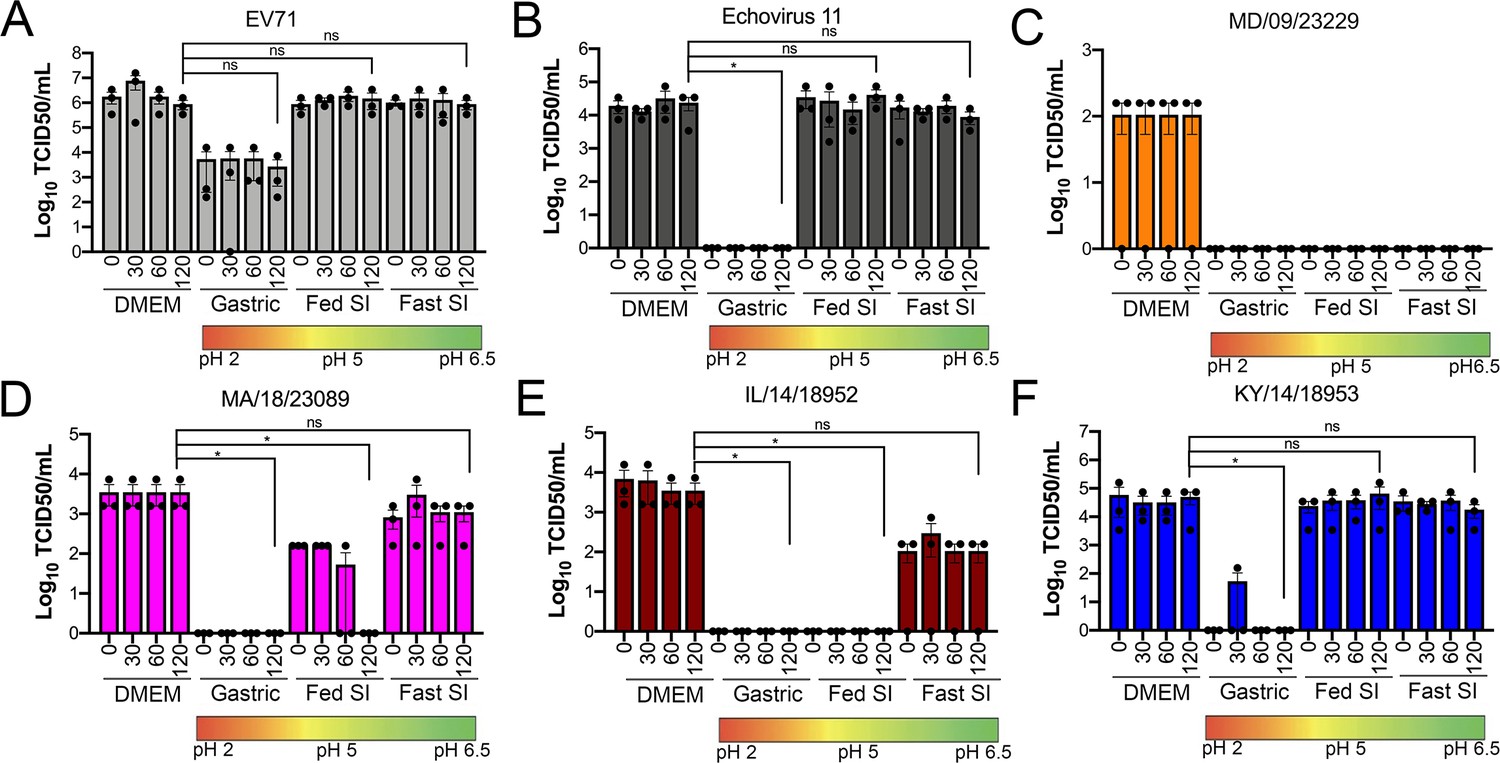
Select contemporary EV-D68 strains exhibit increased acid tolerance.
(A) Enterovirus 71 (EV71), (B) echovirus 11, or (C–F) the indicated EV-D68 isolates (106 PFU/ml) were incubated with control medium (DMEM), pH 2 FaSSGF (Gastric), pH 5 FeSSIF (Fed SI), or pH 6.5 FaSSIF (Fast SI) solution and incubated at 37°C for the indicated times. An aliquot of the virus/fluid mixture was collected, neutralized with sodium hydroxide, and then evaluated for infectivity via TCID50 assays. Titers are shown as mean ± standard deviation from three independent replicates. Significance was assessed at 120 min post-incubation using a one-way ANOVA compared to DMEM-incubated controls, *p<0.05, ns, not significant.
Figure 4
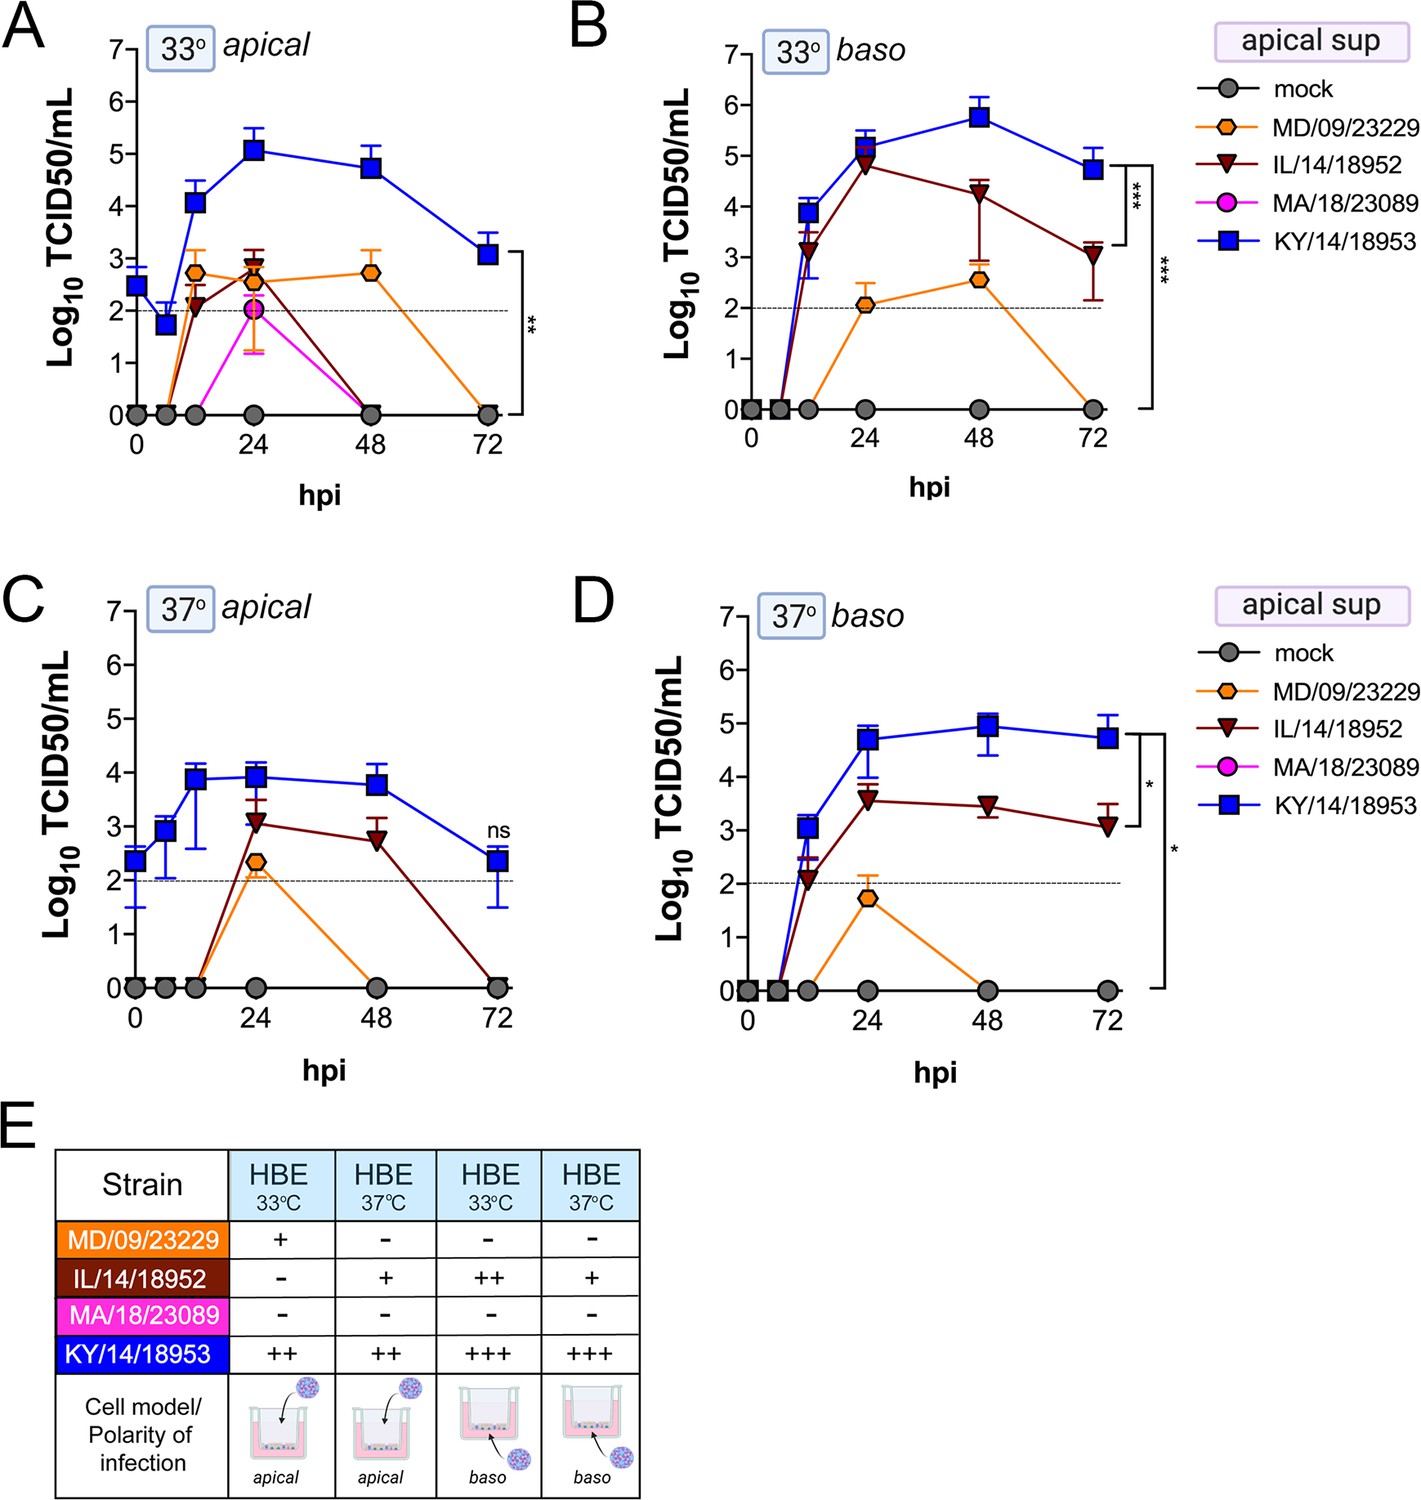
Comparison of EV-D68 strain-specific growth characteristics in apical supernatants of primary human airway epithelial cells.
Primary human bronchial epithelial (HBE) cells grown at an air–liquid interface were infected with 106 PFU of the indicated EV-D68 strains: MD/09/23229 (orange), IL/14/18952 (burgundy), MA/18/23089 (pink), or KY/14/18953 (blue) and incubated at 33°C (A, B) or 37°C (C, D) for the indicated hours post-infection (hpi). HBE were infected from either the apical (A, C) or basolateral (B, D) surfaces. Supernatants were sampled at the indicated hpi from the apical compartment and titers determined by TCID50 assays. Titers are shown as mean ± standard deviation from three independent replicates. Dotted line denotes limit of assay detection. (E) Summary table denotes titer at 48 hpi as collected from the apical compartment, - indicates no detectable replication, + corresponds to 103, ++ 104, +++ 105, and ++++ 106. Significance determined by two-way ANOVA. *p<0.05, **p<0.005, ***p<0.0005, compared to the KY/14/18953, which exhibited the highest replication levels.
Figure 5
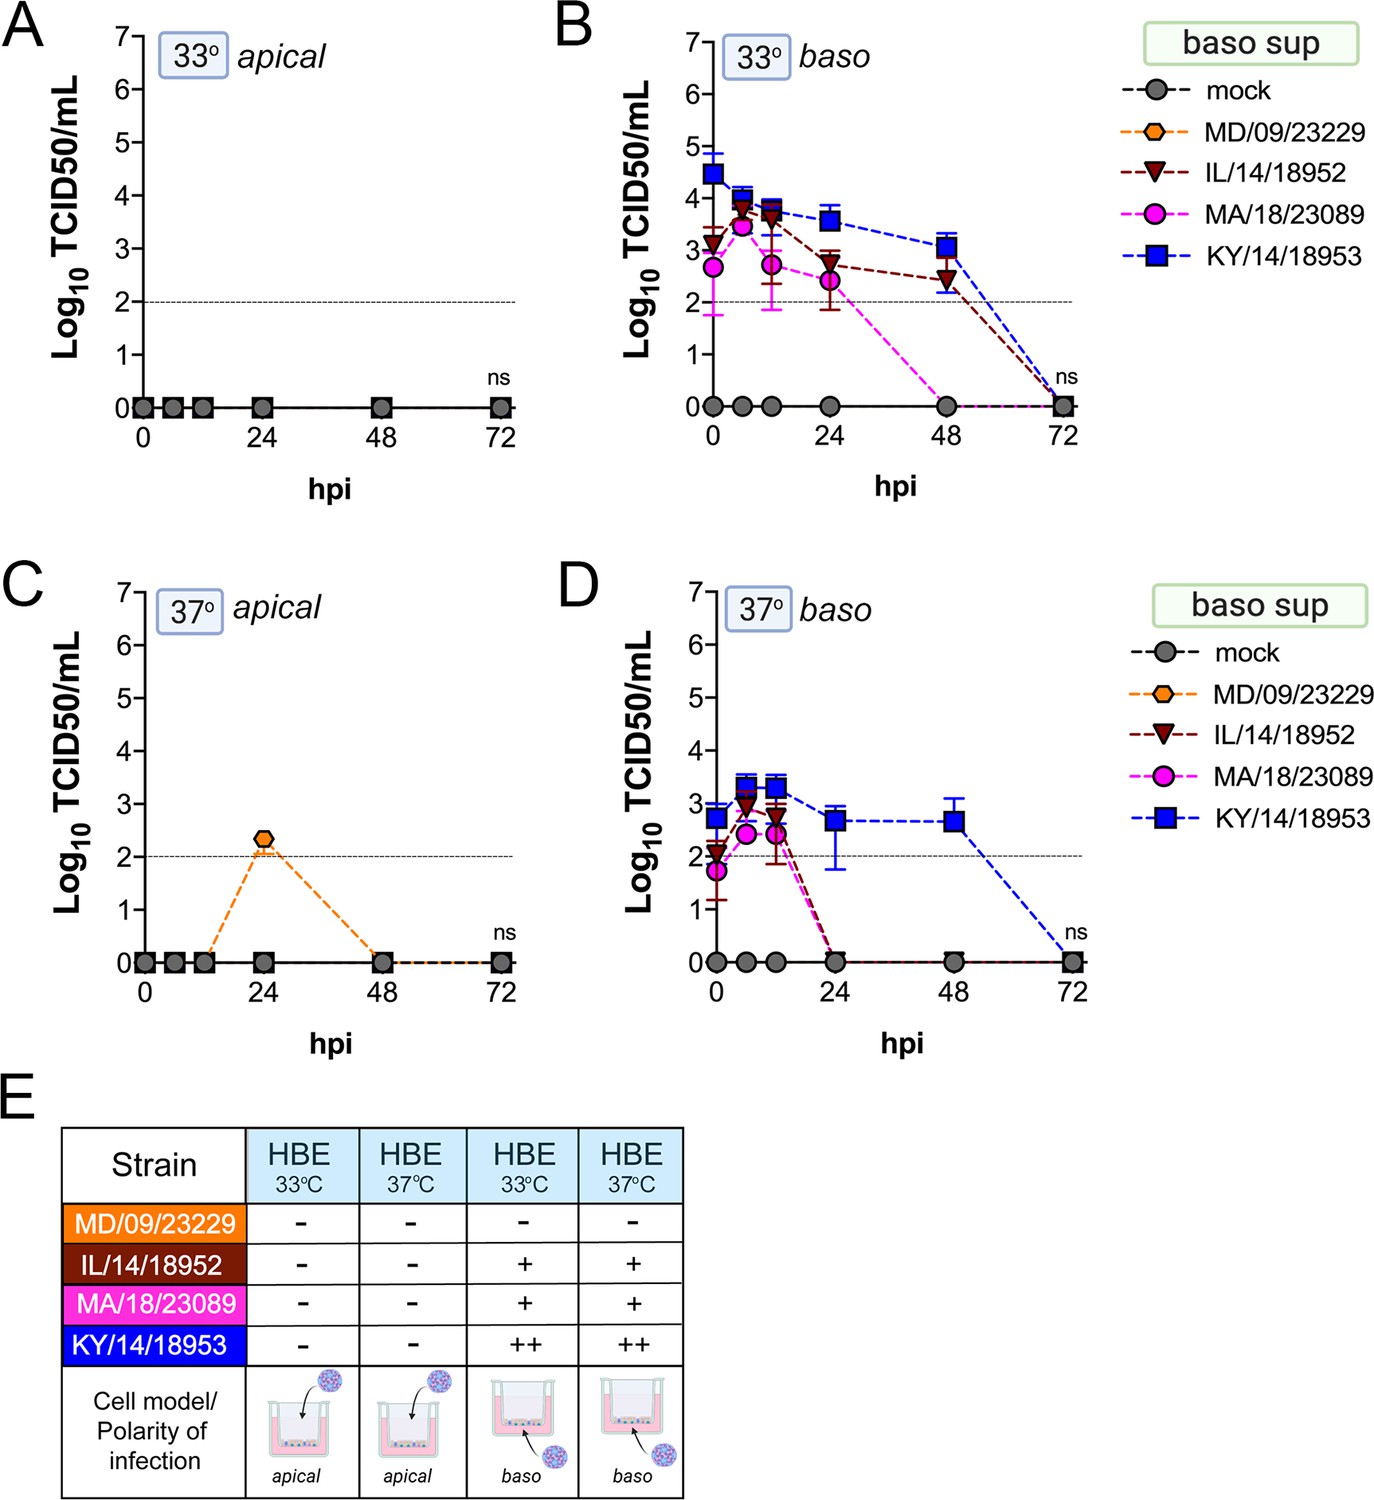
Comparison of EV-D68 strain-specific growth characteristics in basolateral supernatants of primary human airway epithelial cells.
Primary human bronchial epithelial (HBE) cells grown at an air-liquid interface were infected with 106 PFU of the indicated EV-D68 strains: MD/09/23229 (orange), IL/14/18952 (burgundy), MA/18/23089 (pink), or KY/14/18953 (blue) and incubated at 33°C (A, B) or 37°C (C, D) for the indicated hours post-infection (hpi). HBE were infected from either the apical (A, C) or basolateral (B, D) surfaces. Supernatants were sampled at the indicated hpi from the basolateral compartment and titers determined by TCID50 assays. Titers are shown as mean ± standard deviation from three independent replicates. Dotted line denotes limit of assay detection. (E) Summary table denotes titer at 48 hpi as collected from the basolateral compartment, − indicates no detectable replication, + corresponds to 103, ++ 104, +++ 105, and ++++ 106. Significance determined by two-way ANOVA compared to the KY/14/18953, which exhibited the highest replication levels, ns not significant.
Figure 6
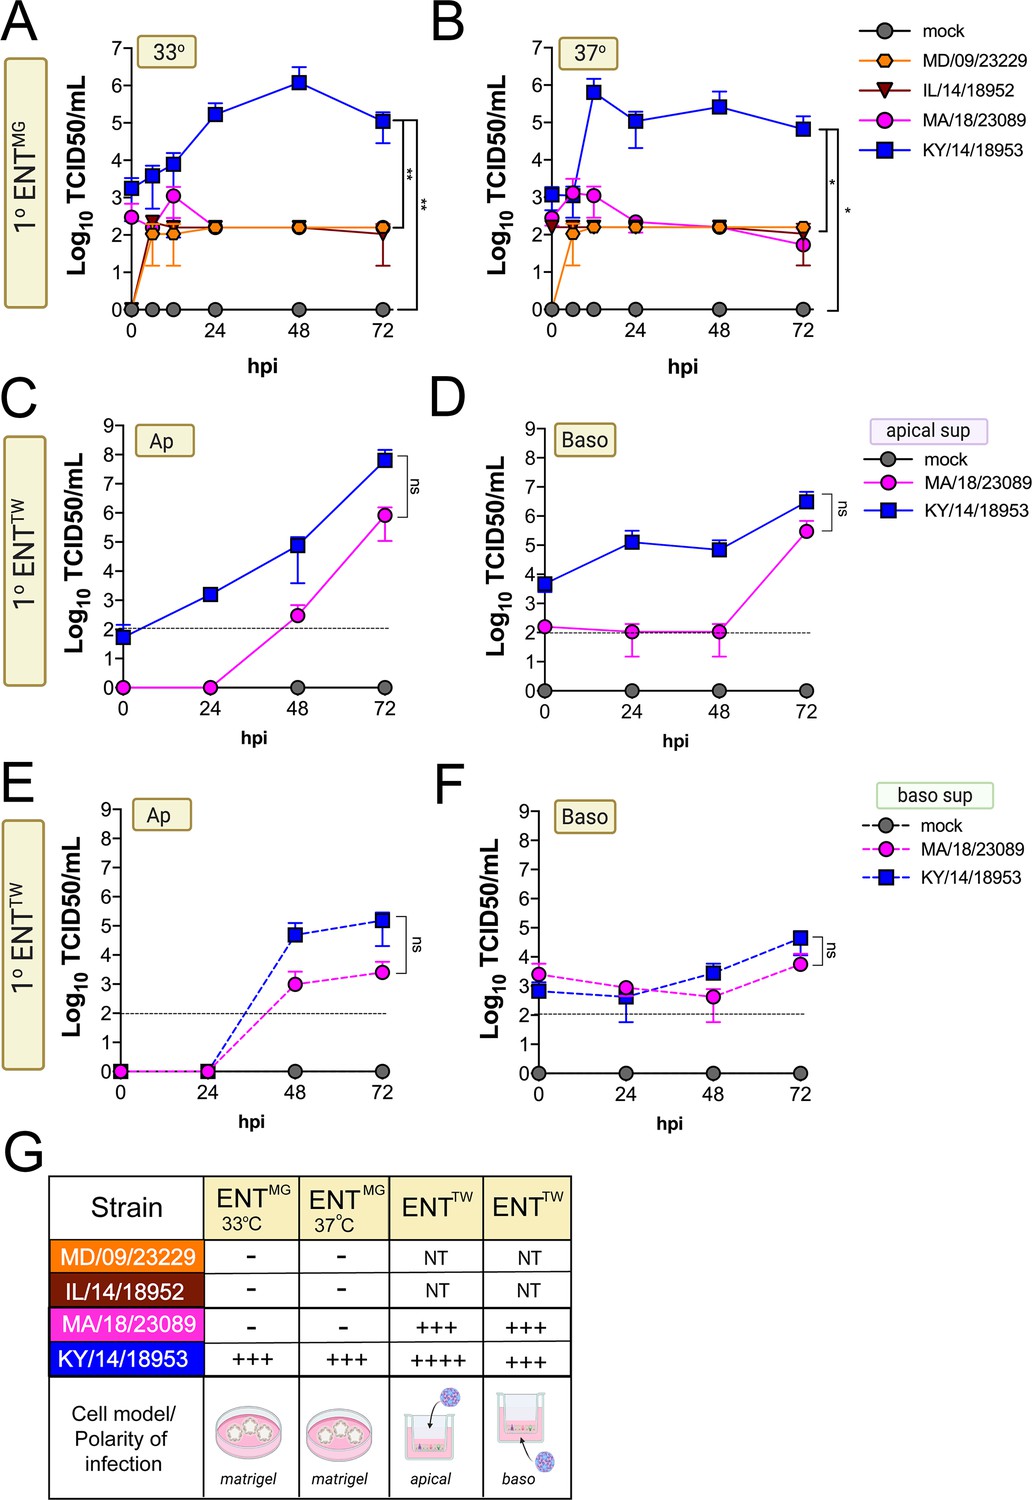
Comparison of EV-D68 strain-specific growth characteristics in primary human enteroids.
Primary enteroids grown on Matrigel (A, B) or transwells (C–F) were infected with 106 PFU of the indicated EV-D68 strains: MD/09/23229 (orange), IL/14/18952 (burgundy), MA/18/23089 (pink), or KY/14/18953 (blue) and incubated at 33°C (A) or 37°C (B–F) for the indicated hours post-infection (hpi). For intestinal cells grown on transwells, cells were infected from either the apical (C, E) or basolateral (D, F) surfaces. Supernatants were sampled at the indicated hpi from both apical (C, D) or basolateral (E, F) compartments and titers determined by TCID50 assays. Titers are shown as mean ± standard deviation from three independent replicates. Dotted line denotes limit of assay detection. (G), Summary table denotes titer at 72 hpi, + corresponds to 103, ++ 104, +++ 105, and ++++ 106, NT not tested. Significance determined by one-way ANOVA. *p<0.05, **p<0.005, ns, not significant.
Figure 7
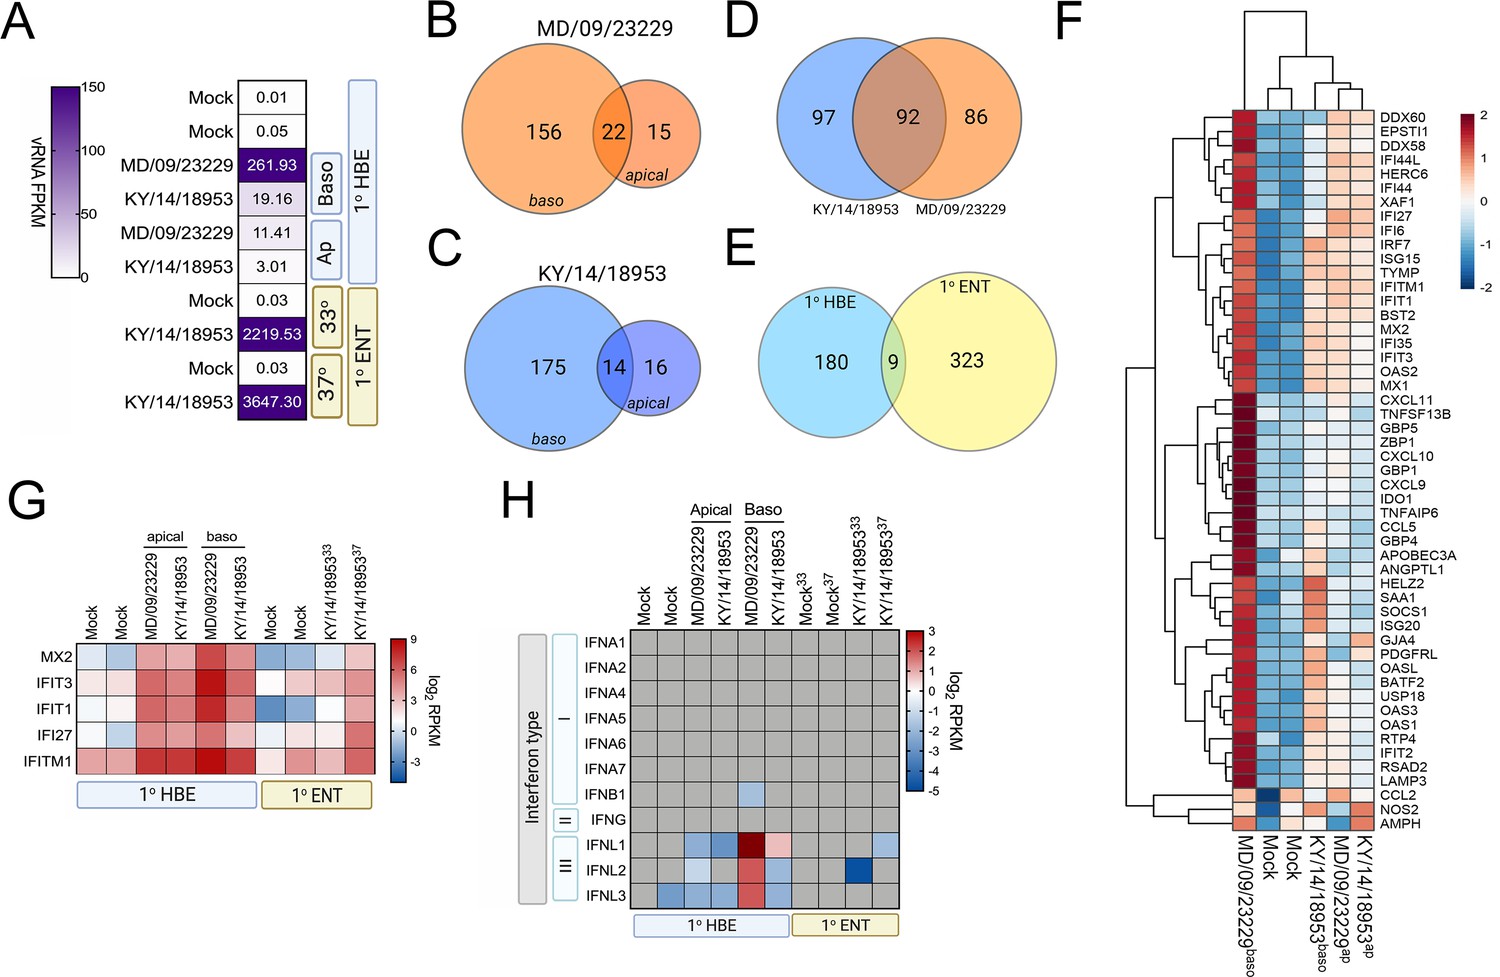
EV-D68 infection of primary human airway cells induces robust antiviral signaling.
Whole-genome RNAseq-based transcriptional profiling from total RNA isolated from primary human bronchial epithelial (HBE) cells grown at an air–liquid interface or primary human enteroids infected with EV-D68 isolates MD/09/23229 and KY/14/18953 was performed in HBE infected from the apical or basolateral domains of in human enteroids infected at 33°C or 37°C. (A) Heatmap of vRNA FPKM (fragments per kilobase per million reads mapped) values for apical and basolateral infection of HBE with the indicated isolate and of enteroid infection at 33°C and 37°C with KY/14/18953. Key is at right. Purple indicates high viral reads, and white indicates low viral reads. (B–E)Venn diagrams denoting the overlap in differentially regulated transcripts in HBE infected from the apical or basolateral domains with MD/09/23229 (B) or KY/14/18953 (C) shared between both isolates following basolateral infections (D) and between HBE and enteroids infected with KY/14/18953 (E). (F) Heatmap of select interferon-stimulated genes (ISGs) in primary HBE infected with the indicated isolates of EV-D68 from the apical of basolateral domains or in mock-infected controls. Scale at right. Red indicates higher expression and blue indicates lower expression. (G) Heatmap of transcripts upregulated in infected HBE and enteroids by both strains based on log2 RPKM values. Key is at right. Red indicates higher RPKM values, blue represents low RPKM values, and gray represents no reads. (H) Heatmap of transcripts (based on log2 RPKM) associated with type I, II, or III interferons (IFNs) in HBE cells infected apically and basolaterally at 33°C with the indicated strains or in enteroids infected with KY/14/18953 at 33°C or 37°C. Scale at right, red indicates higher RPKM values, blue represents low RPKM values, and gray represents no reads.
Figure 8

EV-D68 infection of primary human airway cells induces a preferential type III IFN response.
(A) Luminex-based multianalyte profiling of 37 cytokines and chemokines in primary human bronchial (HBE) cells or enteroids (ENT) infected with 106 PFU of the indicated EV-D68 strains MD/09/23229, IL/14/18952, MA/18/23089, or KY/14/18953 from the apical or basolateral surfaces and incubated at 33°C (HBE) or 37°C (ENT). Supernatants were collected from the apical compartment at 24 and 48 hr post-infection (hpi). Shown is a heatmap based on cytokines induced relative to mock-infected controls (key at right), with blue denoting significantly increased cytokines in comparison to uninfected. Gray denotes little to no change (scale at top right). Data are based on three independent experiments. Levels of IFN-β (B, C), IFN-λ1 (D, E), or IFN-λ2 (F, G) infected from the apical (B, D, F) or basolateral (C, E, G) are shown. Symbols represent individual biological replicates from unique donor cells. Statistical significance was determined using a Kruskal–Wallis test, *p<0.05, **p<0.01.
Figure 9

IFN induction in response to EV-D68 infection is independent of temperature.
(A) Luminex-based multianalyte profiling of 37 cytokines and chemokines in primary human bronchial (HBE) cells infected with 106 PFU of EV-D68 strains MD/09/23229 or KY/14/18953 at 33°C or 37°C. Supernatant was collected from the apical compartment at 24 and 48 hr post-infection (hpi). Shown is a heatmap based on cytokines induced relative to mock-infected controls (key at right), with blue denoting significantly increased cytokines in comparison to uninfected. Gray denotes little to no change (scale at top right). Data are based on three independent experiments. Levels of IFN-β (B), IFN-λ1 (C), or IFN-λ2 (D) from HBE infected at 33°C or 37°C are shown. Symbols represent individual biological replicates from unique donor cells. (E, F) Levels of IFN- λ1 as determined by Luminex-based assays in Calu-3 (E) or Caco-2 (F) cells infected with MD/09/23229 or KY/14/18953 at 33°C or 37°C. Symbols represent individual biological replicates. Statistical significance was determined using a Student’s t-test, not significant (ns).
Figure 10
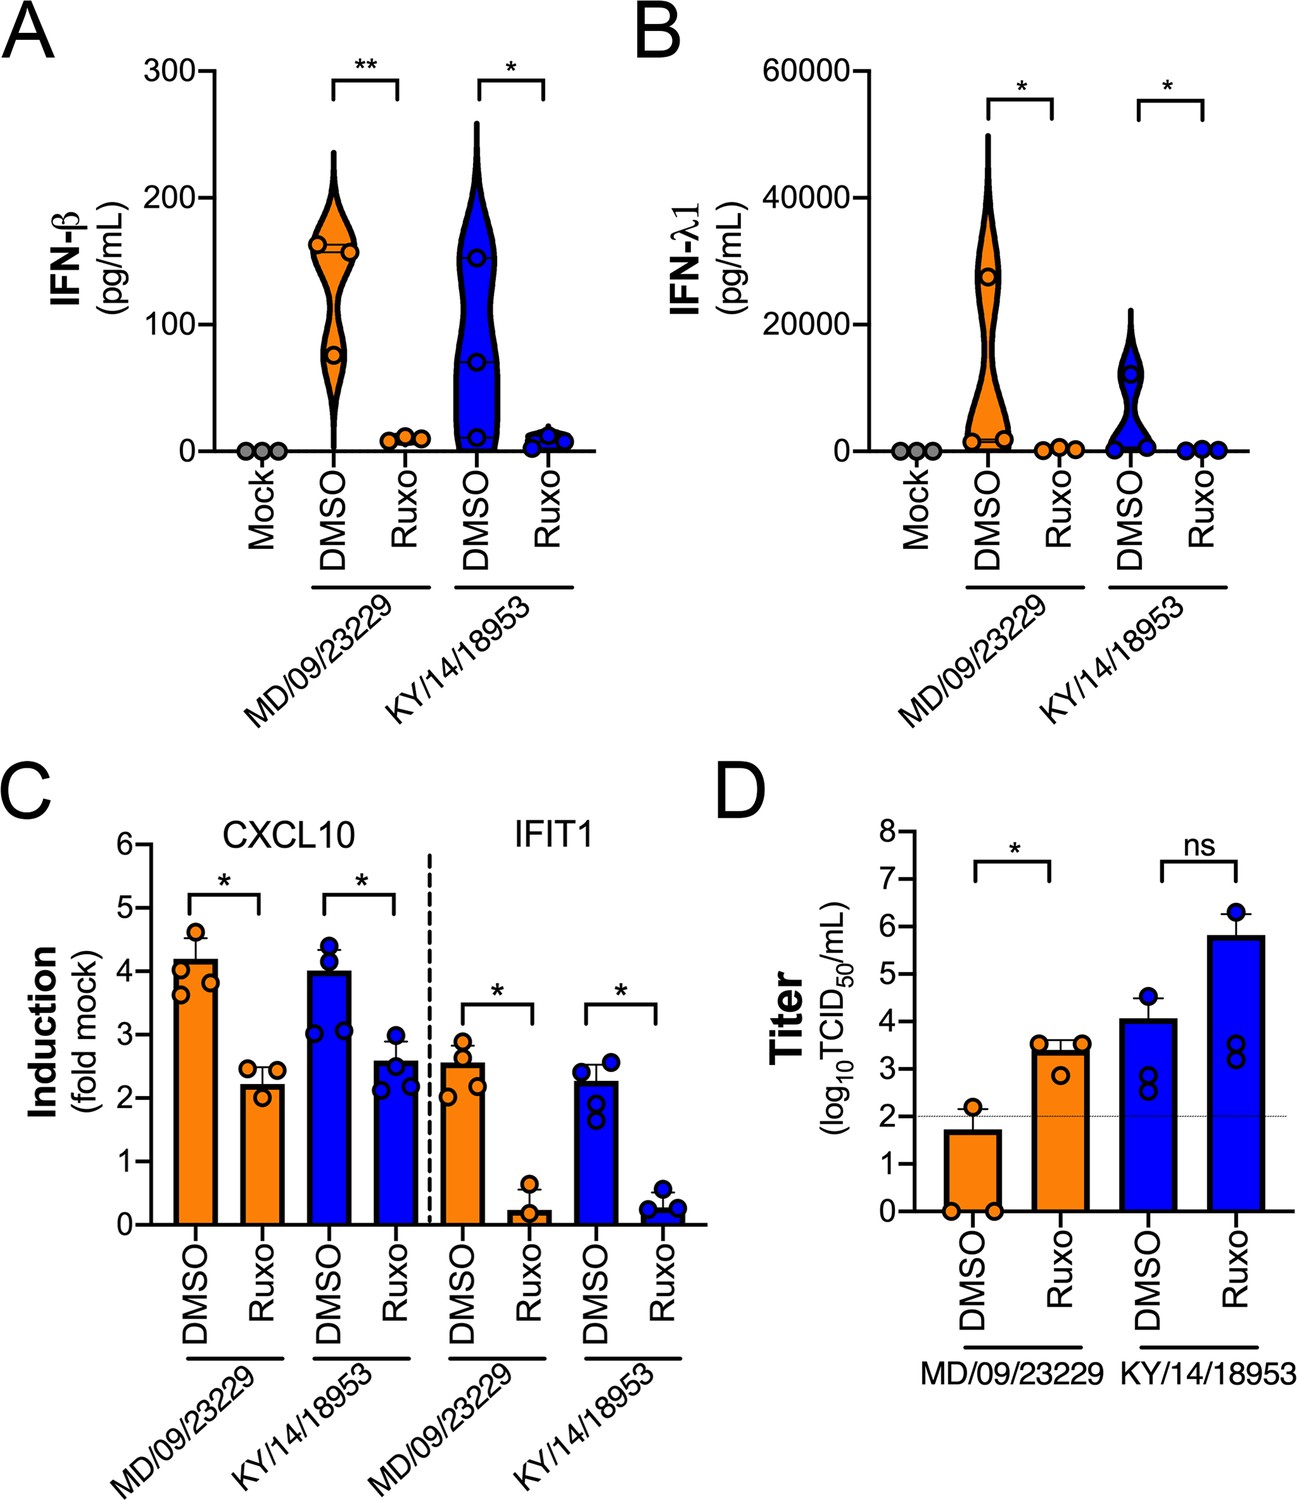
IFN signaling restricts EV-D68 replication in primary human airway cells.
(A, B) Levels of IFN-β (A) or IFN-λ1 (B) as determined by Luminex-based assays in medium harvested from primary human bronchial epithelial (HBE) cells pretreated with the JAK1/2 inhibitor ruxolitinib (5 mM, Ruxo) or DMSO control for 1 hr and then infected with EV-D68 strains MD/09/23229 or KY/14/18953 as indicated in the presence of inhibitor for 48 hr at 33°C. Symbols represent individual biological replicates from at least two unique donors. (C) Induction of the interferon-stimulated genes (ISGs) CXCL10 or IFIT1 in control (DMSO)- or Ruxo-treated HBE infected with the EV-D68 strains MD/09/23229 or KY/14/18953 as assessed by RT-qPCR. Symbols represent individual biological replicates from at least two unique donors. (D) Viral titers in control (DMSO) or Ruxo-treated HBE infected with MD/09/23229 or KY/14/18953 for 48 hr at 33°C. Statistical significance was determined using a Student’s t-test, *p<0.05, **p<0.01, ns, not significant.
Additional files
-
Supplementary file 1
VP1 Sequence Alignment of EV-D68 isolates used in this study.
Protein sequence alignment of the VP1 isolates used in the study, with MD/09–23229 used as the reference isolate (shown in top row). The consensus amino acid is denoted in the bottom row. Alignment constructed using Jalview with sequence information from GenBank.
- https://cdn.elifesciences.org/articles/66687/elife-66687-supp1-v2.zip
-
Supplementary file 2
Table of viral isolates used in the study.
- https://cdn.elifesciences.org/articles/66687/elife-66687-supp2-v2.docx
-
Supplementary file 3
Table of RT-qPCR primers used in this study.
- https://cdn.elifesciences.org/articles/66687/elife-66687-supp3-v2.docx
-
Supplementary file 4
Transcripts induced by apical or basolateral infection in HBE with MD/09/23229 (orange) and KY/14/18953 (blue).
- https://cdn.elifesciences.org/articles/66687/elife-66687-supp4-v2.xlsx
-
Supplementary file 5
Transcripts shared between basolateral infection of HBE with MD/09/23229 and KY/14/18953.
- https://cdn.elifesciences.org/articles/66687/elife-66687-supp5-v2.xlsx
-
Supplementary file 6
Transcripts induced by infection of human enteroids with KY/14/18953.
- https://cdn.elifesciences.org/articles/66687/elife-66687-supp6-v2.xlsx
-
Transparent reporting form
- https://cdn.elifesciences.org/articles/66687/elife-66687-transrepform-v2.docx
Download links
A two-part list of links to download the article, or parts of the article, in various formats.
Downloads (link to download the article as PDF)
Open citations (links to open the citations from this article in various online reference manager services)
Cite this article (links to download the citations from this article in formats compatible with various reference manager tools)
Respiratory and intestinal epithelial cells exhibit differential susceptibility and innate immune responses to contemporary EV-D68 isolates
eLife 10:e66687.
https://doi.org/10.7554/eLife.66687


