A phase transition enhances the catalytic activity of SARM1, an NAD+ glycohydrolase involved in neurodegeneration
- Department of Biochemistry and Molecular Pharmacology, UMass Medical School, United States
- Program in Chemical Biology, UMass Medical School, United States
- Department of Neurobiology, UMass Medical School, United States
Figures
Figure 1
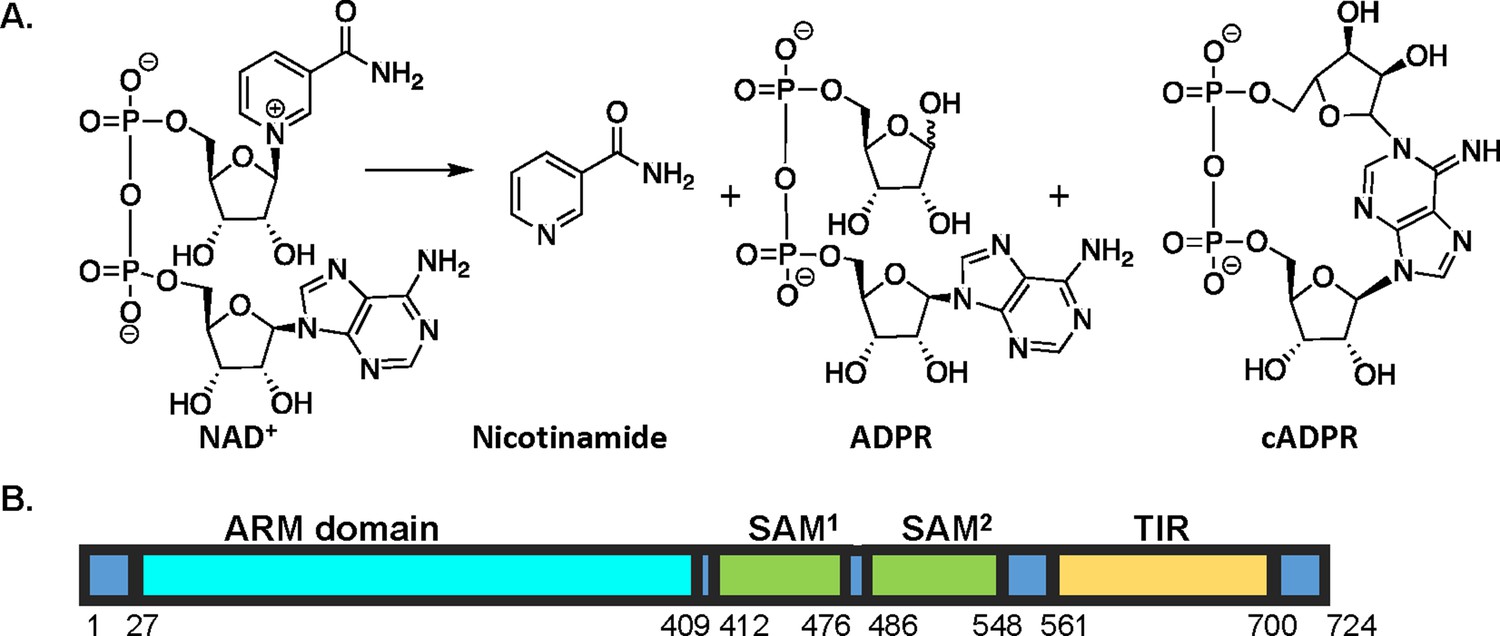
SARM1 reaction and domain structure.
(A) SARM1-mediated hydrolysis of NAD+ results in the production of nicotinamide and a mixture of ADPR and cADPR. (B) Domain architecture of SARM1. SARM1 consists of three domains: an autoinhibitory HEAT/armadillo (ARM) domain, two tandem sterile alpha motif (SAM) domains that promote octamerization, and a C–terminal toll interleukin receptor (TIR) domain that catalyzes NAD+ hydrolysis.
Figure 2 with 2 supplements
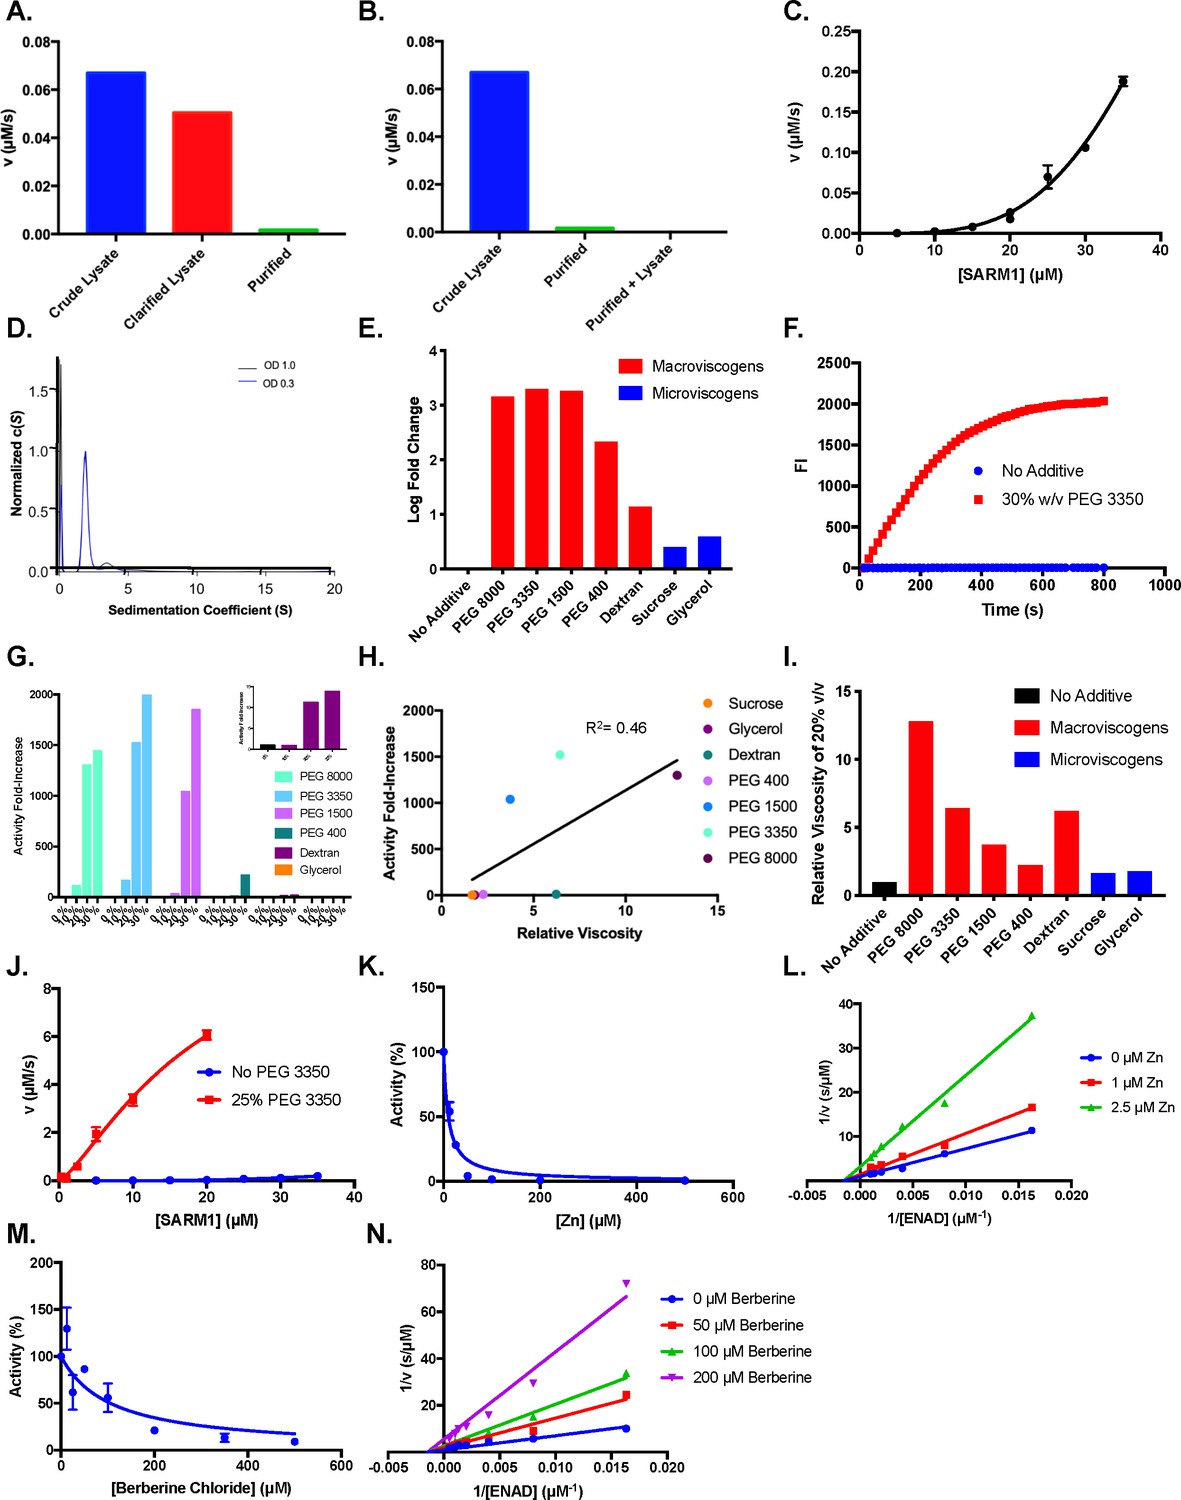
Effect of crowding agents on activity.
(A) Activity of crude lysate, clarified lysate, and elution during SARM1 purification (n=2). (B) Activity of crude lysates, pure protein and pure protein added back to C43 lysates (n=2). (C) Dose dependence of SARM1 TIR domain activity from 5 to 35 µM with 1 mM ENAD (n=3). (D) AUC of SARM1 at an OD280 of 0.3 and 1.0 (n=3). (E) Log fold change in SARM1 (10 µM) activity in buffer compared to 30% of crowding agent and 1 mM ENAD (n=3). (F) Representative time course of SARM1 TIR domain with and without 30% w/v PEG 3350 at 2 mM ENAD and 20 µM SARM1 (n=3). (G) Dose dependence of SARM1 TIR domain activity from 0 to 30% crowding agent and 1 mM ENAD (n=3). (H) Activity of SARM1 (10 µM) at different viscosities of 20% w/v solutions (n=3). (I) Relative viscosities at 20% w/v of different solutions (n=2). (J) Dose dependence of SARM1 TIR domain activity from 300 nM to 35 µM with and without PEG (n=3). (K) Zinc inhibition of SARM1 (2.5 µM) plus 25% PEG 3350 with 100 µM ENAD (n=3). (L) Mechanism of zinc inhibition of SARM1 (2.5 µM) in the presence of 25% PEG 3350 (n=3). (M) Berberine chloride inhibition of SARM1 (2.5 µM) plus 25% PEG 3350 with 100 µM ENAD (n=3). (N) Mechanism of berberine chloride inhibition of SARM1 (2.5 µM) in the presence of 25% PEG 3350 (n=3).
Figure 2—figure supplement 1
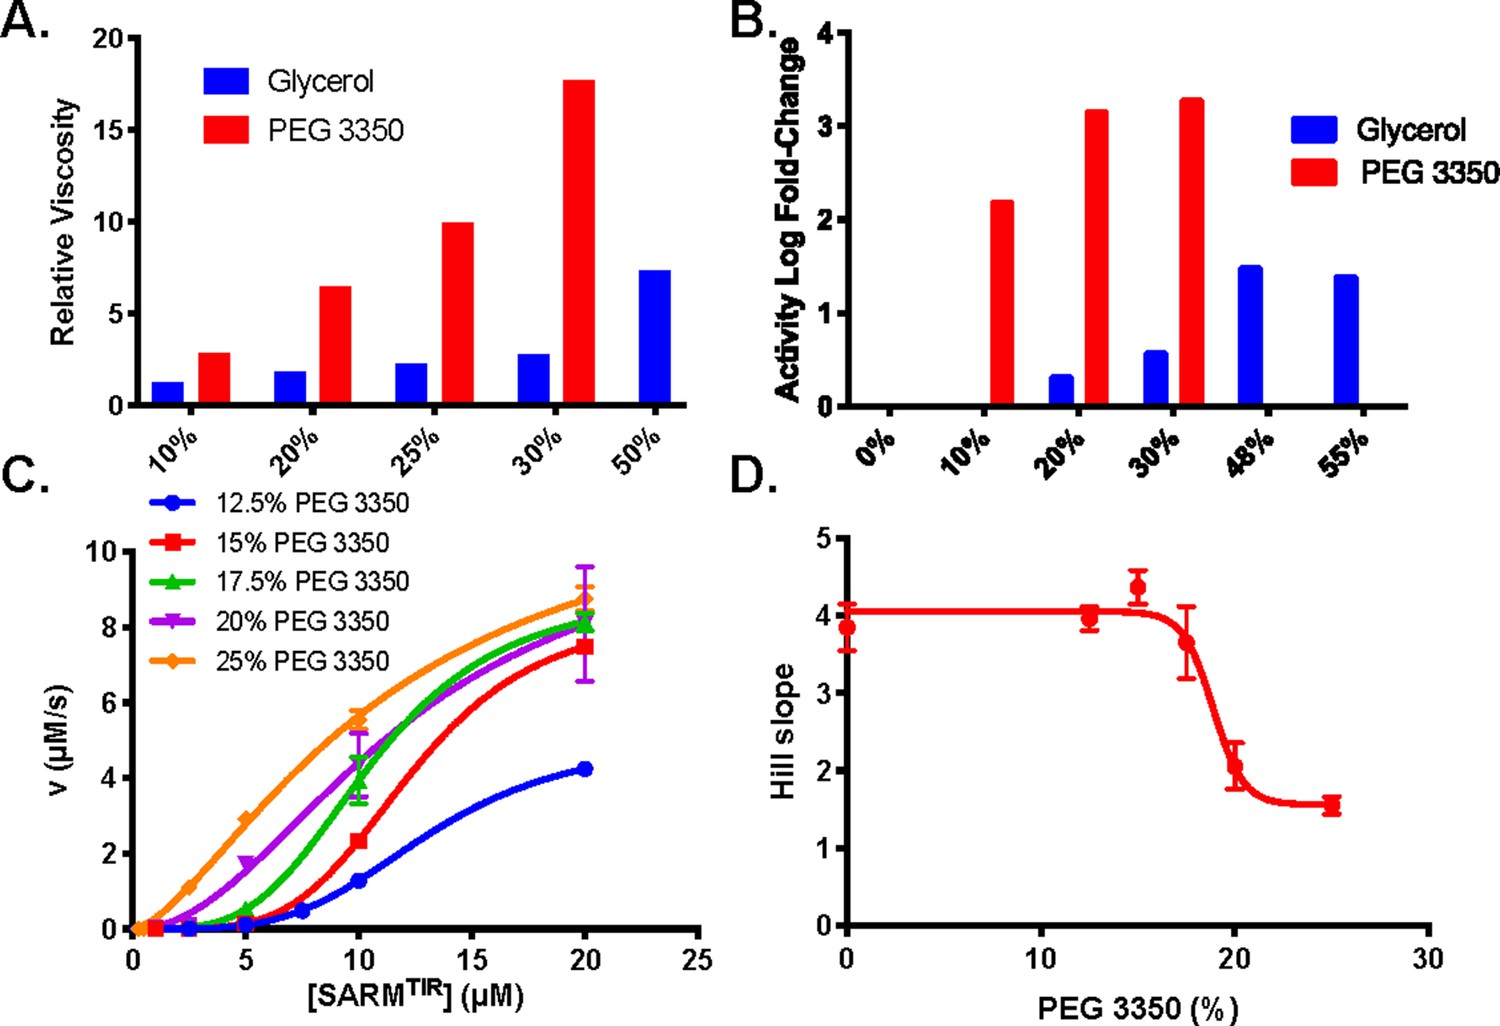
Effect of additives on viscosity and activity.
(A) Viscosities of glycerol and PEG 3350 at 10–50% w/v. (B) Activity-fold increase at 0–55% glycerol. (C) Activity at 0.25–20 µM SARM1 with 12.5–25% PEG 3350 fit to Equation 1. (D) Fitting to Equation 1 gives hill slopes for each concentration of PEG.
Figure 2—figure supplement 2
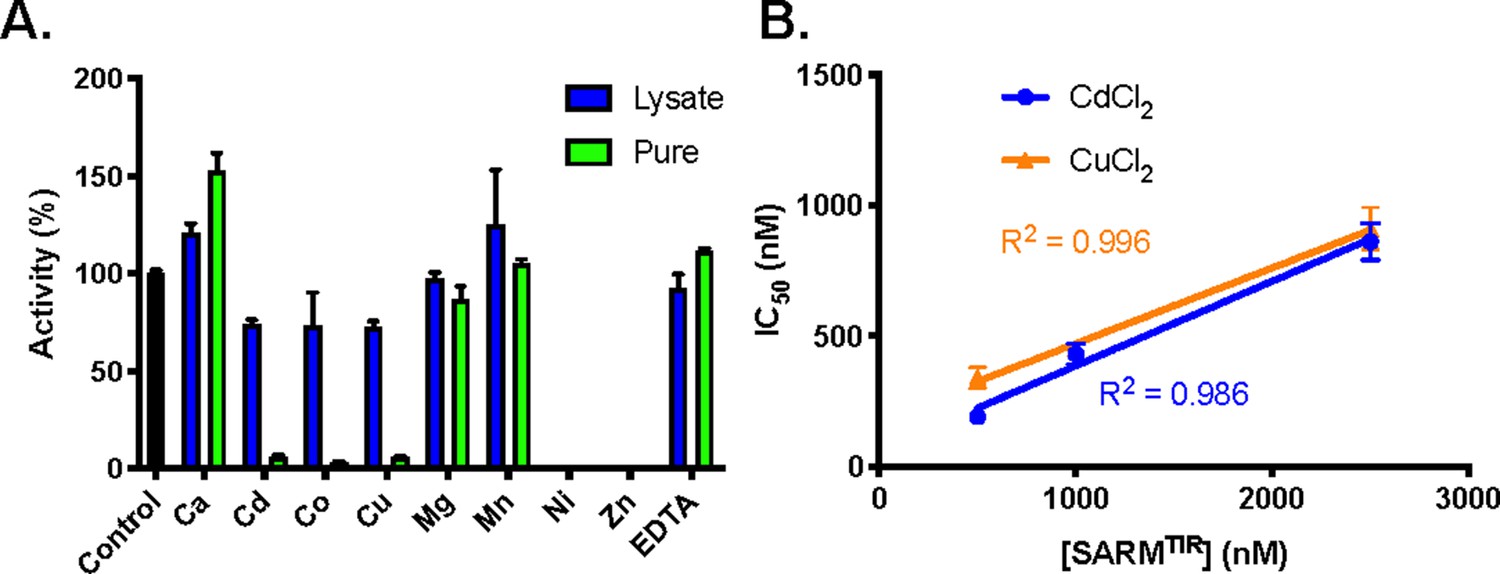
Effect of divalent cations on activity.
(A) Inhibition of SARM1 (lysate, 300 nM and pure, 2.5 µM with 25% PEG 3350) by divalent metals (2 mM). (B) IC50 of CuCl2 and CdCl2 with SARM1 at three concentrations of enzyme.
Figure 3 with 2 supplements
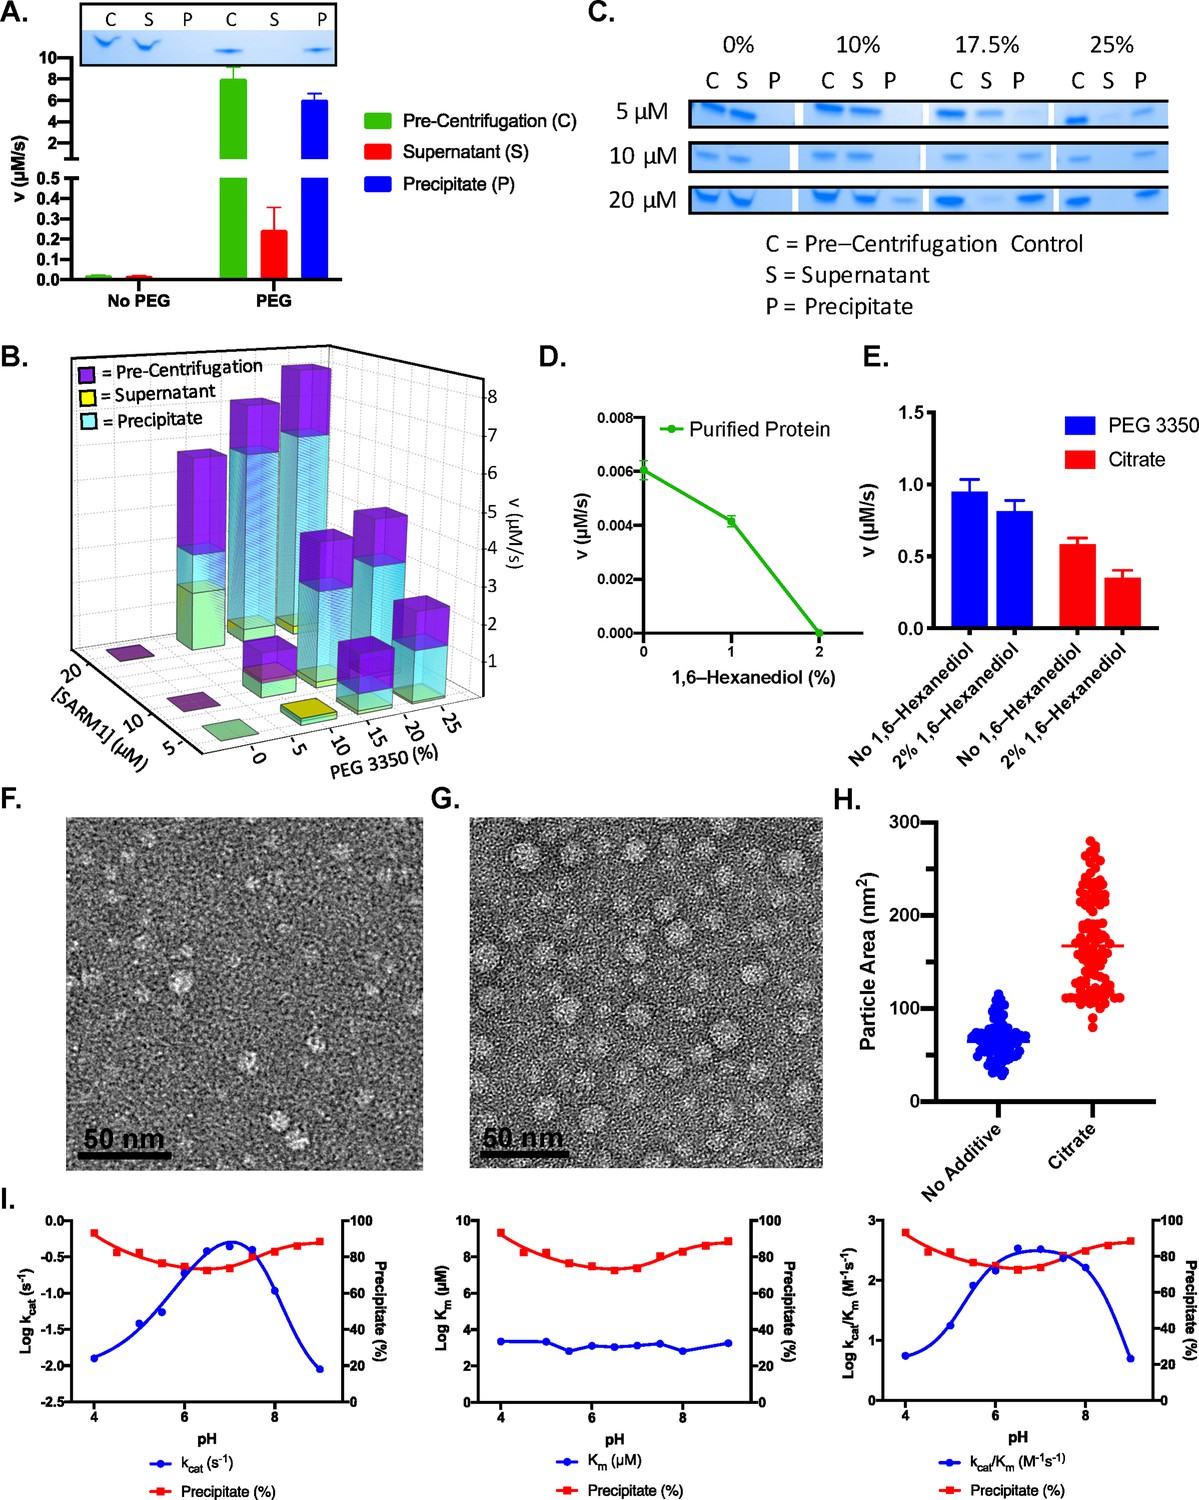
PEG 3350 induces a phase transition.
(A) Activity of pre-centrifugation, supernatant, and precipitate fractions obtained before and after treatment of 20 µM SARM1 with and without 25% PEG 3350. Coomassie gels demonstrate the presence of SARM1 in each fraction (n=3). (B) Activity of pre-centrifugation, supernatant, and precipitate fractions obtained after treating SARM1 (5, 10, and 20 µM) with 0%, 10%, 17.5%, and 25% PEG 3350 (n=3). (C) Representative Coomassie-stained gels demonstrate the presence of SARM1 in each fraction analyzed in panel B (n=3). (D) Effect of 1,6–Hexanediol on pure SARM1 (20 µM) activity (n=3). (E) Effect of 2% 1,6–hexanediol treatment on SARM1 activity in the presence of 25% PEG or 500 mM sodium citrate (n=3). (F) Negative stain EM of SARM1 TIR domain in 50 mM HEPES pH 8.0, plus 150 mM NaCl. (G) Negative stain EM of SARM1 TIR domain in 50 mM HEPES pH 8.0, plus 150 mM NaCl and 500 mM sodium citrate. (H) Particle area in square nanometers quantified with ImageJ, mean is shown by line (No additive: Mean = 66.0, SEM = 1.9, n = 100; Citrate: Mean = 172.1, SEM = 5.2, n=100). Significance determined by T–test (∗∗∗ = p value < 0.00001). (I) Effect of pH on the steady state kinetics and precipitate formation. Data is from an average of three experiments each conducted in duplicate (n=3). Full gels provided in Figure 3—figure supplement 2.
Figure 3—figure supplement 1
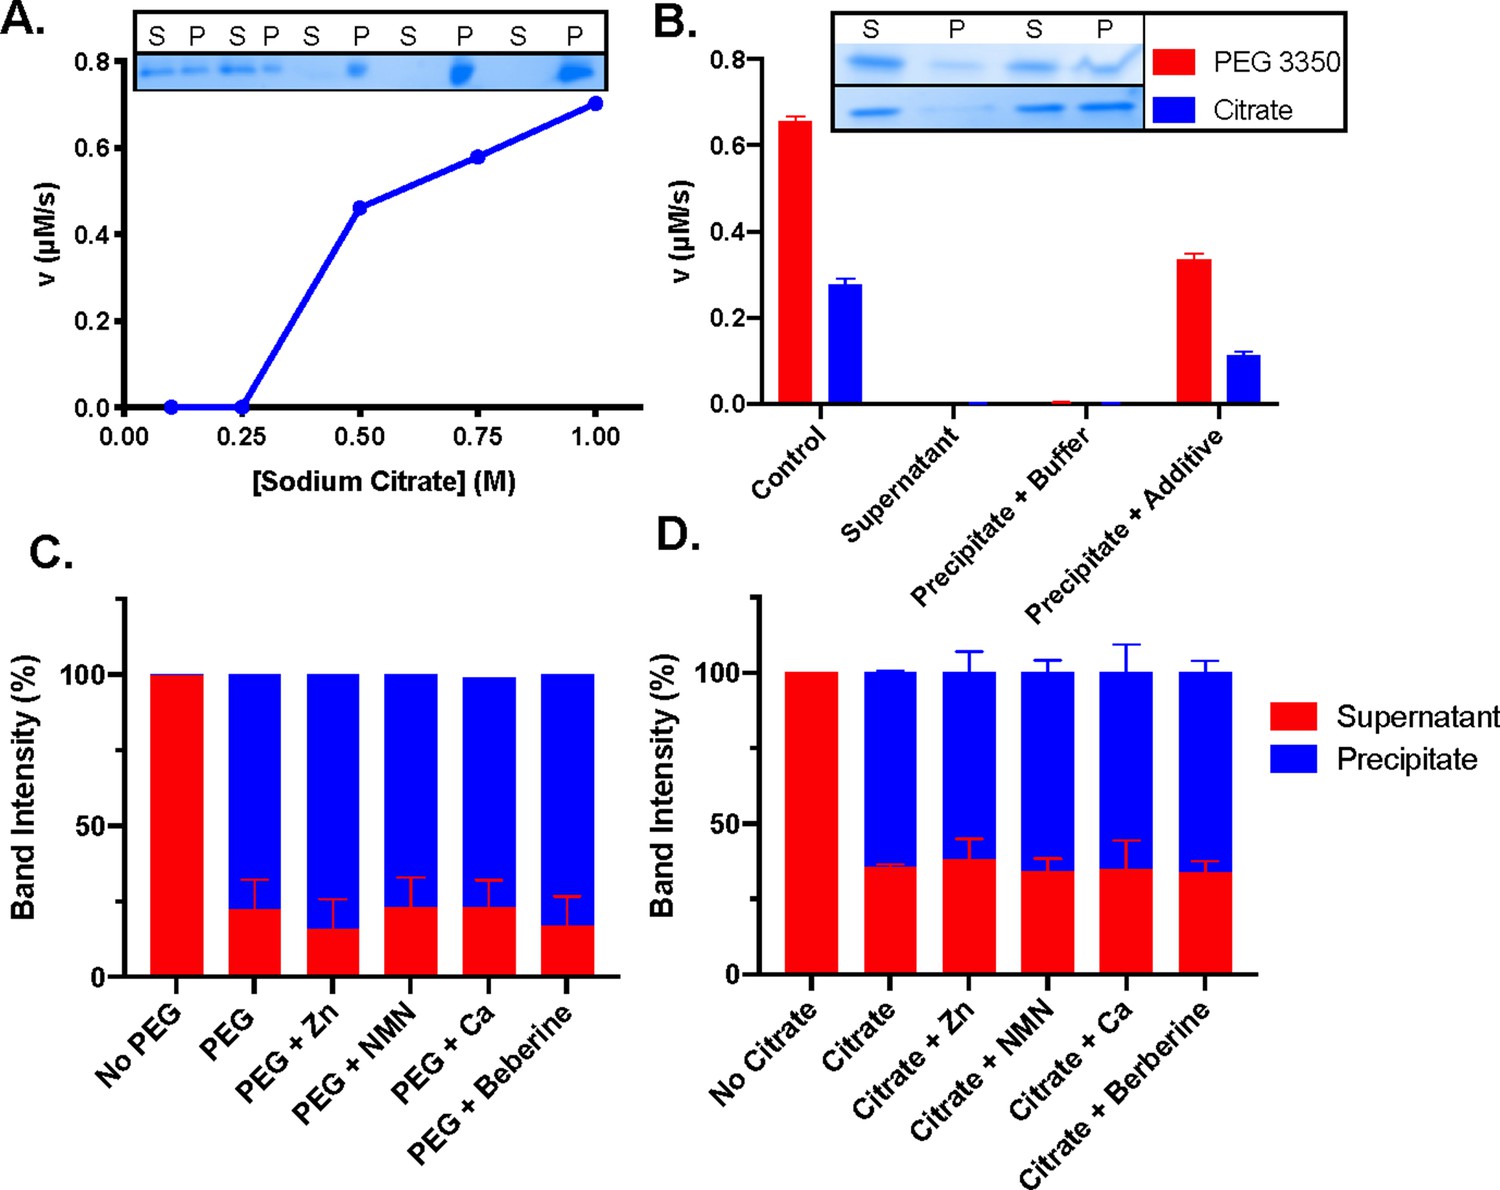
Additives precipitate and activate SARM1.
(A) Activity of SARM1 at 100, 250, 500, 750, and 1000 mM sodium citrate, with coomassie gel depicting SARM1 in supernatant (S) and pellet (P) fractions. (B) Activity of pre-centrifugation control, supernatant, precipitate resuspended in buffer and precipitate resuspended in buffer plus additive. Coomassie gels are shown for each fraction with PEG 3350 and sodium citrate. Band intensity of supernatant and precipitate fractions in the presence and absence of inhibitors, metals, and NMN for PEG (C) and citrate (D). Full gels shown in Figure 3—figure supplement 2.
Figure 3—figure supplement 2
Full gels of those shown in Figure 3 and Figure 3—figure supplement 1.
(A) Pre-centrifugation, supernatant, and pellet fractions of 20 µM SARM1 without and with 25% PEG (corresponds to panel A). (B) Pre-centrifugation, supernatant, and pellet fractions at 5 µM SARM1 and 0, 10, 17.5, and 25% PEG 3350 (panel C top). (C) Pre-centrifugation, supernatant, and pellet fractions at 10 µM SARM1 and 0, 10, 17.5, and 25% PEG 3350 (panel C middle). (D) Pre-centrifugation, supernatant, and pellet fractions at 20 µM SARM1 and 0, 10, 17.5, and 25% PEG 3350 (panel C bottom). (E) Full gel of image of the gel in (A) showing SARM1 in supernatant and pellet fractions with 0.1–1M sodium citrate.
Figure 4

Effect of PEG 3350 concentration on steady state kinetics of ENAD hydrolysis.
(A) Steady state kinetic analysis at 10 µM SARM1 with and without addition of PEG 3350 (25%) (n=3). (B) Steady state kinetic analysis of SARM1 (10 µM) with PEG 3350 (0–25% w/v) (C) Km, (D) kcat, and (E) kcat/Km values at each concentration (n=3). (F) Steady state kinetic analysis of SARM1 from 500 nM to 10 µM with PEG 3350, and without PEG 3350 at 10 and 20 µM from 0 to 2 mM ENAD, fit to Michaelis Menten equation (n=3). (G) Blow up of steady state kinetic analysis of SARM1 500 nM and 1 µM with PEG 3350, and 10 and 20 µM without PEG 3350 with ENAD from 0 to 2 mM. Fitting to Michaelis Menten equation gives (H) Km, (I) kcat, and (J) kcat/Km values at each concentration (n=3).
Figure 5 with 4 supplements
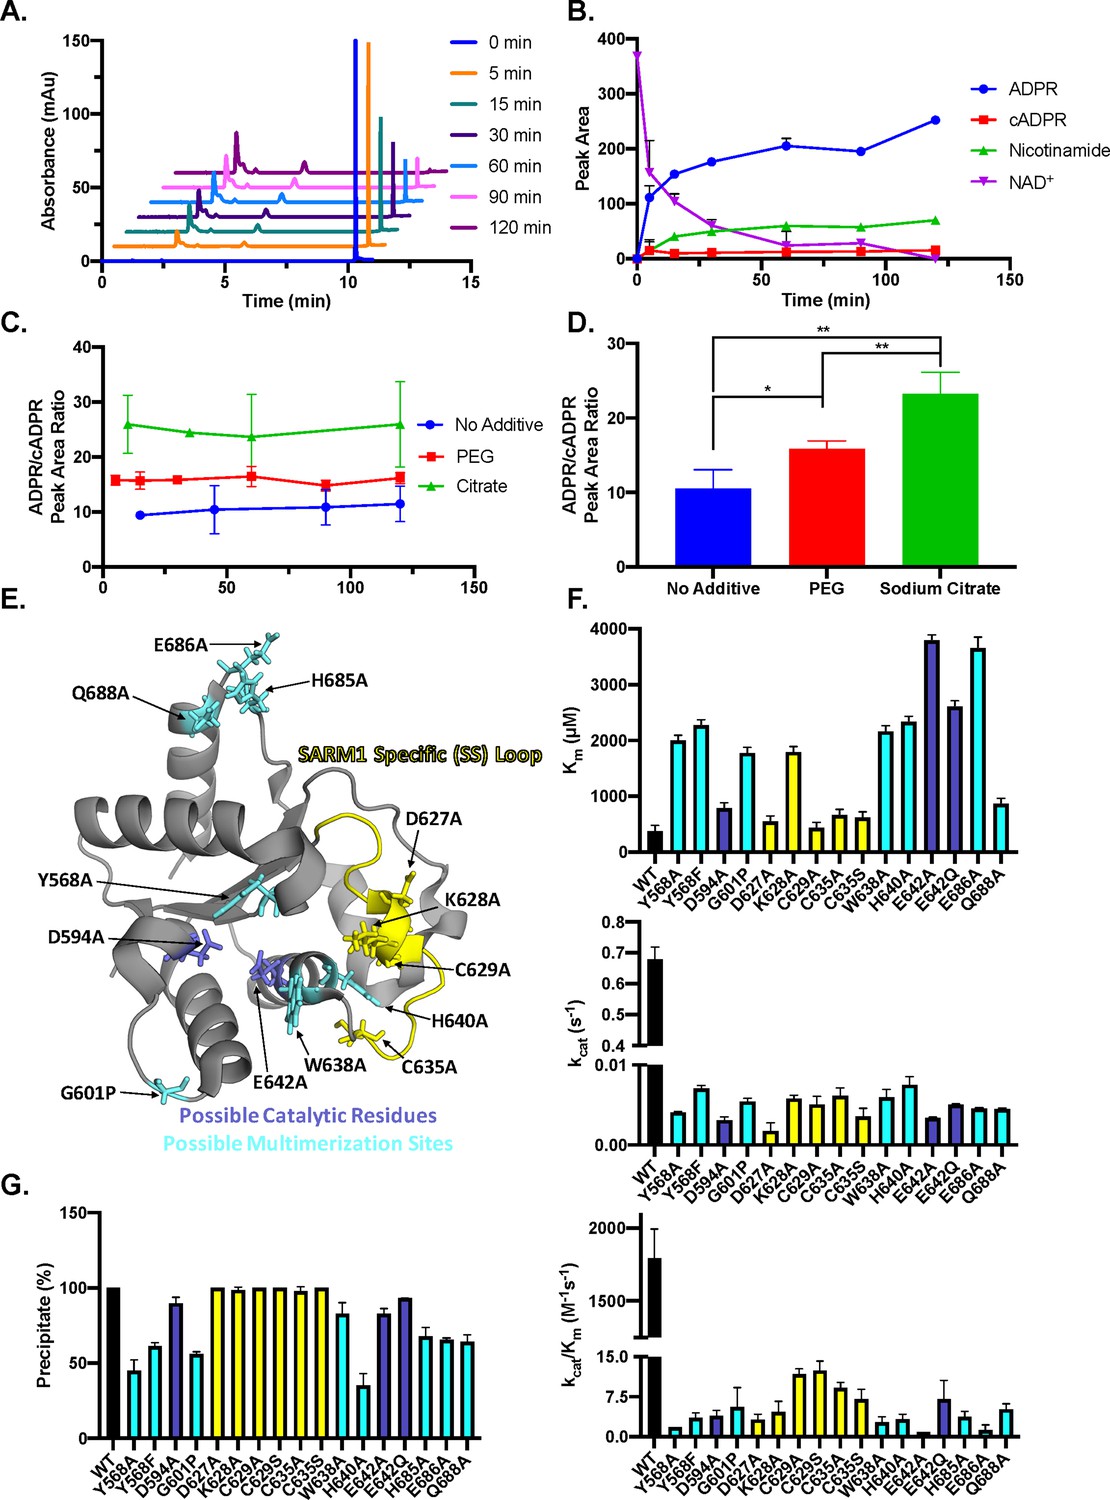
SARM1 reaction products and mutagenesis.
(A) Representative time course of SARM1 with PEG, depicting the A254 nm for ADPR, cADPR, nicotinamide, and NAD+ (n=3). (B) Peak area quantification of NAD+ and reaction products (A254 nm) over time (n=3). (C) ADPR/cADPR peak area ratios at A254 over time without additive, with PEG or with sodium citrate (n=3). (D) Average of ADPR/cADPR peak area ratios shown in panel C for no additive, PEG and sodium citrate SARM1 reactions, where * = p < 0.0005 and ** = p < 0.00005. (E) Mutants of interest shown on the SARM1 TIR domain structure, colored yellow for SARM1-Specific loop, dark blue for potential catalytic residues, and light blue for potential multimerization sites (PDBID: 6o0q). (F) Km, kcat, and kcat/Km values obtained from steady-state kinetic experiments performed in duplicate for the mutants compared to wild-type SARM1 TIR domain, colored yellow for SARM1-Specific loop, dark blue for potential catalytic residues, and light blue for possible multimerization sites (n=2). (G) Precipitation of mutants compared to wild-type SARM1 TIR domain performed in duplicate (n=2).
Figure 5—figure supplement 1
SARM1 LC–MS reactions.
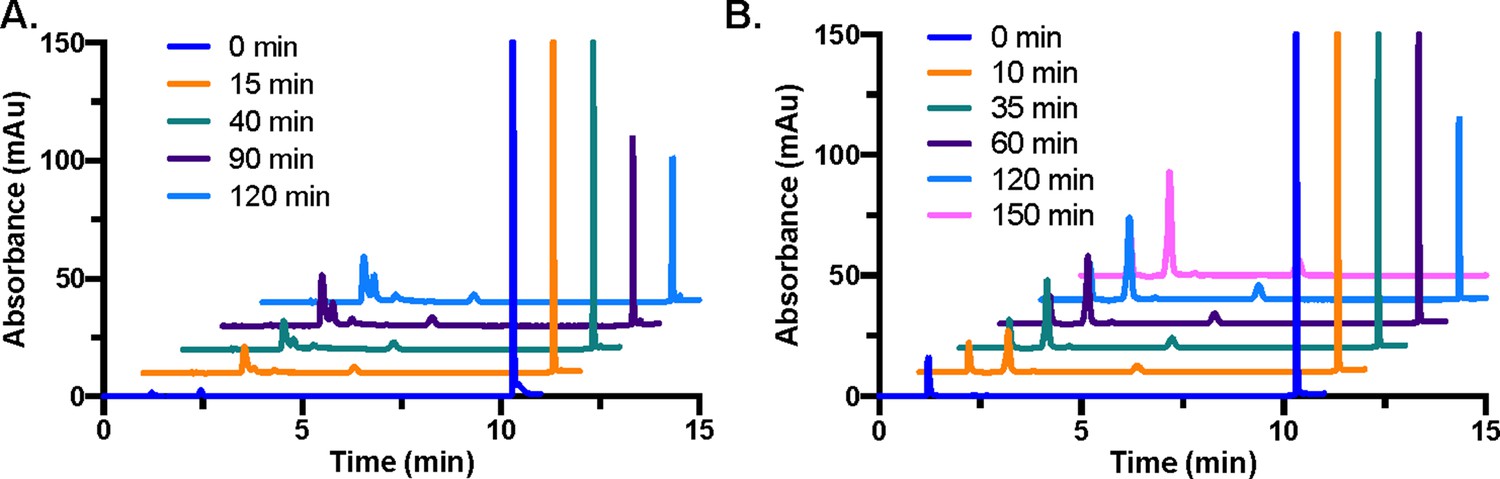
(A) Representative SARM1 reaction time course showing the absorbance at 254 nm for NAD+ (100 µM initial), nicotinamide, ADPR, and cADPR over time without additive (n=3). (B) Representative SARM1 plus sodium citrate reaction time course showing the absorbance at 254 nm for NAD+(100 µM initial), nicotinamide, ADPR, and cADPR over time (n=3).
Figure 5—figure supplement 2
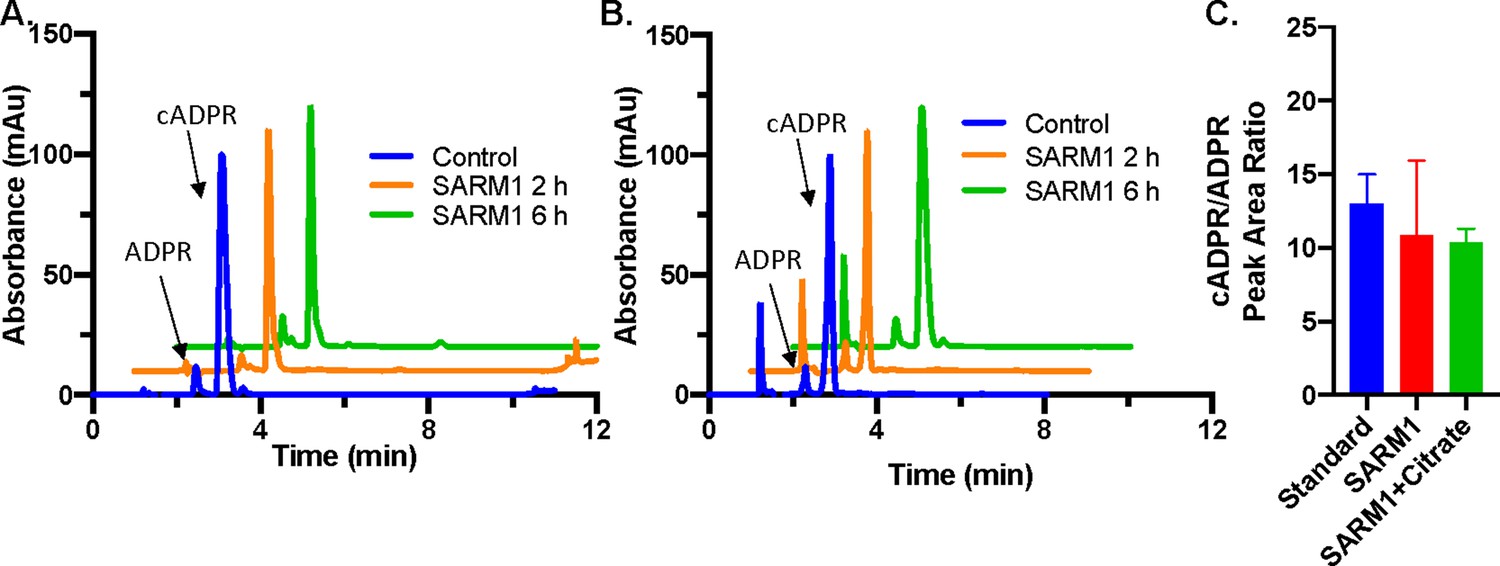
Hydrolysis of cADPR.
(A) Absorbance at 254 nm for SARM1 (20 µM) incubated with 100 µM cADPR without additive for 2 hr and 6 hr, shown with 100 µM cADPR standard (n=3). (B) Absorbance at 254 nm for reaction of SARM1 (20 µM) incubated 100 µM cADPR plus 500 mM sodium citrate for 2 hr and 6 hr, shown with 100 µM cADPR standard (n=3). (C) Quantification of cADPR/ADPR peak area ratios in control, SARM1 reaction, and SARM1 reaction with sodium citrate (n = 2).
Figure 5—figure supplement 3
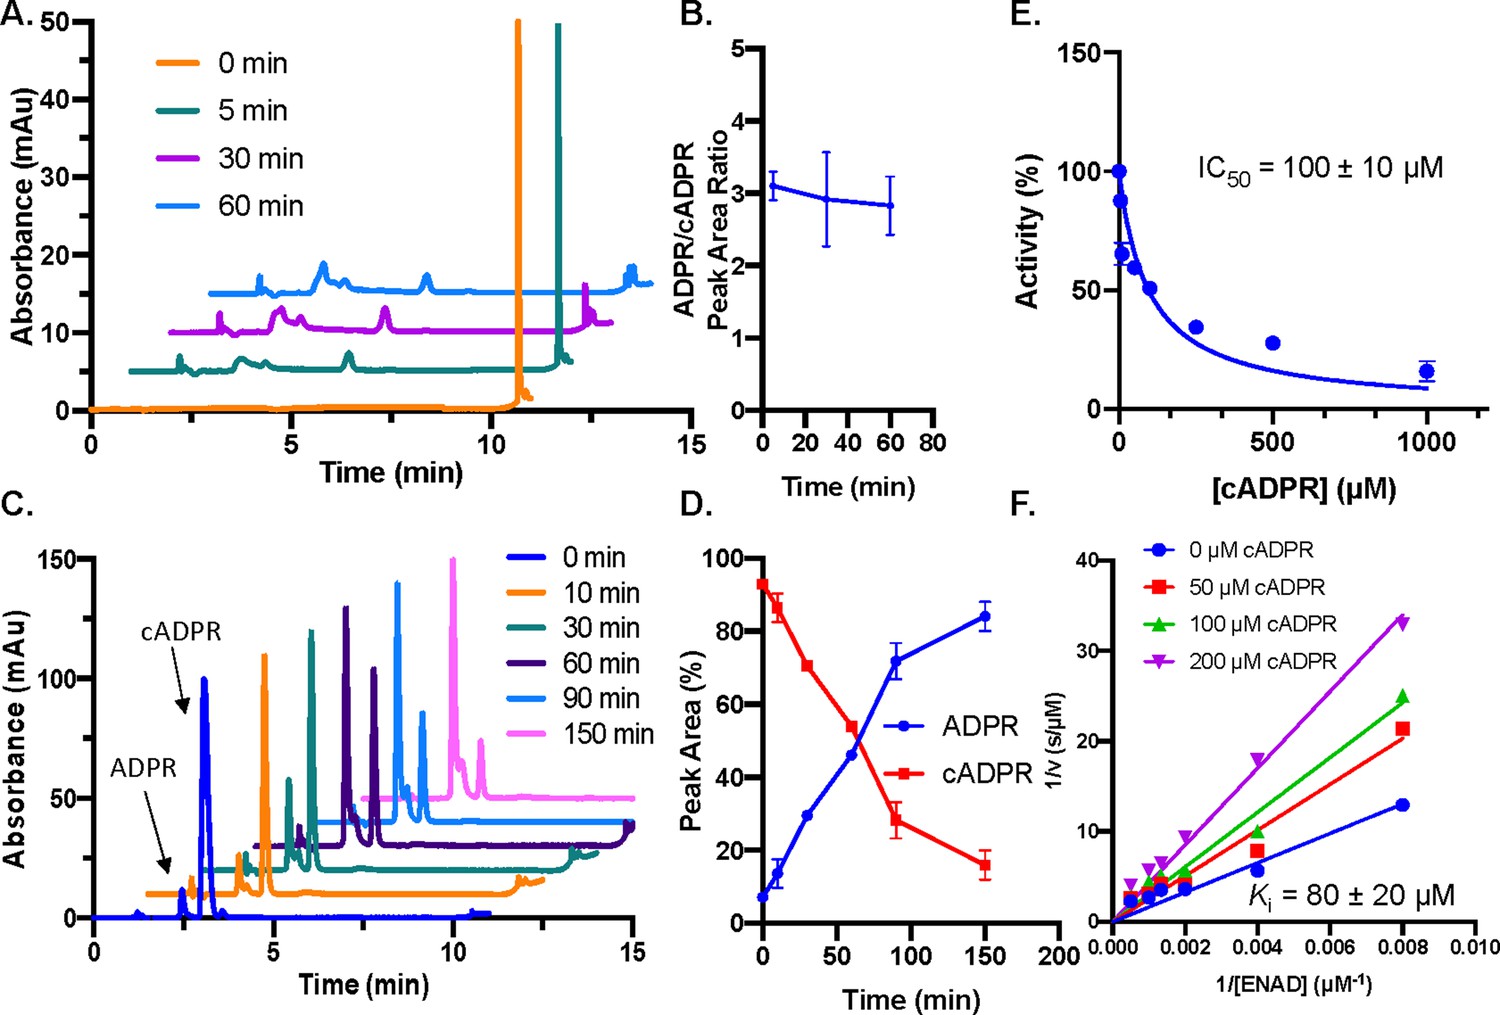
Hydrolysis of cADPR.
(A) Single turnover time course of NAD+10 µM by SARM1 (20 µM) (n=2). (B) Quantification of ADPR and cADPR peak area ratios in (A). (C) Representative SARM1 plus PEG reaction time course for reaction of 100 µM cADPR. The absorbance at 254 nm is shown over time (n=2). (D) Quantification of ADPR and cADPR peak areas (n=2). (E) Dose dependence of cADPR (0–1 mM) in the presence of 100 µM ENAD, 2.5 µM SARM1% and 25% PEG (n=3). (F) Inhibition of SARM1 (2.5 µM) in the presence of 25% PEG and ENAD (0–2 mM) by cADPR (0–200 µM) (n=2).
Figure 5—figure supplement 4
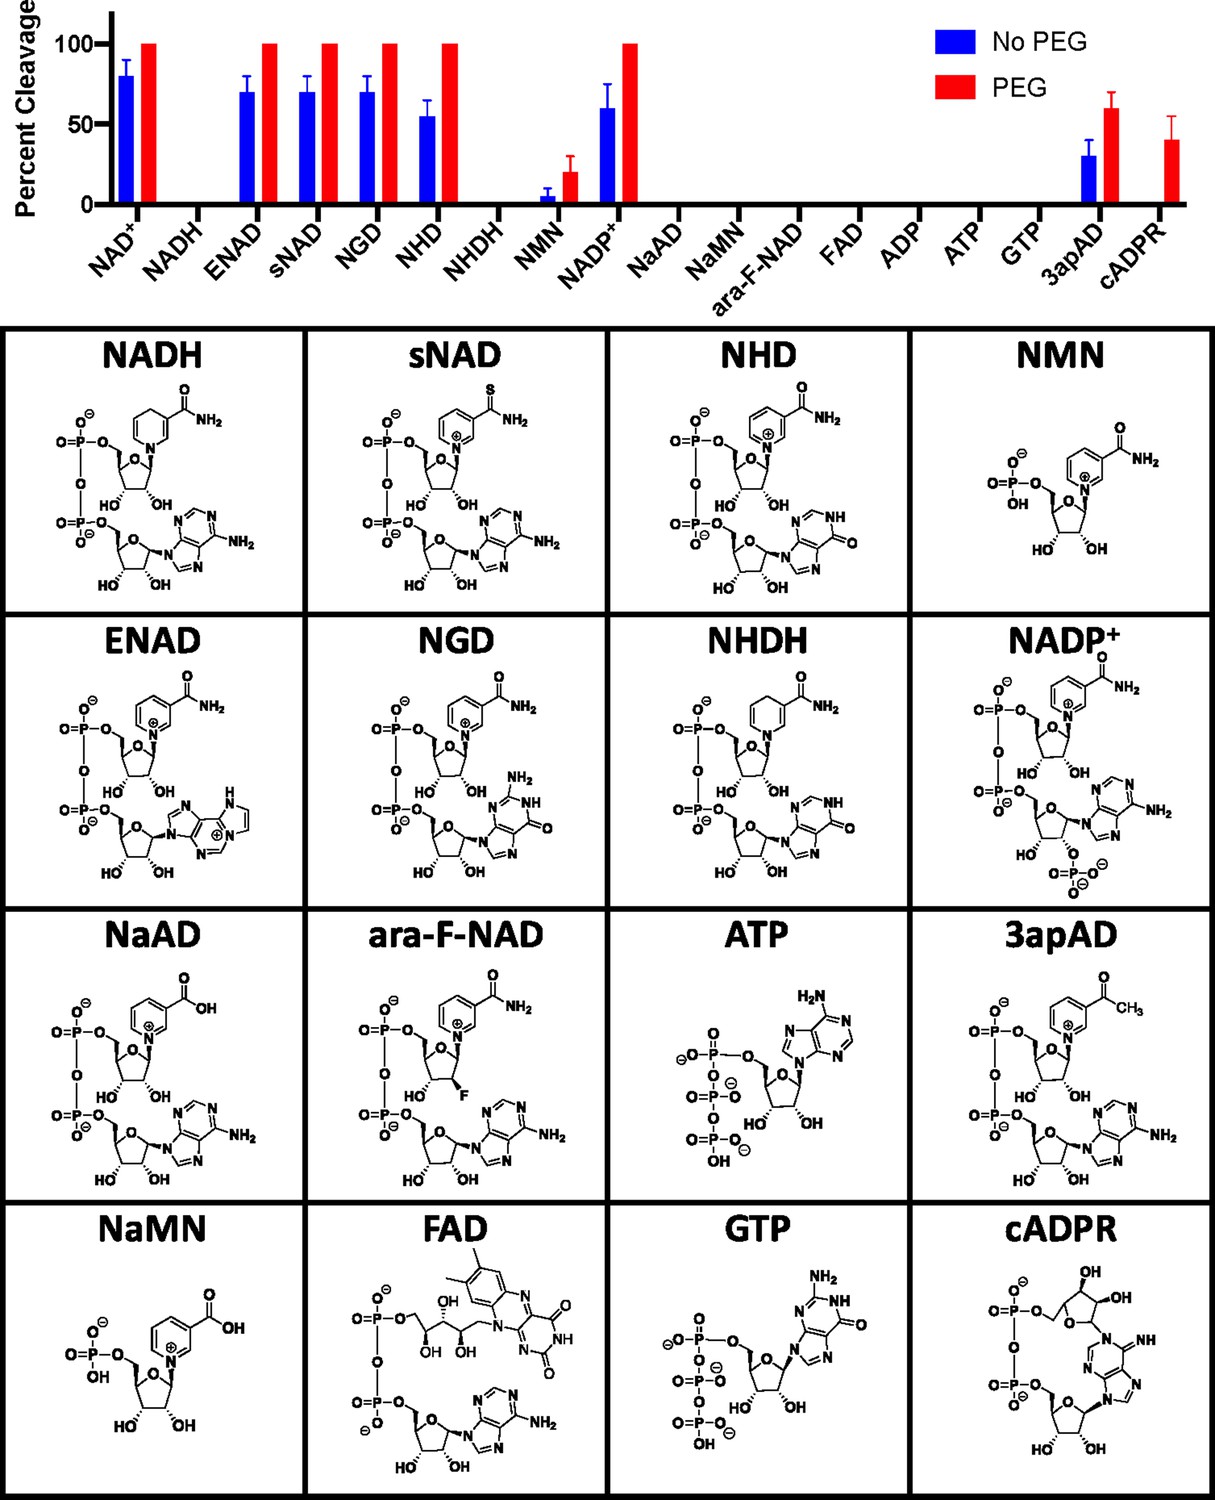
Evaluation of potential substrates with and without PEG 3350.
Potential substrates were monitored for cleavage by LC–MS at 100 µM with 20 µM SARM1 without PEG and at 2.5 µM SARM1 with 25% PEG.
Figure 6 with 2 supplements
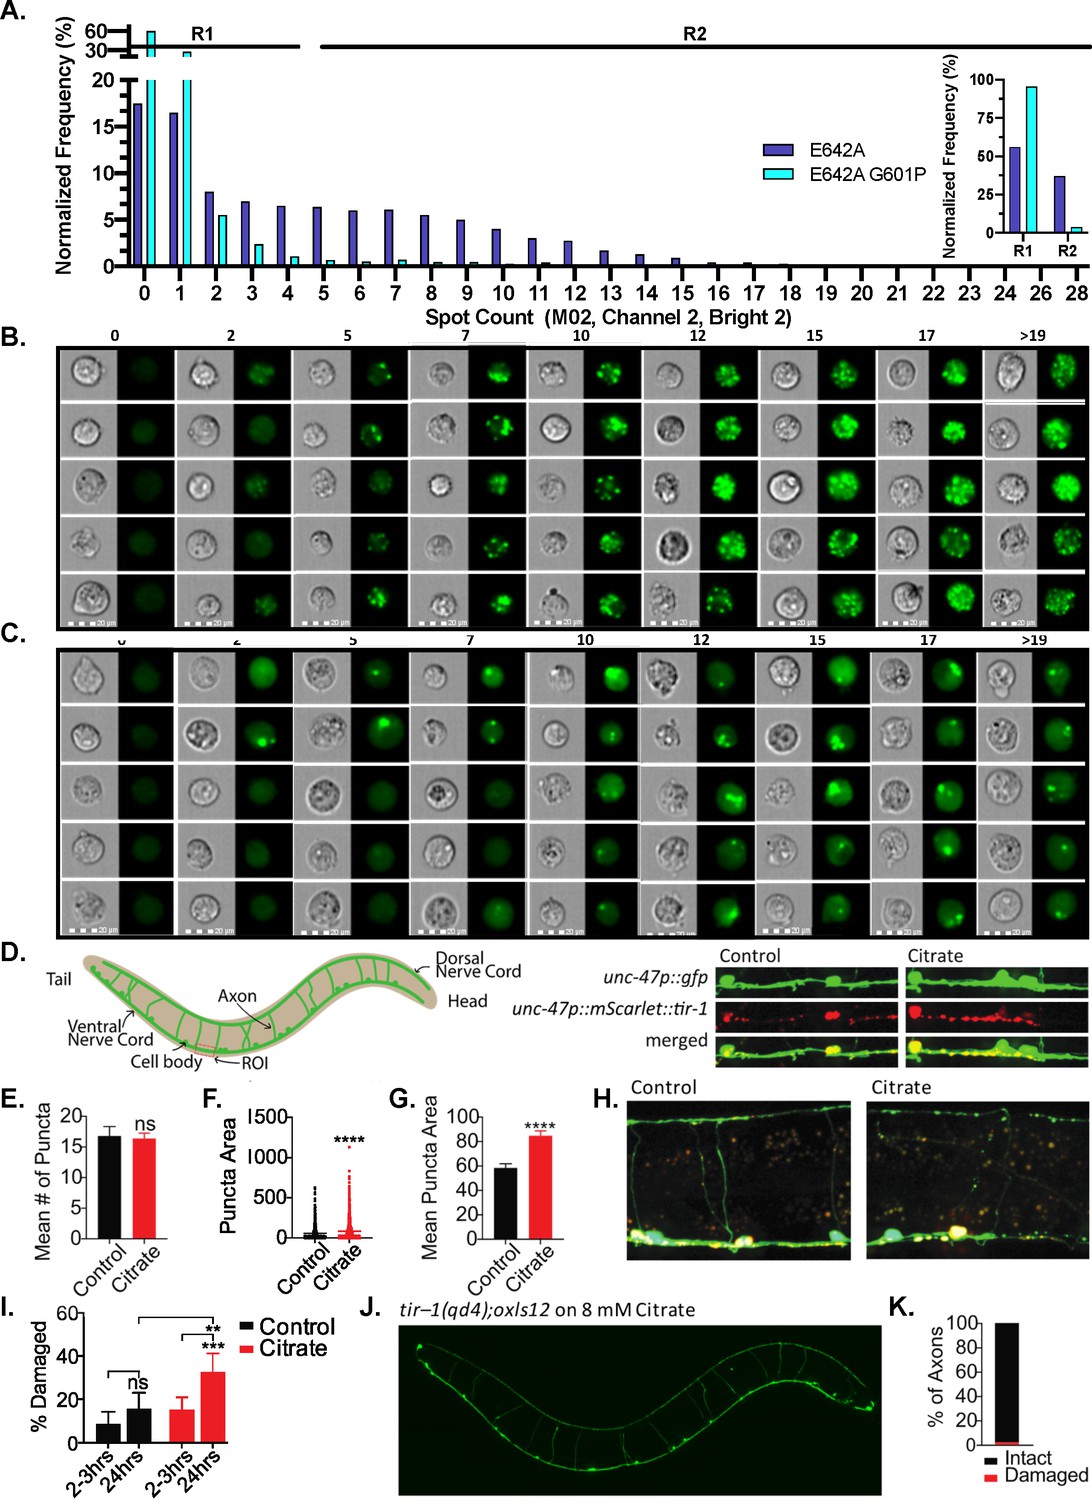
G601P disrupts SARM1 puncta formation in HEK293T cells and citrate induces the formation of larger puncta in C.elegans.
(A) Normalized frequency of GFP-positive 7AAD-negative HEK293T cells expressing either GFP–tagged E642A (20,927 cells) or GFP–tagged E642A G601P (9895 cells) in the context of a SAMTIR construct. Images are bucketed according to spot count algorithm (IDEAS software), where R1 is designated not significantly different than baseline and R2 significant. Insert shows the percentage of cells for each mutant designated as R1 versus R2. (B) Representative images from each bucket for SAMTIR–E642A. (C) Representative images from each bucket for SAMTIR–E642A/G601P. (D) Diagram of C. elegans GABA motor nervous system and quantified region of interest (ROI). Representative micrographs of the ventral nerve cords of untreated control and 8 mM citrate-treated animals 2–3 hr post-citrate application. GABA motor neurons express cytoplasmic GFP and the mCherry tagged TIR-1 transgene (unc-47p::GFP and unc-47p::mScarlet::tir-1b::let-858 3’UTR, respectively). (E) Mean number of puncta in the ventral nerve cord ROIs of untreated animals placed on control plates and animals placed on citrate plates after 2–3 hr. The mean number of puncta is shown with SEM and significance determined by t-test (n=12 animals citrate and n=10 animals control). (F) Puncta area in citrate-treated worms compared to control animals after 2–3 hr. Each individual puncta is plotted along with mean, significance determined by t-test (n=902 citrate and n=739 control). (G) Mean puncta area in citrate treated compared to control animals after 2–3 hr. Mean puncta area is shown as mean and SEM, significance determined by t-test (n=902 citrate and n=739 control). (H) Representative micrographs of control and citrate-treated animals 2–3 hr post citrate application. Green is unc-47p::GFP neuronal reporter, red is unc-47p::mScarlet::tir-1b::let-858 3’UTR transgene. (I) Percentage of damaged axons in citrate treated animals compared to untreated controls at 2–3 hr (n=169 axons citrate and n=145 axons control) and 24 hr (n=111 axons citrate and n=115 axons control). Shown are 95% CI and significance determined by Fishers exact test. (J) Representative micrograph of citrate-treated tir–1(qd4) mutant animals 24 hr post citrate application. GABA neurons are visualized with unc-47p::GFP. (K) The percentage of intact and damaged axons in tir–1(qd4) mutant animals 24 hr post citrate application (n=160 axons).
Figure 6—figure supplement 1
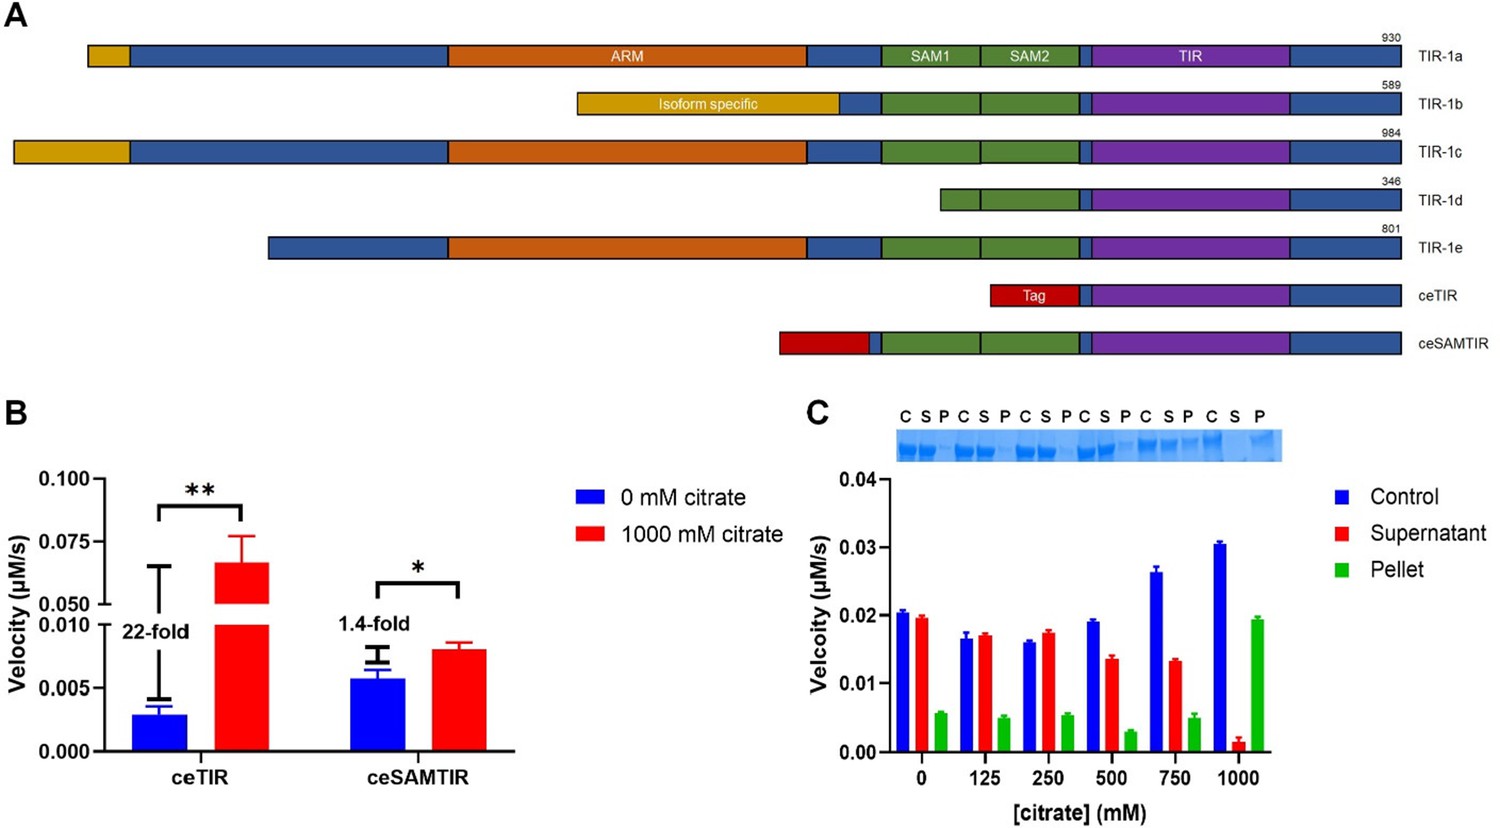
ceSAMTIR undergoes a phase transition that increases activity.
(A) Domain architecture of TIR-1 (C. elegans ortholog of SARM1) isoforms and TIR-1-derived recombinant proteins (B) Fold-change in activity for ceTIR and ceSAMTIR (both 2.5 µM, final concentration) in 1000 mM sodium citrate (n=3) (C) Dose response of ceSAMTIR activity and precipitation in 0–1000 mM sodium citrate (significance determined by t-test: ∗p < 0.05, ∗∗p < 0.01).
Figure 6—figure supplement 2
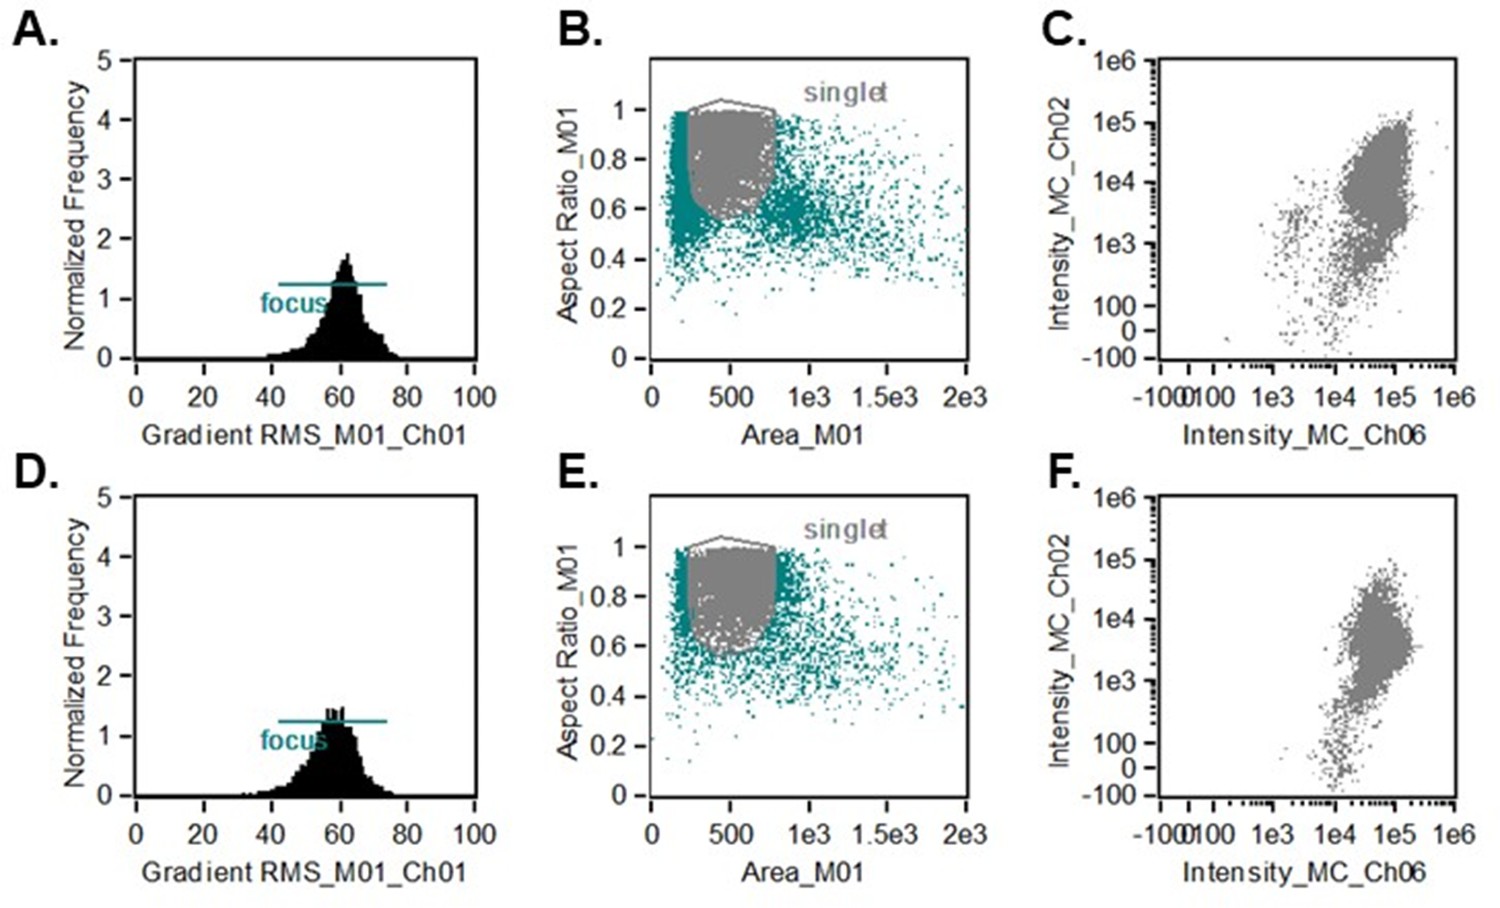
Flowsight of cells after FACS selection with GFP and 7AAD.
(A) GFP-positive 7AAD-negative E642A transfected HEK293T cells, showing region in focus. (B) GFP-positive 7AAD-negative E642A transfected HEK293T cells, showing region in focus that ran as singlets. (C) Fluorescent intensity for E642A HEK293T cells in focus that ran as singlets. (D) GFP-positive 7AAD-negative E642A G601P transfected HEK293T cells, showing region in focus. (E) GFP-positive 7AAD-negative E642A G601P transfected HEK293T cells, showing region in focus that ran as singlets. (F) Fluorescent intensity for E642A G601P HEK293T cells in focus that ran as singlets.
Figure 7
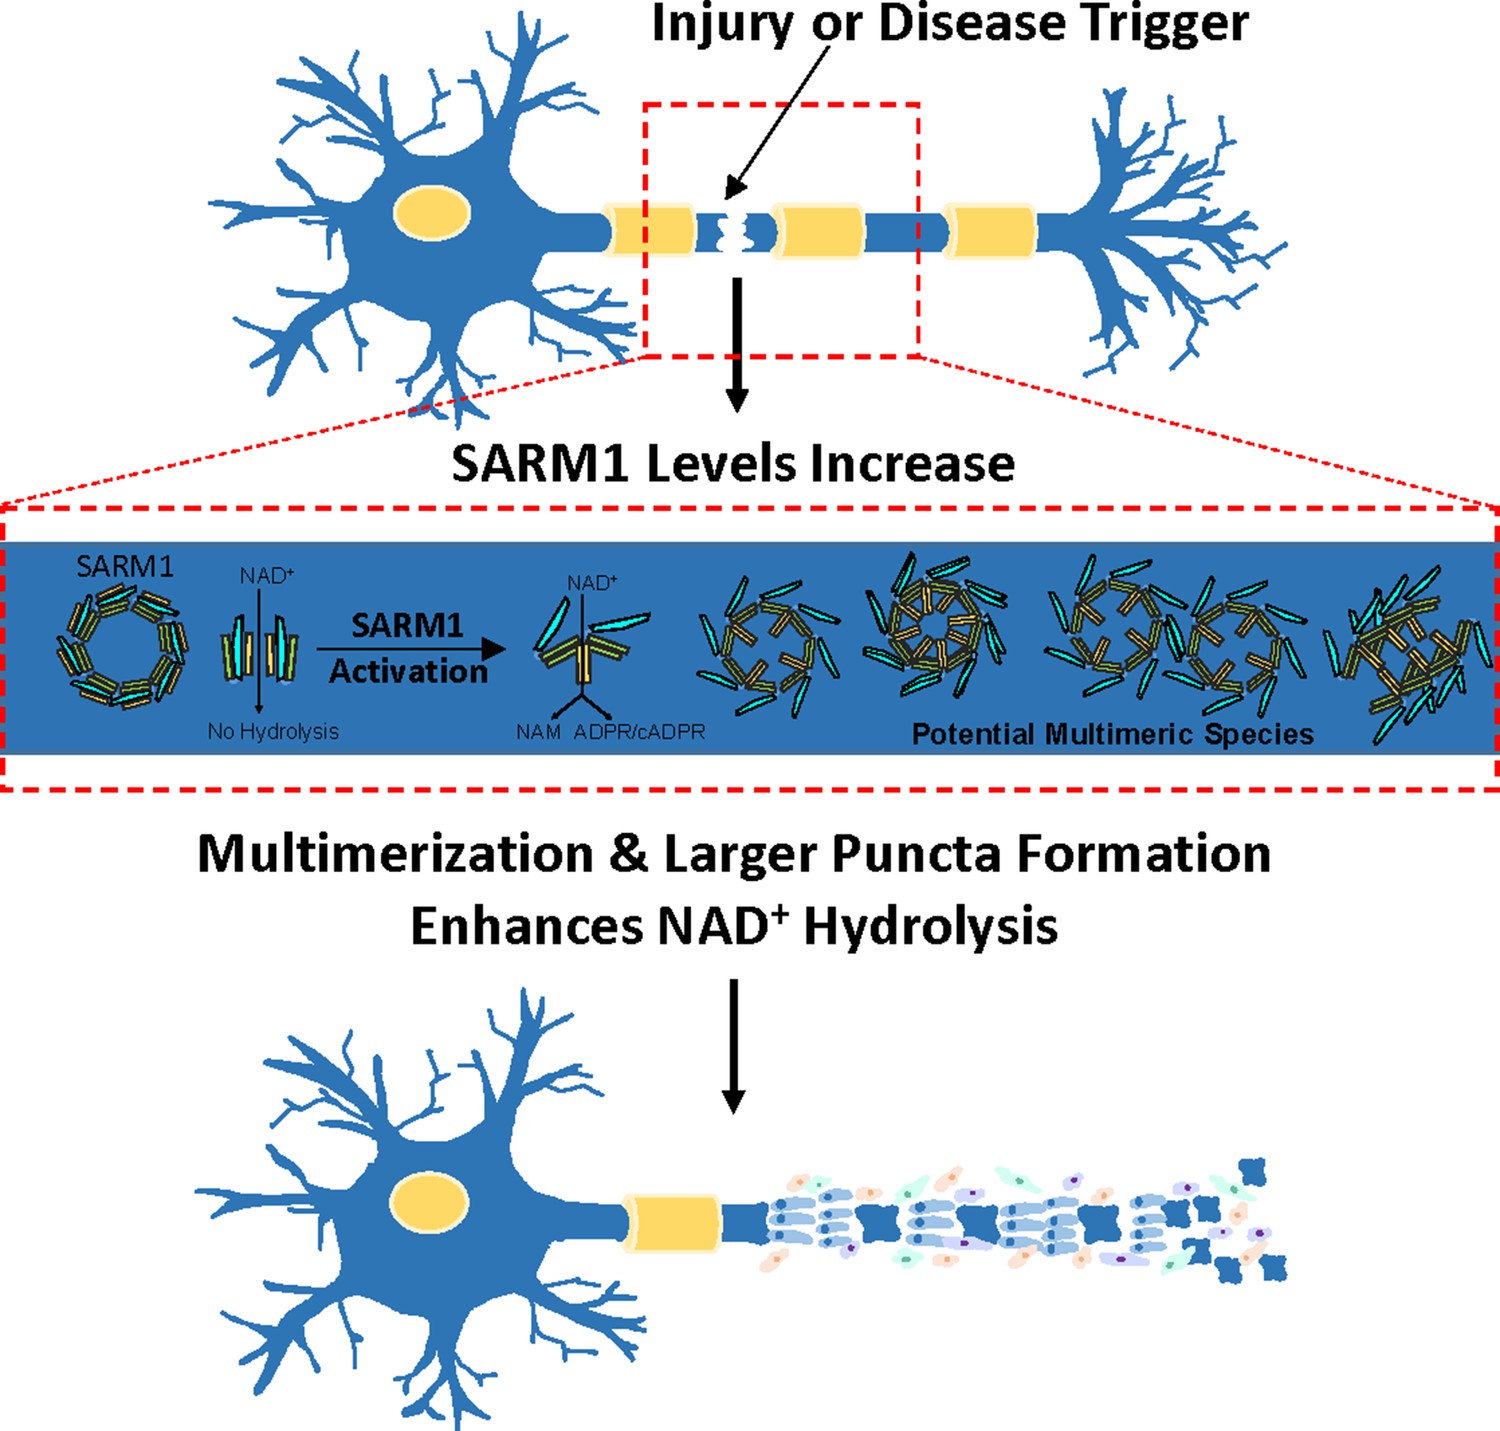
Model for precipitant-mediated enhancement in SARM1 activity and subsequent axonal fragmentation.
Tables
Table 1
Comparison of Inhibitor Potency.
Assays were performed in triplicate at SARM1 concentrations of 300 nMa, 20 µMb, and 2.5 µMc.
| Lysate IC50 (µM)a | Pure protein IC50 (µM)b | Pure protein + PEG IC50 (µM)c | |
|---|---|---|---|
| Zinc | 10 ± 3 | 10 ± 1 | 10 ± 1 |
| Berberine Chloride | 140 ± 20 | 140 ± 20 | 140 ± 30 |
Table 2
Comparison of steady-state kinetic parameters for the SARM1 TIR domain.
| 2.5 µM PEG | Lysate* | On-Bead* | Literature† | |
|---|---|---|---|---|
| Km (µM) | 230 ± 30 | 40 ± 10 | 28 ± 6 | 24 |
| kcat (s−1) | 0.51 ± 0.01 | 0.06 ± 0.03 | 0.04 ± 0.03 | 0.17 |
| kcat/Km (M−1s−1) | 2200 ± 30 | 1500 ± 300 | 1500 | 7083 |
-
†Reported by Essuman et al., 2017 with SARM1 on-bead by LC-MS.
Appendix 1—key resources table
| Reagent type (species) or resource | Designation | Source or reference | Identifiers | Additional information |
|---|---|---|---|---|
| Chemical compound, drug | 1,6–Hexanediol | Sigma Aldrich | 240117 | |
| Chemical compound, drug | 3–acetylpyridine adenine dinucleotide | Sigma Aldrich | A5251 | |
| Chemical compound, drug | 7–AAD | Thermo Fisher | A1310 | |
| Chemical compound, drug | ADPR | Sigma Aldrich | A0752 | |
| Recombinant DNA reagent | ADPR cyclase | Sigma Aldrich | A9106, C7344 | |
| Chemical compound, drug | ADP | Sigma Aldrich | A2754 | |
| Chemical compound, drug | ATP | Sigma Aldrich | A1852 | |
| Chemical compound, drug | Berberine chloride | Sigma Aldrich | B–3251; PHR1502 | |
| Cell line (Escherichia coli) | C43 (DE3) | Sigma Aldrich | CMC0019 | |
| Chemical compound, drug | Cadmium Chloride | Sigma Aldrich | 202908 | |
| Chemical compound, drug | cADPR | Sigma Aldrich | C7344 | |
| Chemical compound, drug | Calcium Chloride | Sigma Aldrich | C1016 | |
| Chemical compound, drug | Cobalt (II) Chloride | Sigma Aldrich | 60818 | |
| Chemical compound, drug | Copper (II) Chloride | Sigma Aldrich | 203149 | |
| Chemical compound, drug | Dextran | Fisher Scientific | ICN16011010 | |
| Chemical compound, drug | DMEM | Sigma Aldrich | SLM–241 | |
| Chemical compound, drug | EDTA | Sigma Aldrich | E9884 | |
| Chemical compound, drug | FAD | Sigma Aldrich | F6625 | |
| Chemical compound, drug | Glycerol | Sigma Aldrich | G5516 | |
| Chemical compound, drug | GTP | Sigma Aldrich | 10106399001 | |
| Chemical compound, drug | IPTG | Sigma Aldrich | I6758 | |
| Chemical compound, drug | Kanamycin | Research Products International | 25389–94–0 | |
| Chemical compound, drug | Lipofectamine 2000 | Thermo Fisher | 11668027 | |
| Chemical compound, drug | Magnesium Chloride | Sigma Aldrich | M8266 | |
| Chemical compound, drug | Manganese (II) Chloride | Sigma Aldrich | 244589 | |
| Chemical compound, drug | NAD | Sigma Aldrich | N0632 | |
| Chemical compound, drug | NADH | Sigma Aldrich | N4505 | |
| Chemical compound, drug | NADP | Sigma Aldrich | NADP–RO | |
| Commercial assay, kit | NEBNextMaster Mix | New England BioLabs | M0541L | |
| Chemical compound, drug | Nickel (II) Chloride | Sigma Aldrich | 339350 | |
| Chemical compound, drug | Nicotinamide | Sigma Aldrich | 72340 | |
| Chemical compound, drug | Nicotinamide 1,N6–ethenoadenine dinucleotide NAD+ | Sigma Aldrich Sigma Aldrich | N2630 N0632 | |
| Chemical compound, drug | Nicotinamide hypoxanthine dinucleotide | Sigma Aldrich | N6506 | |
| Chemical compound, drug | Nicotinamide hypoxanthine dinucleotide, reduced form | Sigma Aldrich | N6756 | |
| Chemical compound, drug | Nicotinic acid adenine dinucleotide | Sigma Aldrich | N4256 | |
| Commercial assay, kit | OPTIMEM | Thermo Fisher | 31985062 | |
| Chemical compound, drug | PEG 400 | Sigma Aldrich | 1546445 | |
| Chemical compound, drug | PEG 1500 | Sigma Aldrich | 10783641001 | |
| Chemical compound, drug | PEG 3350 | Sigma Aldrich | 1546547 | |
| Chemical compound, drug | PEG 8000 | Sigma Aldrich | 1546605 | |
| Commercial assay, kit | Pierce EDTA–free protease inhibitor tablets | Thermo Fisher Scientific | A32955 | |
| Chemical compound, drug | Sodium citrate | Sigma Aldrich | W302600 | |
| Commercial assay, kit | Streptacin XT | IBA Life Sciences | 2–4010–025 | |
| Peptide, recombinant protein | IRDye labeled Streptavidin | LI–COR Biosciences | 926–68079 Lot #C60504–02 | IR Dye 680RD (1:20,000) |
| Chemical compound, drug | Thionicotinamide adenine dinucleotide | Sigma Aldrich | T7375 | |
| Chemical compound, drug | Zinc Chloride | Sigma Aldrich | 229997 | |
| Gene | pET30a+ Strep–TIR | Loring et al., 2020a | ||
| Recombinant DNA reagent | pcDNA3.1(+) GFP SARM1 SAMTIR | This study | GFP– GGSG linker – SARM1 SAMTIR, Residues 412–724 (Uniprot) | |
| Recombinant DNA reagent | pET30a+ Strep-ceTIR-HIS | Loring et al., 2020a | ||
| Recombinant DNA reagent | pMAL-c2X MBP-ceSAMTIR | This study. | MBP – Factor Xa – TIR-1a SAMTIR, Residues 557–930 (Wormbase) | |
| Sequence-based reagent | Y568A For | IDT | GATGTGTTCATCAGCGCGCGTCGTAACAGC | |
| Sequence-based reagent | Y568A Rev | IDT | CTACACAAGTAGTCGCGCGCAGCATTGTCG | |
| Sequence-based reagent | Y568F For | IDT | GATGTGTTCATCAGCTTCCGTCGTAACAGC | |
| Sequence-based reagent | Y568F Rev | IDT | CTACACAAGTAGTCGAAGGCAGCATTGTCG | |
| Sequence-based reagent | D594A For | IDT | GGCTTCAGCGTGTTCATCGCTGTTGAAAAA | |
| Sequence-based reagent | D594A Rev | IDT | CGCCTCCAGTTTTTCAACAGCGATGAACAC | |
| Sequence-based reagent | G601P For | IDT | GAAAAACTGGAGGCGCCAAAGTTCGAGGAC | |
| Sequence-based reagent | G601P Rev | IDT | CTTTTTGACCTCCGCGGTTTCAAGCTCCTG | |
| Sequence-based reagent | D627A For | IDT | CTGAGCCCGGGTGCGCTGGCTAAGTGTATG | |
| Sequence-based reagent | D627A Rev | IDT | GTGGTCCTGCATACACTTAGCCAGCGCACCCGG | |
| Sequence-based reagent | K628A For | IDT | AGCCCGGGTGCGCTGGATGCGTGTATG | |
| Sequence-based reagent | K628A Rev | IDT | ATCGTGGTCCTGCATACACGCATCCAGCGC | |
| Sequence-based reagent | C629A For | IDT | GCGCTGGATAAGGCTATGCAGGACCACGAT | |
| Sequence-based reagent | C629A Rev | IDT | CGCGACCTATTCCGATACGTCCTGGTGCTA | |
| Sequence-based reagent | C629S For | IDT | GCGCTGGATAAGAGCATGCAGGACCACGAT | |
| Sequence-based reagent | C629S Rev | IDT | CGCGACCTATTCTCGTACGTCCTGGTGCTAACGATGC | |
| Sequence-based reagent | C635A For | IDT | TAAGGACTGGGTGCACAAAGAAATCG | |
| Sequence-based reagent | C635A Rev | IDT | TCCTTAGCATCGTGGTCCTGCATACACTTATCC | |
| Sequence-based reagent | C635S For | IDT | ATGCAGGACCACGATAGCAAGGACTGGGTG | |
| Sequence-based reagent | C635S Rev | IDT | TACGTCCTGGTGCTATCGTTCCTGACCCAC | |
| Sequence-based reagent | W638A For | IDT | GACCACGATTGCAAGGACGCGGTGCACAAA | |
| Sequence-based reagent | W638A Rev | IDT | GGTAACGATTTCTTTGTGCACCGCGTCCTTGCAAT | |
| Sequence-based reagent | H640A For | IDT | GATTGCAAGGACTGGGTGGCTAAAGAAATC | |
| Sequence-based reagent | H640A Rev | IDT | AGCGGTAACGATTTCTTTAGCCACCCA | |
| Sequence-based reagent | E642A For | IDT | TGGGTGCACAAAGCAATCGTTACCGCTCTG | |
| Sequence-based reagent | E642A Rev | IDT | ACCCACGTGTTTCGTTAGCAATGGCGAGAC | |
| Sequence-based reagent | E642Q For | IDT | AAGGACTGGGTGCACAAACAGATCGTT | |
| Sequence-based reagent | E642Q Rev | IDT | GCTCAGAGCGGTAACGATCTGTTTGTG | |
| Sequence-based reagent | H685A For | IDT | AACGGTATCAAGTGGAGCGCTGAATACCAG | |
| Sequence-based reagent | H685A Rev | IDT | CGCTTCCTGGTATTCAGCGCTCCA | |
| Sequence-based reagent | E686A For | IDT | GGTATCAAGTGGAGCCACGCTTACCAGGAA | |
| Sequence-based reagent | E686A Rev | IDT | GATGGTCGCTTCCTGGTAAGCGTGGCT | |
| Sequence-based reagent | Q688A For | IDT | AAGTGGAGCCACGAATACGCTGAAGCGAC | |
| Sequence-based reagent | Q688A Rev | IDT | TTTCTCGATGGTCGCTTCAGCGTATTCGTG | |
| Sequence-based reagent | SAMTIR E642A For | IDT | TGGGTGCATAAAGCAATTGTGA | |
| Sequence-based reagent | SAMTIR E642A Rev | IDT | GCGCGGTCACAATTGCTTT | |
| Sequence-based reagent | SAMTIR G601P For | IDT | ACTGGAAGCGCCCAAATTTGAA | |
| Sequence-based reagent | SAMTIR G601P Rev | IDT | TTCAAATTTGGGCGCTTCCAGT | |
| Sequence-based reagent | pMAL ceSAMTIR For | IDT | AAAAAAGGATCCATGGTGCCGGGTTGGACC | |
| Sequence-based reagent | pMAL ceSAMTIR Rev | IDT | AAAAAATCTAGATTAGTTACGGTCGCTGGTGGTGC |
Additional files
-
Source data 1
Source data corresponding to the panels shown in Figure 2, Figure 3, Figure 4, Figure 5, Figure 6, Figure 2—figure supplements 1 and 2, Figure 3—figure supplement 1, Figure 5—figure supplements 1–4, and Figure 6—figure supplement 1.
- https://cdn.elifesciences.org/articles/66694/elife-66694-data1-v2.xlsx
-
Supplementary file 1
Supplementary Tables.
(A) The Steady-State Kinetic Parameters for Pure Wild Type SARM1 TIR (10 µM) with Varied PEG. (B) The Steady-State Kinetic Parameters for Pure Wild Type SARM1 TIR with Varied Enzyme Concentration.
- https://cdn.elifesciences.org/articles/66694/elife-66694-supp1-v2.docx
-
Transparent reporting form
- https://cdn.elifesciences.org/articles/66694/elife-66694-transrepform-v2.pdf
Download links
A two-part list of links to download the article, or parts of the article, in various formats.
Downloads (link to download the article as PDF)
Open citations (links to open the citations from this article in various online reference manager services)
Cite this article (links to download the citations from this article in formats compatible with various reference manager tools)
A phase transition enhances the catalytic activity of SARM1, an NAD+ glycohydrolase involved in neurodegeneration
eLife 10:e66694.
https://doi.org/10.7554/eLife.66694


