Global analysis of cell behavior and protein dynamics reveals region-specific roles for Shroom3 and N-cadherin during neural tube closure
- Department of Molecular Biosciences, University of Texas at Austin, United States
Figures
Figure 1 with 1 supplement
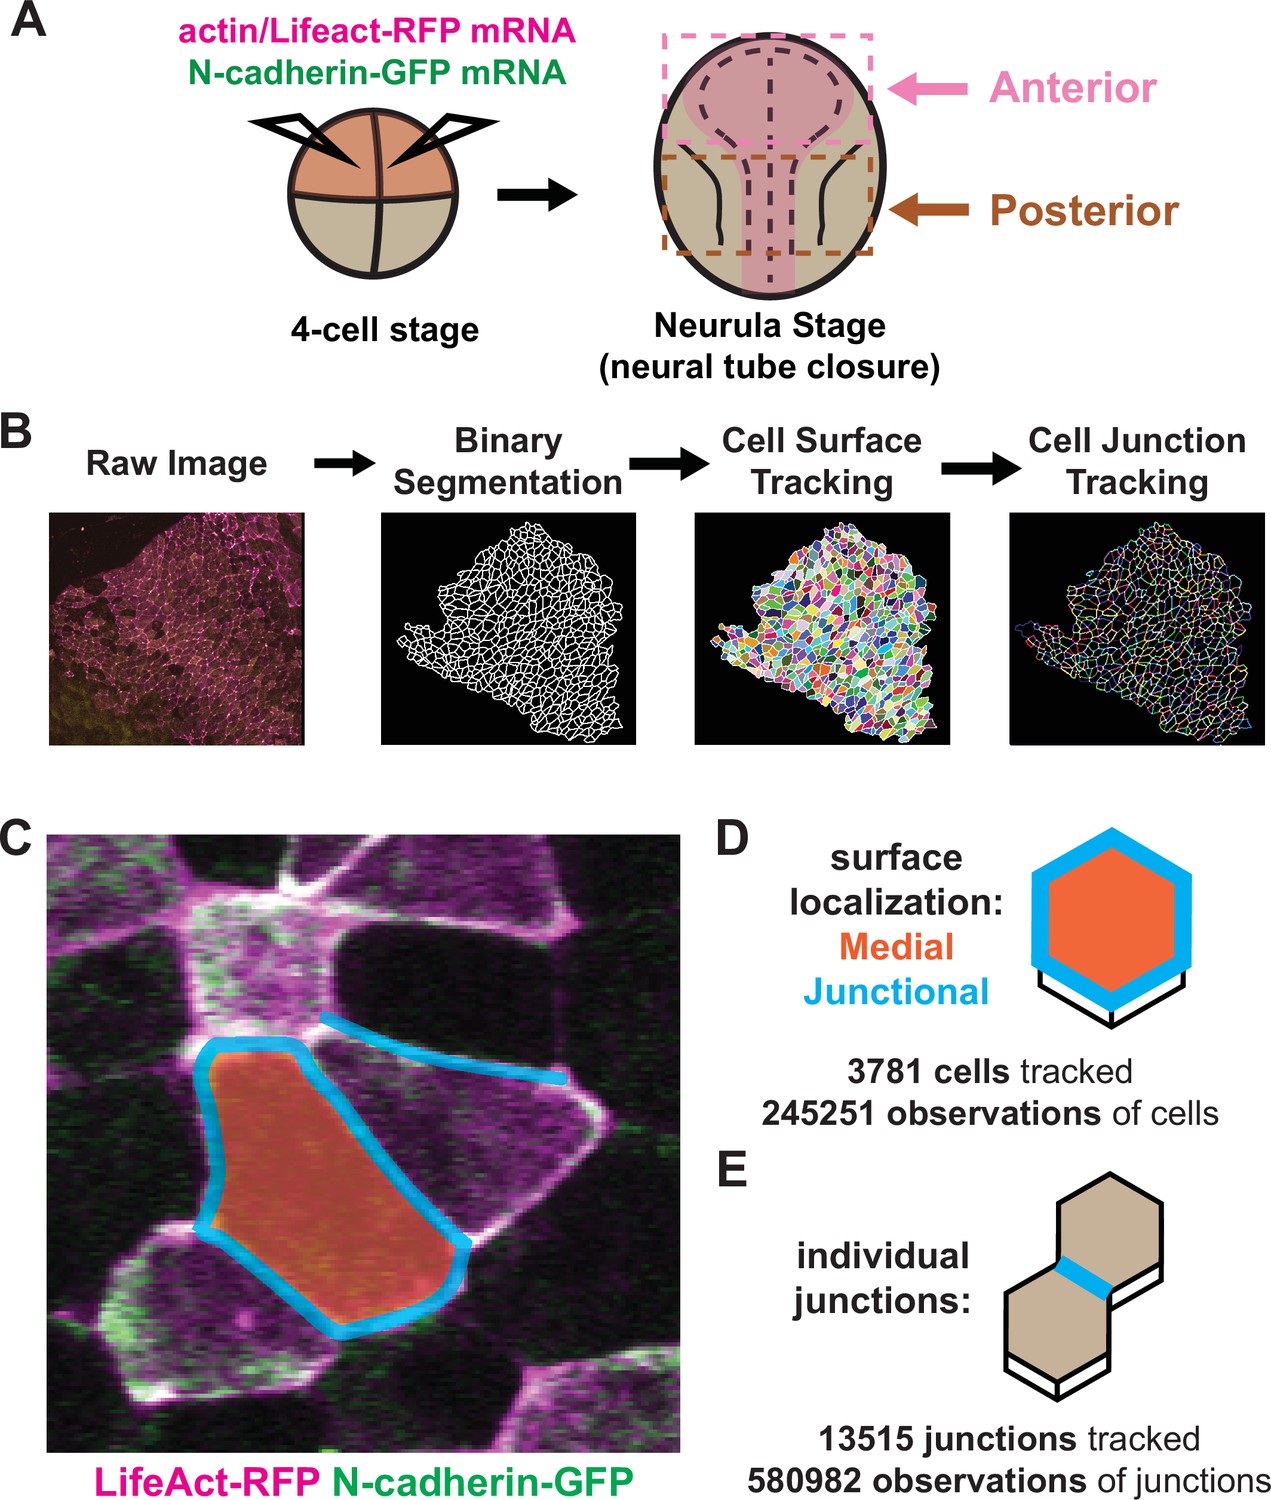
Tissue-level imaging and analysis of contractile protein dynamics during neural tube closure in Xenopus.
(A) Schematic of mRNA injections and subsequent imaged regions of the Xenopus tropicalis embryo. (B) Cell segmentation and tracking workflow. Binary segmentation, cell surface tracking, and cell junction tracking were all generated using Tissue Analyzer. (C) Example Xenopus cells with analyzed subcellular domains labeled. Orange label = medial, cyan labels = junctional/junctions. (D) Schematic and N values of whole cell measurements. (E) Schematic and N values of individual cell junction measurements.
Figure 1—figure supplement 1
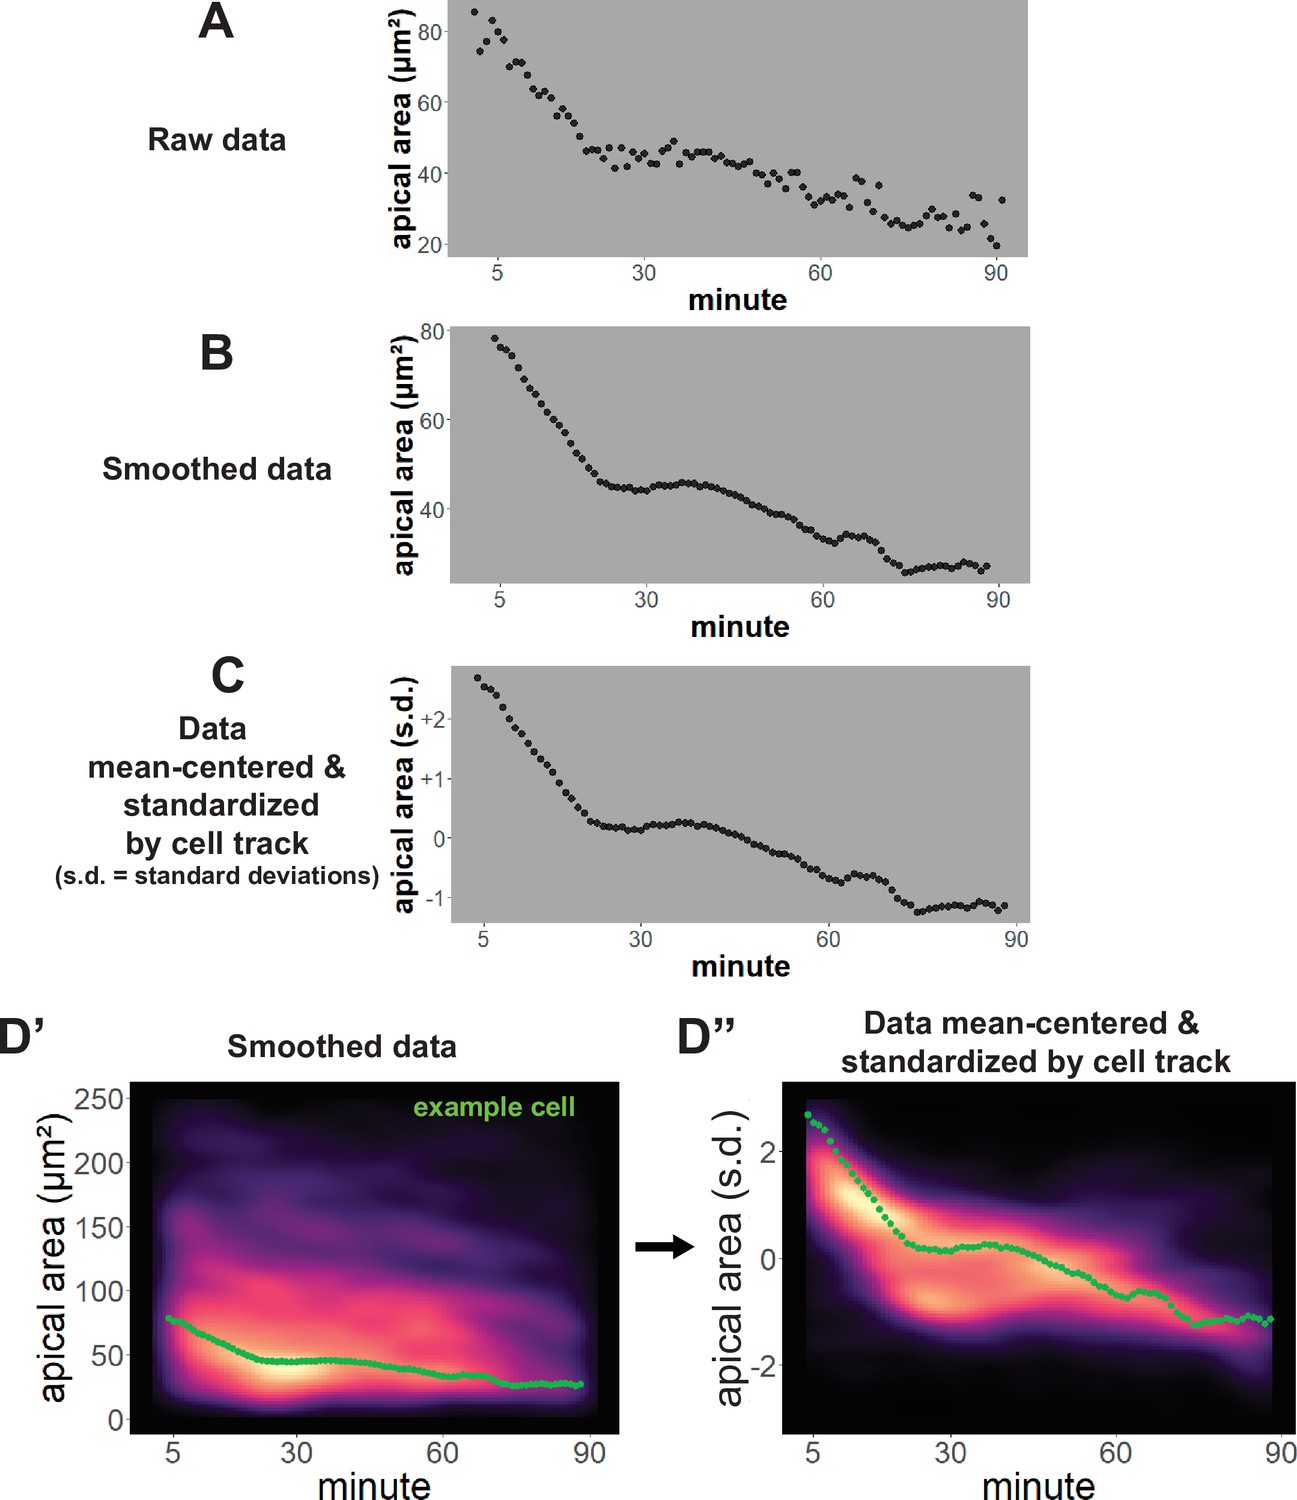
Per cell data processing and analysis.
(A) Raw data for apical area (converted to square microns) of an individual cell over time. (B) Apical area averaged/smoothed over 7 frames. (C) Smoothed data after mean-centering and standardization. (D’) Apical area (square microns) versus time of all cells from a control embryo displayed as a density plot. The green dots are from the same cell as displayed in B. (D”) The same cells as D’ after mean-centering and standardization of each cell track. The green dots are from the same cell as displayed in C. s.d. = standard deviations.
Figure 2
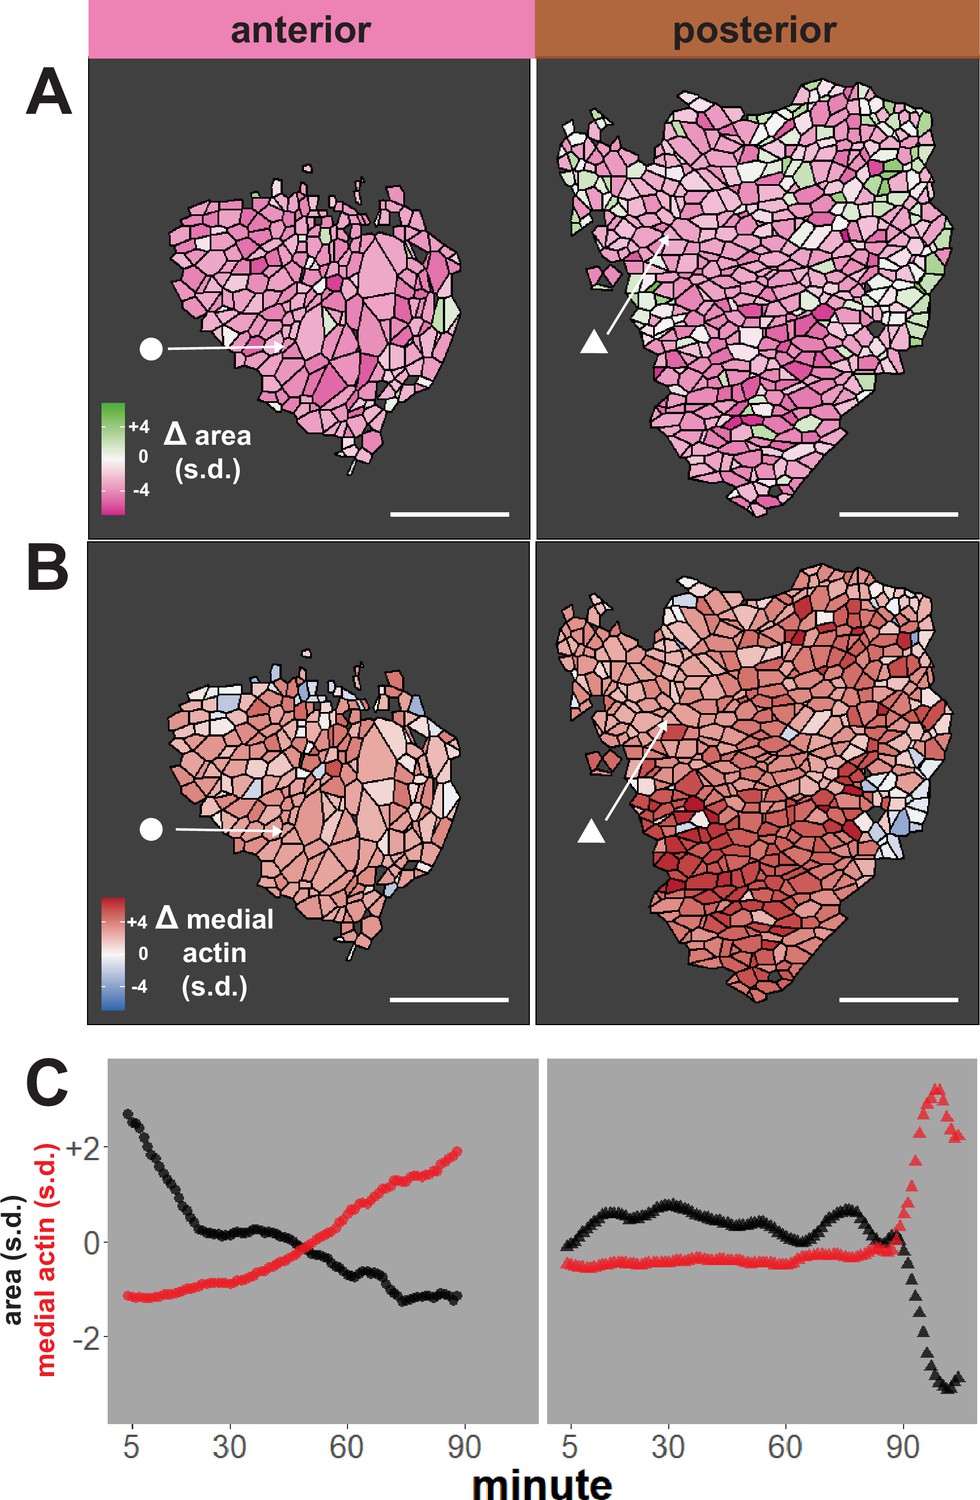
Tissue-level analysis of individual cell behaviors reveals dynamic heterogeneity.
(A) Overall change (Δ) in apical surface area (standardized) across anterior (left) and posterior (right) control embryos. (B) Overall change in medial LifeAct/actin localization (standardized) across anterior (left) and posterior (right) control embryos. Circle and triangle in A and B denote a representative cell for each embryo. Scale bars = 100 µm. (C) Standardized apical surface area (black) and medial actin (red) over time in representative cells from anterior (left/circle) and posterior (right/triangle). s.d. = standard deviation.
Figure 3 with 1 supplement
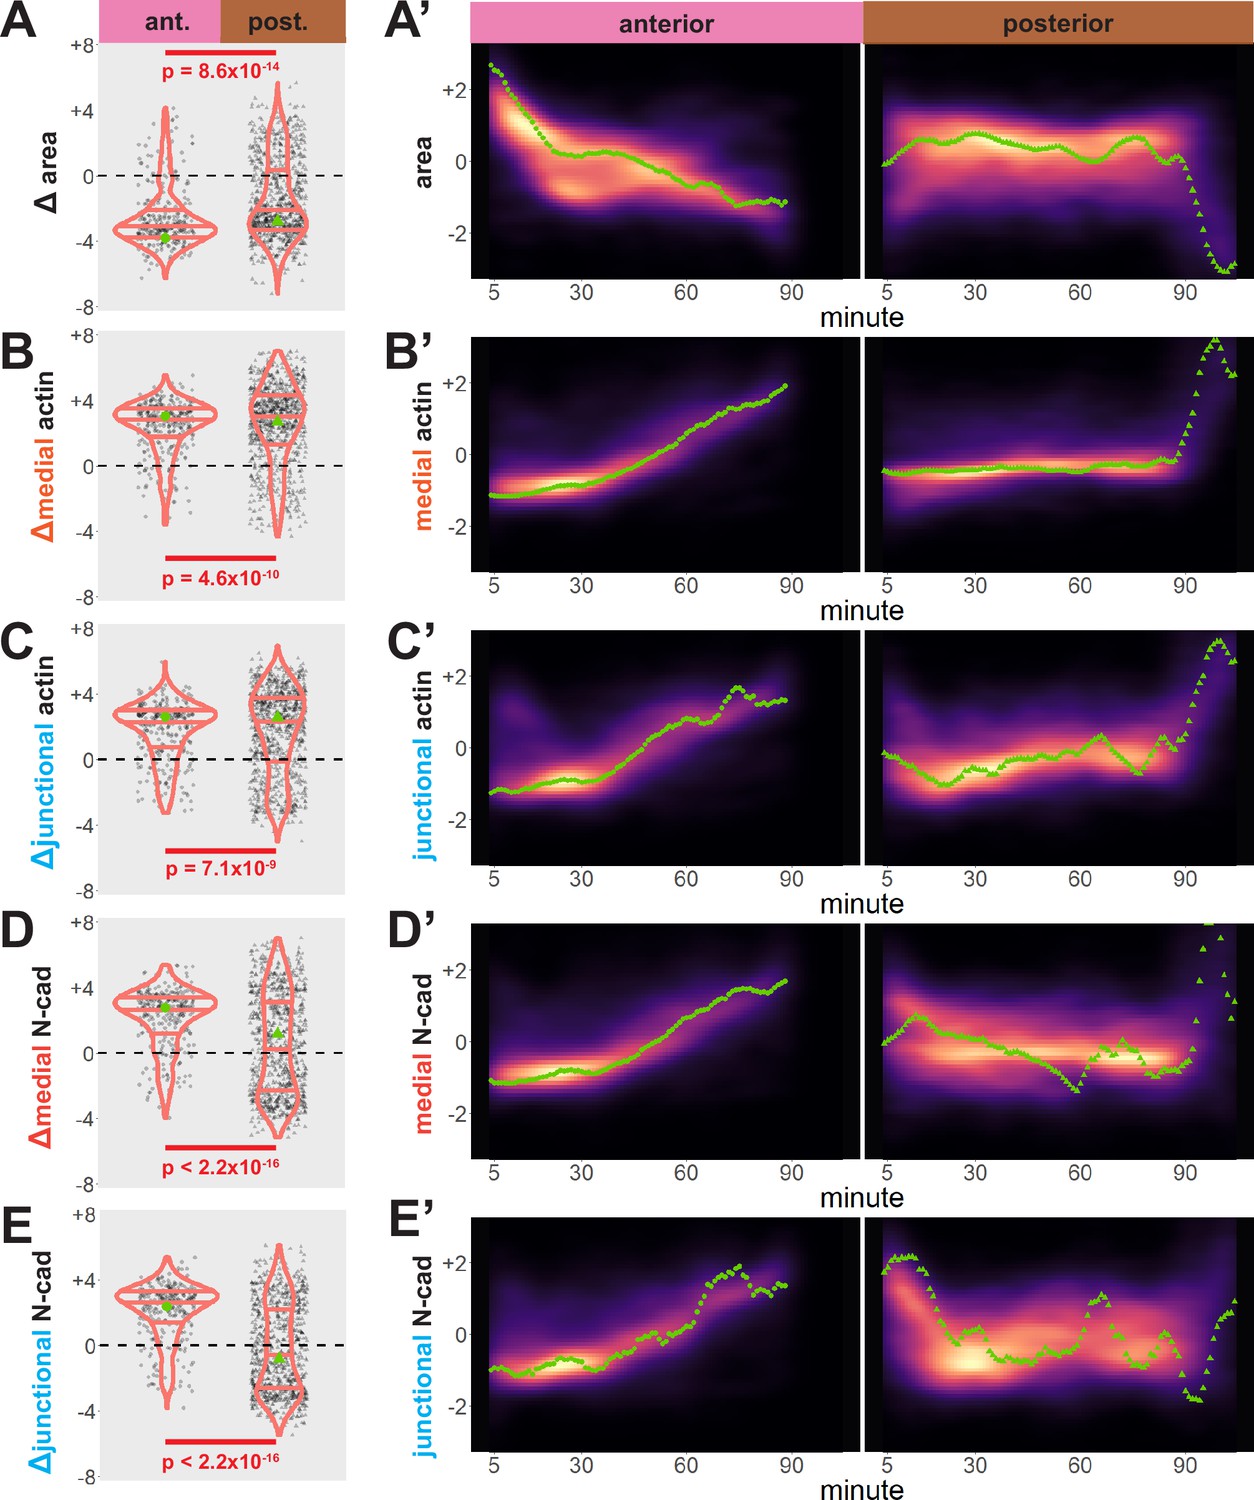
Cells in the anterior and posterior neural ectoderm both apically constrict but differ in their contractile protein dynamics.
Tissue-level cell size and protein localization dynamics from control embryos in Figure 2. (X) Distribution of overall change (Δ) in displayed parameter (standardized) among cells from control embryos. Horizontal lines on density plots/violins indicate quartiles of distribution. Black circles are individual cells. Statistical comparisons performed by Kolmogorov-Smirnov (KS) test. (X’) 2D density plots of standardized variable versus time for all observations/cells in each control embryo in Figure 2. Green points are measurements from the representative cells denoted in Figure 2. s.d. = standard deviation.
Figure 3—figure supplement 1
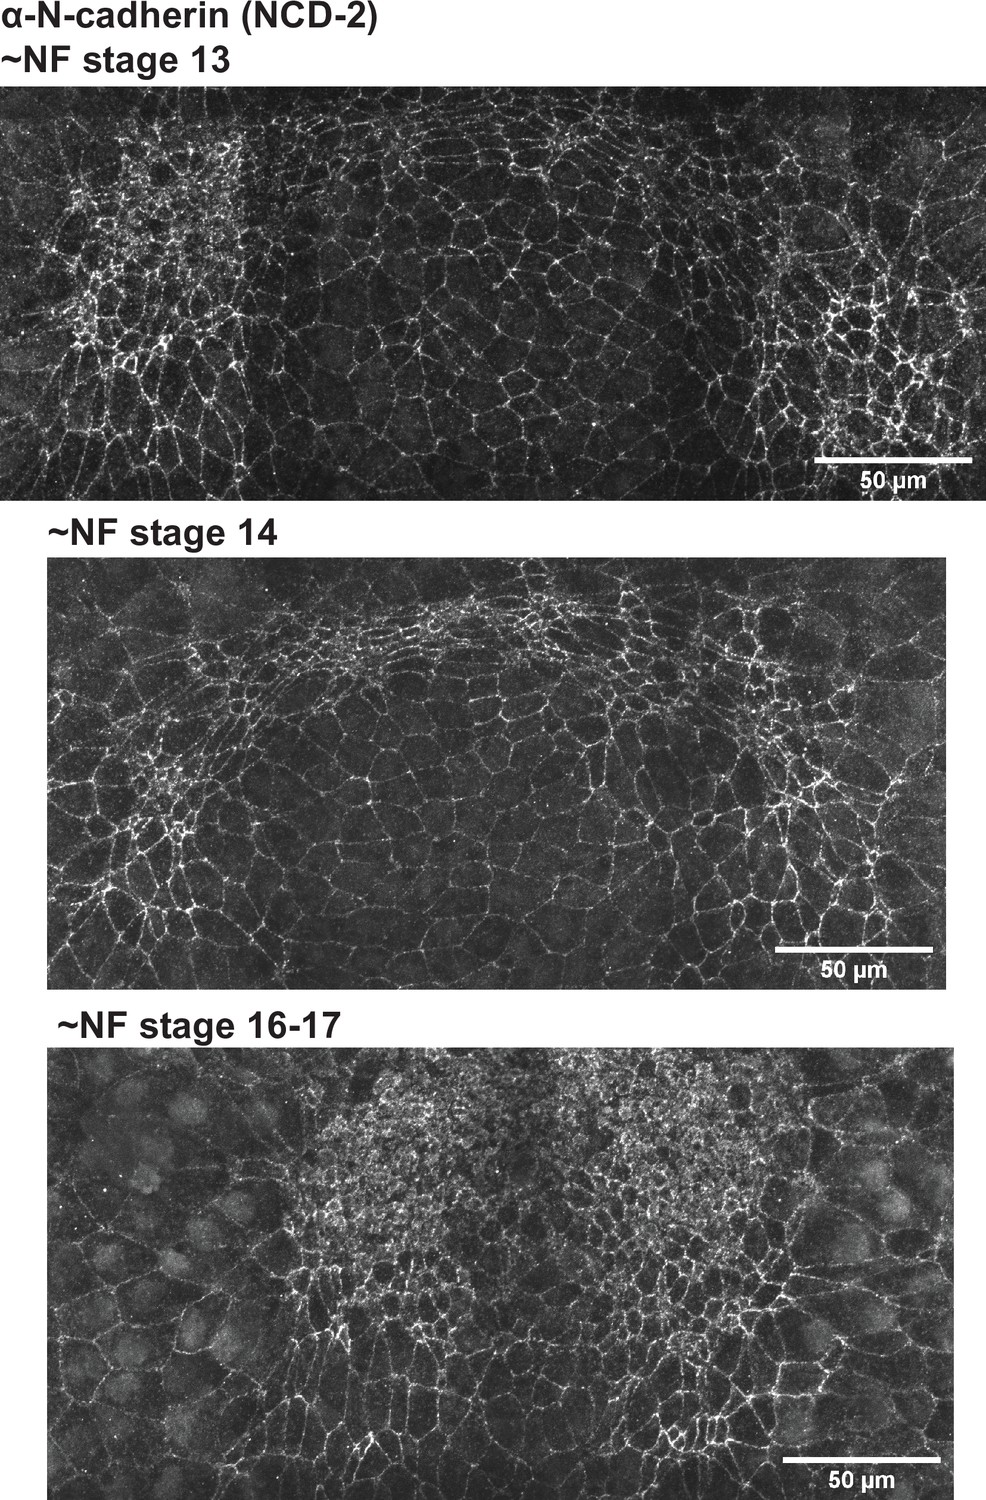
Endogenous N-cadherin location.
Xenopus tropicalis embryos were fixed in paraformaldehyde then stained with the monoclonal N-cadherin antibody mNCD-2. Increased medial N-cadherin localization is apparent as cells constrict.
Figure 4 with 1 supplement
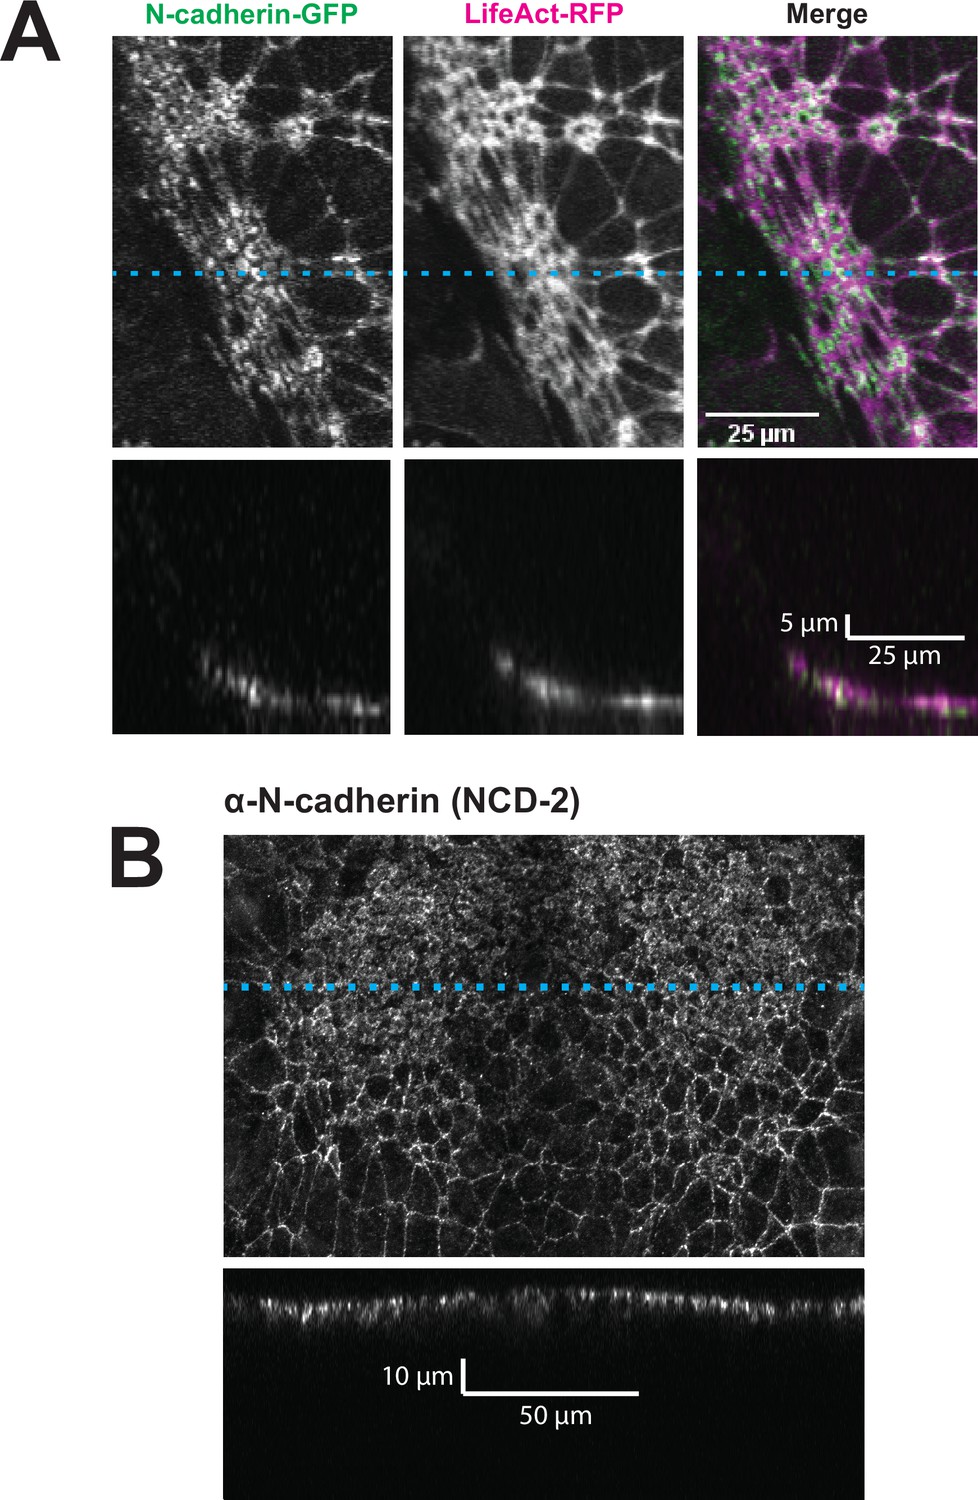
N-cadherin localizes both at the apical surface and basally as well.
(A) XY (top row) and XZ (bottom row) projections of N-cadherin-GFP and LifeAct-RFP in the anterior neural ectoderm of a Xenopus tropicalis embryo. (B) XY (top panel) and XZ (bottom panel) projections of NCD-2 (monoclonal α-N-cadherin antibody) in the anterior neural ectoderm of a X. tropicalis embryo. Dashed cyan lines marks the position of the XZ projection.
Figure 4—figure supplement 1
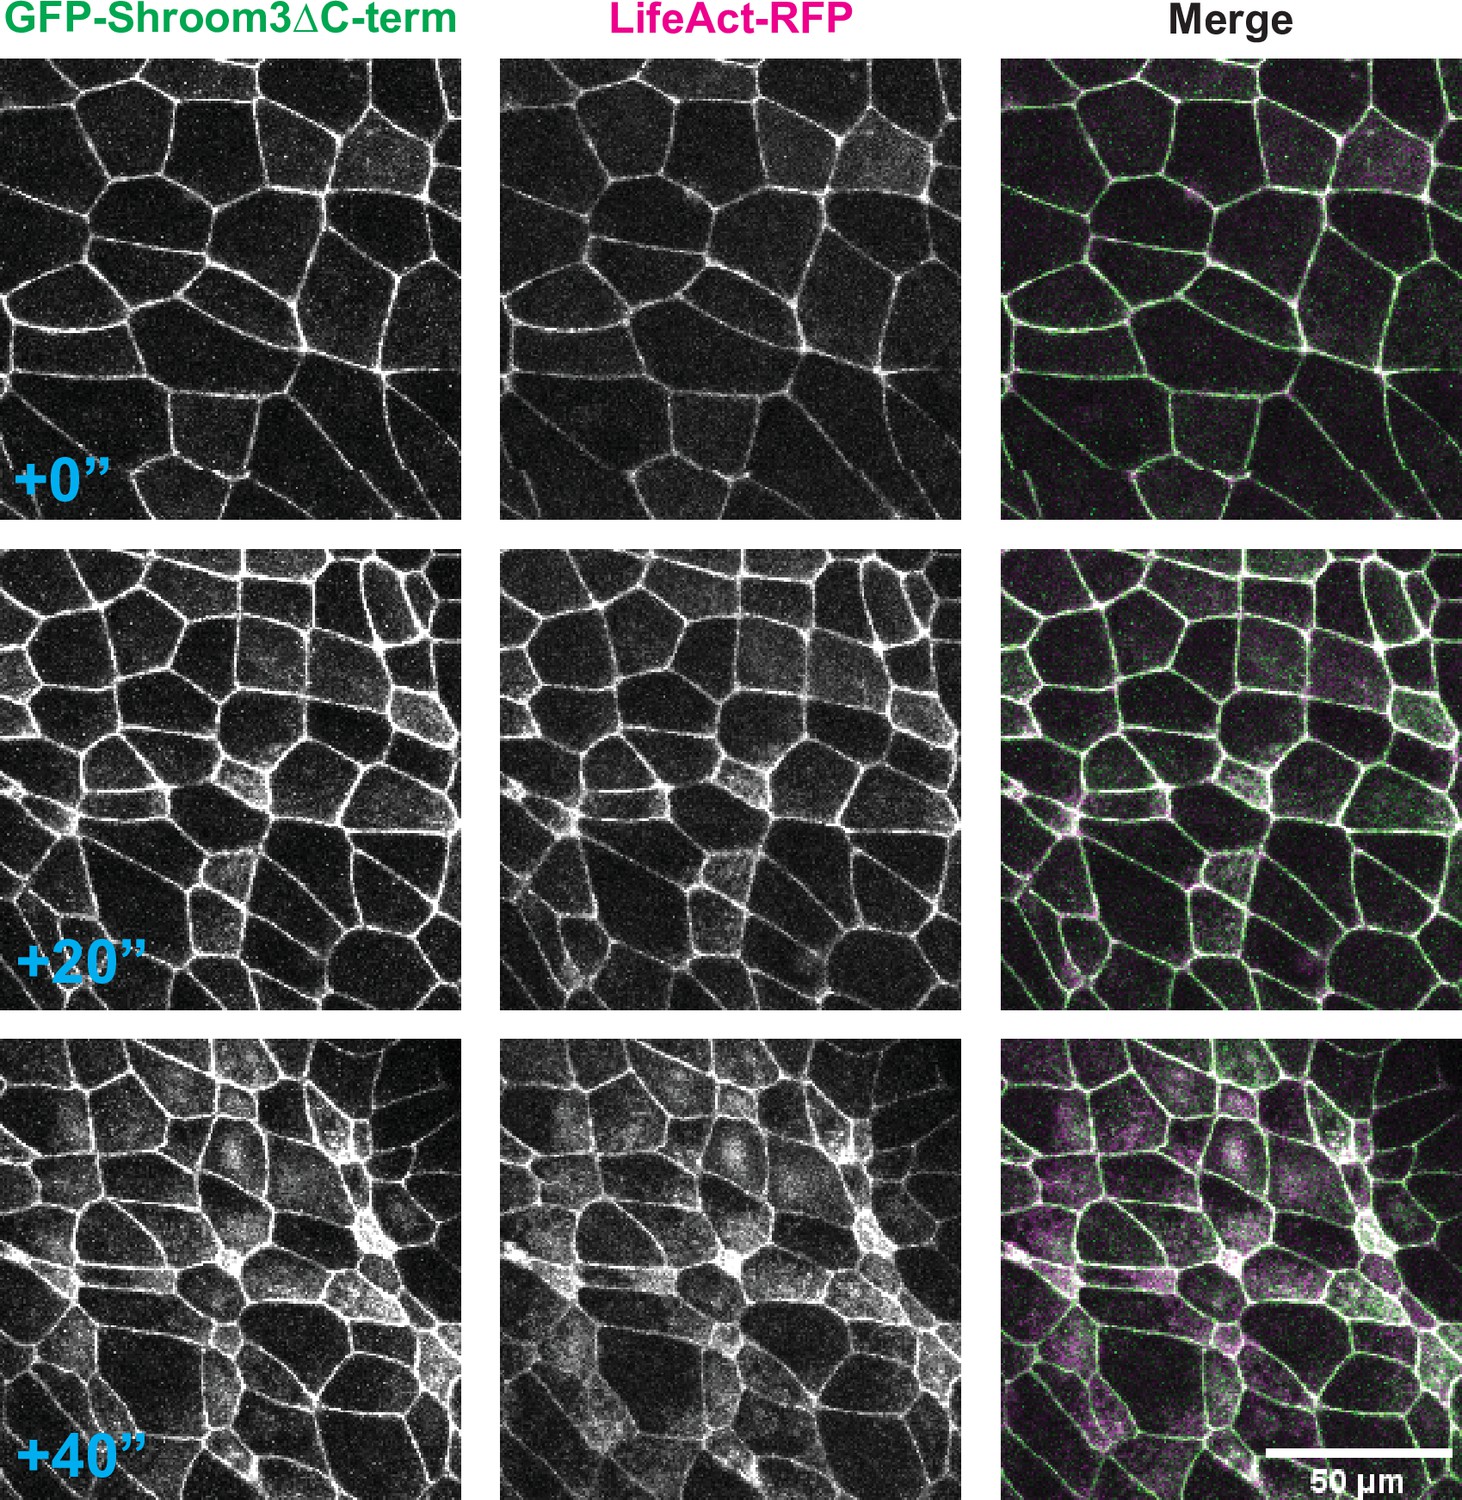
Shroom3ΔC-term colocalizes with LifeAct in the neural ectoderm.
Three time points of GFP-Shroom3ΔC-term and LifeAct-RFP in constricting neural ectoderm cells of a Xenopus embryo.
Figure 5 with 3 supplements
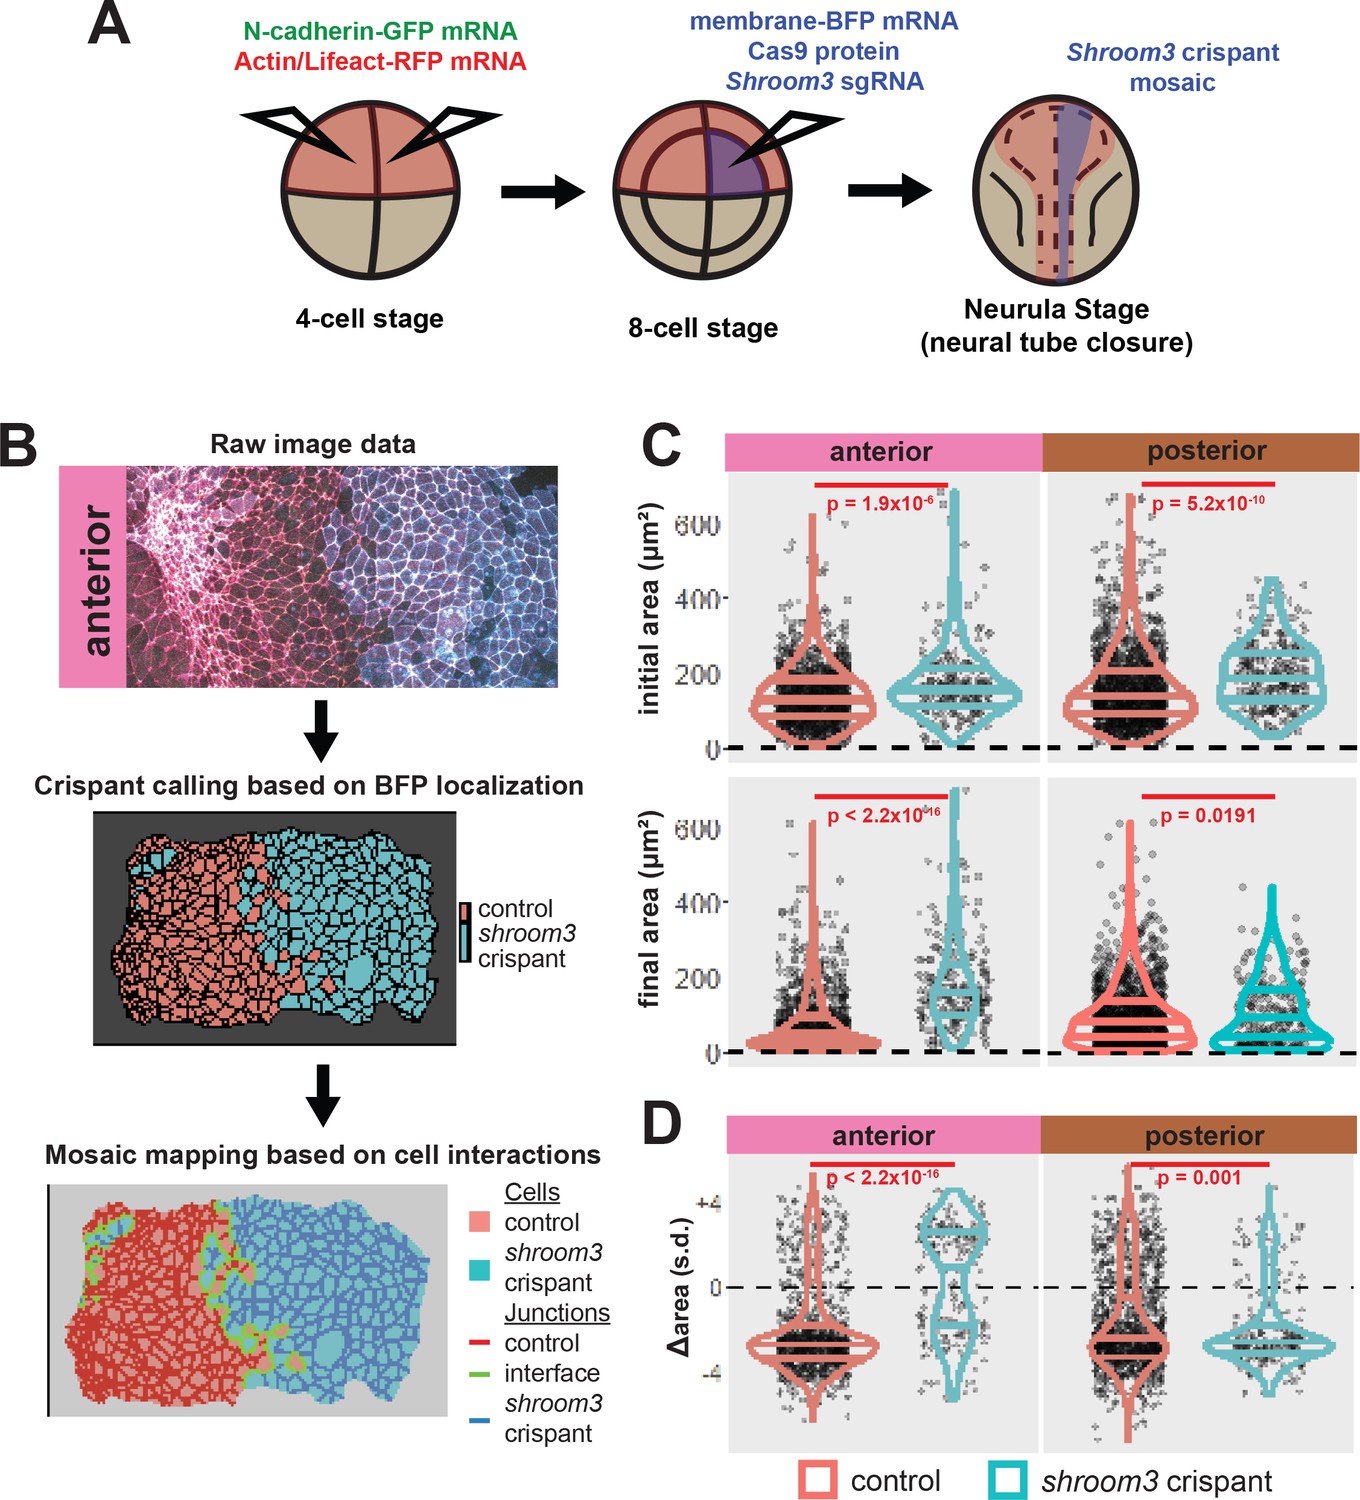
Disruption of shroom3 via mosaic F0 CRISPR mosaic causes differential apical constriction phenotypes between regions of the neural ectoderm.
(A) Schematic of mosaic F0 CRISPR/Cas9 injections in Xenopus tropicalis embryos. (B) Workflow of identification and analysis of mosaic F0 crispants. (C) Top row, distribution of initial area (square microns) of tracked cells from anterior (left) and posterior (right) embryos. Lower row, distribution of final area (square microns) of tracked cells. (D) Distribution of overall change (Δ) in apical area (standardized) from all cells/embryos. In C and D, horizontal lines on density plots/violins indicate quartiles of distribution. Black circles are individual cells. Statistical comparisons performed by Kolmogorov-Smirnov (KS) test. Cells situated along the mosaic interface were excluded from these analyses. s.d. = standard deviation.
Figure 5—figure supplement 1
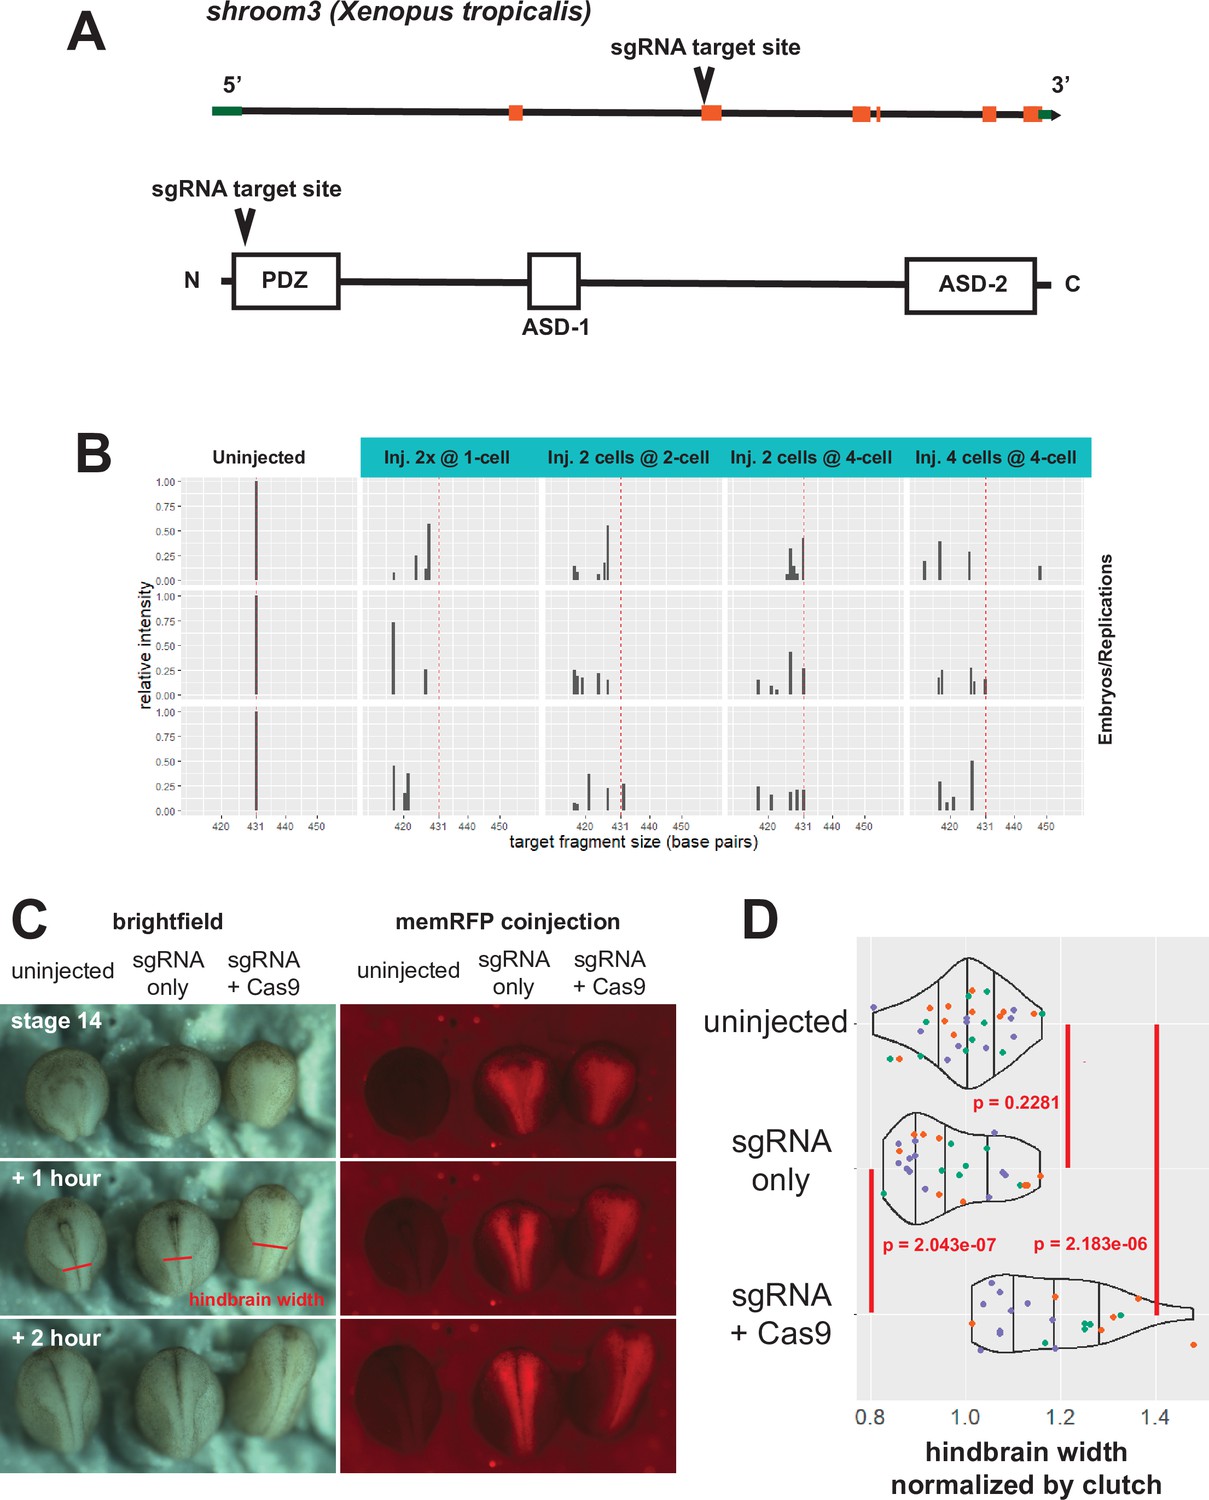
shroom3 CRISPR validation.
(A) Gene model for shroom3 in Xenopus tropicalis per Xenbase. The sgRNA was designed to target the 5’ end of the second exon. (B) Fragment analysis to validate efficacy of sgRNA+ Cas9 injections. A 431 base pair genomic fragment of shroom3 at the sgRNA target site was generated by PCR from whole embryo lysates and subjected to capillary electrophoresis. Uninjected embryos that did not receive CRISPR reagents showed one band at 431 base pairs (left column, red dashed line). Embryos injected with shroom3 sgRNA+ Cas9 protein at various times and frequencies are displayed in right-hand columns, with the wild-type fragment size indicated by the red dashed line. Relative frequency of wild-type shroom3 fragment size is severely reduced in injected embryos. Each plot represents one embryo. (C) sgRNA controls. Embryos were injected with shroom3 sgRNA alone or sgRNA plus Cas9 protein into the dorsal blastomere at the 8-cell stage, as in the imaging experiments. Membrane-RFP mRNA was used as injection/lineage tracer. Red line segments indicate the posterior boundary of the hindbrain, which was used to calculate values in D. (D) Quantification of sgRNA controls. Hindbrain widths were measured at approximately stage 17 as indicated in C. Colors of individual points indicate clutch membership of each embryo. An average width of the hindbrain of uninjected embryos of each clutch was calculated, then all embryos in each clutch had their hindbrain width calculated as a ratio of that average. Density distribution violins were then calculated based on pooled clutches. Vertical lines on density plots/violins indicate quartiles of distribution. Statistical tests were calculated using t-test.
Figure 5—figure supplement 2
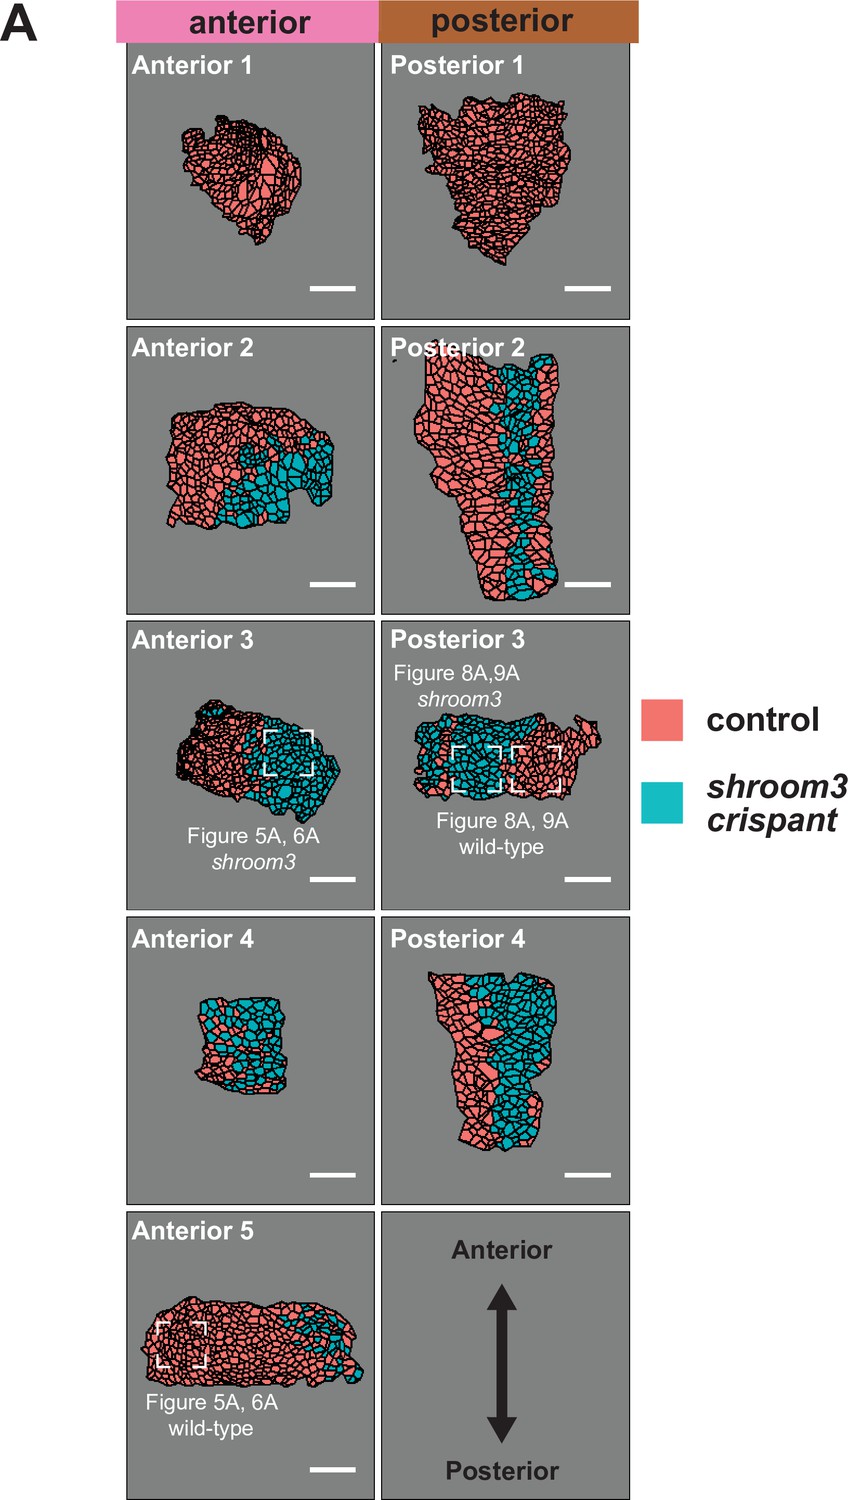
Maps of initial frames and shroom3 crispant calls for each analyzed embryo.
Figure 5—figure supplement 3
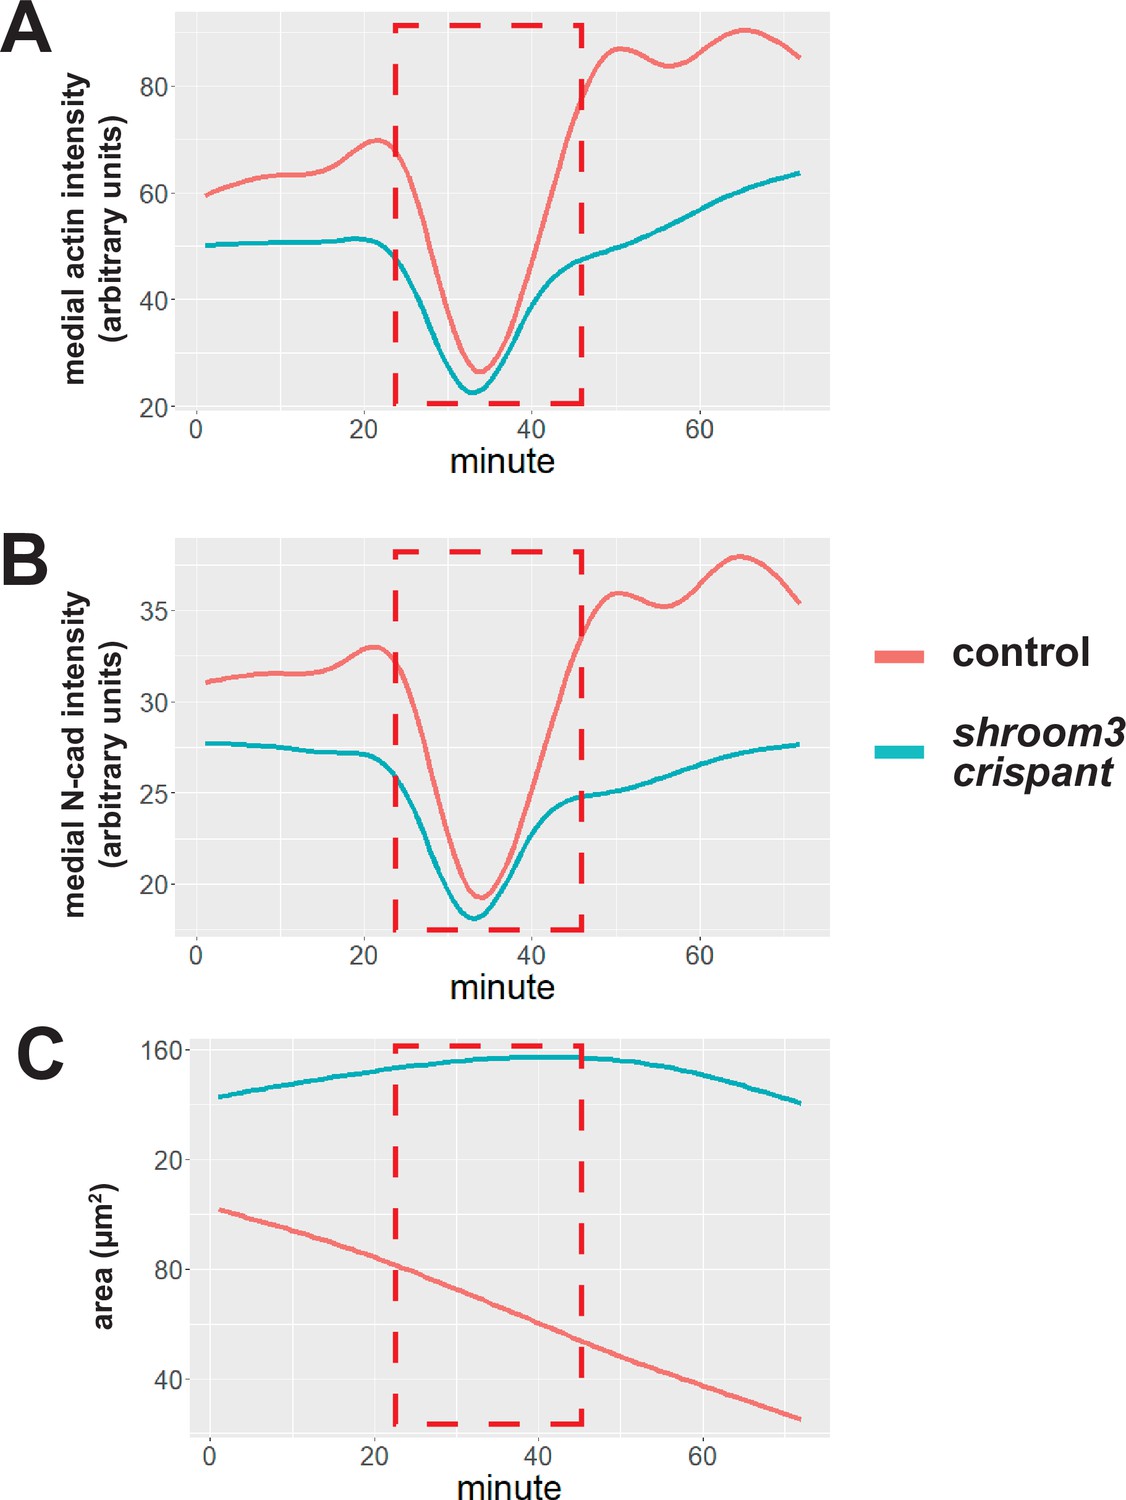
Fluorescent aberration in an anterior-imaged embryo.
(A) Smoothed mean of medial LifeAct-RFP/actin fluorescent intensity across all imaged cells across time. (B) Smoothed mean of medial N-cadherin-GFP fluorescent intensity across all imaged cells across time. (C) Smoothed mean of apical surface area across all imaged cells across time. Red dashed box indicates frames where fluorescence values dropped temporarily. Cells were tracked through these frames, but the frames were removed from analyses of this embryo.
Figure 6
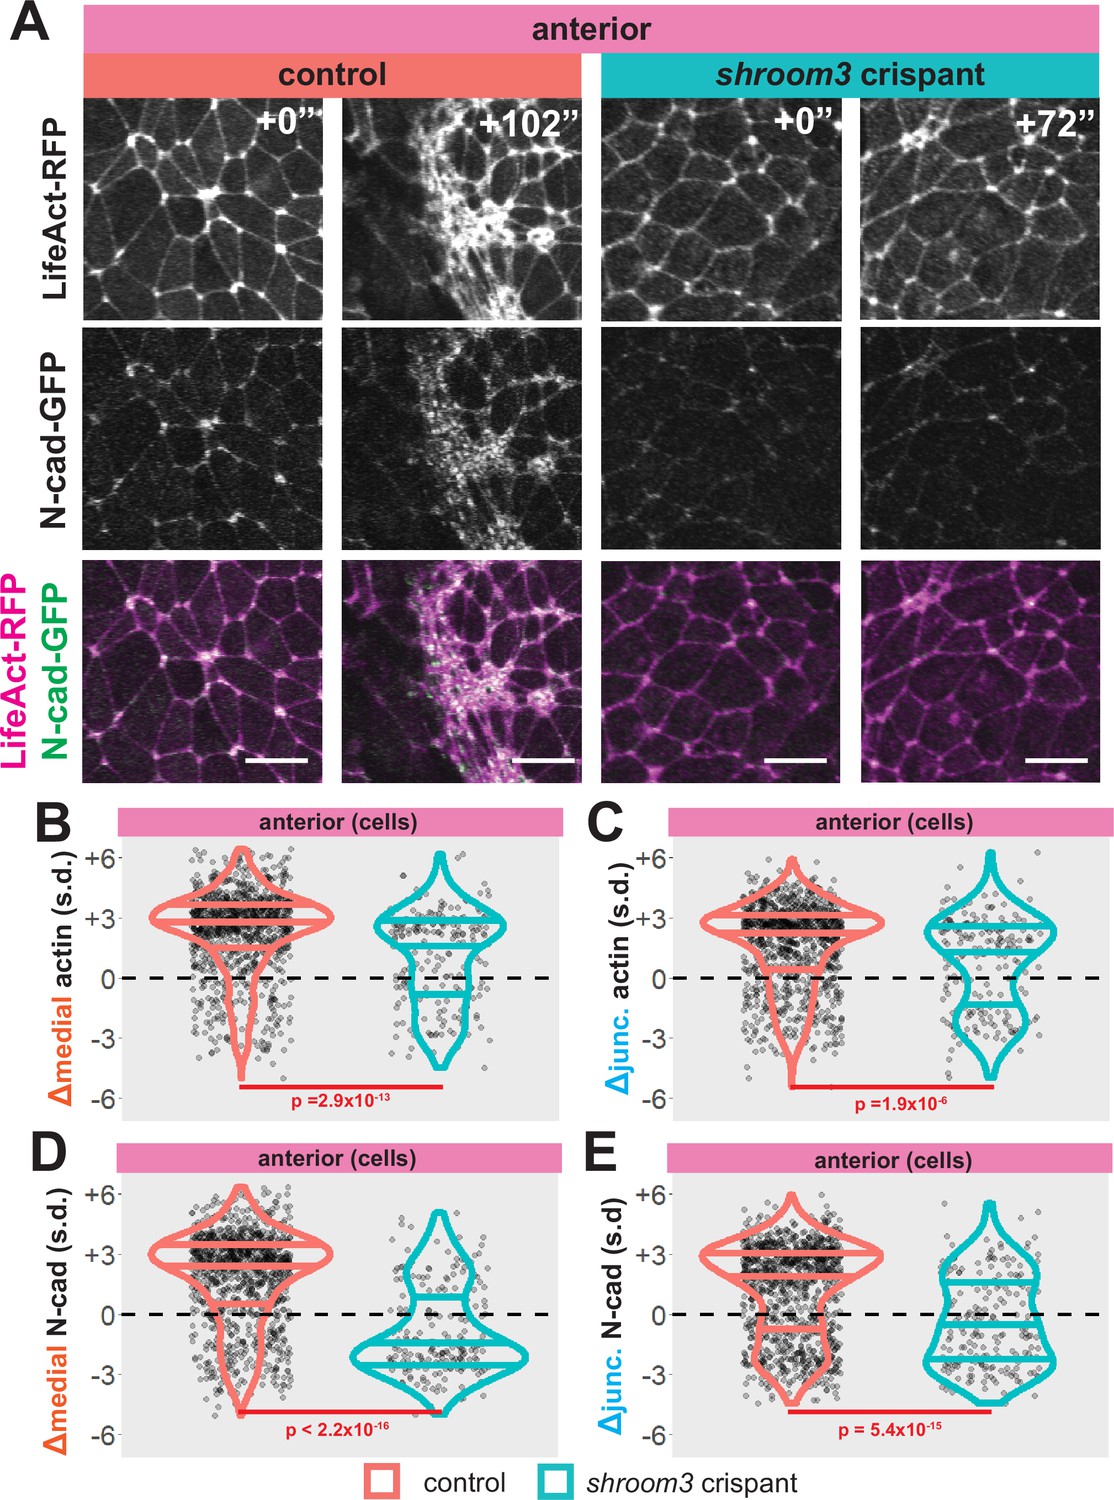
Loss of shroom3 disrupts actin and N-cadherin accumulation and constriction in the anterior neural ectoderm.
(A) Representative images of LifeAct/actin and N-cadherin-GFP (N-cad-GFP) localization in control cells (left) and shroom3 crispant cells (right) from the anterior region of the neural ectoderm. Scale bar = 15 µm. (B) Distribution of overall change (Δ) in medial LifeAct/actin (standardized) from anterior cells. (C) Distribution of overall change (Δ) in junctional LifeAct/actin (standardized) from anterior cells. (D) Distribution of overall change (Δ) in medial N-cadherin (standardized) from anterior cells. (E) Distribution of overall change (Δ) in junctional N-cadherin-GFP (standardized) from anterior cells. In B-E, horizontal lines on density plots/violins indicate quartiles of distribution, black circles are individual cells, and statistical comparisons performed by Kolmogorov-Smirnov (KS) test.
Figure 7
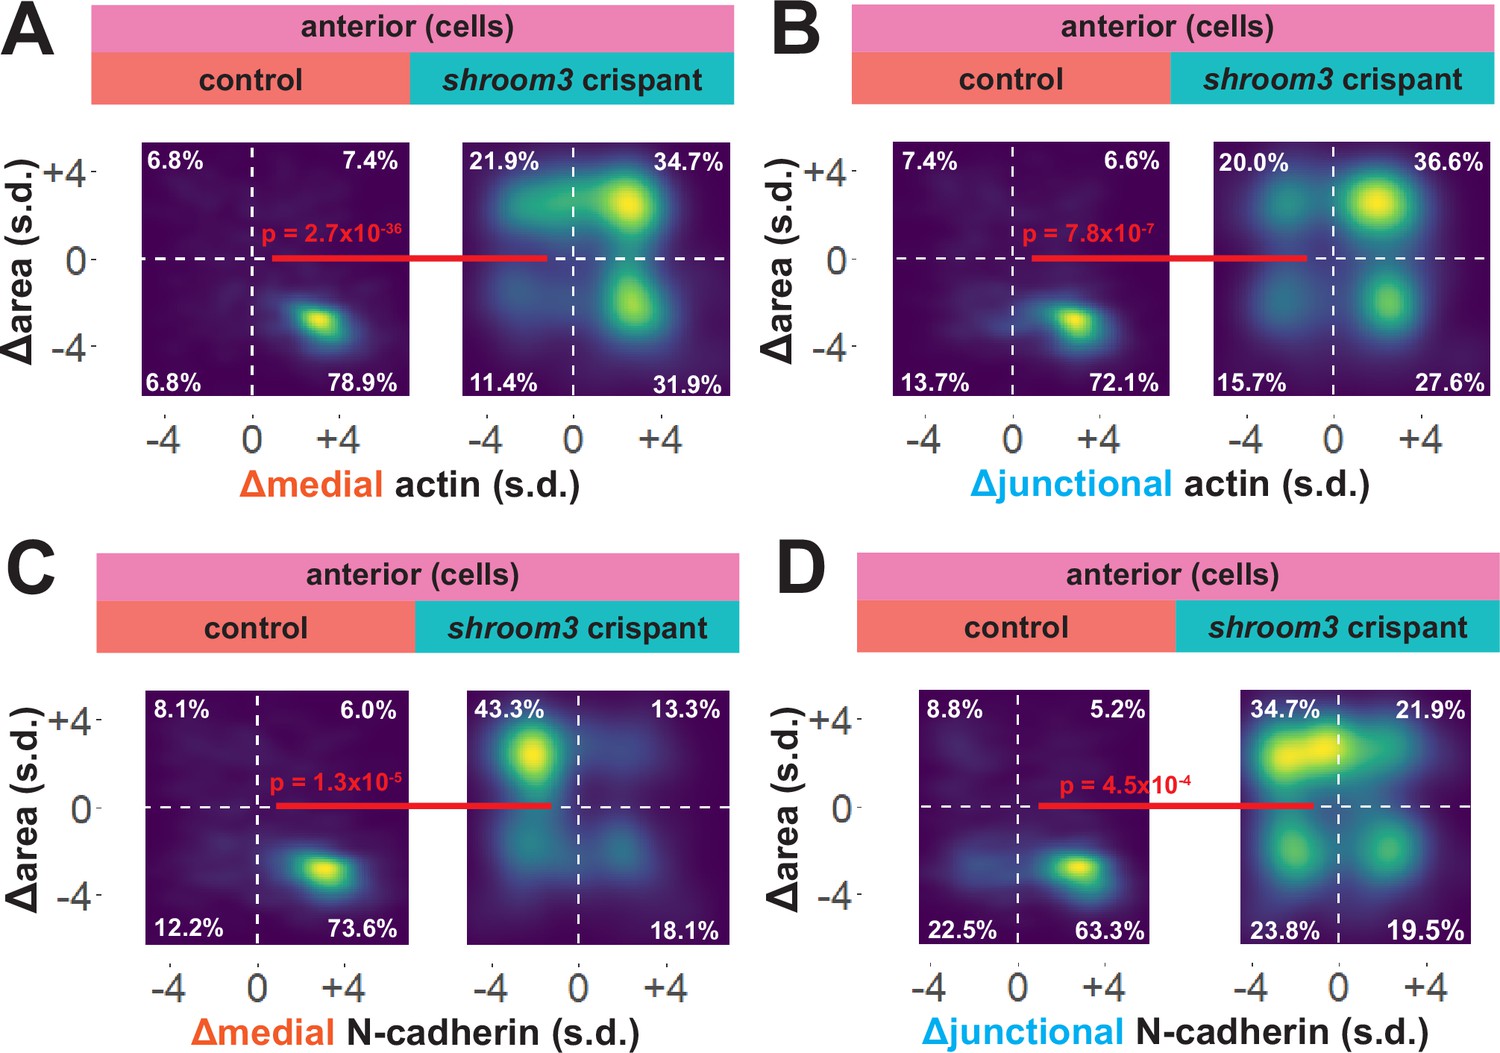
Medial N-cadherin accumulation is severely disrupted in anterior shroom3 crispant cells that fail to apically constrict.
(A-D) 2D density plots of all observations of apical area versus medial (A) or junctional (B) LifeAct/actin or medial (C) or junctional (D) N-cadherin for all cells within each group. Percentages in white indicate the percentage of total cells in each quadrant. Statistical comparisons performed by Peacock test, a 2D implementation of the Kolmogorov-Smirnov (KS) test. Cells situated along the mosaic interface were excluded from these analyses. s.d. = standard deviation.
Figure 8
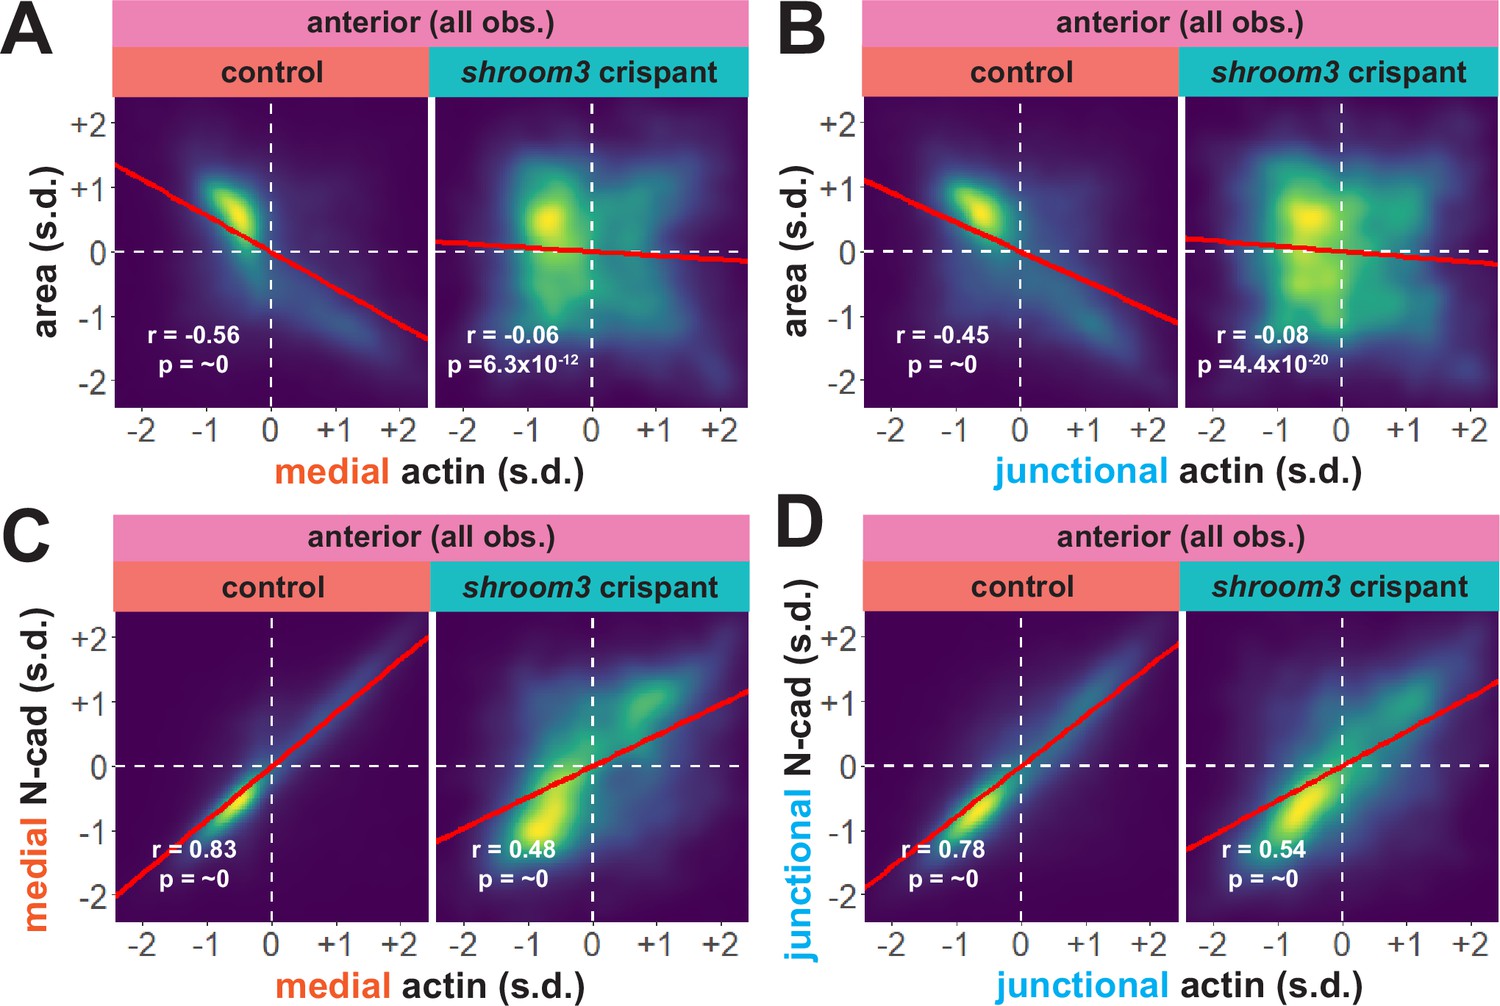
Actin and N-cadherin accumulation are uncoupled in anterior shroom3 crispant cells.
(A and B) 2D density plots of all observations of medial (A) or junctional (B) LifeAct/actin versus apical area for all cells within each group. (C and D) 2D density plots of all observations of medial (C) or junctional (D) LifeAct/actin versus N-cadherin at the same domain for all cells within each group. Red lines indicate best-fit line through the observations. Statistics (r and p) are calculated for Pearson’s correlation. Cells situated along the mosaic interface were excluded from these analyses. s.d. = standard deviation.
Figure 9
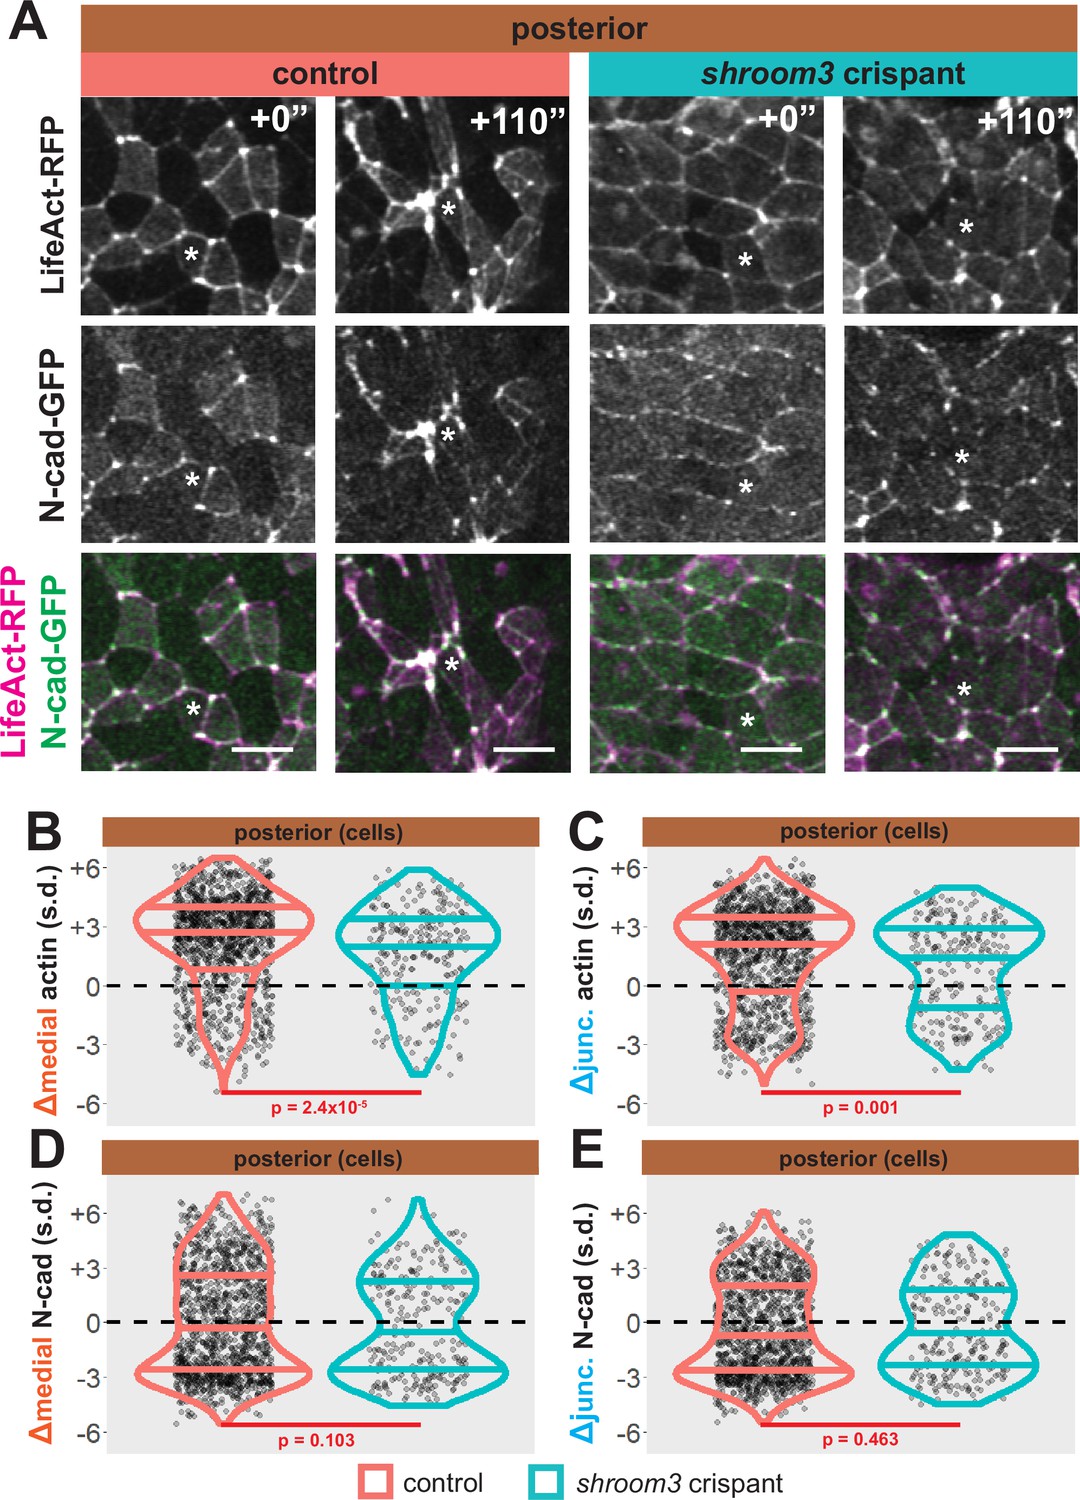
Loss of shroom3 disrupts actin dynamics in the posterior neural ectoderm.
(A) Representative images of LifeAct/actin and N-cadherin-GFP (N-cad-GFP) localization in control cells (left) and shroom3 crispant cells (right) from the posterior region of the neural ectoderm. White asterisks mark the same cell in each embryo. Scale bar = 15 µm. (B) Distribution of overall change (Δ) in medial LifeAct/actin (standardized) from anterior cells. (C) Distribution of overall change (Δ) in junctional LifeAct/actin (standardized) from anterior cells. (D) Distribution of overall change (Δ) in medial N-cadherin (standardized) from anterior cells. (E) Distribution of overall change (Δ) in junctional N-cadherin-GFP (standardized) from anterior cells. In B-E, horizontal lines on density plots/violins indicate quartiles of distribution, black circles are individual cells, and statistical comparisons performed by Kolmogorov-Smirnov (KS) test.
Figure 10
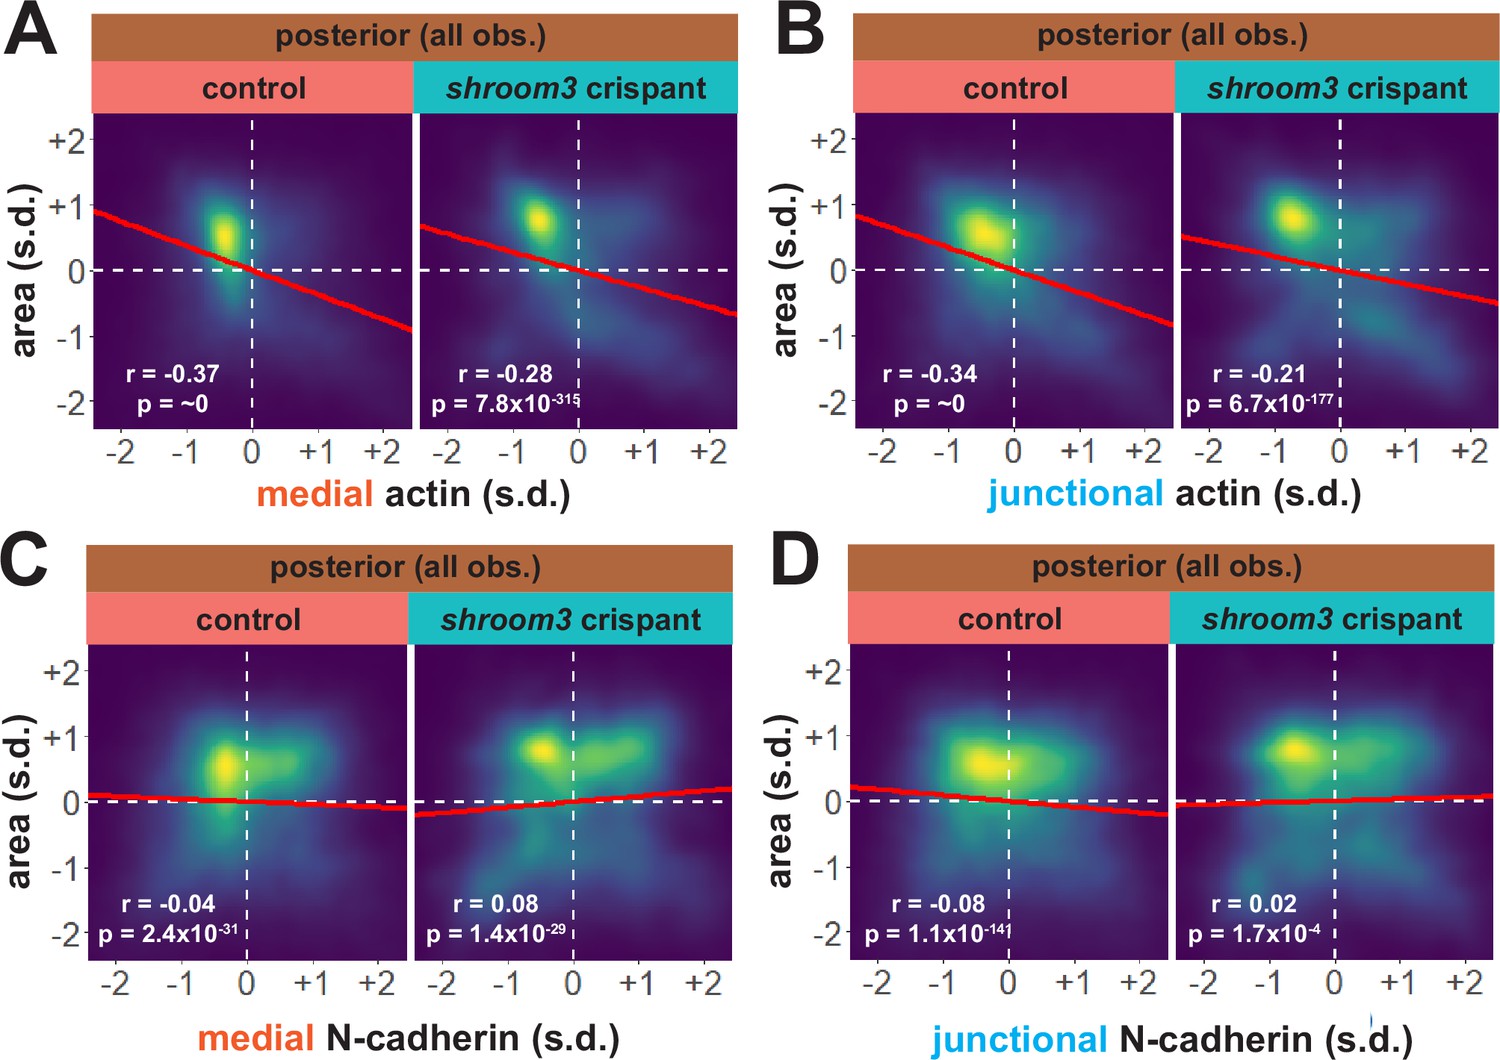
Actin and N-cadherin dynamics are highly heterogenous in the posterior neural ectoderm and poorly correlated with apical constriction.
(A and B) 2D density plots of all observations of apical area versus medial (A) or junctional (B) LifeAct/actin for all cells within each group. (C and D) 2D density plots of all observations of apical area versus medial (C) or junctional (D) N-cadherin for all cells within each group. Red lines indicate best-fit line through the observations. Statistics (r and p) are calculated for Pearson’s correlation. Cells situated along the mosaic interface were excluded from these analyses. s.d. = standard deviation.
Figure 11 with 1 supplement
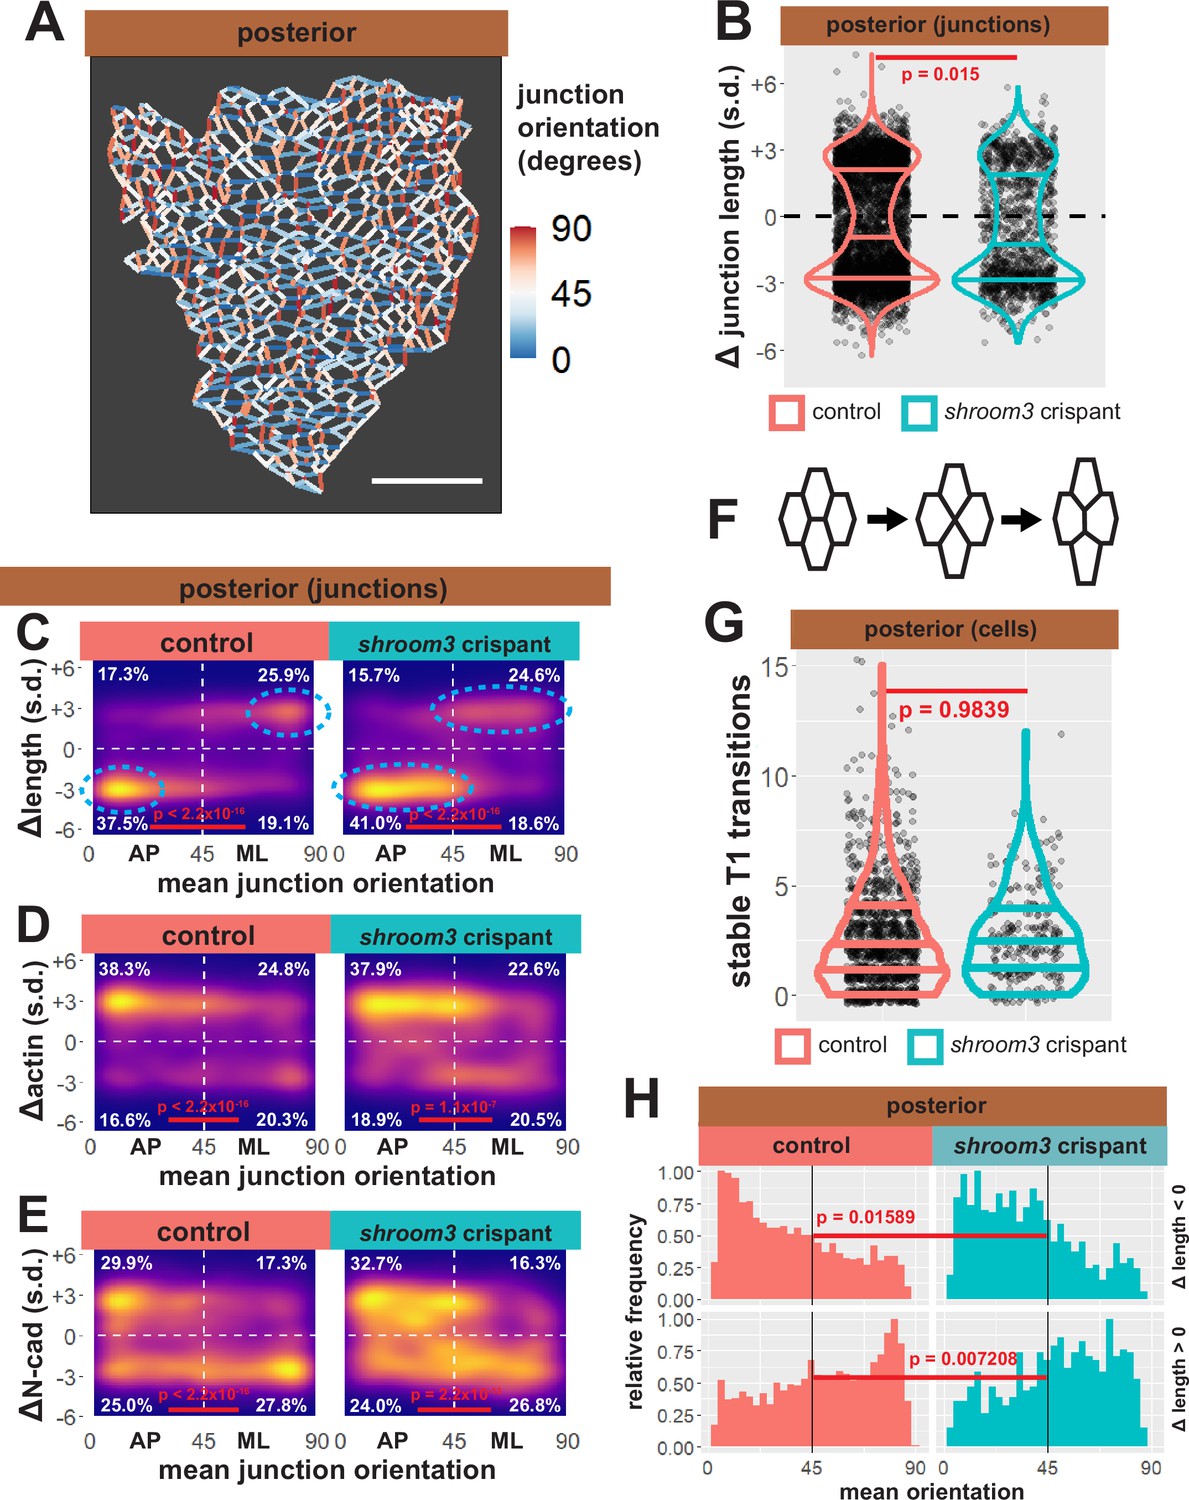
Individual junction behaviors are polarized in the posterior neural ectoderm.
(A) Junction orientation from posterior control embryo from Figure 2. Scale bars = 100 µm. (B) Distribution of overall change (Δ) in junction length (standardized) from the posterior neural ectoderm. Horizontal lines on density plots/violins indicate quartiles of distribution, black circles are individual cells, and statistical comparisons performed by Kolmogorov-Smirnov (KS) test. (C) 2D density plots of all observations of mean junction orientation over time versus overall change (Δ) in junction length (standardized) for all junctions within each group. Dashed cyan ellipses indicate areas of altered polarization between control and shroom3 crispant junctions. (D) 2D density plots of all observations of mean junction orientation over time versus overall change (Δ) in junction actin (standardized) for all junctions within each group. (E) 2D density plots of all observations of mean junction orientation over time versus overall change (Δ) in junction N-cadherin (standardized) for all junctions within each group. Percentages in white indicate the percentage of total cells in each quadrant. Statistical comparisons performed by Peacock test, a 2D implementation of the KS test. s.d. = standard deviation. (F) Example diagram of T1 transition/neighbor exchange within an epithelial tissue. (G) Distribution of stable T1 transitions/neighbor exchanges per cell as calculated by Tissue Analyzer. Horizontal lines on density plots/violins indicate quartiles of distribution, black circles are individual cells, and statistical comparisons performed by KS test. (H) Histogram showing relative frequencies of mean junction orientation from shrinking (Δ length < 0, upper panels) and growing (Δ length > 0, lower panels) posterior junctions. Compare to 11C. Statistical comparisons performed by KS test.
Figure 11—figure supplement 1
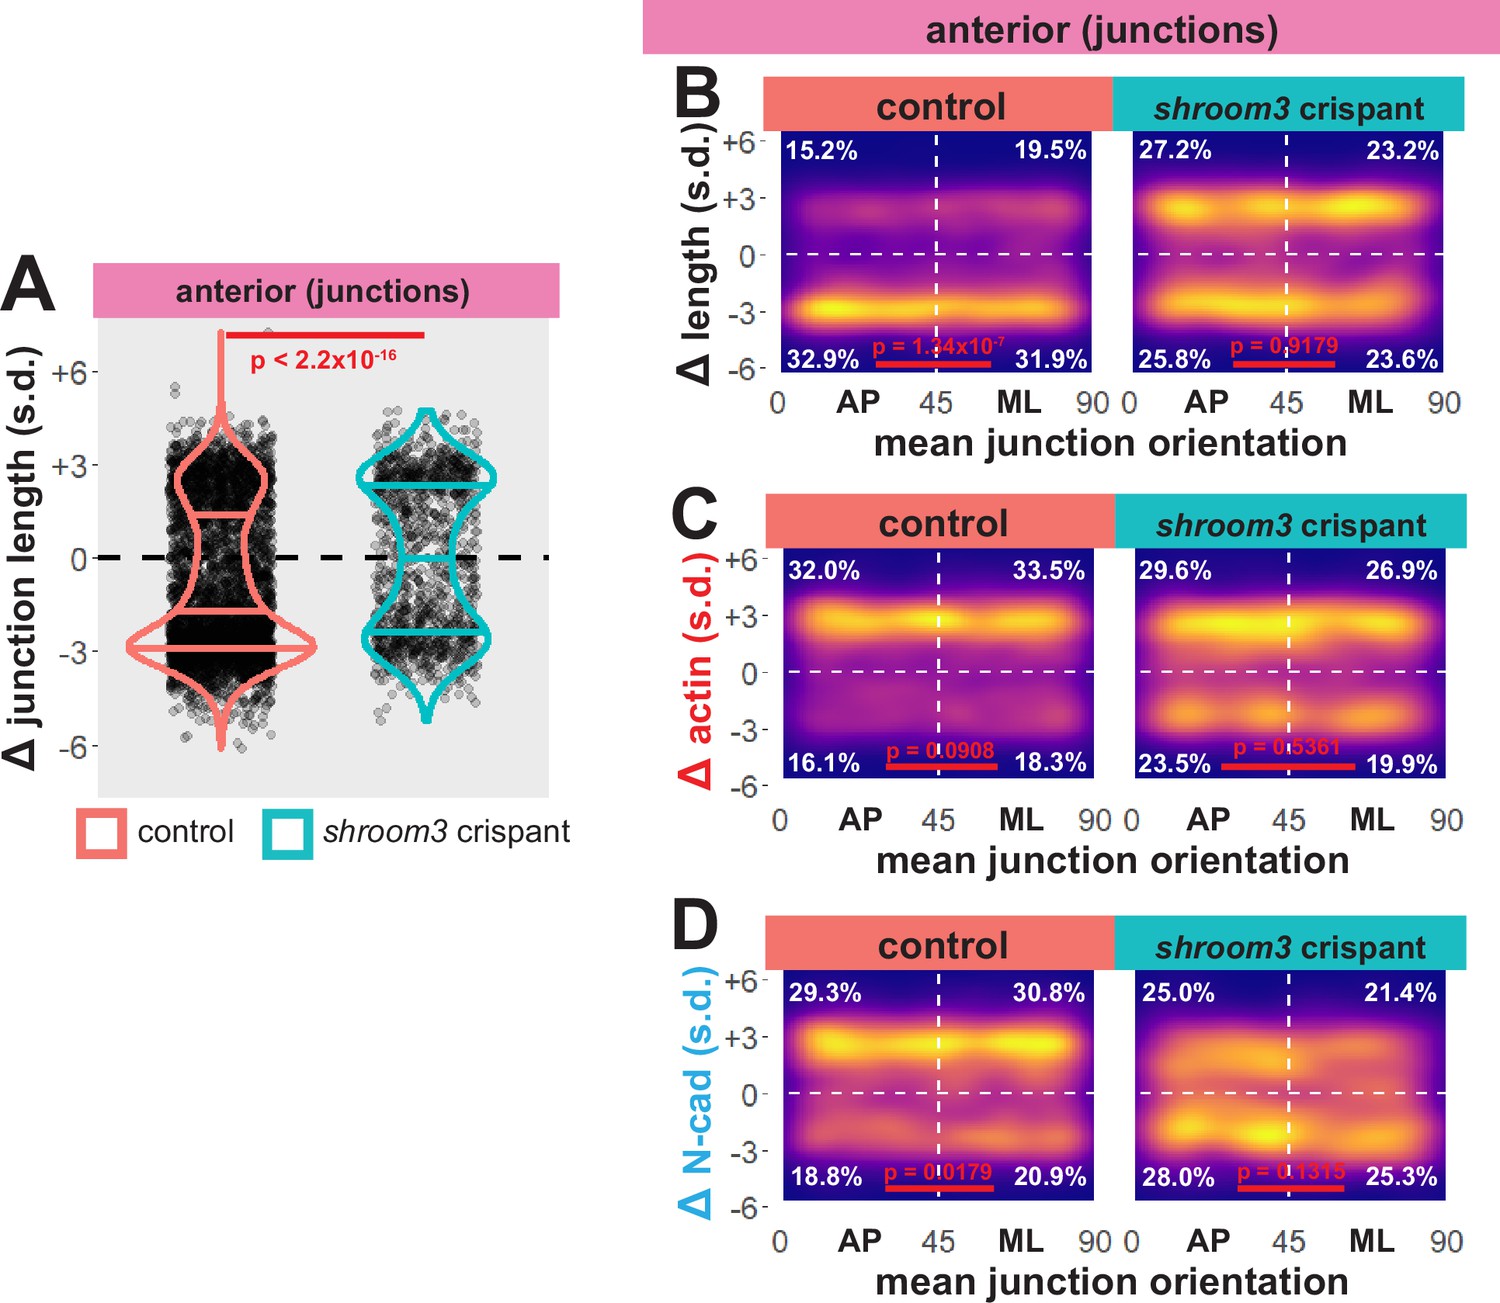
Individual junction behaviors are mainly anisotropic in the neural ectoderm.
(A) Distribution of overall change (Δ) in junction length (standardized) from the anterior neural ectoderm. Horizontal lines on density plots/violins indicate quartiles of distribution, black circles are individual cells, and statistical comparisons performed by Kolmogorov-Smirnov (KS) test. (B) 2D density plots of all observations of mean junction orientation over time versus overall change (Δ) in junction length (standardized) for all junctions within each group. (C) 2D density plots of all observations of mean junction orientation over time versus overall change (Δ) in junction actin (standardized) for all junctions within each group. (D) 2D density plots of all observations of mean junction orientation over time versus overall change (Δ) in junction N-cadherin (standardized) for all junctions within each group. Percentages in white indicate the percentage of total cells in each quadrant. Statistical comparisons performed by Peacock test, a 2D implementation of the KS test. s.d. = standard deviation.
Additional files
Download links
A two-part list of links to download the article, or parts of the article, in various formats.
Downloads (link to download the article as PDF)
Open citations (links to open the citations from this article in various online reference manager services)
Cite this article (links to download the citations from this article in formats compatible with various reference manager tools)
Global analysis of cell behavior and protein dynamics reveals region-specific roles for Shroom3 and N-cadherin during neural tube closure
eLife 11:e66704.
https://doi.org/10.7554/eLife.66704


