Localization of KRAS downstream target ARL4C to invasive pseudopods accelerates pancreatic cancer cell invasion
- Department of Molecular Biology and Biochemistry, Graduate School of Medicine, Osaka University, Japan
- Integrated Frontier Research for Medical Science Division, Institute for Open and Transdisciplinary Research Initiatives (OTRI), Osaka University, 2-2 Yamadaoka, Japan
- Laboratory of Experimental Immunology, WPI Frontier Immunology Research Center, Osaka University, Japan
- Gene Expression Laboratory (GEL-B), Salk Institute for Biological Studies, United States
- Gastroenterological Surgery, Graduate School of Medicine, Osaka University, Japan
Figures
Figure 1 with 1 supplement
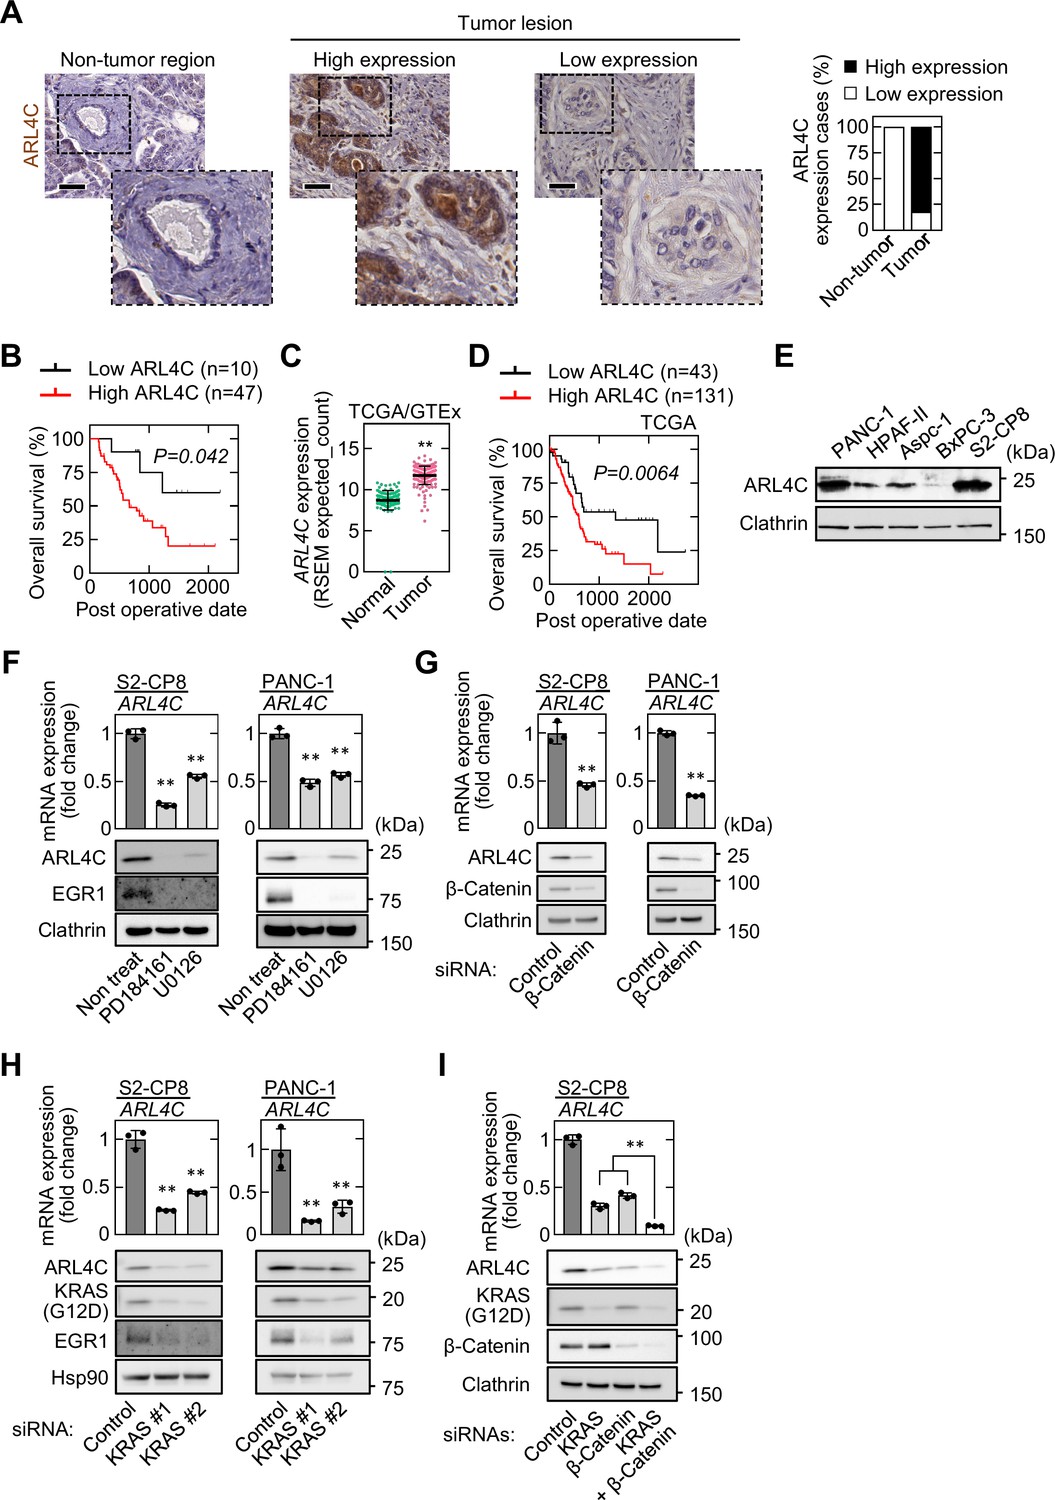
ARL4C is expressed in human pancreatic cancer.
(A) PDAC tissues (n = 57) were stained with anti-ARL4C antibody and hematoxylin. The percentages of ARL4C expression cases in the non-tumor regions and tumor lesions are shown. (B) The relationship between overall survival and ARL4C expression in patients with PDAC. (C) ARL4C mRNA levels in pancreatic adenocarcinoma and normal pancreatic tissues were analyzed using TCGA and GTEx datasets. The results shown are scatter plots with the mean ± s.e.m. p Values were calculated using a two-tailed Student’s t-test. (D) TCGA RNA sequencing and clinical outcome data for pancreatic cancer were analyzed. (E) Lysates of the indicated pancreatic cancer cells were probed with the indicated antibodies. (F) S2-CP8 and PANC-1 cells were treated with 10 μM PD184161 or 10 μM U0126, and ARL4C mRNA levels were measured by quantitative real-time PCR. Relative ARL4C mRNA levels were normalized to those of GAPDH and expressed as fold changes compared with the levels in control cells. Lysates were probed with the indicated antibodies. (G–I) S2-CP8 cells and PANC-1 cells were transfected with the indicated siRNAs, and ARL4C mRNA levels were measured by quantitative real-time PCR. Relative ARL4C mRNA levels were normalized to those of Β2Μ and expressed as fold changes compared with the levels in control cells. Lysates were probed with the indicated antibodies. EGR1 was used as an established transcription target gene of RAS signaling. (B,D) Data were analyzed using Kaplan–Meier survival curves, and a log-rank test was used for statistical analysis. (F–I) Data are shown as the mean ± s.d. of three biological replicates. p Values were calculated using a two-tailed Student’s t-test (G) or one-way ANOVA followed by Bonferroni post hoc test (F,H,I). Scale bars in (A) 50 μm. **, p < 0.01. See Figure 1—source data 1.
-
Figure 1—source data 1
Excel file containing quantitative data for Figure 1.
- https://cdn.elifesciences.org/articles/66721/elife-66721-fig1-data1-v2.xlsx
Figure 1—figure supplement 1
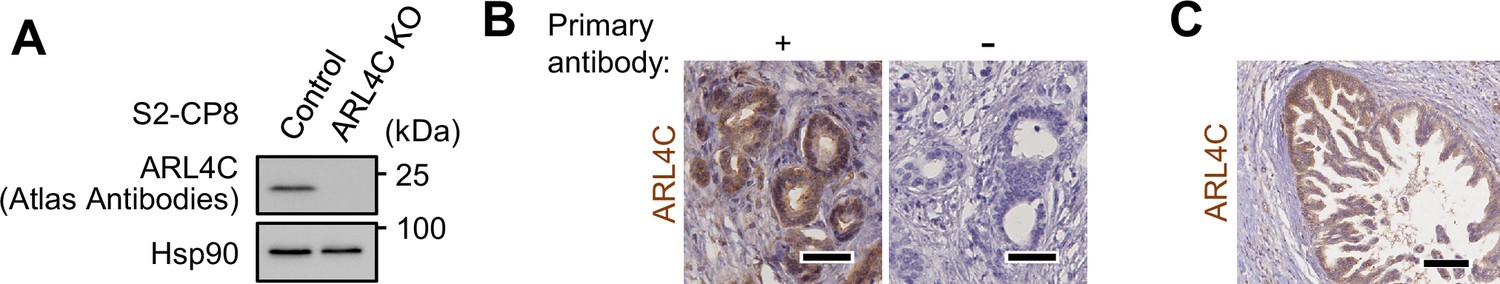
ARL4C is expressed in pancreatic cancer cells.
(A) Lysates were prepared from S2-CP8 WT or ARL4C KO cells and probed with the indicated antibodies. (B) PDAC tissues were stained with or without anti-ARL4C antibody as the primary antibody and hematoxylin. (C) PanIN lesion in PDAC case were stained with anti-ARL4C antibody and hematoxylin. Scale bars in (B) 50 μm; (C) 100 μm. KO, knockout.
Figure 2 with 5 supplements
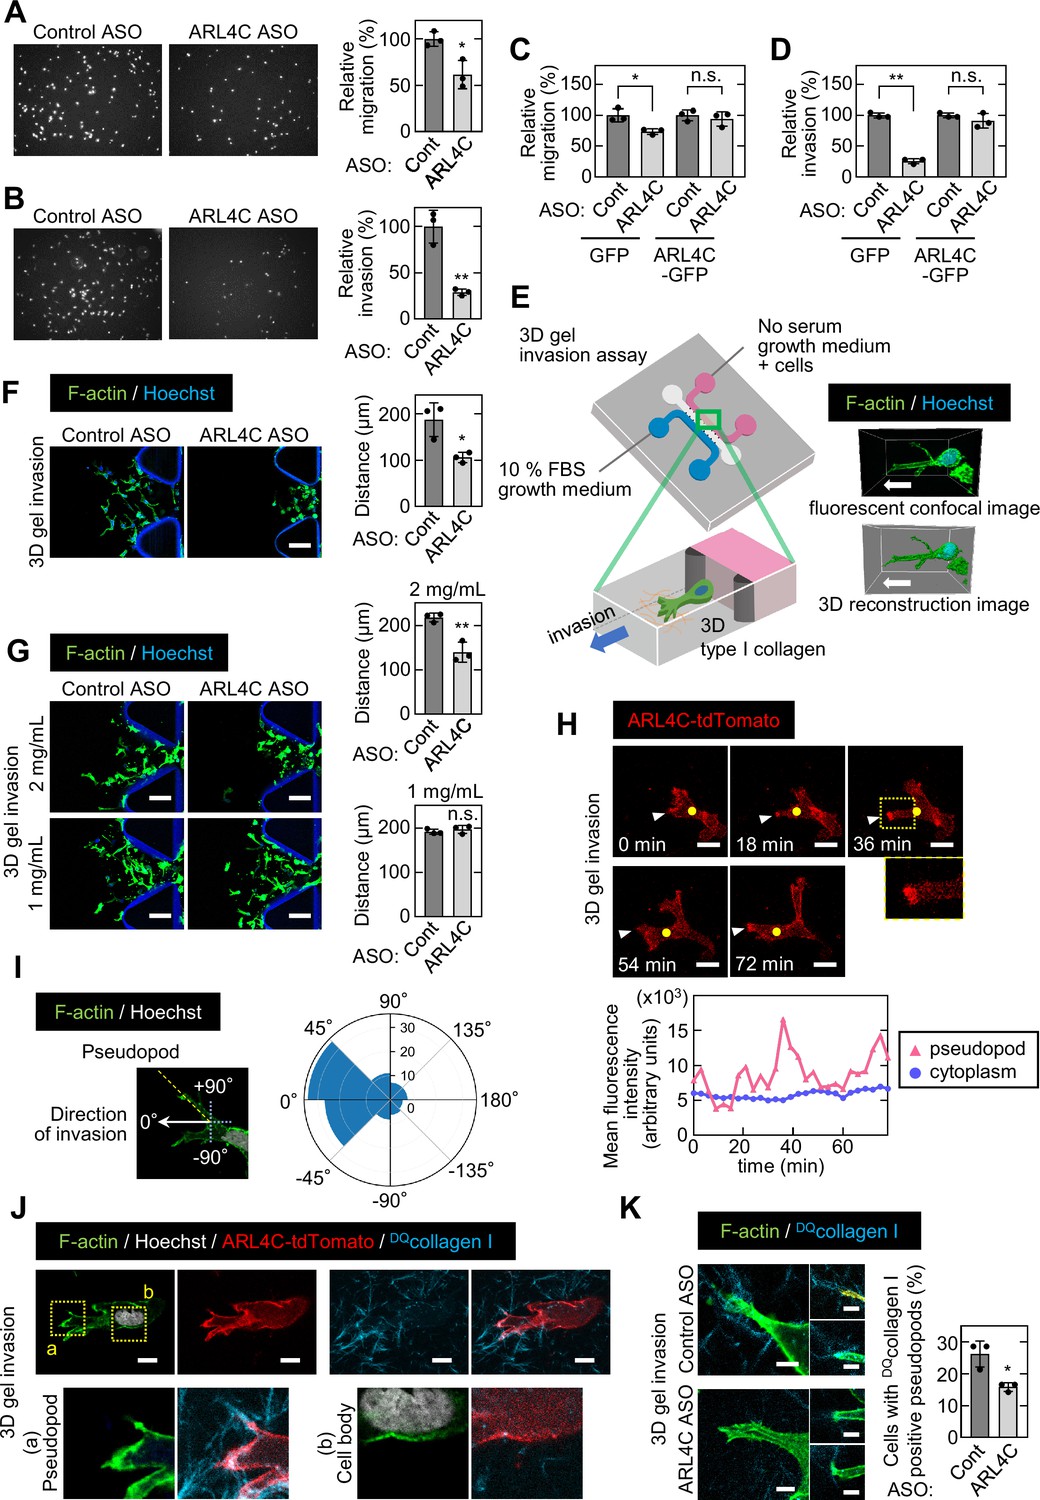
ARL4C expression is especially involved in the invasion of pancreatic cancer cells.
(A-D) S2-CP8 cells (A,B) or S2-CP8 cells expressing GFP or ARL4C-GFP (C,D) were transfected with control or ARL4C ASO-1316 and subjected to migration (A,C) and invasion (B,D) assays. Migratory and invasive abilities are expressed as the percentage of the same cells transfected with control ASO. (E) A schematic illustration of 3D invasion into collagen I gel using a 3D cell culture chip is shown. There is a chemical concentration gradient across the gel channel and cells can invade into the gel. The right panel shows a fluorescent confocal image (top) and a 3D reconstructed image (bottom). (F) S2-CP8 cells were transfected with control or ARL4C ASO-1316 and subjected to a 3D collagen I gel (2 mg/mL) invasion assay. The distances from the edge of the gel interface of all cells invading into the collagen gel were measured. (G) The same assay as in (F) was performed in the presence of different concentrations of collagen I. (H) S2-CP8 cells stably expressing ARL4C-tdTomato were observed with time-lapse imaging. Arrowheads indicate the tips of invasive pseudopods and yellow circles indicate the cytoplasm (20 μm away from the tip of pseudopods). The region in the yellow dashed squares is shown enlarged in the bottom image. Fluorescence intensities of the cytoplasm and invasive pseudopods were measured and plotted as a function of time. (I) S2-CP8 cells were subjected to a 3D collagen I gel invasion assay and stained with phalloidin and Hoechst 33342. The angle of pseudopods to the direction of cell invasion toward FBS was calculated (n = 105). The results were plotted to a polar histogram. (J) S2-CP8 cells expressing ARL4C-tdTomato were subjected to a 3D collagen I gel invasion assay with DQcollagen I, and stained with phalloidin and Hoechst 33342. The regions in the yellow dashed squares (a, pseudopod; b, cell body) are enlarged. (K) S2-CP8 cells transfected with control ASO or ARL4C ASO-1316 were subjected to a 3D collagen I gel invasion assay with DQcollagen I. The percentages of cells with DQcollagen I-positive pseudopods compared with the total number of cells were calculated. (A–D,F,G,K) Data are shown as the mean ± s.d. of three biological replicates. p Values were calculated using a two-tailed Student’s t-test. Scale bars in (F,G) 100 μm; (H) 20 µm; (J) 10 µm; (K) 5 µm. n.s. not significant. *, p < 0.05; **, p < 0.01. See Figure 2—source data 1.
-
Figure 2—source data 1
Excel file containing quantitative data for Figure 2.
- https://cdn.elifesciences.org/articles/66721/elife-66721-fig2-data1-v2.xlsx
Figure 2—figure supplement 1
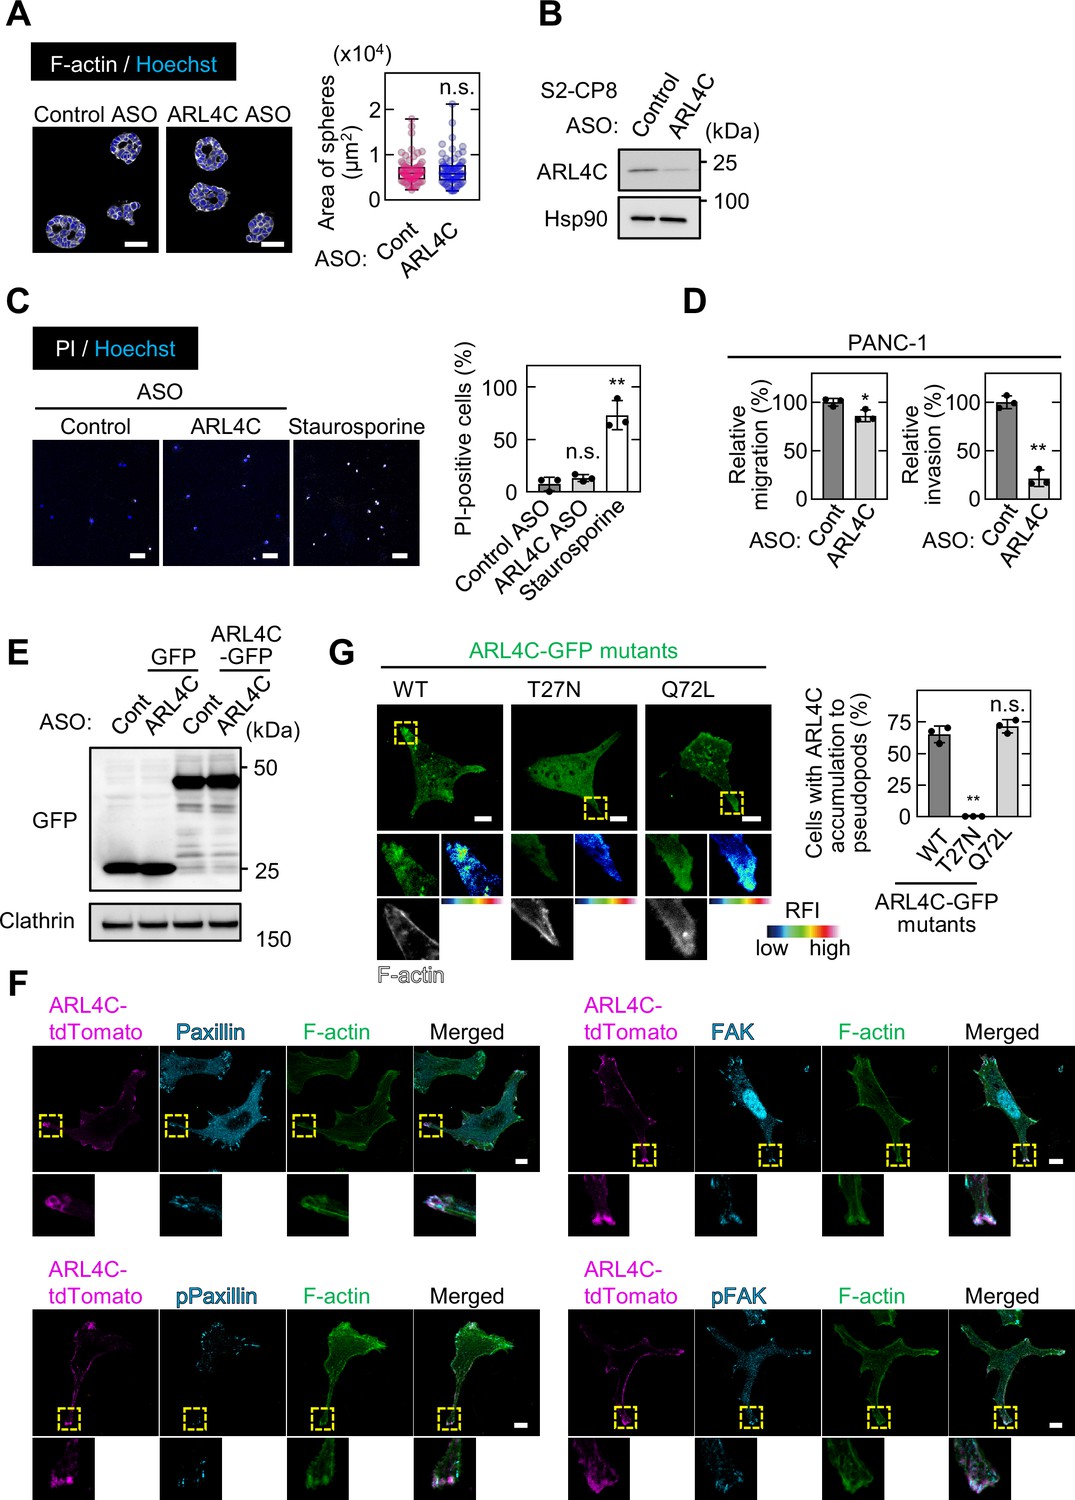
ARL4C expression is involved in invasion of pancreatic cancer cells rather than in sphere formation.
(A) S2-CP8 cells transfected with control or ARL4C ASO-1316 were cultured for 6 days in 2.5D Matrigel. The cells were then fixed and stained with phalloidin and Hoechst 33342 and sphere areas were calculated. When more than 10 cells formed a spherical structure, it was counted as one sphere. Data are shown as a box and whiskers plot. Center lines show the medians; box limits indicate the 25th and 75th percentiles; whiskers indicate the smallest and largest values; dots show all of the individual values. More than 65 spheres were analyzed per group. p Values were calculated using a two-tailed Student’s t-test. (B) Lysates were prepared from S2-CP8 cells transfected with control or ARL4C ASO-1316 and probed with the indicated antibodies. (C) S2-CP8 cells treated with control ASO, ARL4C ASO-1316, or staurosporine were cultured for 3.5 days and subjected to cytotoxic assay. Staurosporine was treated 15 hr before the assay. Cells were incubated with propidium iodide (PI) and Hoechst 33342. PI-positive cells are expressed as the percentage of positively stained cells compared with total Hoechst 33342 stained cells per field. (D) PANC-1 cells transfected with control or ARL4C ASOs were subjected to migration and invasion assays. Migratory and invasive abilities are expressed as the percentage of control cells. (E) S2-CP8 cells stably expressing GFP or ARL4C-GFP were transfected with control or ARL4C ASO-1316. Lysates were probed with the indicated antibodies. (F) S2-CP8 cells stably expressing ARL4C-tdTomato were stained with the indicated antibodies. The regions in the yellow dashed squares are shown enlarged in the bottom images. (G) S2-CP8 cells were transfected with the indicated ARL4C-GFP mutants and stained with phalloidin. The regions in the yellow dashed squares are shown enlarged in the left bottom images. The right bottom images are shown in a false color representation of fluorescence intensity. The percentages of cells with ARL4C-GFP mutant accumulated at invasive pseudopods compared with the total number of cells were calculated. False color representations were color-coded on the spectrum. (C,D,G) Data are shown as the mean ± s.d. of three biological replicates. p Values were calculated using a two-tailed Student’s t-test (D) or one-way ANOVA followed by Bonferroni post hoc test (C,G). Scale bars in (A) 50 μm; (C) 100 μm; (F,G) 10 μm. RFI, relative fluorescence intensity. n.s., not significant. *, p < 0.05; **, p < 0.01. See Figure 2—figure supplement 1—source data 1.
-
Figure 2—figure supplement 1—source data 1
Excel file containing quantitative data for Figure 2—figure supplement 1.
- https://cdn.elifesciences.org/articles/66721/elife-66721-fig2-figsupp1-data1-v2.xlsx
Figure 2—figure supplement 2
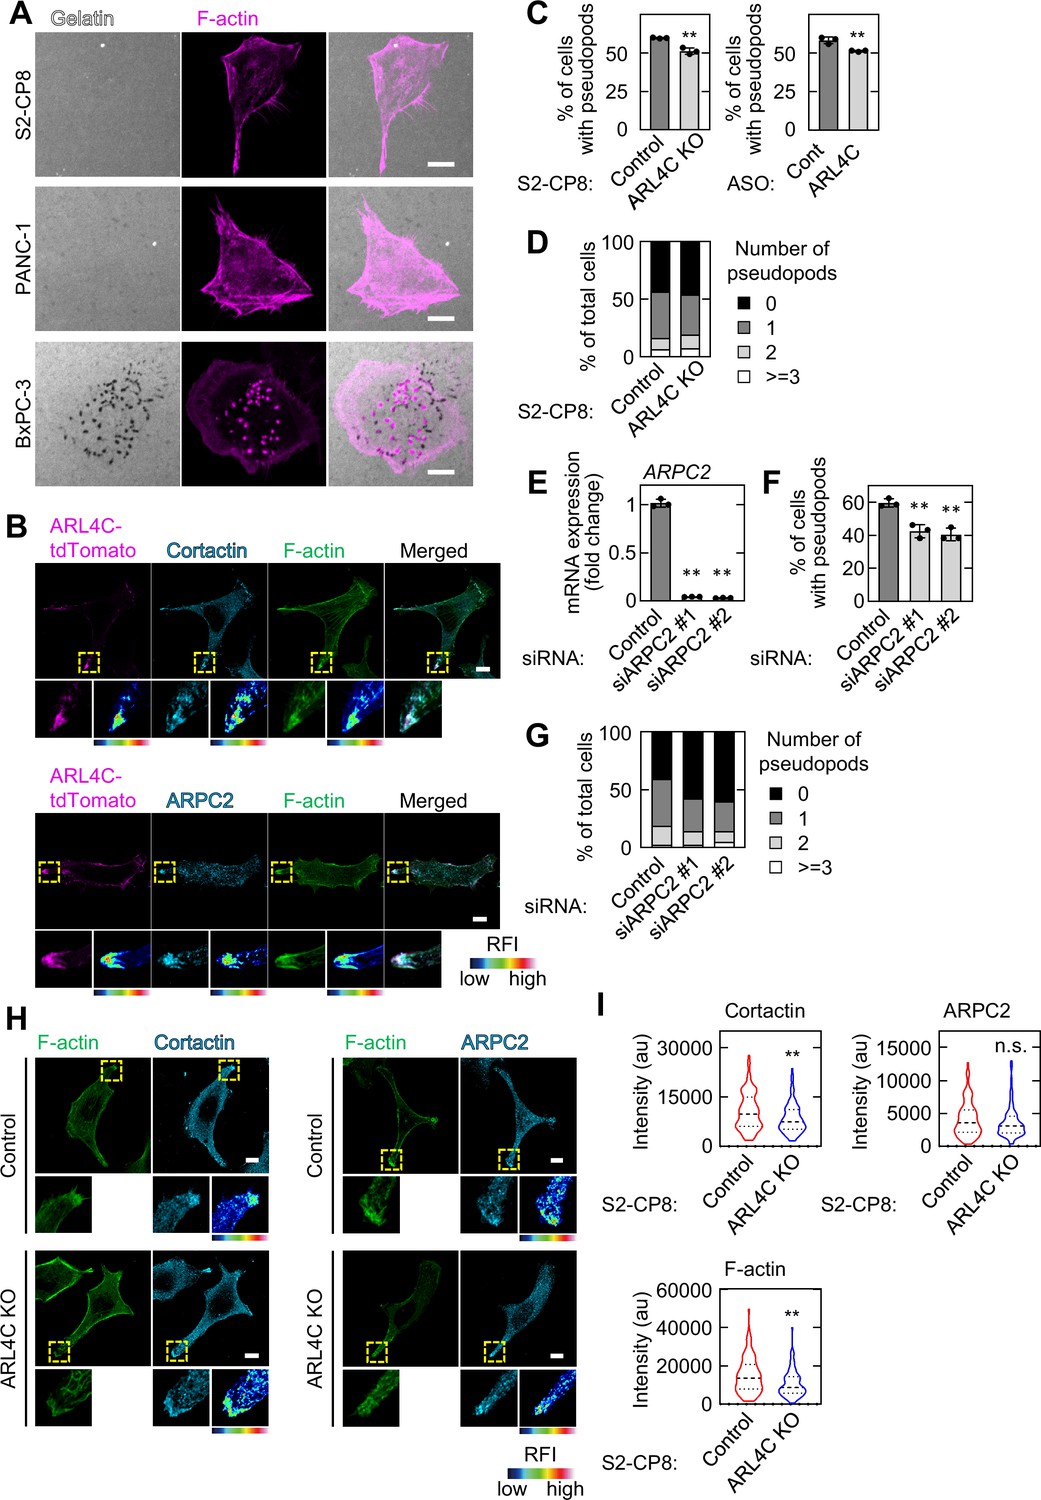
ARL4C localizes at the tips of invasive pseudopods.
(A) S2-CP8, PANC-1, and BxPC-3 cells were subjected to an invadopodia assay and then stained with phalloidin. (B) S2-CP8 cells were stained with the indicated antibodies. (C,D) S2-CP8 cells treated with control ASO or ARL4C ASO-1316, and S2-CP8 WT or ARL4C KO cells were stained with anti-cortactin antibody and phalloidin. The percentages of cells with invasive pseudopods compared with the total number of cells were calculated (C). Cells were classified according to the number of pseudopods as indicated (D). (E) S2-CP8 cells were transfected with control or ARPC2 siRNAs, and ARPC2 mRNA levels were measured by quantitative real-time PCR. Relative ARPC2 mRNA levels were normalized to those of GAPDH and expressed as fold changes compared with the level in control cell. (F,G) The same assays as in (C) and (D) were performed for S2-CP8 cells transfected with control or ARPC2 siRNAs. (H,I) S2-CP8 WT or ARL4C KO cells were stained with cortactin or ARPC2. Circles of 2 μm diameter were placed at the edge of pseudopods and mean intensity of each circle was measured. The distribution of the data was depicted as a violin plot and the center lines show the medians. More than 100 pseudopods were calculated for each condition. p Values were calculated using a two-tailed Student’s t-test. (B,H) The regions in the yellow dashed squares are shown enlarged in the left bottom images. The right bottom images are shown in a false color representation of fluorescence intensity. False color representations were color-coded on the spectrum. (C,E,F) Data are shown as the mean ± s.d. of three biological replicates. p Values were calculated using a two-tailed Student’s t-test (C) or one-way ANOVA followed by Bonferroni post hoc test (E,F). Scale bars in (A,B,H) 10 μm. au, arbitrary units. KO, knockout. RFI, relative fluorescence intensity. n.s., not significant. *, p < 0.05; **, p < 0.01. See Figure 2—figure supplement 2—source data 1.
-
Figure 2—figure supplement 2—source data 1
Excel file containing quantitative data for Figure 2—figure supplement 2.
- https://cdn.elifesciences.org/articles/66721/elife-66721-fig2-figsupp2-data1-v2.xlsx
Figure 2—figure supplement 3
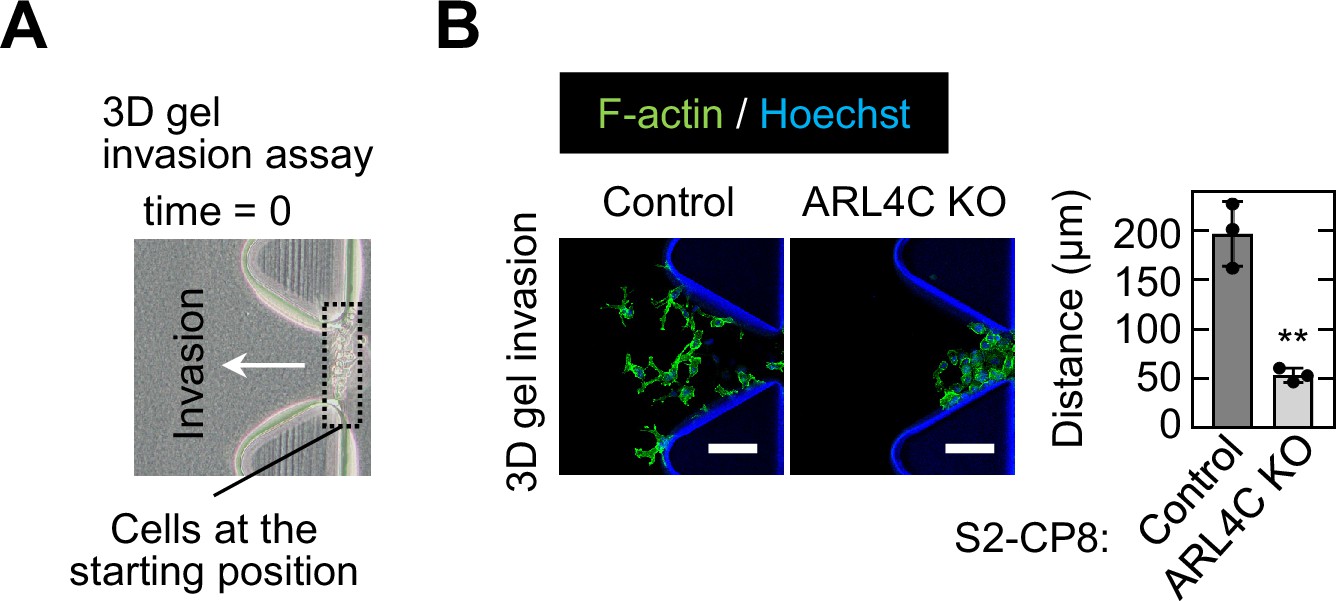
ARL4C is involved in invasion into 3D matrix.
(A) S2-CP8 cells were subjected to a 3D collagen I gel invasion assay and the image shows cells, indicated by black dashed square, placed at the starting position of this assay at 0 time. (B) S2-CP8 WT or ARL4C KO cells were subjected to a 3D collagen I gel (2 mg/mL) invasion assay. The distances from the edge of the gel interface of all cells invading into the collagen gel were measured. Data are shown as the mean ± s.d. of three biological replicates. p Values were calculated using a two-tailed Student’s t-test. Scale bar in (B) 100 μm. KO, knockout. **, p < 0.01. See Figure 2—figure supplement 3—source data 1.
-
Figure 2—figure supplement 3—source data 1
Excel file containing quantitative data for Figure 2—figure supplement 2.
- https://cdn.elifesciences.org/articles/66721/elife-66721-fig2-figsupp3-data1-v2.xlsx
Figure 2—video 1
ARL4C accumulates at the tips of invasive pseudopods.
S2-CP8 cells stably expressing ARL4C-tdTomato were subjected to the 3D collagen I gel invasion assay and were observed with time-lapse imaging and the video was acquired for 78 min. Cells were imaged every 3 min.
Figure 2—video 2
S2-CP8 cells extend pseudopods to the direction of cell invasion.
S2-CP8 WT cells were subjected to the 3D collagen I gel invasion assay and were observed with time-lapse imaging and the video was acquired for 4 h 35 min. Cells were imaged every 5 min.
Figure 3 with 2 supplements

IQGAP1 is a novel ARL4C-interacting protein.
(A) The ARL4C-interacting proteins in X293T cells were analyzed by mass spectrometry. The results are listed in Supplementary file 1 table 2 and Source data 2. Arrowheads indicate the identified proteins, including IQGAP1 (red). (B,C) Lysates of S2-CP8 cells expressing ARL4C-GFP (B) or S2-CP8 WT cells (C) were immunoprecipitated with anti-GFP antibody (B) or anti-ARL4C antibody (C), and the immunoprecipitates were probed with the indicated antibodies. (D) Lysates of X293T cells expressing the indicated proteins were immunoprecipitated with anti-GFP antibody, and the immunoprecipitates were probed with the indicated antibodies. (E) S2-CP8 cells were stained with the indicated antibodies. Images of ARL4C and IQGAP1 were merged. (F) S2-CP8 cells expressing ARL4C-tdTomato were subjected to a 3D collagen I gel invasion assay and were stained with the indicated antibodies. Images of ARL4C and IQGAP1 were merged. (G,H) S2-CP8 cells expressing GFP or GFP-IQGAP1 were transfected with the indicated siRNAs and subjected to migration (G) and invasion (H) assays. Migratory and invasive abilities are expressed as the percentage of the same cells transfected with control siRNA. (I) S2-CP8 cells depleted of the indicated proteins were subjected to an invasion assay. Invasive activities are expressed as the percentage of control cells. (J) PDAC tissues were stained with anti-IQGAP1 antibody and hematoxylin. (K) The relationship between overall survival and IQGAP1 expression in PDAC patients was analyzed. (L) Scatter plot showing the correlation between the mRNA expression levels of ARL4C (X-axis) and IQGAP1 (Y-axis) in pancreatic cancer patients obtained from TCGA datasets using the R2: Genomics Analysis and Visualization Platform. r indicates the Pearson’s correlation coefficient. (G-I) Data are shown as the mean ± s.d. of three biological replicates. p Values were calculated using a two-tailed Student’s t-test (G,H) or one-way ANOVA followed by Bonferroni post hoc test (I). (K) The data were analyzed by Kaplan–Meier survival curves, and a log-rank test was used for statistical analysis. (E,F) The regions in the yellow dashed squares are shown enlarged in the left bottom images. The right bottom images are shown with a false color representation of fluorescence intensity. More than 50 cells were imaged and the representative image is shown. False color representations were color-coded on the spectrum. Scale bars in (E) 10 μm; (F) 20 μm; (J) 50 µm. KD, knockdown. RFI, relative fluorescence intensity. n.s., not significant. *, p < 0.05; **, p < 0.01. See Figure 3—source data 1.
-
Figure 3—source data 1
Excel file containing quantitative data for Figure 3.
- https://cdn.elifesciences.org/articles/66721/elife-66721-fig3-data1-v2.xlsx
Figure 3—figure supplement 1
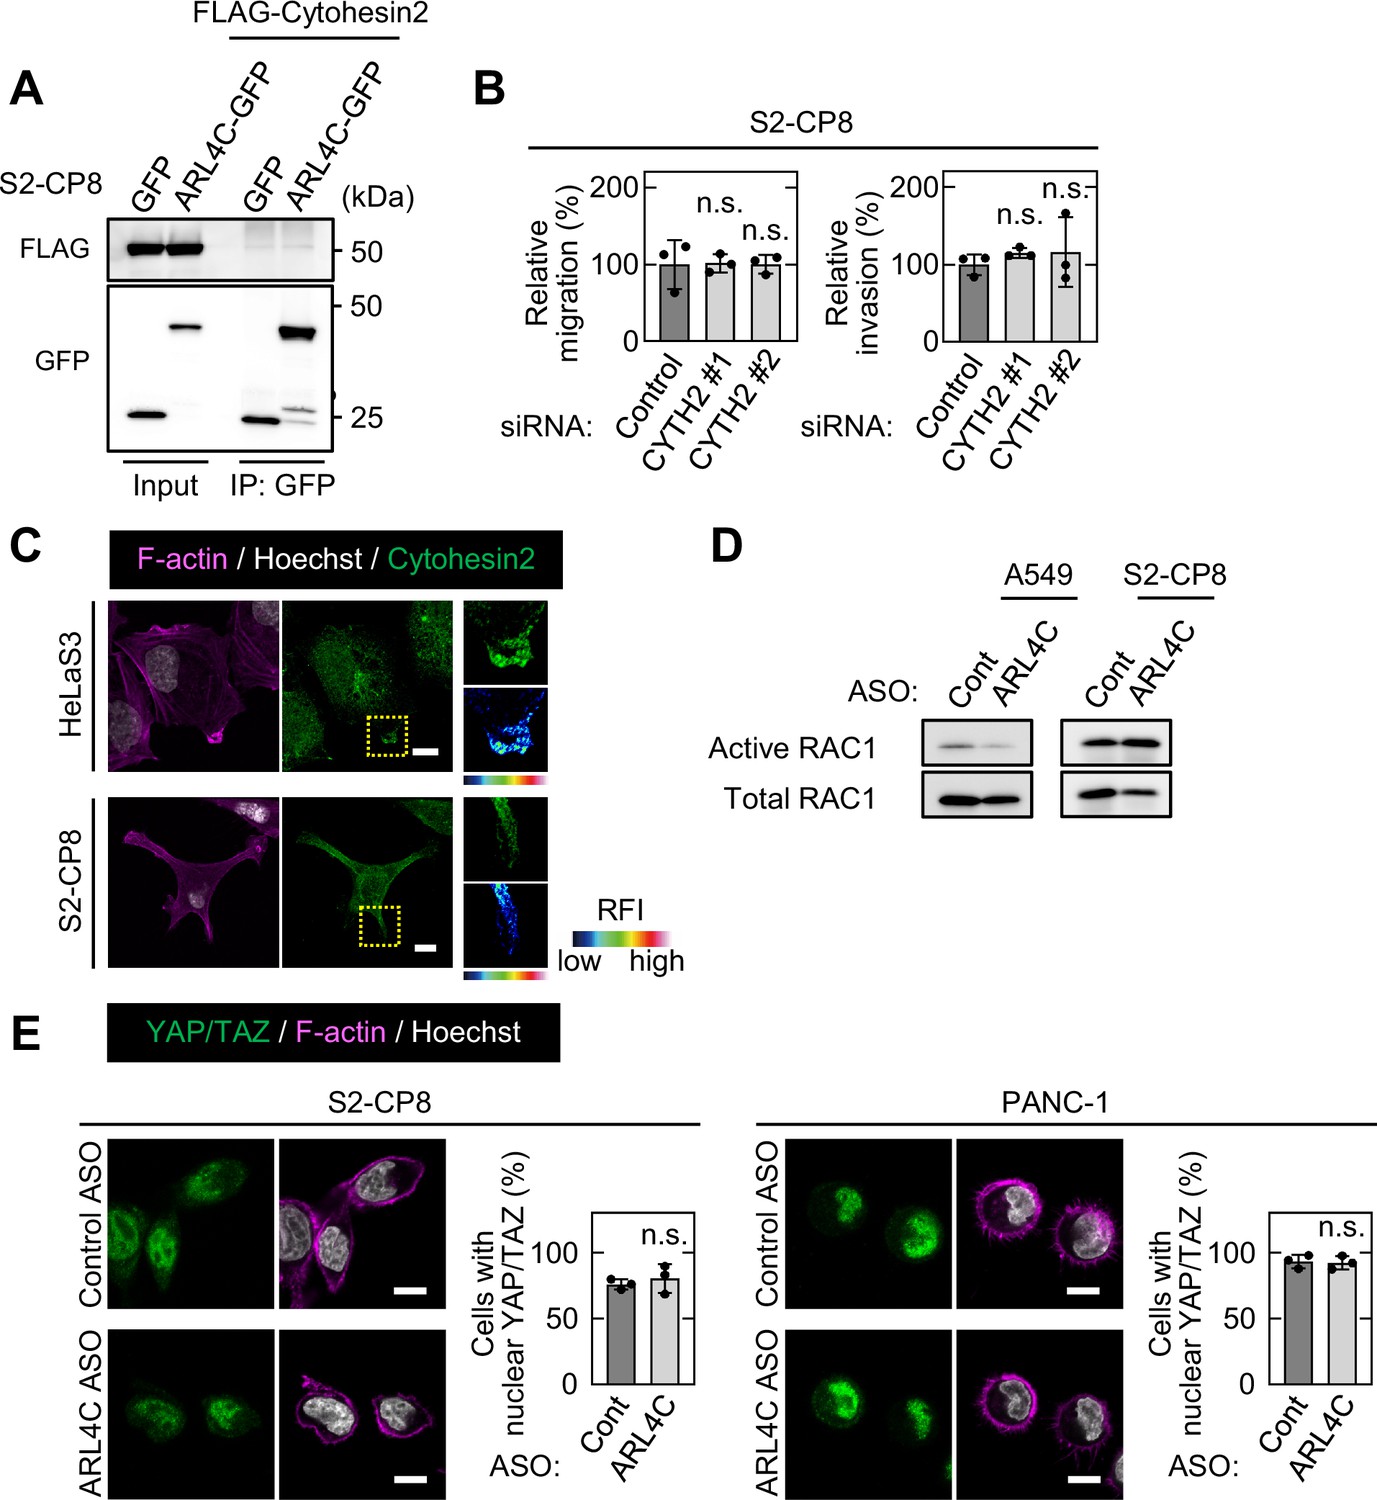
Cytohesin2 does not mediate ARL4C signaling in pancreatic cancer cells.
(A) FLAG-cytohesin2 was expressed in S2-CP8 cells expressing GFP or ARL4C-GFP. Lysates were immunoprecipitated with anti-GFP antibody, and the immunoprecipitates were probed with the indicated antibodies. (B) S2-CP8 cells transfected with control or two independent CYTH2 (a gene of cytohesin2) siRNAs were subjected to migration and invasion assays. Migratory and invasive abilities are expressed as the percentage of control cells. (C) HeLaS3 and S2-CP8 cells were stained with anti-cytohesin2 antibody, phalloidin, and Hoechst 33342. Enlarged images (right top) of the regions in the yellow dashed squares are shown in a false color representation of fluorescence intensity (right bottom). False color representations were color-coded on the spectrum. (D) A549 and S2-CP8 cells transfected with the indicated ASOs were subjected to assay for RAC1 activity. (E) S2-CP8 and PANC-1 cells transfected with the indicated ASOs were cultured for 2.5 hr under 2.5D Matrigel conditions and stained with anti-YAP/TAZ antibody and Hoechst 33342. Cells with nuclear YAP/TAZ were counted, and the data are shown as the percentage of positively stained cells compared with the total number of Hoechst-stained cells. (B,E) Data are shown as the mean ± s.d. of three biological replicates. p Values were calculated using a two-tailed Student’s t-test (E) or one-way ANOVA followed by Bonferroni post hoc test (B). Scale bars in (C,E) 10 μm. OE, overexpression. RFI, relative fluorescence intensity. n.s., not significant. See Figure 3—figure supplement 1—source data 1.
-
Figure 3—figure supplement 1—source data 1
Excel file containing quantitative data for Figure 3—figure supplement 1.
- https://cdn.elifesciences.org/articles/66721/elife-66721-fig3-figsupp1-data1-v2.xlsx
Figure 3—figure supplement 2
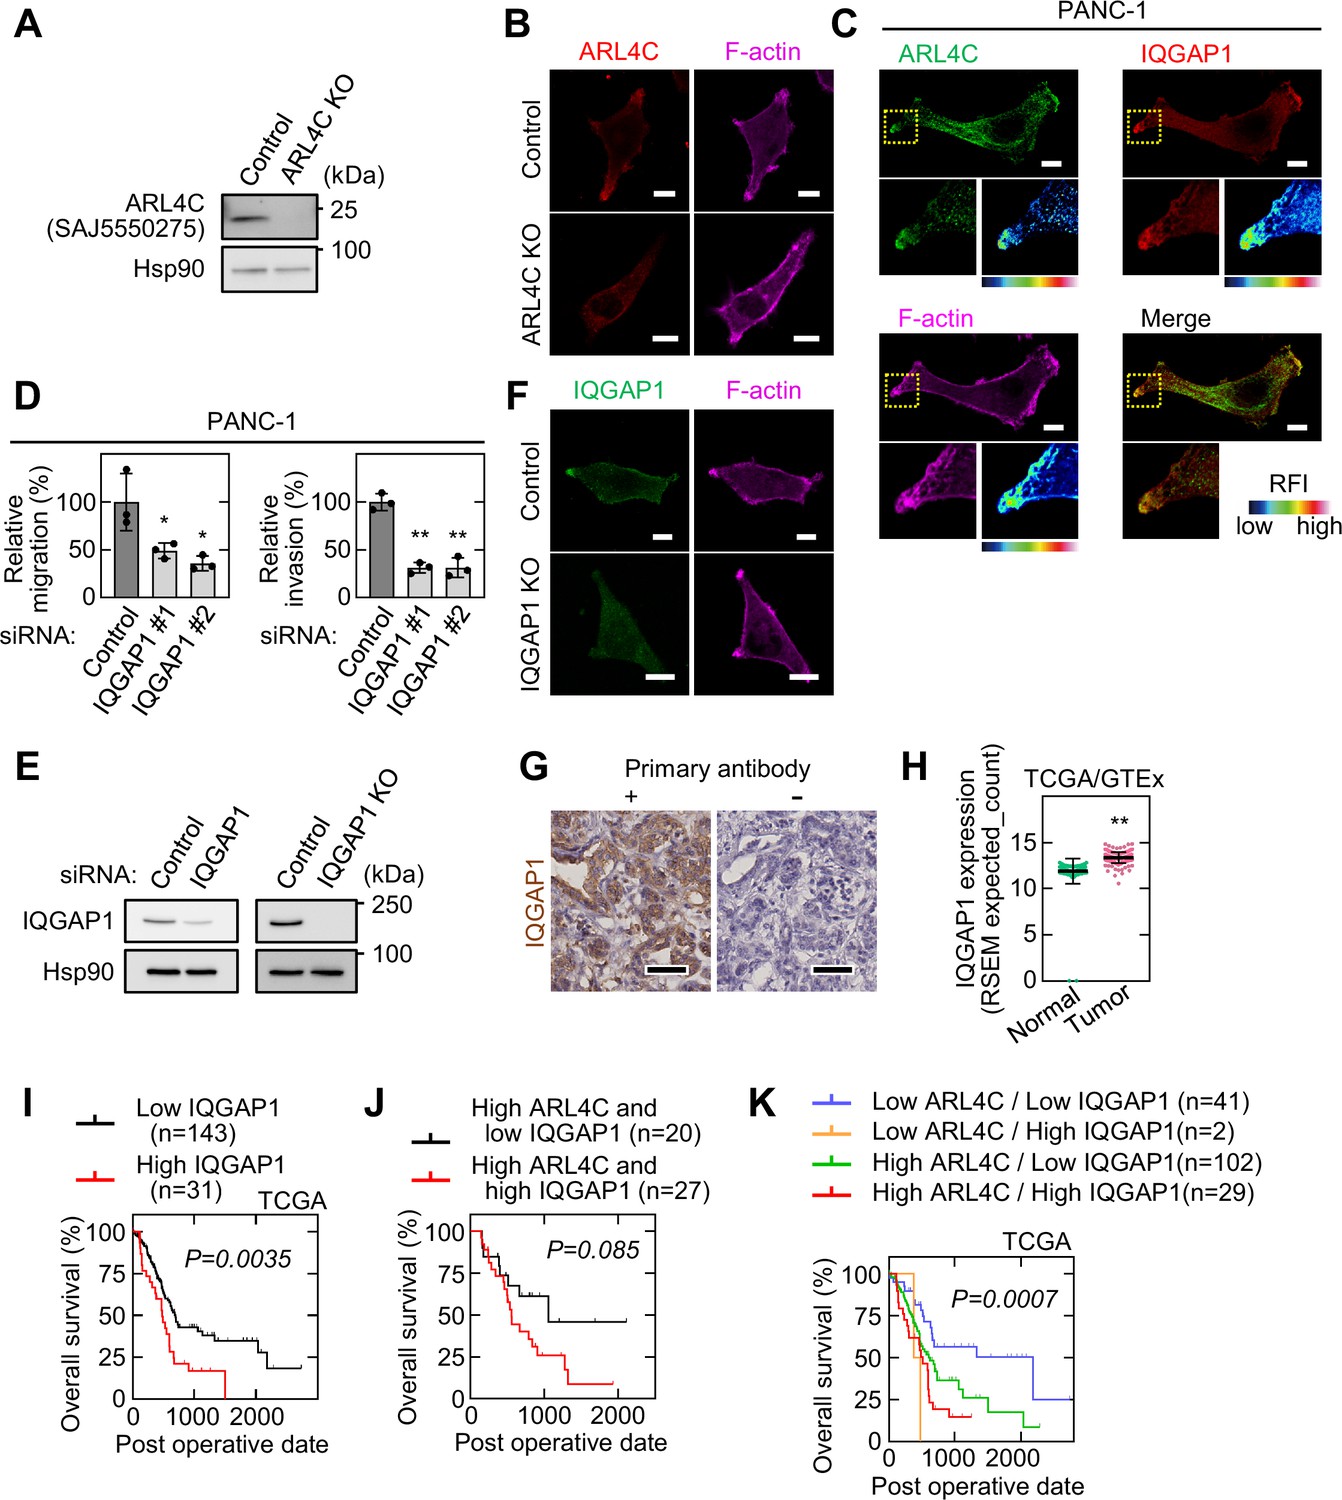
IQGAP1 interacts with ARL4C and involves in the invasion of pancreatic cancer cells.
(A) Lysates from S2-CP8 WT or ARL4C KO cells were probed with the indicated antibodies. (B) S2-CP8 WT or ARL4C KO cells were stained with anti-ARL4C antibody and phalloidin. (C) PANC-1 cells were stained with the indicated antibodies. Images of ARL4C and IQGAP1 were merged. Enlarged images of the regions in the yellow dashed squares are shown in a false color representation of fluorescence intensity on the bottom right. False color representations were color-coded on the spectrum. (D) PANC-1 cells transfected with control or IQGAP1 siRNAs were subjected to migration and invasion assays. Migratory and invasive abilities are expressed as the percentage of control cells. Data are shown as the mean ± s.d. of three biological replicates. p Values were calculated using one-way ANOVA followed by Bonferroni post hoc test. (E) Lysates were prepared from S2-CP8 cells transfected with control or IQGAP1 siRNA, and S2-CP8 WT or IQGAP1 KO cells. Lysates were probed with the indicated antibodies. (F) S2-CP8 WT or IQGAP1 KO cells were stained with anti-IQGAP1 antibody and phalloidin. (G) PDAC tissues were stained with or without anti-IQGAP1 antibody as the primary antibody and hematoxylin. (H) IQGAP1 mRNA levels in pancreatic adenocarcinoma and normal tissues of the pancreas were analyzed using TCGA and GTEx datasets. The results are shown as scatter plots with the mean ± s.e.m. p Values were calculated using a two-tailed Student’s t-test. (I) TCGA RNA sequencing and clinical outcome data for pancreatic cancer were analyzed. (J), The relationship between overall survival and IQGAP1 expression in PDAC patients with high ARL4C expression was analyzed. (K) The relationship between ARL4C and IQGAP1 expression on patient survival using TCGA dataset was analyzed. (I–K) The data were analyzed by Kaplan–Meier survival curves, and a log-rank test (I,J) or log-rank trend test (K). Scale bars in (B,C,F) 10 μm; (G) 50 μm. KO, knockout. RFI, relative fluorescence intensity. *, p < 0.05; **, p < 0.01. See Figure 3—figure supplement 2—source data 1.
-
Figure 3—figure supplement 2—source data 1
Excel file containing quantitative data for Figure 3—figure supplement 2.
- https://cdn.elifesciences.org/articles/66721/elife-66721-fig3-figsupp2-data1-v2.xlsx
Figure 4 with 1 supplement

The PBR of ARL4C is required for ARL4C and IQGAP1 binding.
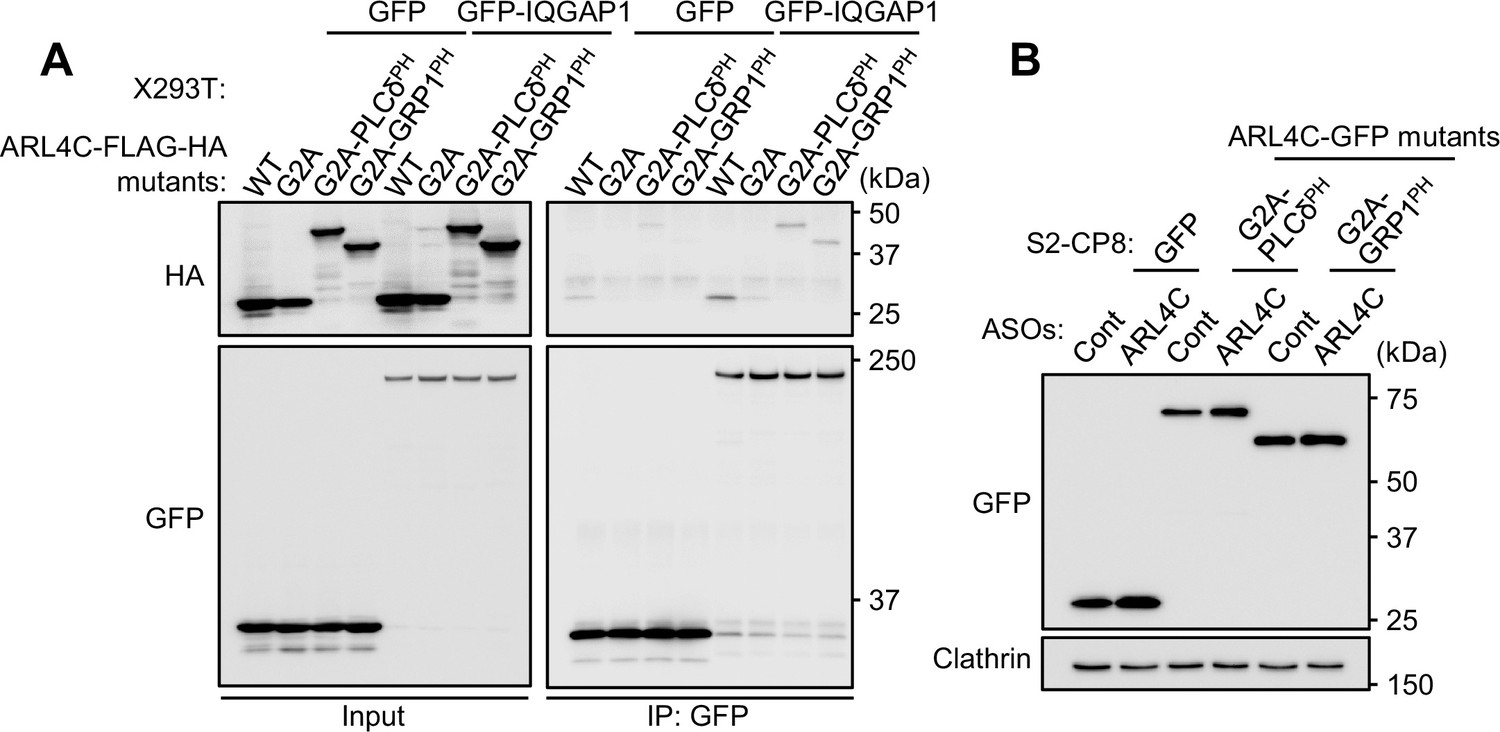
(A) A schematic representation of four ARL4C-GFP mutants is shown. (B) S2-CP8 cells were transfected with the indicated mutants of ARL4C-GFP. The percentages of cells with ARL4C-GFP mutant accumulated at invasive pseudopods compared with the total number of cells were calculated. (C,D) Lysates of X293T cells expressing the indicated proteins were immunoprecipitated with anti-GFP antibody and the immunoprecipitates were probed with anti-HA and anti-GFP antibodies. (E) S2-CP8 WT or ARL4C KO cells transfected with control or the indicated mutants of ARL4C-GFP were stained with anti-IQGAP1 antibody and phalloidin. The percentages of cells with IQGAP1 accumulated at invasive pseudopods compared with the total number of cells were calculated. (F) S2-CP8 WT or IQGAP1 KO cells were transfected with ARL4C-GFP. The percentages of cells with ARL4C-GFP accumulated at invasive pseudopods compared with the total number of cells were calculated. (G) S2-CP8 cells stably expressing GFP or the indicated mutants of ARL4C-GFP were transfected with control or ARL4C ASO and subjected to invasion assays. Invasive ability is expressed as the percentage of the same cells transfected with control ASO. (B,E–G) Data are shown as the mean ± s.d. of three biological replicates. p Values were calculated using a two-tailed Student’s t-test (F,G) or one-way ANOVA followed by Bonferroni post hoc test (B,E). (B,E,F) The regions in the yellow dashed squares are shown enlarged in the left bottom images. The right bottom images are shown in a false color representation of fluorescence intensity. False color representations were color-coded on the spectrum. Scale bars in (B,E,F) 10 μm. KO, knockout. RFI, relative fluorescence intensity. n.s., not significant. *, p < 0.05; **, p < 0.01. See Figure 4—source data 1.
-
Figure 4—source data 1
Excel file containing quantitative data for Figure 4.
- https://cdn.elifesciences.org/articles/66721/elife-66721-fig4-data1-v2.xlsx
Figure 4—figure supplement 1

ARL4C is essential for recruitment of IQGAP1 to invasive pseudopods.
(A-C) S2-CP8 cells were transfected with the indicated mutants of ARL4C-GFP and stained with the indicated antibodies. The percentages of cells with invasive pseudopods compared with the total number of cells were calculated (B). Cells were classified according to the number of pseudopods as indicated (C). (D) S2-CP8 WT or ARL4C KO cells were stained with anti-IQGAP1 antibody and phalloidin. Circles of 2 μm diameter were placed at the edge of pseudopods and mean intensity of each circle was measured. The distribution of the data was depicted as a violin plot and the center lines show the medians. More than 100 pseudopods were calculated for each condition. p Values were calculated using a two-tailed Student’s t-test. (E-G) S2-CP8 WT or IQGAP1 KO cells were stained with the indicated antibodies and the same assays as in (B) and (C) were performed for (F) and (G), respectively. (H) S2-CP8 WT cells transfected with control ASO or ARL4C ASO-1316 were stained with anti-IQGAP1 antibody and phalloidin. The percentages of cells with IQGAP1 accumulated at invasive pseudopods compared with the total number of cells were calculated. (I) S2-CP8 cells expressing GFP or the indicated mutants of ARL4C-GFP were transfected with control or ARL4C ASO-1316. Lysates were probed with the indicated antibodies. (A,D,E,H) The regions in the yellow dashed squares are shown enlarged in the left bottom images. The right bottom images are shown in a false color representation of fluorescence intensity. False color representations were color-coded on the spectrum. (B,F,H) Data are shown as the mean ± s.d. of three biological replicates. p Values were calculated using a two-tailed Student’s t-test (F,H) or one-way ANOVA followed by Bonferroni post hoc test (B). Scale bars in (A,D,E,H) 10 μm. KO, knockout. RFI, relative fluorescence intensity. n.s., not significant. **, p < 0.01. See Figure 4—figure supplement 1—source data 1.
-
Figure 4—figure supplement 1—source data 1
Excel file containing quantitative data for Figure 4—figure supplement 1.
- https://cdn.elifesciences.org/articles/66721/elife-66721-fig4-figsupp1-data1-v2.xlsx
Figure 5 with 1 supplement
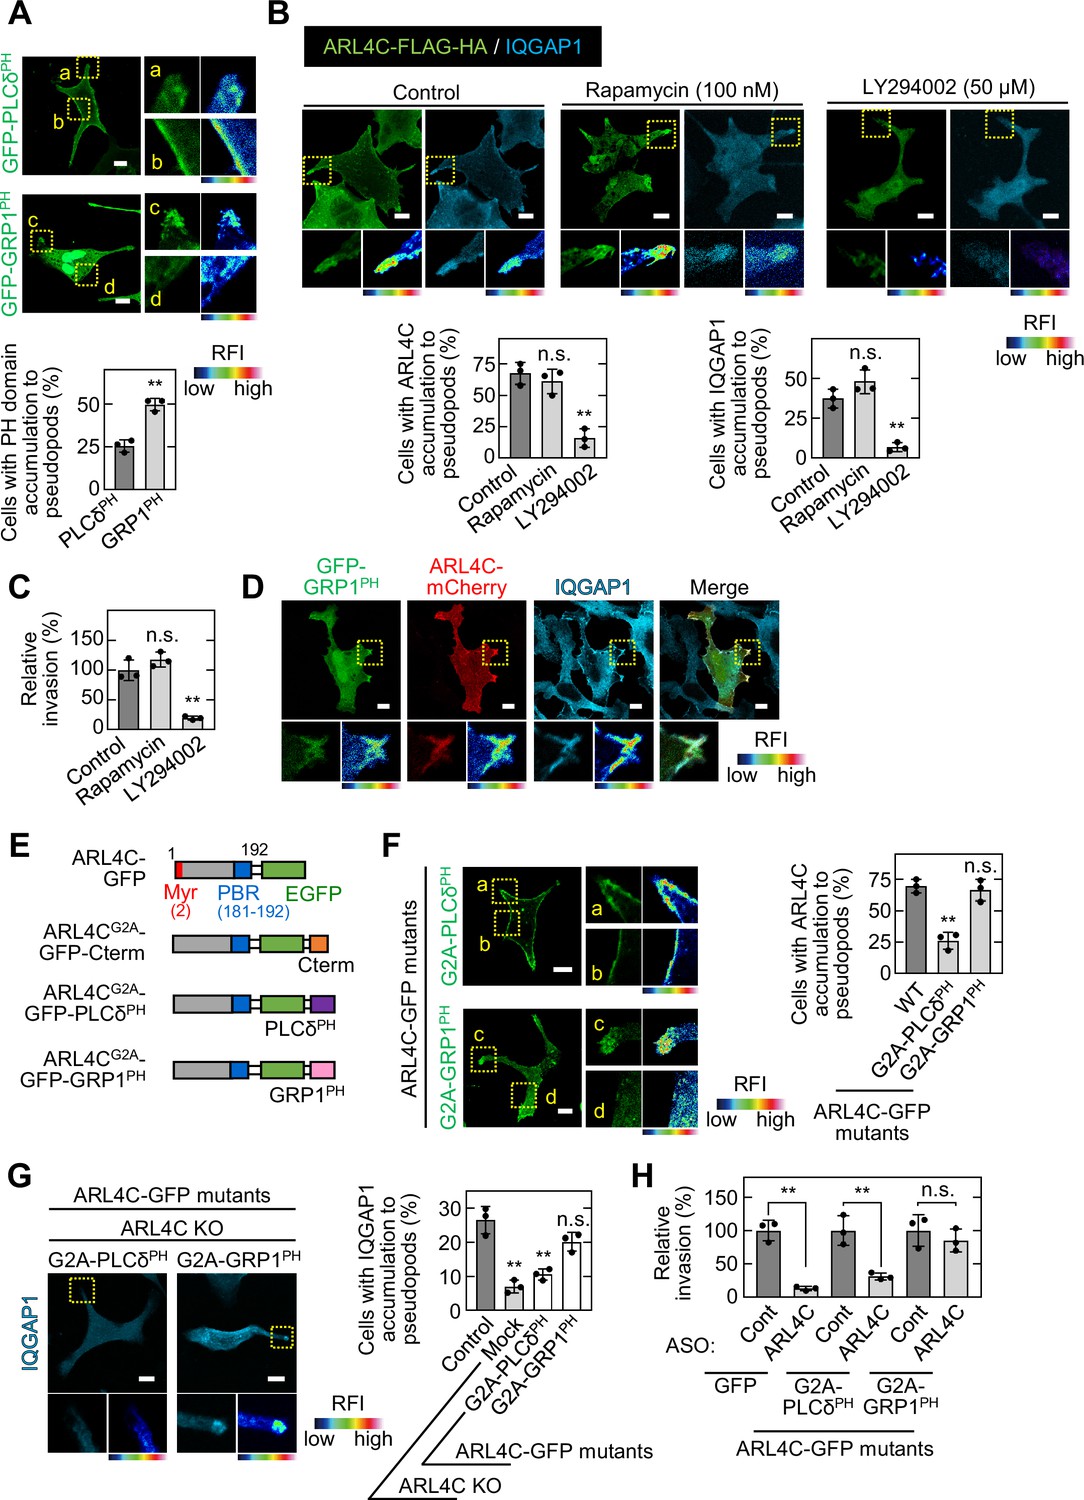
ARL4C recruits IQGAP1 to invasive pseudopods in a PIP3-dependent manner.
(A) S2-CP8 cells were transfected with GFP-PLCδPH or GFP-GRP1PH. The percentages of cells with GFP-PLCδPH or GFP-GRP1PH accumulated at invasive pseudopods compared with the total number of cells were calculated. (B) S2-CP8 cells expressing FRB-CFP, mRFP-FKBP-5-ptase domain, and ARL4C-FLAG-HA were treated with or without rapamycin or LY294002 and stained with anti-HA and anti-IQGAP1 antibodies. The percentages of cells with IQGAP1 or ARL4C-FLAG-HA accumulated at invasive pseudopods compared with the total number of cells were calculated. (C) S2-CP8 cells expressing FRB-CFP and mRFP-FKBP-5-ptase domain were treated with or without rapamycin or LY294002 and subjected to an invasion assay. Invasive abilities are expressed as the percentage of control cells. (D) S2-CP8 cells expressing ARL4C-mCherry and GFP-GRP1PH were stained with anti-IQGAP1 antibody. Images of GFP-GRP1PH, ARL4C-mCherry, and IQGAP1 were merged. (E) A schematic representation of ARL4C-GFP mutants is shown. (F) S2-CP8 cells were transfected with the indicated mutants of ARL4C-GFP. The percentages of cells with ARL4C-GFP mutant accumulated at invasive pseudopods compared with the total number of cells were calculated. (G) ARL4C KO cells expressing control or the indicated mutants of ARL4C-GFP were stained with anti-IQGAP1 antibody. Quantification was performed as in (B). (H) S2-CP8 cells stably expressing GFP or the indicated mutants of ARL4C-GFP were transfected with control or ARL4C ASO and subjected to an invasion assay. Invasive abilities are expressed as the percentage of the same cells transfected with control ASO. (A,F) Enlarged images of the regions in the yellow dashed squares and a false color representation of fluorescence intensity are shown on the right. (a) and (c) show the pseudopods, and (b) and (d) show the cell body. (B,D,G) The regions in the yellow dashed squares are shown enlarged in the left bottom images. The right bottom images are shown in a false color representation of fluorescence intensity. (A–C,F–H) Data are shown as the mean ± s.d. of three biological replicates. p Values were calculated using a two-tailed Student’s t-test (A,H) or one-way ANOVA followed by Bonferroni post hoc test (B,C,F,G). (A,B,D,F,G) False color representations were color-coded on the spectrum. Scale bars in (A,B,D,F,G) 10 μm. KO, knockout. RFI, relative fluorescence intensity. n.s., not significant. **, p < 0.01. See Figure 5—source data 1.
-
Figure 5—source data 1
Excel file containing quantitative data for Figure 5.
- https://cdn.elifesciences.org/articles/66721/elife-66721-fig5-data1-v2.xlsx
Figure 5—figure supplement 1
Interaction of ARL4C mutants and IQGAP1.
(A) Lysates of X293T cells expressing the indicated mutants of ARL4C-FLAG-HA and GFP or GFP-IQGAP1 proteins were immunoprecipitated with anti-GFP antibody, and the immunoprecipitates were probed with the indicated antibodies. (B) S2-CP8 cells expressing GFP or the indicated mutants of ARL4C-GFP were transfected with control or ARL4C ASO-1316. Lysates were probed with the indicated antibodies.
Figure 6 with 1 supplement
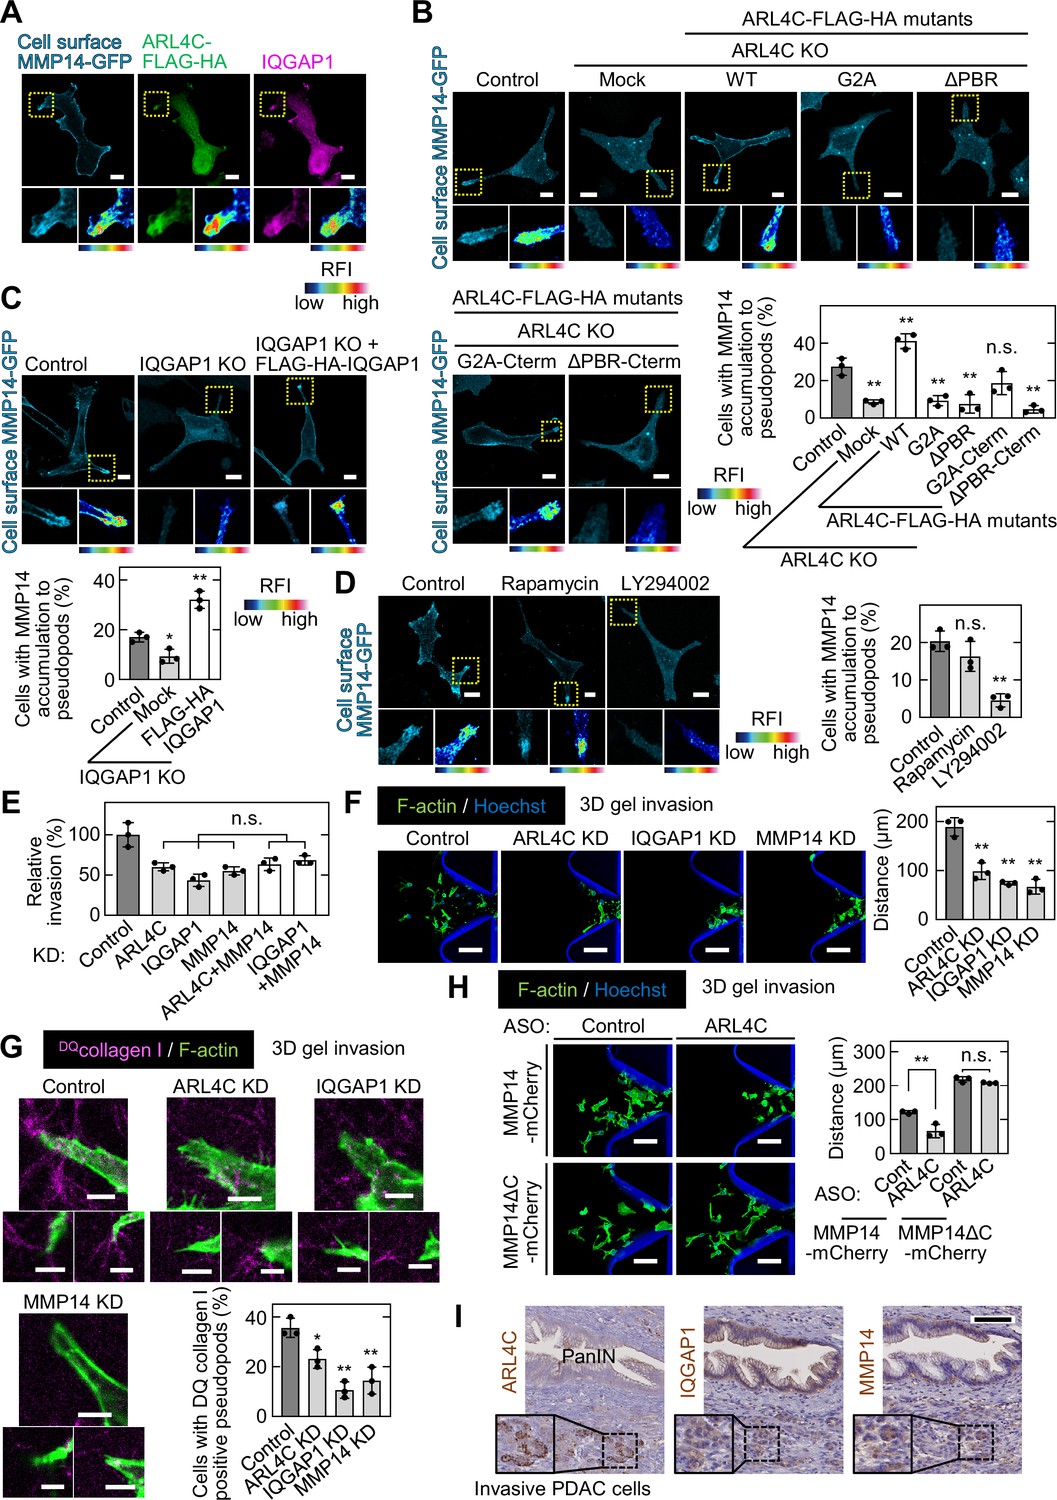
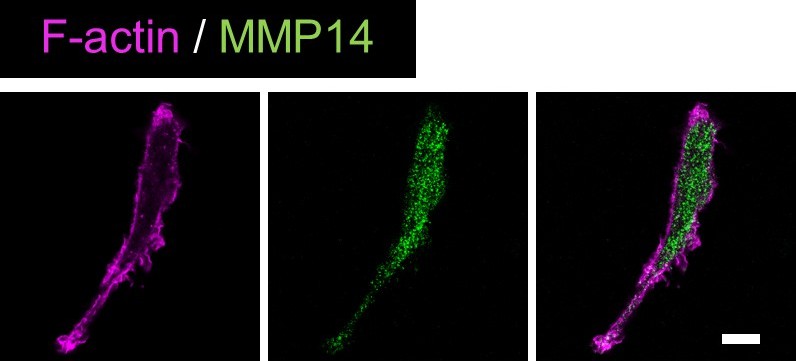
ARL4C is involved in focal delivery of MMP14 to invasive pseudopods through IQGAP1.
(A) S2-CP8 cells expressing MMP14-GFP and ARL4C-FLAG-HA were stained with anti-MMP14 without permeabilization, followed by permeabilization and staining with anti-HA and anti-IQGAP1 antibodies. (B) S2-CP8 WT or ARL4C KO cells expressing MMP14-GFP and the indicated mutants of ARL4C-FLAG-HA were stained with anti-MMP14 without permeabilization. The percentages of cells with MMP14 accumulated at invasive pseudopods compared with the total number of cells were calculated. (C) The same assay as in (B) was performed except with S2-CP8 WT or IQGAP1 KO cells expressing MMP14-GFP and FLAG-HA-IQGAP1. (D) S2-CP8 cells expressing MMP14-GFP, FRB-CFP, and mRFP-FKBP-5-ptase domain were treated with 100 nM rapamycin or 50 µM LY294002 for 30 min. Staining and quantification were performed as in (B). (E) S2-CP8 cells depleted of the indicated proteins were subjected to an invasion assay. Invasive activities are expressed as the percentage of control cells. (F–H) S2-CP8 cells (F,G) or S2-CP8 cells expressing MMP14-mCherry or MMP14ΔC-mCherry (H) depleted of the indicated proteins were subjected to a 3D collagen I gel invasion assay with DQcollagen I. The distances from the edge of the gel interface of all cells that invaded into the gel were measured (F,H). The percentages of cells with DQcollagen I-positive pseudopods compared with the total number of cells were calculated (G). (I) PDAC tissues were stained with the indicated antibodies and hematoxylin. The regions in the black dashed squares are shown enlarged in the solid squares. Nine patient samples were imaged and the representative images are shown. (A–D) The regions in the yellow dashed squares are shown enlarged in left bottom and a false color representation of fluorescence intensity is shown in right bottom. False color representations were color-coded on the spectrum. (B–H) Data are shown as the mean ± s.d. of three biological replicates. p Values were calculated using a two-tailed Student’s t-test (H) or one-way ANOVA followed by Bonferroni post hoc test (B–G). Scale bars in (A–D) 10 μm; (F,H) 100 µm; (G) 5 µm; (I) 100 µm. KO, knockout; KD, knockdown. RFI, relative fluorescence intensity. n.s., not significant. *, p < 0.05; **, p < 0.01. See Figure 6—source data 1.
-
Figure 6—source data 1
Excel file containing quantitative data for Figure 6.
- https://cdn.elifesciences.org/articles/66721/elife-66721-fig6-data1-v2.xlsx
Figure 6—figure supplement 1
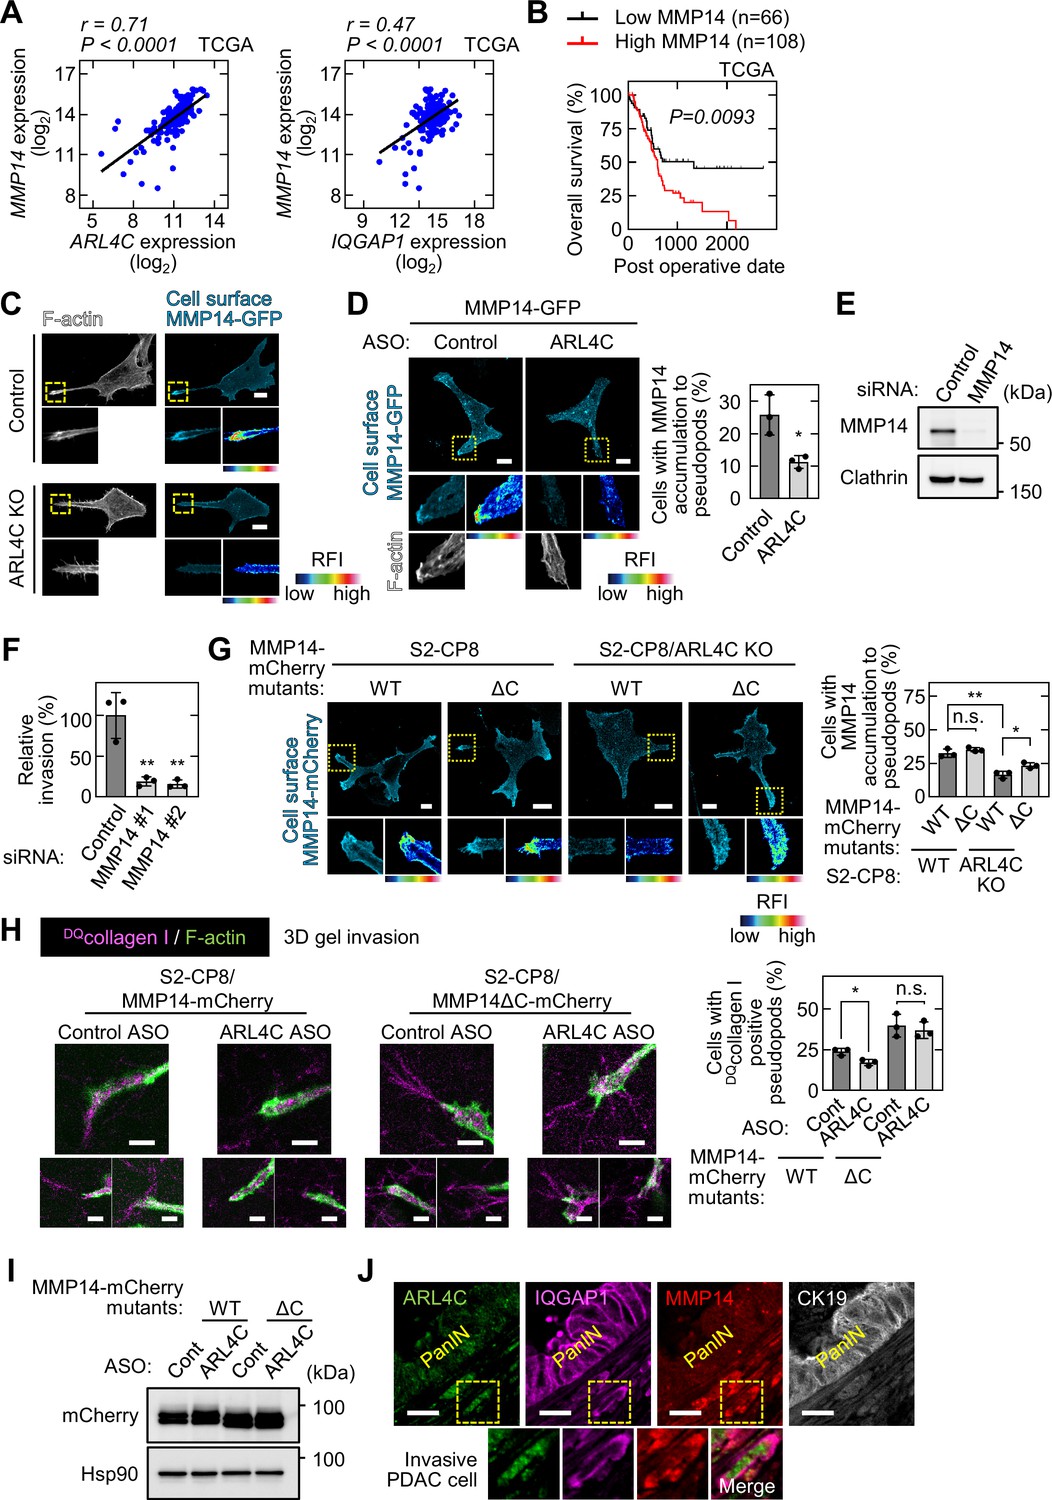
ARL4C recruits MMP14 to invasive pseudopods and their expression is associated with poor prognosis in pancreatic cancer patients.
(A) Scatter plot showing the correlation between the mRNA expression levels of ARL4C or IQGAP1 (X-axis) and MMP14 (Y-axis) in pancreatic cancer patients obtained from TCGA datasets using the R2: Genomics Analysis and Visualization Platform. r indicates the Pearson’s correlation coefficient. (B) TCGA RNA sequencing and clinical outcome data for pancreatic cancer were analyzed. The data were analyzed by Kaplan–Meier survival curves, and a log-rank test was used for statistical analysis. (C) S2-CP8 WT or ARL4C KO cells expressing MMP14-GFP were stained with anti-MMP14 antibody without permeabilization and then labeled with phalloidin. (D) S2-CP8 WT cells expressing MMP14-GFP were transfected with control ASO or ARL4C ASO-1316. Cells were stained with anti-MMP14 antibody without permeabilization and then labeled with phalloidin. The percentages of cells with MMP14 accumulated at invasive pseudopods compared with the total number of cells were calculated. (E) Lysates of S2-CP8 cells transfected with control or MMP14 siRNA were probed with anti-MMP14 and anti-Clathrin antibodies. (F) S2-CP8 cells transfected with control or MMP14 siRNAs were subjected to invasion assay. Invasive abilities are expressed as the percentage of control cells. (G) S2-CP8 cells or ARL4C KO S2-CP8 cells expressing MMP14-mCherry or MMP14ΔC-mCherry were stained with anti-MMP14 antibody without permeabilization. The percentages of cells with MMP14 accumulated at invasive pseudopods compared with the total number of cells were calculated. (H) S2-CP8 cells stably expressing MMP14-mCherry and MMP14ΔC-mCherry were transfected with control or ARL4C ASO-1316 and were then subjected to a 3D collagen I gel invasion assay with DQcollagen I. The cells were stained with phalloidin. Three representative images for each condition are shown. Percentages of cells with DQcollagen I-positive pseudopods compared with the total number of cells were calculated. (I) S2-CP8 cells stably expressing MMP14-mCherry and MMP14ΔC-mCherry were transfected with control or ARL4C ASO-1316. Lysates were probed with the indicated antibodies. (J) PDAC tissues were stained with the indicated antibodies. The regions in the yellow dashed squares are shown enlarged in the bottom. Images of ARL4C, IQGAP1, and MMP14 were merged as the right bottom panel shows. Nine patient samples were imaged and the representative images are shown. (D,F-H) Data are shown as the mean ± s.d. of three biological replicates. p Values were calculated using a two-tailed Student’s t-test (D,H) or one-way ANOVA followed by Bonferroni post hoc test (F,G). (C,D,G) The regions in the yellow dashed squares are shown enlarged in the left bottom images. The right bottom images are shown in a false color representation of fluorescence intensity. False color representations were color-coded on the spectrum. Scale bars in (C,D,G,H) 10 μm; (J) 20 μm. KO, knockout. RFI, relative fluorescence intensity. n.s., not significant. *, p < 0.05; **, p < 0.01. See Figure 6—figure supplement 1—source data 1.
-
Figure 6—figure supplement 1—source data 1
Excel file containing quantitative data for Figure 6—figure supplement 1.
- https://cdn.elifesciences.org/articles/66721/elife-66721-fig6-figsupp1-data1-v2.xlsx
Figure 7 with 1 supplement

ARL4C ASO inhibits pancreatic tumor metastasis in vivo.
(A) S2-CP8/Luciferase cells were implanted into the pancreas of nude mice, and control ASO (n = 6) or ARL4C ASO-1316 (n = 7) was subcutaneously administered. (B) Bioluminescence images of the intraperitoneal tumors are presented (left) and quantification of the tumor burden is shown (right). The data are presented as the mean ± s.e.m. of the fold change in luminescent intensity relative to that of week 1 treated with control ASO. (C) Sections from the pancreatic tumors from control ASO- or ARL4C ASO-1316-treated tumor-bearing mice were stained with anti-ARL4C antibody and hematoxylin. (D) Representative images of the tumors in the pancreas (left bottom) and metastatic mesenteric lymph nodes (top and right bottom) are shown. (E) Primary tumor weight (left) and metastatic mesenteric lymph node number are presented (right). Data are shown as the mean ± s.e.m. (F,G) Four hr after subcutaneous injection of 6-FAM-ARL4C ASO-1316 into tumor-bearing mice, the fluorescence intensities of various organs were measured (F), and the sections prepared from the pancreas were stained with the indicated antibodies (G). Area indicated by yellow dashed square is enlarged on the right panel (F). (H) Total RNA was extracted from tumors of control ASO- or ARL4C ASO-1316-treated tumor-bearing mice. Tumor block was cut into three pieces from each tumor of 2 mice per group. ARL4C mRNA levels were measured by quantitative real-time PCR. Relative ARL4C mRNA levels were normalized to those of B2M and expressed as fold changes compared with the levels in one of the control samples. (I) Sections from the pancreatic tumors were stained with anti-IQGAP1 antibody and hematoxylin. The two panels on the right show enlarged images of the yellow dashed squares. Positive staining of IQGAP1 is color-coded as yellow (weakly positive) or red (strongly positive). The percentage of the strongly positive IQGAP1 area was calculated. Data are shown as the mean ± s.e.m. Twenty fields were analyzed from 3 mice per group. (J) Sections from the pancreatic tumor were stained with the indicated antibodies. The numbers of tumor cells in the lymphatic vessels (indicated with yellow arrowheads) were counted. Data are shown as the mean ± s.e.m. Thirty lymphatic vessels were analyzed from 3 mice per group. (K,L) RNA sequencing was performed for S2-CP8-derived primary tumors, and the results of principal component analysis (K) and hierarchical clustering (L) are shown. (M) Differentially expressed genes were subjected to Ingenuity Pathway Analysis (IPA). The top five disease or function annotations of the positive and negative Z-score groups are shown. Bars indicate the -log10 (p value). Inhibited pathways are represented by blue-colored bars while activated pathways are shown by red-colored bars. (B,E,H-J) p Values were calculated using a two-tailed Student’s t-test. Scale bars in (D) 5 mm; (C,G,I) 50 µm; (J) 20 µm. n.s., not significant. *, p < 0.05; **, p < 0.01. See Figure 7—source data 1 and Figure 7—source data 2.
-
Figure 7—source data 1
Excel file containing quantitative data for Figure 7.
- https://cdn.elifesciences.org/articles/66721/elife-66721-fig7-data1-v2.xlsx
-
Figure 7—source data 2
Excel file containing quantitative data for Figure 7.
- https://cdn.elifesciences.org/articles/66721/elife-66721-fig7-data2-v2.xlsx
Figure 7—figure supplement 1
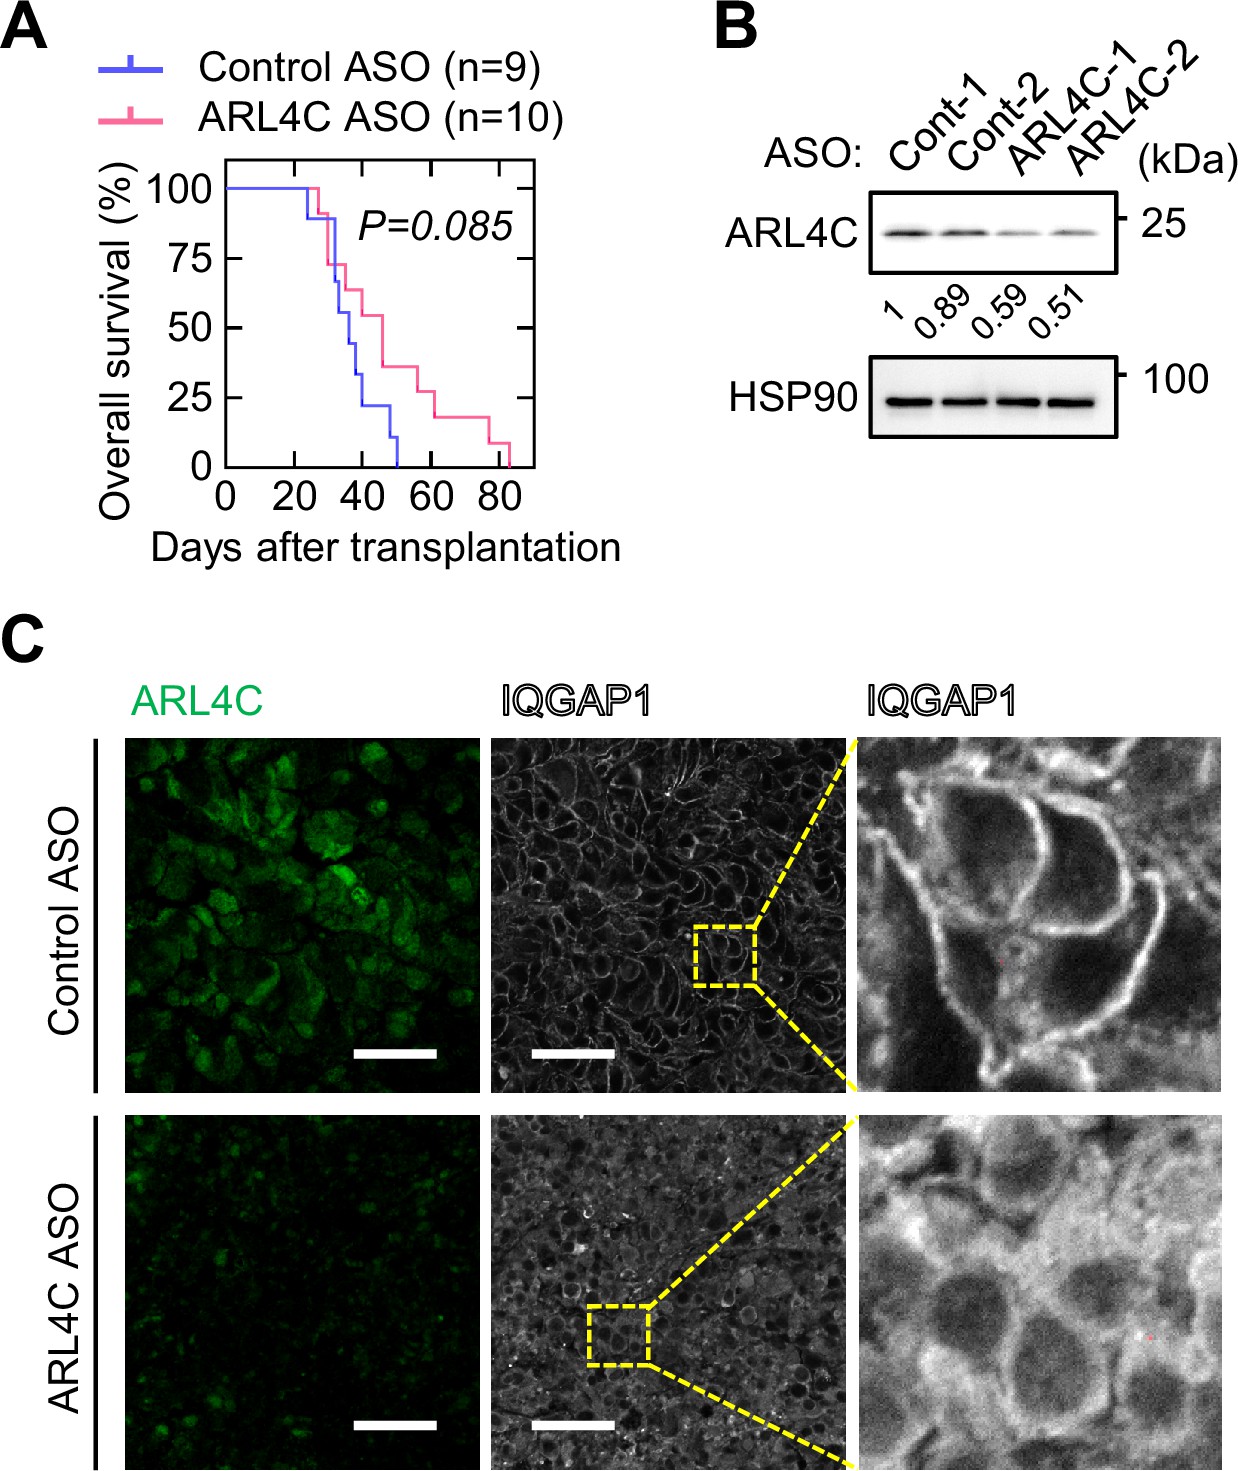
ARL4C ASO-1316 extends the survival of orthotopically transplanted mice.
(A) S2-CP8/Luciferase cells were implanted into the pancreas of nude mice, and control ASO (n = 9) or ARL4C ASO-1316 (n = 10) were administered subcutaneously twice a week. The Kaplan–Meier survival curve for the mice is shown. Statistical significance was determined by a log-rank test. (B) Lysates from tumors of mice injected with control ASO or ARL4C ASO-1316 were probed with the indicated antibodies. The intensity of the bands was quantified and the ratios of each sample to Cont-1 sample were shown below the bands. (C) Sections from the pancreatic tumor were stained with the indicated antibodies. Panels on the right show enlarged images of the yellow dashed squares. Scale bar in (C) 50 μm. See Figure 7—figure supplement 1—source data 1.
-
Figure 7—figure supplement 1—source data 1
Excel file containing quantitative data for Figure 7—figure supplement 1.
- https://cdn.elifesciences.org/articles/66721/elife-66721-fig7-figsupp1-data1-v2.xlsx
Author response image 1
Validation of anti-MMP14 antibody.S2-CP8 cells were stained with anti-MMP14 antibody and phalloidin.
Author response image 2
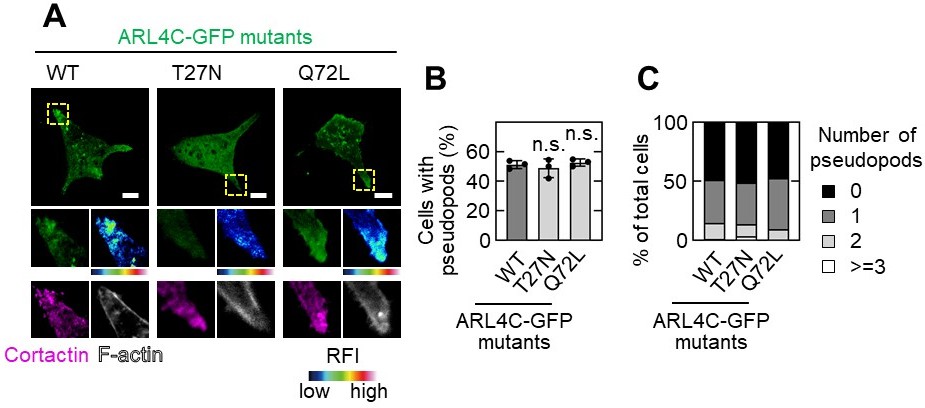
Effect of ARL4C mutants on pseudopod formation.
A,B,C, S2-CP8 cells were transfected with the indicated mutants of ARL4C-GFP and stained with the indicated antibodies (A).The percentages of cells with invasive pseudopods compared with the total number of cells were calculated (B). Cells were classified according to the number of pseudopods as indicated (C). A, The regions in the yellow dashed squares are shown enlarged in the left bottom images. The right bottom images are shown in a false color representation of fluorescence intensity. False color representations were color-coded on the spectrum. (B), Data are shown as the mean ± s.d. of 3 biological replicates. P values were calculated using one-way ANOVA followed by Bonferroni post hoc test. Scale bars in A, 10 μm. RFI, relative fluorescence intensity. n.s., not significant.
Author response image 3
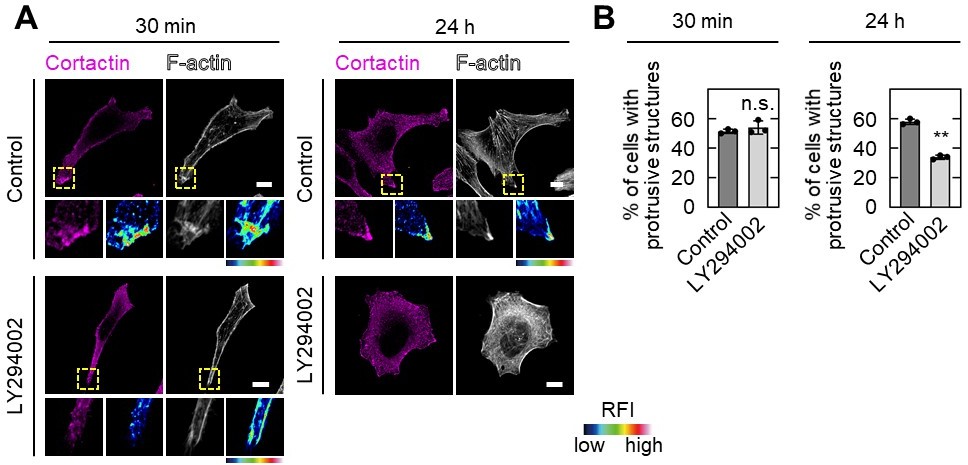
Effect of LY294002 treatment on pseudopod formation.
A,B, S2-CP8 cells were treated with or without 50 µM LY294002 for 30 min or 24 h before fixation, and stained with the indicated antibodies (A).The percentages of cells with protrusive structures compared with the total number of cells were calculated (B). A, The regions in the yellow dashed squares are shown enlarged in the left bottom images. The right bottom images are shown in a false color representation of fluorescence intensity. False color representations were color-coded on the spectrum. (B), Data are shown as the mean ± s.d. of 3 biological replicates. P values were calculated using a two-tailed Student’s t-test. Scale bars in A, 10 μm. RFI, relative fluorescence intensity. n.s., not significant. **, P < 0.01.
Tables
Table 1
Univariate analysis and multivariate analysis of overall survival by Cox’s Proportional Hazard model.
| Univariate analysis | ||||
|---|---|---|---|---|
| Parameters | Hazard ratio | 95% CI | P value | |
| ARL4C(low/high) | 3.51 | 1.06 | 11.70 | 0.040 |
| Sex(Male/Female) | 1.10 | 0.54 | 2.24 | 0.80 |
| Age( < 65/≧65) | 1.05 | 0.47 | 2.35 | 0.91 |
| Tumor Location(Head/Body or Tail) | 0.41 | 0.18 | 0.94 | 0.036 |
| pStage(IA-IIA/IIB-III) | 2.51 | 1.17 | 5.41 | 0.019 |
| pT(1-2/3) | 5.29 | 1.23 | 22.70 | 0.025 |
| pN(0/1) | 2.51 | 1.17 | 5.41 | 0.019 |
| ly(0/1–3) | 2.74 | 1.17 | 6.46 | 0.021 |
| v(0/1–3) | 2.05 | 1.00 | 4.20 | 0.049 |
| ne(0/1–3) | 28,258 | 5.25E-36 | 1.52E + 44 | 0.83 |
| Multivariate analysis | ||||
| Parameters | Hazard ratio | 95% CI | P value | |
| pT(1-2/3) | 3.72 | 0.78 | 17.7 | 0.099 |
| pN(0/1) | 1.80 | 0.79 | 4.10 | 0.16 |
| ARL4C(low/high) | 3.56 | 1.03 | 12.3 | 0.044 |
-
Hazard ratios with 95 % confidence intervals (CIs) were calculated using a Cox regression model and P values were calculated using a log-rank test. CI, confidence interval; pT, primary tumor; pN, regional lymph node; ly, lymphatic invasion; v, venous invasion; ne, perineural invasion.
Key resources table
| Reagent type (species) or resource | Designation | Source or reference | Identifiers | Additional information |
|---|---|---|---|---|
| Strain, strain background (Mus musculus, male) | BALB/cAJcl-nu/nu | CLEA | Ten-week-old | |
| Cell line (Homo sapiens) | Lenti-X 293T | Takara Bio Inc | ||
| Cell line (Homo sapiens) | HeLaS3 | K.Matsumoto (Nagoya University, Aichi, Japan) | RRID:CVCL_0058 | |
| Cell line (Homo sapiens) | S2-CP8 | Cell Resource Center for Biomedical Research, Institute of Development, Aging and Cancer, Tohoku University | RRID:CVCL_F971 | |
| Cell line (Homo sapiens) | PANC-1 | RIKEN Bioresource Center Cell Bank | RRID:CVCL_0480 | |
| Cell line (Homo sapiens) | BxPC-3 | American Type Culture Collection | RRID:CVCL_0186 | |
| Cell line (Homo sapiens) | HPAF-II | American Type Culture Collection | RRID:CVCL_0313 | |
| Transfected construct (Homo sapiens) | ARL4C-EGFP | This paper | Various mutants of ARL4C | |
| Transfected construct (Homo sapiens) | ARL4CG2A-EGFP | This paper | Various mutants of ARL4C | |
| Transfected construct (Homo sapiens) | ARL4CT27N-EGFP | This paper | Various mutants of ARL4C | |
| Transfected construct (Homo sapiens) | ARL4CQ72L-EGFP | This paper | Various mutants of ARL4C | |
| Transfected construct (Homo sapiens) | ARL4CΔPBR-EGFP | This paper | Various mutants of ARL4C | |
| Transfected construct (Homo sapiens) | ARL4CG2A-EGFP-Cterm | This paper | Various mutants of ARL4C | |
| Transfected construct (Homo sapiens) | ARL4CΔPBR-EGFP-Cterm | This paper | Various mutants of ARL4C | |
| Transfected construct (Homo sapiens) | ARL4CG2A-EGFP-GRP1PH | This paper | Various mutants of ARL4C | |
| Transfected construct (Homo sapiens) | ARL4CG2A-EGFP-PLCδPH | This paper | Various mutants of ARL4C | |
| Transfected construct (Homo sapiens) | ARL4C-mCherry | This paper | Various mutants of ARL4C | |
| Transfected construct (Homo sapiens) | ARL4C-tdTomato | This paper | Various mutants of ARL4C | |
| Transfected construct (Homo sapiens) | ARL4C-FLAG-HA | This paper | Various mutants of ARL4C | |
| Biological sample (Homo sapiens) | Resected specimens of 57 patients with PDAC | Osaka University | ||
| Antibody | ARL4C (rabbit polyclonal) | Atlas Antibodies | #HPA028927 | (WB 1:1000, IHC 1:50) |
| Antibody | Clathrin (mouse monoclonal) | BD Biosciences | #610,500 | (WB 1:1000) |
| Antibody | EGR1 (rabbit monoclonal) | Cell Signaling Technology | #4,153 S | (WB 1:1000) |
| Antibody | β-catenin (mouse monoclonal) | BD Biosciences | #610,154 | (WB 1:1000) |
| Antibody | Ras (G12D) (rabbit monoclonal) | Cell Signaling Technology | #14,429 S | (WB 1:1000) |
| Antibody | Hsp90 (mouse monoclonal) | BD Biosciences | #610,419 | (WB 1:1000) |
| Antibody | HA (mouse monoclonal) | BioLegend | #901,502 | (WB 1:1000) |
| Antibody | HA (rat monoclonal) | Roche | #1867423001 | (ICC 1:100) |
| Antibody | GFP (rabbit polyclonal) | Life Technologies/Thermo Fisher Scientific | #A6455 | (WB 1:4000) |
| Antibody | GFP (mouse monoclonal) | Santa Cruz Santa Cruz Biotechnology | #sc-9996 | (WB 1:1000) |
| Antibody | FLAG (mouse monoclonal) | WAKO | #014–22,383 | (WB 1:1000) |
| Antibody | IQGAP1 (mouse monoclonal) | Santa Cruz Santa Cruz Biotechnology | #sc-376021 | (WB 1:1000, IHC 1:800, ICC 1:100) |
| Antibody | MMP14 (rabbit monoclonal) | Abcam | #ab51074 | (WB 1:1000, IHC 1:200, ICC 1:100) |
| Antibody | Cytohesin2 (rabbit polyclonal) | Proteintech Group, Inc | #67185–1-Ig | (ICC 1:100) |
| Antibody | Rac1 (mouse monoclonal) | BD Biosciences | #610,651 | (WB 1:1000) |
| Antibody | Cdc42 (rabbit polyclonal) | Cell Signaling Technology | #2,466 S | (WB 1:1000) |
| Antibody | CK19 (rabbit monoclonal) | Abcam | #ab52625 | (IHC 1:100) |
| Antibody | Mitochondria (mouse monoclonal) | Merck Millipore | #MAB1273 | (IHC 1:100) |
| Antibody | LYVE-1 (rabbit polyclonal) | Abcam | #ab14917 | (IHC 1:100) |
| Antibody | YAP/TAZ (rabbit monoclonal) | Cell Signaling Technology | #8,418 S | (ICC 1:100) |
| Antibody | Paxillin (mouse monoclonal) | BD Biosciences | #610,052 | (ICC 1:100) |
| Antibody | FAK(mouse monoclonal) | BD Biosciences | #610,087 | (ICC 1:100) |
| Antibody | P-Paxillin (Y118)(rabbit polyclonal) | Cell Signaling Technology | #2,541 S | (ICC 1:100) |
| Antibody | P-FAK (Y397)(rabbit monoclonal) | Life Technologies/Thermo Fisher Scientific | #44,625 G | (ICC 1:100) |
| Antibody | Cortactin(mouse monoclonal) | Merck Millipore | #05–180 | (ICC 1:100) |
| Antibody | ARL4C (rabbit polyclonal) | This paper | SAJ5550275 | (ICC 1:100) |
| Recombinant DNA reagent | pEGFPC2-IQGAP1 (plasmid) | K.Kaibuchi (Nagoya University, Japan) | ||
| Recombinant DNA reagent | pEGFP-mCyth2 (plasmid) | J.Yamauchi (Tokyo University of Pharmacy and Life Science, Japan), | ||
| Recombinant DNA reagent | pAcGFP-mPlcd1PH (plasmid) | M.Matsuda (Kyoto University, Kyoto, Japan) | ||
| Recombinant DNA reagent | CSII-CMV-MCS-IRES2-Bsd (plasmid) | H.Miyoshi (RIKEN Bioresource Center, Ibaraki, Japan) | ||
| Recombinant DNA reagent | pEGFPN3-hARL4C (plasmid) | A.Kikuchi (Osaka University, Osaka, Japan) | ||
| Recombinant DNA reagent | pEGFPN3-hGRP1 (plasmid) | This paper | Full length cDNAs of GRP1 ORF were reversely transcribed from mRNA extracted from MCF-7 cells. | |
| Recombinant DNA reagent | pEGFPN3-hMMP14 (plasmid) | This paper | Full length cDNAs of MMP14 ORF were reversely transcribed from mRNA extracted from U2OS cells. | |
| Recombinant DNA reagent | mRFP-FKBP-5-ptase-dom | Addgene | 67,516 | |
| Recombinant DNA reagent | PM-FRB-CFP | Addgene | 67,517 | |
| Sequence-based reagent | siRNA: randomized control | This paper | 5'-CAGTCGCGTTTGCGACTGG-3' | |
| Sequence-based reagent | siRNA: human IQGAP1#1 | This paper | 5'-GCTGCACATAGTTGCCTTT-3' | |
| Sequence-based reagent | siRNA: human IQGAP1#2 | This paper | 5'-CCCTAATGTAGAATGTCAT-3' | |
| Sequence-based reagent | siRNA: human CYTH2#1 | This paper | 5'-GGATGGAGCTGGAGAACAT-3' | |
| Sequence-based reagent | siRNA: human CYTH2#2 | This paper | 5'-GCAGTTTCTATGGAGCTTT-3' | |
| Sequence-based reagent | siRNA: human ARPC2#1 | This paper | 5'-GCCTATATTCACACACGTA-3' | |
| Sequence-based reagent | siRNA: human ARPC2#2 | This paper | 5'-CCTATATTCACACACGTAT-3' | |
| Sequence-based reagent | siRNA: human MMP14#1 | This paper | 5'-GCAGCCTCTCACTACTCTT-3' | |
| Sequence-based reagent | siRNA: human MMP14#2 | This paper | 5'-CCGACATCATGATCTTCTT-3' | |
| Sequence-based reagent | siRNA: human KRAS#1 | This paper | 5'-GCATCATGTCCTATAGTTT-3' | |
| Sequence-based reagent | siRNA: human KRAS#2 | This paper | 5'-GTTGGAGCTGATGGCGTAG-3' | |
| Sequence-based reagent | siRNA: human CTNNB1#1 | This paper | 5'-CCCACTAATGTCCAGCGTT-3' | |
| Sequence-based reagent | siRNA: human CTNNB1#2 | This paper | 5'-GCATAACCTTTCCCATCAT-3' | |
| Sequence-based reagent | Antisense oligonucleotide: randomized control | This paper | T(Y)^a^g^A(Y)^g^a^G(Y)^t^a^5(Y)^c^c^A(Y)^t^c (Lower case = DNA; N(Y) = AmNA; 5(Y) = AmNA_mC; ^ = Phosphorothioated) | |
| Sequence-based reagent | Antisense oligonucleotide: ARL4C-1316 | This paper | G(Y)^5(Y)^A(Y)^t^a^c^c^t^c^a^g^g^T(Y)^A(Y)^a (Lower case = DNA; N(Y) = AmNA; 5(Y) = AmNA_mC; ^ = Phosphorothioated) | |
| Sequence-based reagent | human GAPDH_F | This paper | PCR primers | 5'-TCCTGCACCACCAACTGCTT-3' |
| Sequence-based reagent | human GAPDH_R | This paper | PCR primers | 5'-TGGCAGTGATGGCATGGAC-3' |
| Sequence-based reagent | human B2M_F | This paper | PCR primers | 5'-TGCTGTCTCCATGTTTGATGTATC-3 |
| Sequence-based reagent | human B2M_R | This paper | PCR primers | 5'-TCTCTGCTCCCCACCTCTAAG-3' |
| Sequence-based reagent | human ARL4C_F | This paper | PCR primers | 5'-AGGGGCTGTGAAGCTGAGTA-3’ |
| Sequence-based reagent | human ARL4C_R | This paper | PCR primers | 5'-TTCCAGGCTGAAAAGCAGTT –3' |
| Sequence-based reagent | human ARPC2_F | This paper | PCR primers | 5'-AGATTTCGATGGGGTCCTCT-3' |
| Sequence-based reagent | human ARPC2_R | This paper | PCR primers | 5'-CCGGAAGATTTTCAAGGTCA-3' |
| peptide, recombinant protein | FLAG peptide | Sigma-Aldrich | F3290 | |
| Commercial assay or kit | Lipofectamine2000 transfection reagent | Life Technologies/Thermo Fisher Scientific | 11668019 | |
| Commercial assay or kit | Lipofectamine LTX reagent | Life Technologies/Thermo Fisher Scientific | 15338100 | |
| Commercial assay or kit | RNAiMAX | Life Technologies/Thermo Fisher Scientific | 13778075 | |
| Commercial assay or kit | ViaFect | Promega Corp. | E4981 | |
| Commercial assay or kit | TrypLE Express Enzyme | Thermo Fisher Scientific | 12604013 | |
| Commercial assay or kit | PrimeSTAR Max DNA Polymerase | Takara Bio Inc | R045A | |
| Commercial assay or kit | In-Fusion HD Cloning Kit | Clontech | 639,649 | |
| Commercial assay or kit | DakoReal EnVision Detection System | Dako | K500711-2 | |
| Commercial assay or kit | Peroxidase-Blocking Solution | Dako | S202386-2 | |
| Commercial assay or kit | G-Block | GenoStaff | GB-01 | |
| Commercial assay or kit | Blocking One Histo | nacalai tesque | 06349–64 | |
| Commercial assay or kit | rat tail type I collagen | Corning Inc | 354,236 | |
| Commercial assay or kit | DQ-collagen type I | Invitrogen | D12060 | |
| Commercial assay or kit | 3D microfluidic cell culture chip | AIM Biotech | DAX-1 | |
| Commercial assay or kit | QCM Gelatin Invadopodia Assay (Red) | Merck Millipore | ECM671 | |
| Commercial assay or kit | poly-D-lysine | Sigma-Aldrich | P6407 | |
| Commercial assay or kit | Matrigel Growth Factor Reduced | Corning Inc | 354,230 | |
| Commercial assay or kit | 6.5 mm Transwell with 8.0 µm Pore Polycarbonate Membrane Insert | Corning Inc | 3,422 | |
| Commercial assay or kit | BioCoat Matrigel Invasion Chambers with 8.0 µm PET Membrane | Corning Inc | 354,480 | |
| Commercial assay or kit | Annexin V-FITC Apoptosis Detection Kit | nacalai tesque | 15342–54 | |
| Commercial assay or kit | protein A Sepharose beads | GE Healthcare | 17078001 | |
| Commercial assay or kit | Dynabeads Protein G | Thermo Fisher Scientific | DB10003 | |
| Commercial assay or kit | Pierce Silver Stain for Mass Spectrometry | Thermo Fisher Scientific | 24,600 | |
| Commercial assay or kit | O.C.T. Compound | Sakura Finetek | ||
| Commercial assay or kit | NucleoSpin RNA | MACHEREY-NAGEL GmbH & Co. KG | 740,955 | |
| Commercial assay or kit | ReverTra Ace qPCR RT Master Mix | TOYOBO | FSQ-201 | |
| Commercial assay or kit | Pierce BCA Protein Assay Kit | Thermo Fisher Scientific | 23,227 | |
| Chemical compound, drug | PD184161 | Sigma-Aldrich | PZ0112 | |
| Chemical compound, drug | U0126 | Promega Corp. | V1121 | |
| Chemical compound, drug | Rapamycin | Cell Signaling Technology | 9,904 | |
| Chemical compound, drug | LY294002 | Cell Signaling Technology | 9,901 | |
| Chemical compound, drug | VivoGlo luciferin | Promega Corp. | P1043 | |
| Software, algorithm | HALO | Indica Labs | RRID:SCR_018350 | |
| Software, algorithm | NanoZoomer-SQ | Hamamatsu Photonics K.K. | ||
| Software, algorithm | UCSC Xena browser | http://xena.ucsc.edu | RRID:SCR_018938 | |
| Software, algorithm | Kaplan–Meier plotter | http://www.kmplot.com | RID:SCR_018753 | |
| Software, algorithm | GraphPad Prism 8 | GraphPad Software. | RRID:SCR_002798 | |
| Software, algorithm | Excel Toukei | ESUMI Co., Ltd. | ||
| Software, algorithm | Imaris | Bitplane | RRID:SCR_007370 | |
| Software, algorithm | Image J | National Institutes of Health | RRID:SCR_003070 | |
| Software, algorithm | Living Image 4.3.1 Software | Caliper Life Sciences | RRID:SCR_014247 | |
| Software, algorithm | ikra v1.2.2 | https://zenodo.org/record/3606888 (Yu et al., 2019) | ||
| Software, algorithm | iDEP.90 | http://bioinformatics.sdstate.edu/idep90/ (Ge et al., 2020) | ||
| Software, algorithm | Ingenuity Pathway Analysis | IPA; Qiagen | RRID:SCR_008653 | |
| Other | LSM880 laser scanning microscope | Carl Zeiss | ||
| Other | BZ-9000 | Keyence | ||
| Other | IVIS imaging system | Xenogen Corp. | ||
| Other | Hoechst33342 | Invitrogen | H1399 | |
| Other | Alexa Fluor 488 Phalloidin | Invitrogen | A12379 | |
| Other | Alexa Fluor 546 Phalloidin | Invitrogen | A22283 | |
| Other | Alexa Fluor 647 Phalloidin | Invitrogen | A22287 |
Additional files
-
Supplementary file 1
Supplementary information for the data and methods supporting the article.
- https://cdn.elifesciences.org/articles/66721/elife-66721-supp1-v2.docx
-
Transparent reporting form
- https://cdn.elifesciences.org/articles/66721/elife-66721-transrepform1-v2.docx
-
Source data 1
Supplementary File 1 Table 1.
- https://cdn.elifesciences.org/articles/66721/elife-66721-supp2-v2.xlsx
-
Source data 2
Supplementary File 1 Table 2.
- https://cdn.elifesciences.org/articles/66721/elife-66721-supp3-v2.xlsx
Download links
A two-part list of links to download the article, or parts of the article, in various formats.
Downloads (link to download the article as PDF)
Open citations (links to open the citations from this article in various online reference manager services)
Cite this article (links to download the citations from this article in formats compatible with various reference manager tools)
Localization of KRAS downstream target ARL4C to invasive pseudopods accelerates pancreatic cancer cell invasion
eLife 10:e66721.
https://doi.org/10.7554/eLife.66721


