The human cerebellum is essential for modulating perceptual sensitivity based on temporal expectations
- Department of Psychology and Helen Wills Neuroscience Institute, University of California, Berkeley, United States
Figures
Figure 1
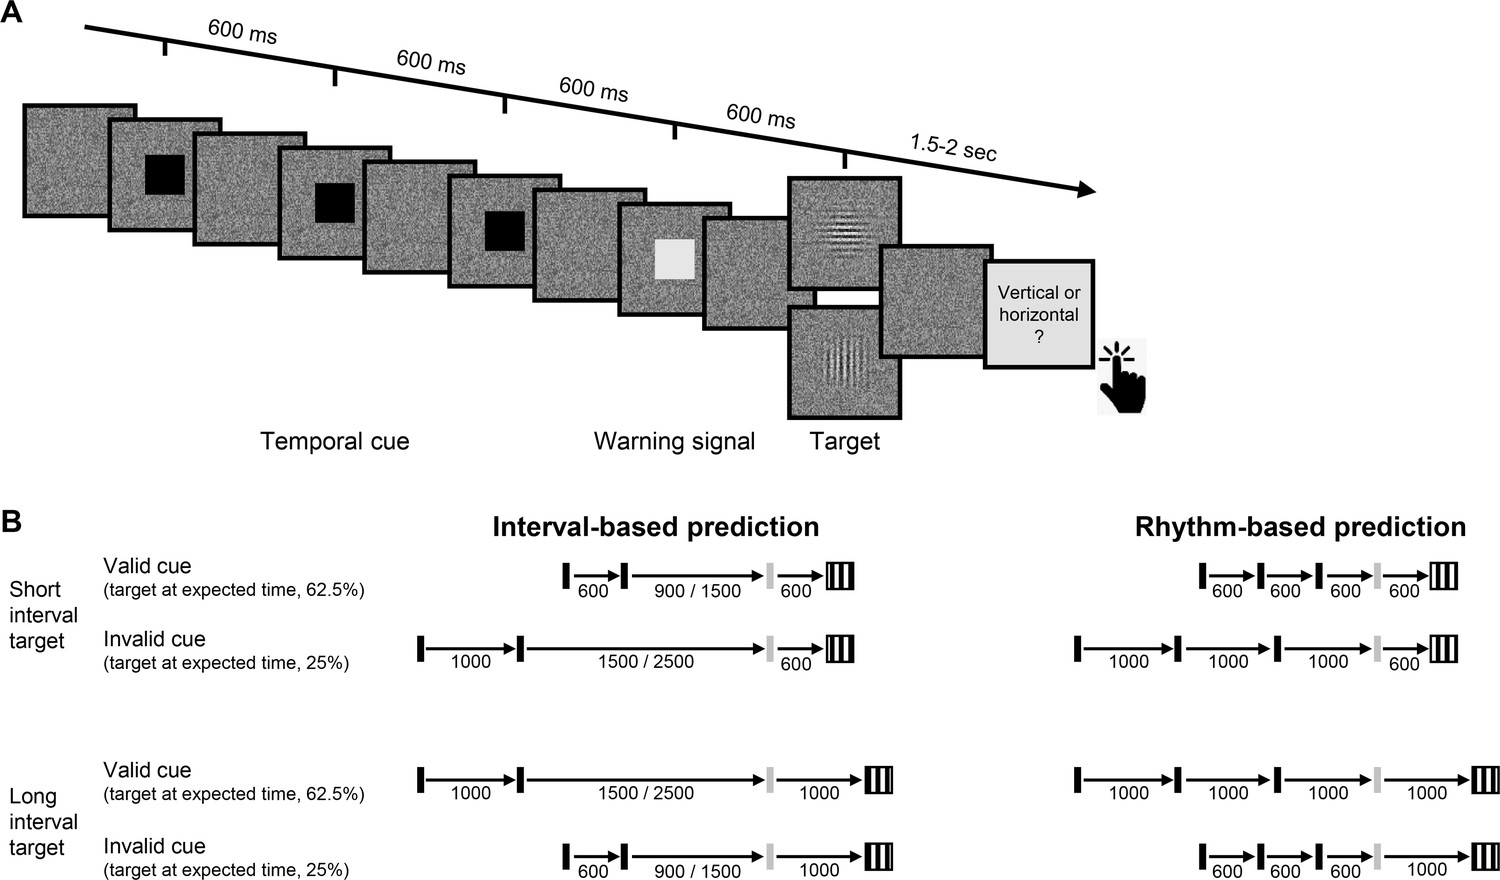
Experimental task.
(A) Trial sequence, depicting a trial with the faster rhythmic temporal cue. Participants viewed a visual stream of black squares (temporal cue), followed by a white square (warning signal [WS]), and then a luminance-defined Gabor grating (target). Participants made a delayed, non-speeded judgment of the orientation of the grating, with the response elicited only after a variable time interval. Continuous dynamic masking was generated by a white noise visual stimulus mask that changed at 60 Hz. Whereas the black and white squares were highly visible when superimposed on the mask, the target was embedded in the noise, reducing its visibility. The target contrast was set on an individual basis using an adaptive procedure. (B) Temporal cue conditions. The target could appear at a short (600 ms, top) or long (1000 ms, bottom) interval after the WS. Left: Interval task. Two black squares were separated by either the short or long interval, with a random non-isochronous interval between the second black square and the WS. On valid trials (62.5%), this interval matched the WS-to-target interval; on invalid trials (25%), it matched the other interval (in the remaining 12.5% ‘catch’ trials there was no target and no response was required). Right: Rhythm task. Three black squares and the WS appeared with identical stimulus onset asynchrony (SOA) (short/long). Valid and invalid trials were as in the interval task.
Figure 2 with 1 supplement
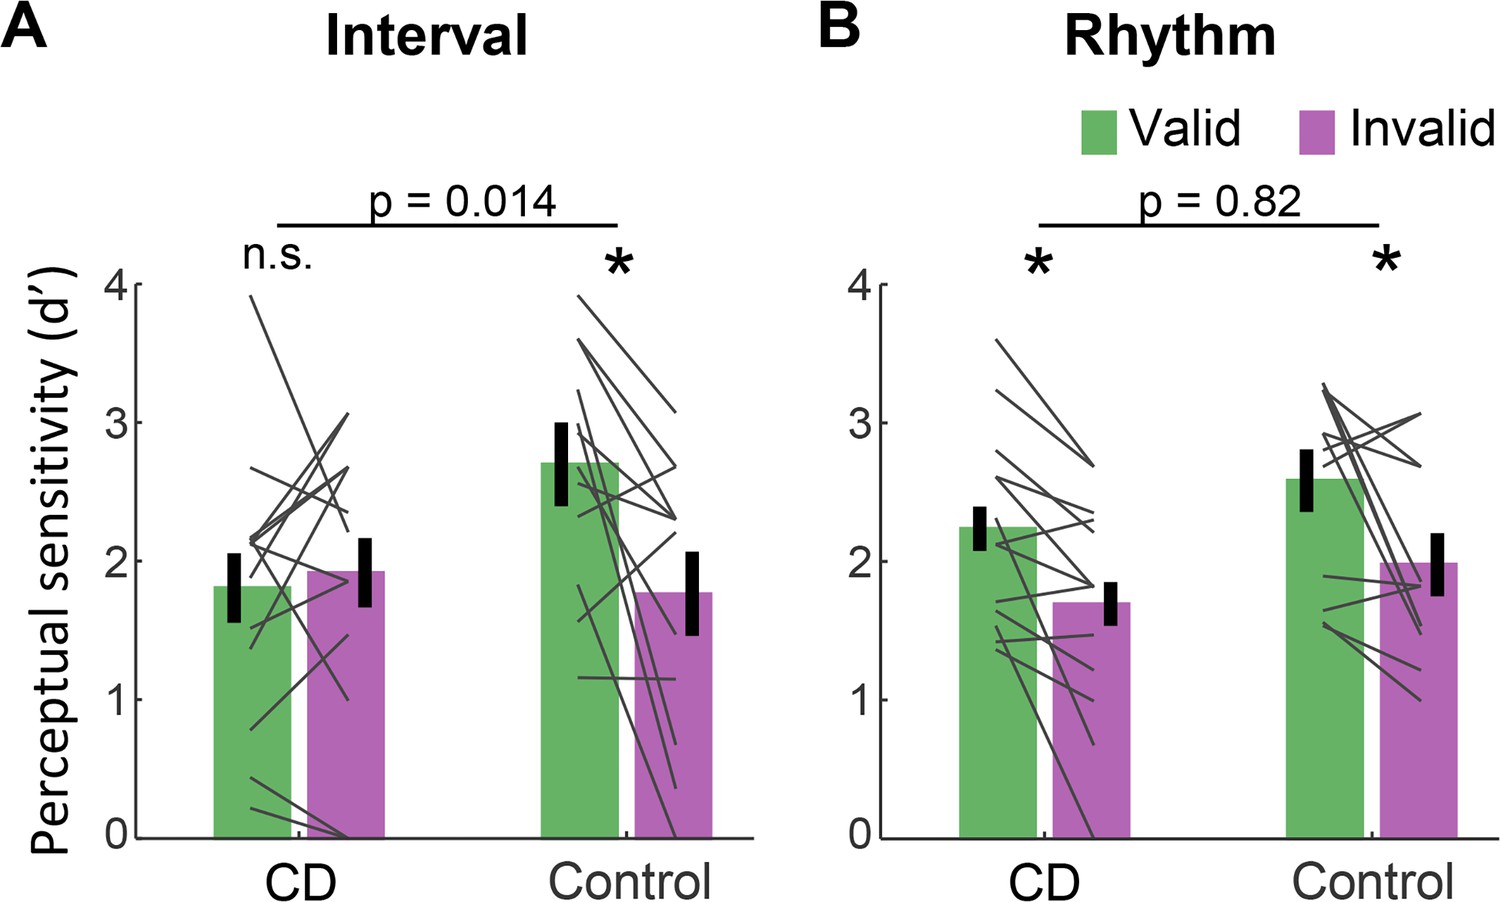
Absence of validity effect in individuals with cerebellar degeneration following interval-based, but not rhythm-based temporal cues.
(A) Interval task. Mean d’ for temporally expected (valid) and unexpected (invalid) short interval targets (600 ms after the WS) for the CD and control groups. Unlike the controls, the CD group showed no increase in d’ when the target appeared at the expected time. (B) Rhythm task. Both groups show a similar increase in d’ on valid trials. *p<0.05. In both A and B, error bars represent one standard error of the mean (SEM). Gray lines depict individual subject data.
Figure 2—figure supplement 1
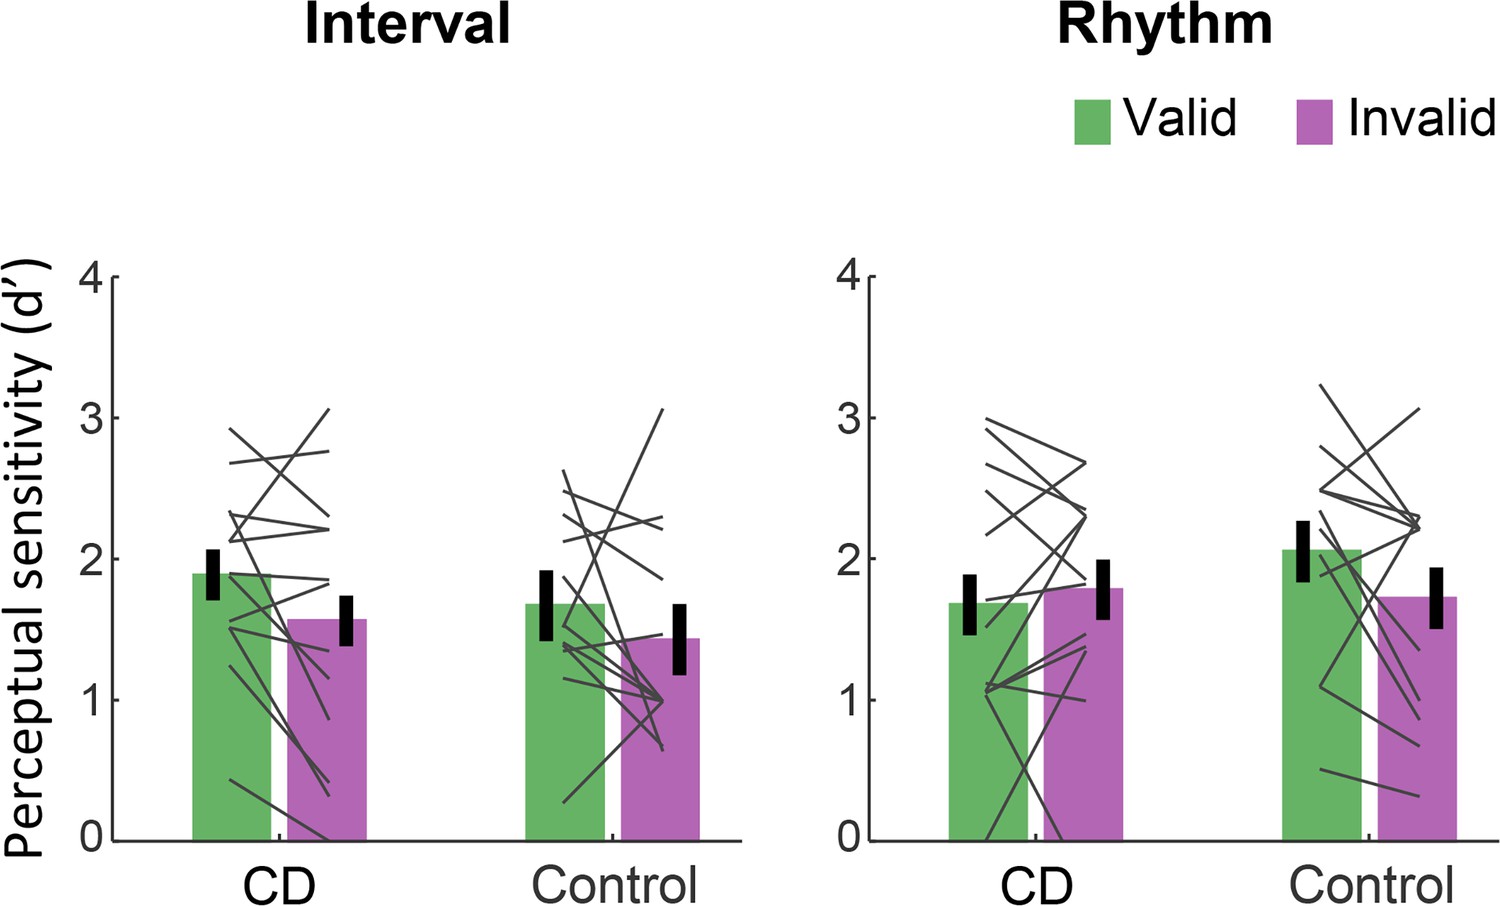
Mean d’ for temporally expected (valid) and unexpected (invalid) long interval targets (1000 ms after the warning signal [WS]).
In both groups and tasks, the validity effect was not significant.
Tables
Key resources table
| Reagent type (species) or resource | Designation | Source or reference | Identifiers | Additional information |
|---|---|---|---|---|
| Software, algorithm | MATLAB 2019a | Mathworks | RRID:SCR_001622 | |
| Software, algorithm | R 3.6.3 | R project for statistical computing | RRID:SCR_001905 |
Additional files
-
Source data 1
Raw data.
- https://cdn.elifesciences.org/articles/66743/elife-66743-data1-v2.xlsx
-
Source code 1
Preprocessing code (MATLAB).
- https://cdn.elifesciences.org/articles/66743/elife-66743-code1-v2.zip
-
Source code 2
Statistical analysis code (R).
- https://cdn.elifesciences.org/articles/66743/elife-66743-code2-v2.zip
-
Transparent reporting form
- https://cdn.elifesciences.org/articles/66743/elife-66743-transrepform-v2.docx
Download links
A two-part list of links to download the article, or parts of the article, in various formats.
Downloads (link to download the article as PDF)
Open citations (links to open the citations from this article in various online reference manager services)
Cite this article (links to download the citations from this article in formats compatible with various reference manager tools)
The human cerebellum is essential for modulating perceptual sensitivity based on temporal expectations
eLife 10:e66743.
https://doi.org/10.7554/eLife.66743


