miR-1 coordinately regulates lysosomal v-ATPase and biogenesis to impact proteotoxicity and muscle function during aging
- Max Planck Institute for Biology of Ageing, Germany
- Department of Chemical Engineering, Texas Tech University, United States
- Cologne Excellence Cluster on Cellular Stress Responses in Aging-Associated Diseases (CECAD), University of Cologne, Germany
- Laboratory of Aging Biology, Department of Biochemistry and Tissue Biology, University of Campinas (UNICAMP), Brazil
- Experimental Medicine Research Cluster (EMRC), University of Campinas (UNICAMP), Brazil
- Obesity and Comorbidities Research Center (OCRC), University of Campinas (UNICAMP), Brazil
- State Key Laboratory of Cell Biology, Innovation Center for Cell Signaling Network, CAS Center for Excellence in Molecular Cell Science, Shanghai Institute of Biochemistry and Cell Biology, Chinese Academy of Sciences, University of Chinese Academy of Sciences, China
Figures
Figure 1 with 1 supplement
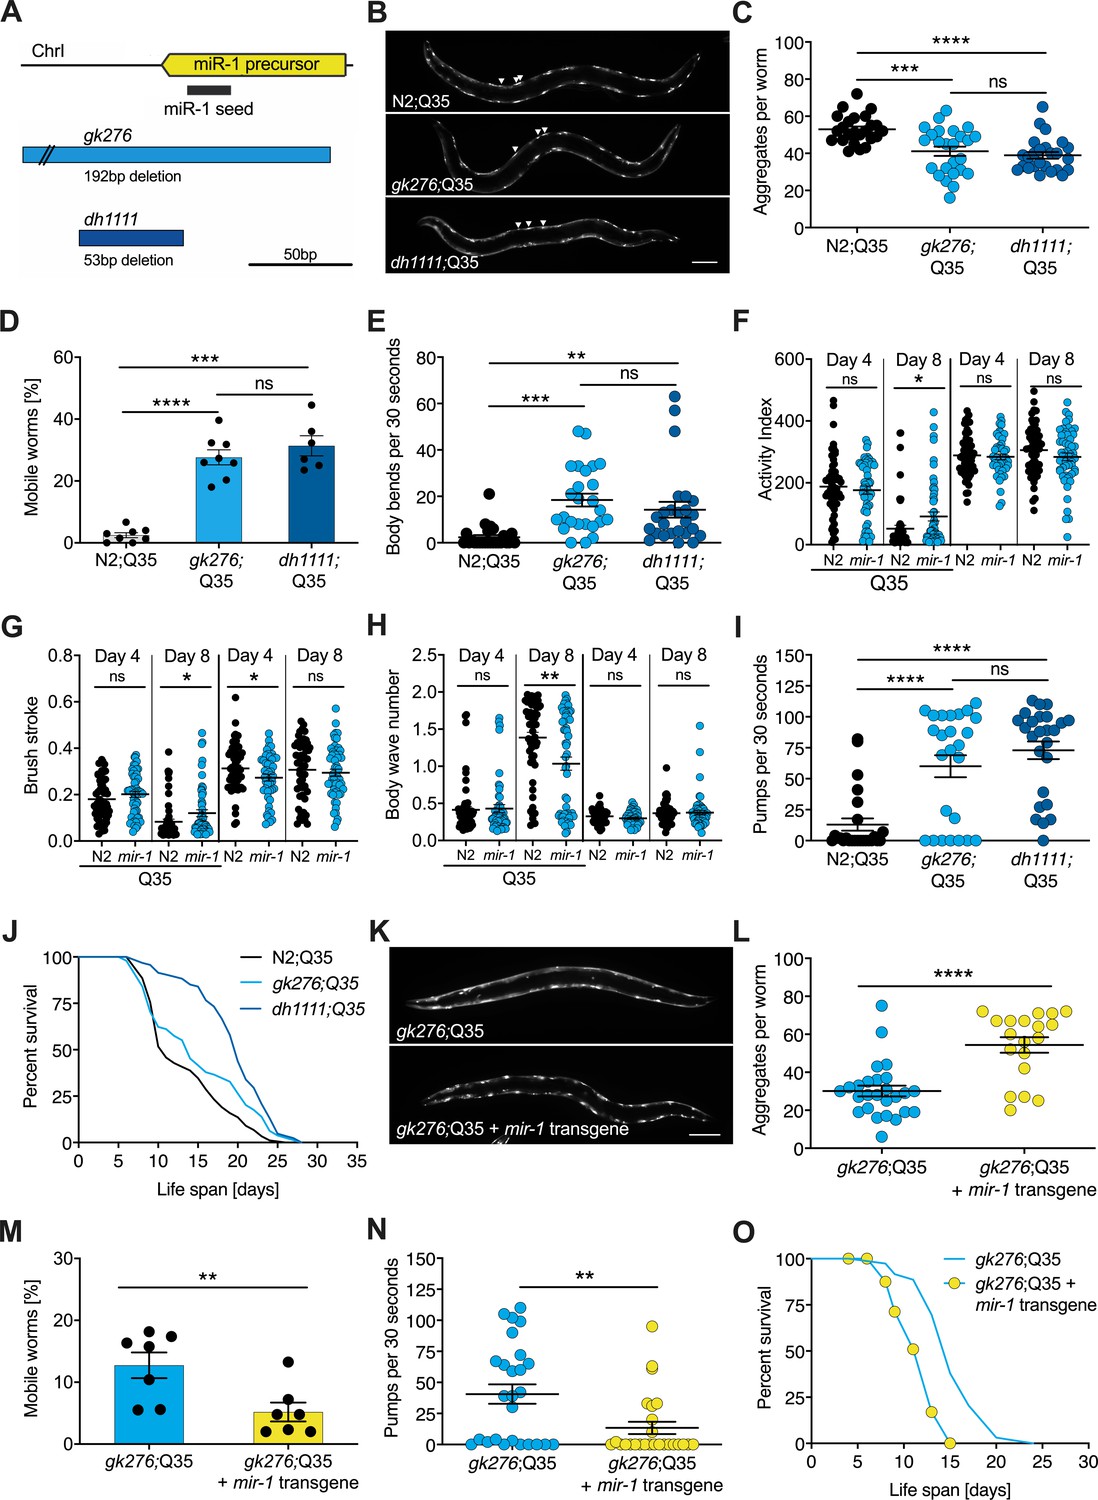
mir-1 mutants exhibit improved motility upon polyQ35 challenge.
(A) Schematic showing the mir-1 locus, deletion alleles mir-1(gk276) and mir-1(dh1111) (see Materials and methods). (B) Representative images of N2 wild-type (WT) and mir-1 mutant animals expressing unc-54p::Q35::YFP (Q35) showing loss of aggregates in the mir-1 background on day 4 of adulthood. Arrowheads point to aggregates. Scale bar 100 μm. (C) Quantification of Q35::YFP aggregates in (B). Each dot represents one animal, mean ± SEM from one representative experiment, N = 3, one-way ANOVA, Tukey’s multiple comparisons test, *** p<0.001, ****p<0.0001, ns, not significant. (D) Motility of indicated mir-1 alleles and N2 (WT) animals expressing unc-54p::Q35::YFP, measured by the circle test, day 8 of adulthood. Percent worms that left the circle after 30 min. Each dot represents one experiment. Mean ± SEM of N = 6–8. One-way ANOVA, ***p<0.001, ****p<0.0001, ns, not significant. (E) Motility of mir-1 alleles and N2 animals expressing unc-54p::Q35::YFP, measured by the thrashing assay. 25 worms per condition, each dot represents one animal, mean ± SEM from one representative experiment, N = 4, one-way ANOVA, **p<0.01 ***p<0.001, ns, not significant. CeleST analysis of activity index (F), brush stroke (G), and body wave number (H) comparing N2 and mir-1(gk276) mutant animals with or without unc-54p::Q35::YFP at days 4 and 8 of adulthood. Each dot represents one animal. t-test, *p<0.05 **p<0.01, ns, not significant. (I) Pharyngeal pumping rate measured on day 8 of adulthood in mir-1 alleles and WT animals expressing unc-54p::Q35::YFP. Each dot represents one animal, mean ± SEM from one representative experiment, N = 3, one-way ANOVA, ****p<0.0001, ns, not significant. (J) Life span experiments of mir-1 mutants and N2 animals expressing unc-54P::Q35::YFP. One experiment of N = 3. Log-rank test: N2;Q35 vs. gk276;Q35: p=0.03. N2;Q35 vs. dh1111;Q35: p<0.0001. (K) Presence of an extrachromosomal mir-1 transgene brings back aggregates in mir-1(gk276) mutants at day 4 of adulthood, showing rescue by the transgene. Transgenic worms were compared to non-transgenic segregants of the same strain. Scale bar 100 μm. (L) Quantification of Q35::YFP aggregates (from K), each dot represents total aggregate number of one animal, mean ± SEM from one representative experiment, N = 3, t-test, ****p<0.0001. (M) Motility of mir-1(gk276);Q35 animals in the presence or absence of the mir-1 transgene at day 8 of adulthood, measured by circle test. Transgenic worms were compared to non-transgenic segregants of the same strain. Each dot represents one experiment, mean ± SEM of N = 7. t-test, **p<0.01. (N) Pharyngeal pumping rate of mir-1(gk276); Q35 animals in the presence or absence of the mir-1 transgene. Transgenic worms were compared to non-transgenic segregants of the same strain. Each dot represents one animal, mean ± SEM from one representative experiment, N = 7, t-test, **p<0.01. (O) Life span experiments of mir-1(gk276);Q35 animals in the presence or absence of the mir-1 transgene. Transgenic worms were compared to non-transgenic segregants of the same strain. One representative experiment of N = 5, log-rank test, p<0.0001.
Figure 1—figure supplement 1
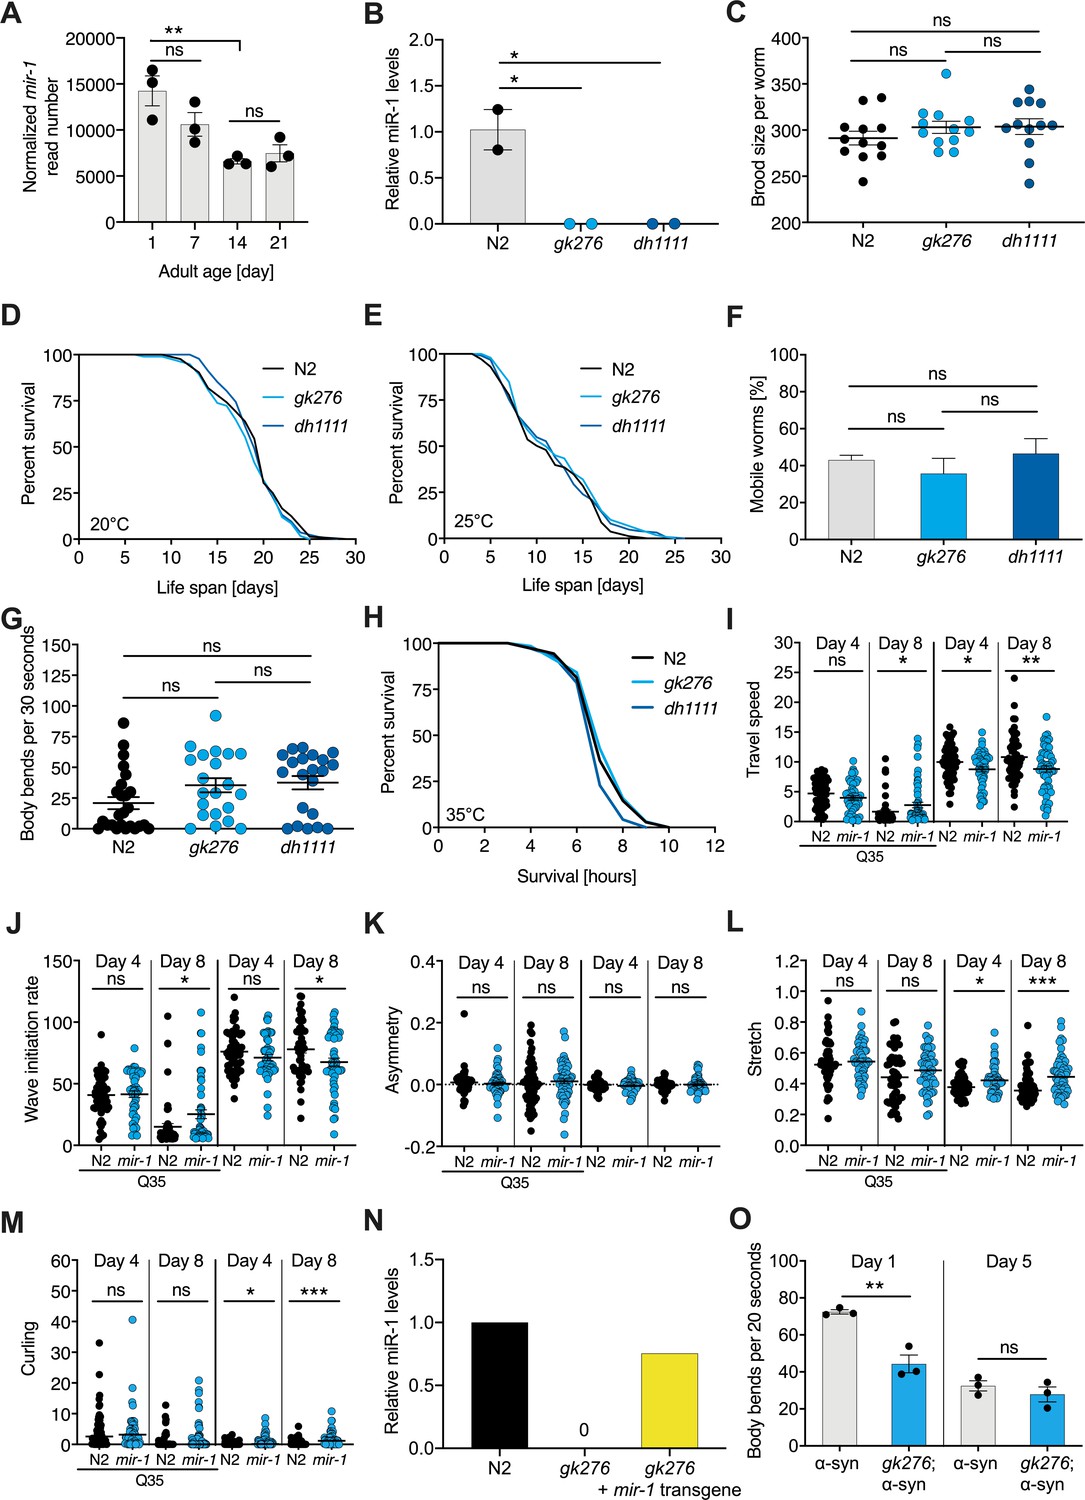
Characterization of mir-1 mutant physiology under normal conditions and proteotoxic models.
(A) MicroRNA-seq analysis of miR-1 in wild-type (WT) worms of indicated ages (Zhou et al., 2019). Normalized miR-1 reads of three independent experiments for samples of days 1, 7, 14, and 21 of adulthood, respectively. Mean ± SEM. (B) TaqMan qPCR measuring mature miR-1 levels show that the deletion alleles do not express mir-1 and are null, N = 2 BR. Mean ± SEM, one-way ANOVA, *p<0.05. (C) Brood size of mir-1(gk276) and mir-1(dh1111) compared to N2 WT worms. Each dot represents the brood size of one worm, mean ± SEM, one-way ANOVA, ns, not significant. (D, E) Life span experiments performed at 20°C and 25°C for two mir-1 deletion alleles compared to WT (N2). N = 3, log-rank test, ns, not significant (Supplementary file 1a). (F, G) Motility of WT and mir-1(gk276) mutant animals on day 14 of adulthood, measured by circle test (F) and thrashing in liquid (G). One representative experiment of each N = 3 is shown. Mean ± SEM, one-way ANOVA, ns, not significant. (H) Heat stress survival at 35°C of day 1 mir-1(gk276) and mir-1(dh1111) mutants compared to WT. One representative experiment is shown, N = 3, log-rank test: N2 vs. gk276: p = 0.20. N2 vs. dh1111: p=0.17. (I–M) CeleST locomotion behavior analyses of WT and mir-1(gk276) mutant animals with or without unc-54p::Q35::YFP at days 4 and 8 of adulthood. Each dot represents one animal. (I) Travel speed, (J) wave initiation rate, (K) asymmetry, (L) stretch, and (M) curling. t-test, *p<0.05, **p<0.01, ***p<0.001, ns, not significant. (N) Bar graph showing the expression level of mature miR-1 microRNA in the indicated genotypes. N = 1 biological replicate, four technical replicates. (O) Thrashing motility of α-syn and mir-1(gk276); α-syn worms at days 1 and 5 of adulthood. N = 3 biological replicates, t-test, **p<0.01, ns, not significant.
Figure 2 with 1 supplement
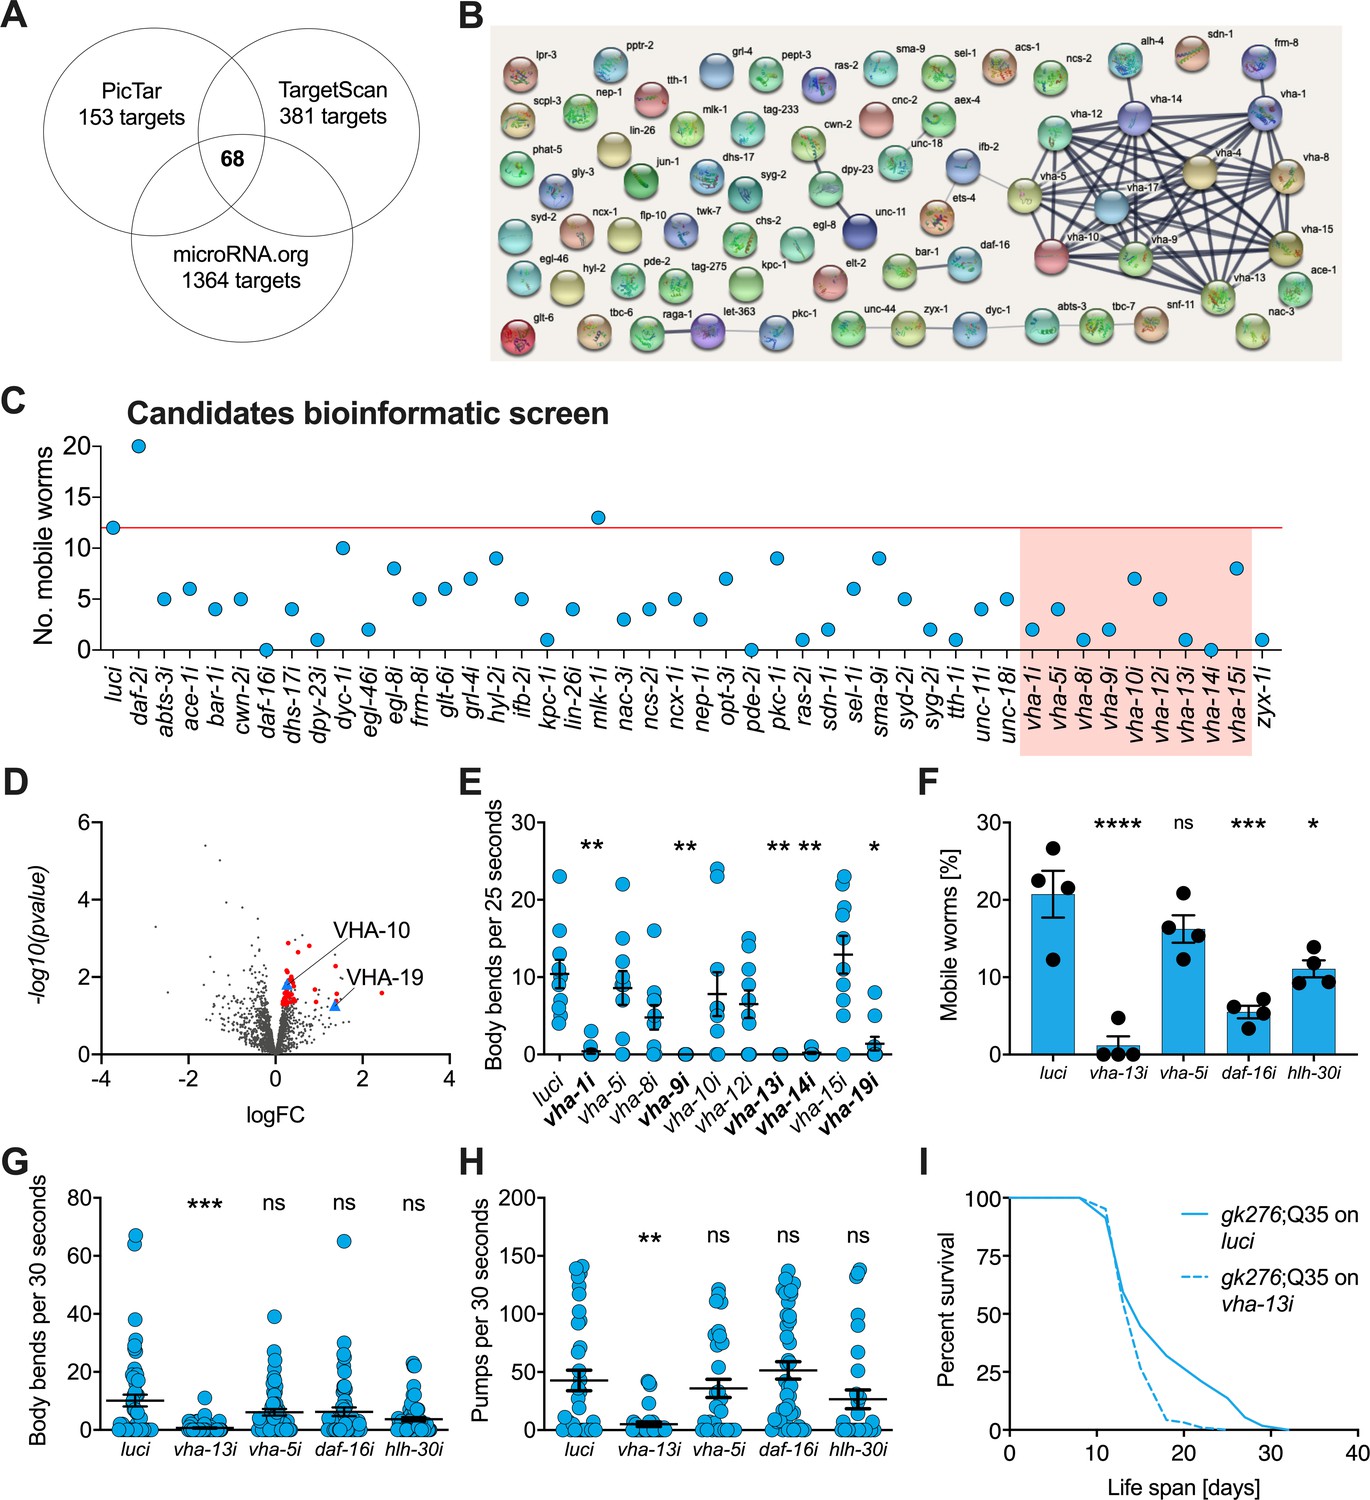
v-ATPase subunits are downstream mediators of mir-1-induced motility improvement.
(A) Computational screen for potential miR-1 targets using in silico predictions microRNA.org, TargetScanWorm (TargetScan), and PicTar identifies 68 shared candidates. (B) STRING network analysis of predicted miR-1 targets reveals a cluster of v-ATPase subunits. (C) Initial RNAi screen of computationally predicted candidates using the circle test on day 8 of adulthood reveals a number of candidates that reduced motility of mir-1(gk276);Q35. 20 worms per RNAi (N = 1). Red line: number of luciferase controls that left the circle. v-ATPases are highlighted in red. (D) Volcano plot of proteomic analysis showing differentially regulated proteins in mir-1(gk276) vs. N2 animals. VHA-10 and VHA-19 are indicated by blue triangles. Red dots and blue triangles show upregulated proteins tested in circle assay. N = 6 (mir-1) and 4 (N2) biological replicates. (E) Effect of v-ATPase subunit RNAi knockdown on mir-1(gk276);Q35 motility as measured in the thrashing assay. Animals are grown on the corresponding RNAi from L4 onwards. N = 1. Mean ± SEM, one-way ANOVA, only significant values are labeled: *p<0.05, **p<0.01. (F, G) Motility assay (circle test) and thrashing assay on day 8 of mir-1(gk276);Q35 worms upon vha-13, vha-5, daf-16, and hlh-30 RNAi knockdown. Control, luciferase RNAi (luci). Mean ± SEM of N = 4, one-way ANOVA, *p<0.05, ***p<0.001, ****p<0.0001, ns, not significant. (H) Pumping assay of mir-1(gk276);Q35 worms upon vha-13, vha-5, daf-16, and hlh-30 RNAi knockdown on day 8 of adulthood. Control, luciferase RNAi (luci). N = 3, mean ± SEM, one-way ANOVA, **p<0.01, ns, not significant. (I) Life span of mir-1(gk276);Q35 and Q35 worms upon vha-13 RNAi knockdown. Control, luciferase RNAi (luci). One experiment of N = 3, log-rank test: p<0.01.
Figure 2—figure supplement 1
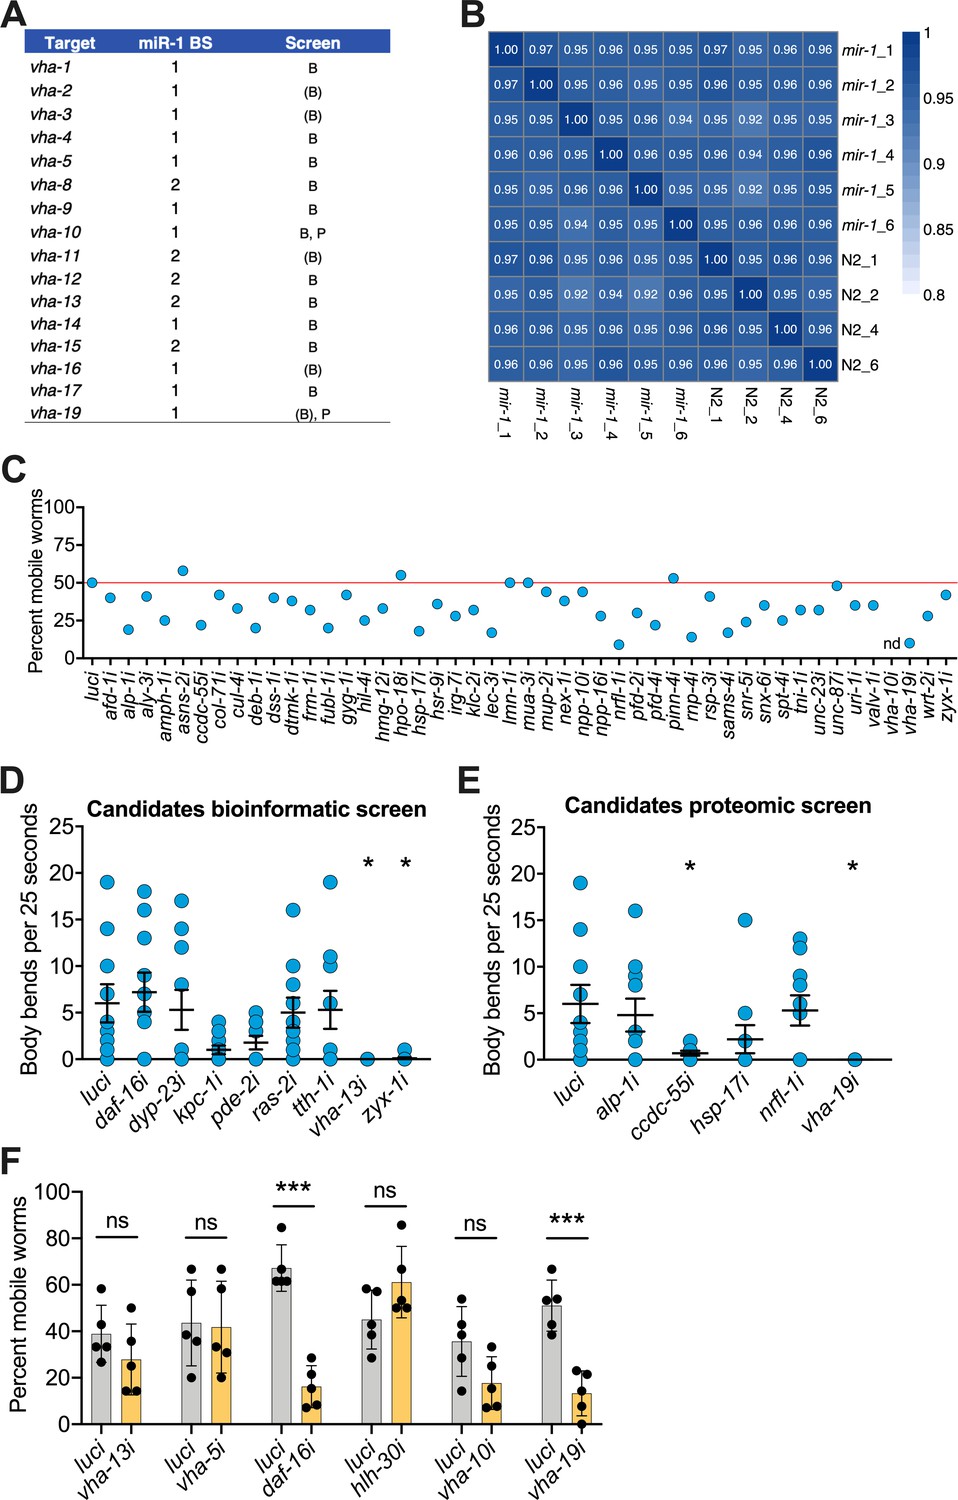
Bioinformatic and proteomic screens implicate v-ATPase subunits as downstream mediators of mir-1-induced motility improvement.
(A) v-ATPase subunits containing one or two predicted miR-1 binding sides (BS) in their 3′UTR. v-ATPase genes identified in the bioinformatic screen by all three databases are labeled 'B,' by two databases are labeled (B), and by the proteomic screen are labeled 'P.' (B) Correlation plot of the biological replicates from proteomics showing the similarity of wild-type WT (N2) and mir-1(gk276) genotypes. (C) RNAi screen for genes required for mir-1(gk276);Q35 motility in the circle test, using upregulated genes from the proteomic analysis (Supplementary file 1e, f). Each dot represents the percentage of worms that left the circle. Red line: percent luciferase controls that left the circle; Nd: not determined. Validation of selected candidates identified from bioinformatic (D) and (E) proteomic screens by thrashing assay on day 8 of adulthood. mir-1(gk276);Q35 worms were grown on the corresponding RNAi from L4 onwards. Each dot represents one animal, 15 worms per RNAi. Mean ± SEM, one-way ANOVA, only significant values are labeled: *p<0.05. (F) Motility of worms in circle test of indicated RNAi on N2;Q35 worms. Motility was measured on day 5 of adulthood, each dot represents the percentage of worms that left the circle. Mean ± SEM of one representative experiment, N = 3, one-way ANOVA, ***p<0.001, ns, not significant.
Figure 3 with 1 supplement

miR-1 directly regulates vha-13 via its 3′UTR in muscle tissue.
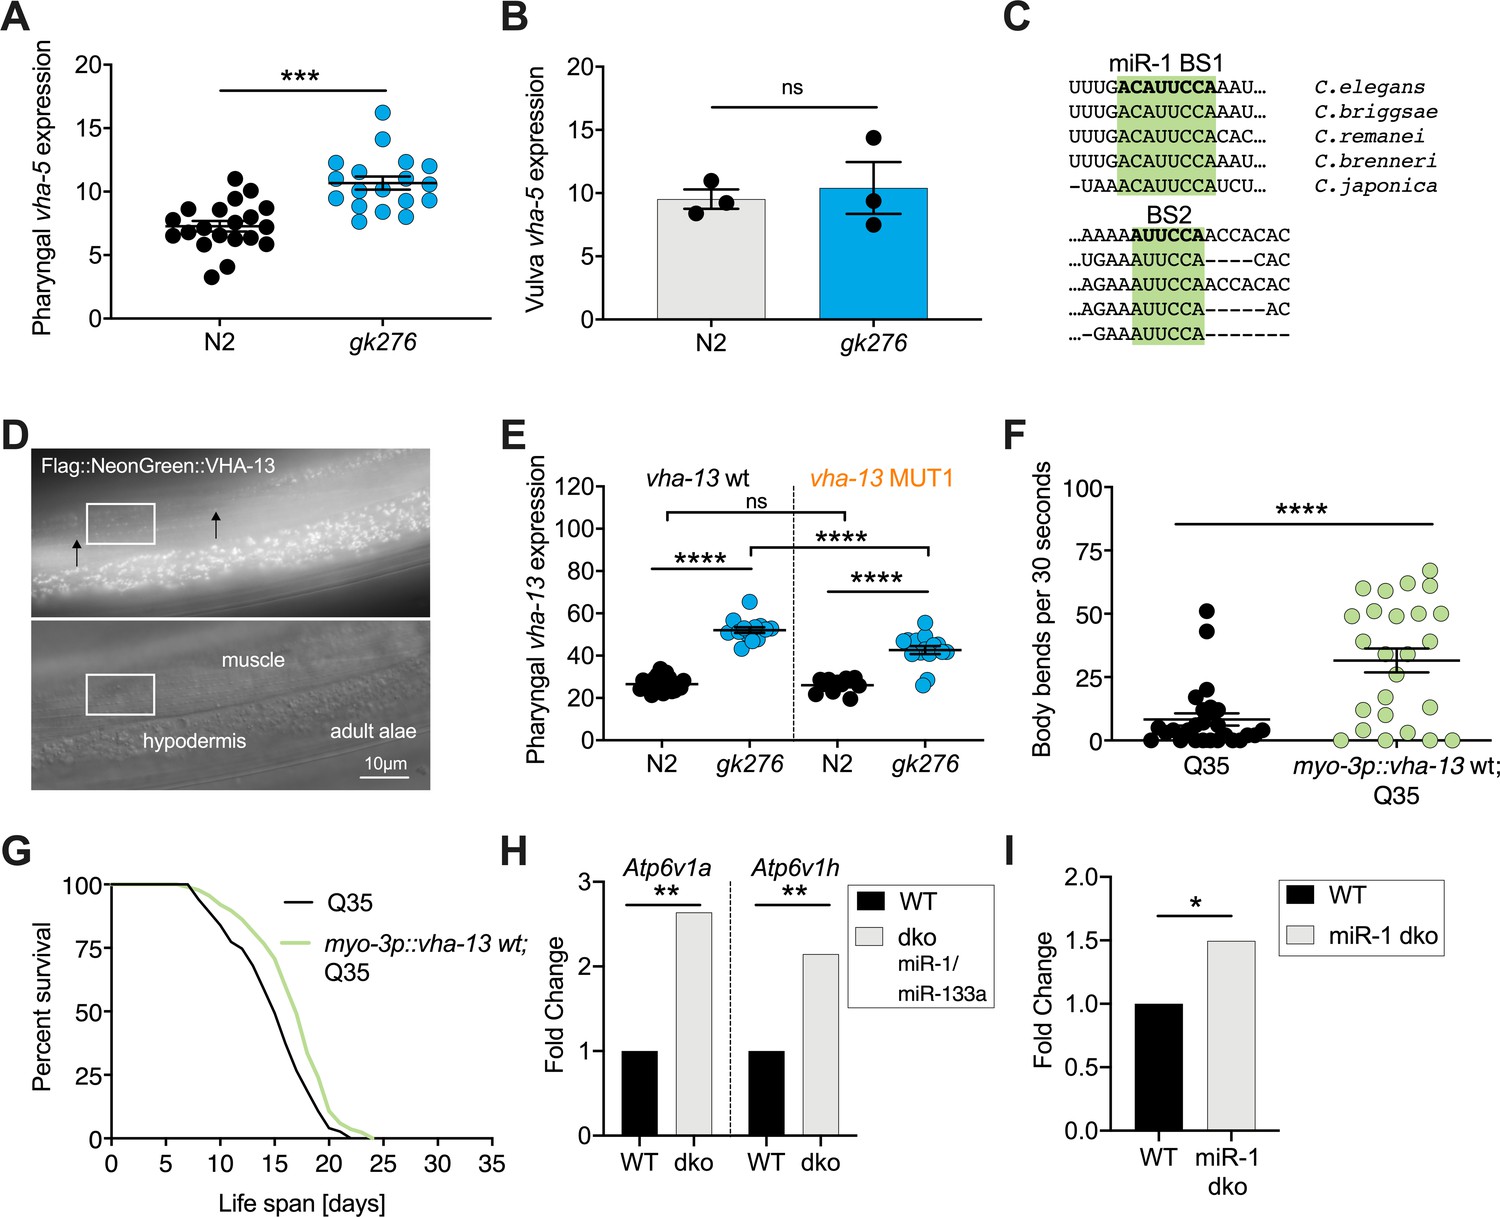
(A) RT-qPCR of vha-5, vha-10, vha-13, and vha-19, as well as daf-16 and hlh-30 mRNA levels in wild-type (WT) (N2) and mir-1(gk276) mutants on day 4 of adulthood. Mean ± SEM, N = 3–4, one-way ANOVA, **p<0.01, ***p<0.001. (B) Expression pattern of endogenously tagged 3xFlag::mNeonGreen::vha-13 in pharynx, excretory cell and canal, gut, vulva muscle (vum), hypodermis, and muscle (arrowheads indicate dense bodies). (C) Confocal images of the head region in worms carrying endogenously tagged 3xFlag::mNeonGreen::vha-13 in late L4 mir-1(gk276) and WT (N2) animals at 25°C. Red rectangle highlights the area of vha-13 expression in the isthmus used for determination of mNeonGreen intensity. Scale bar 20 μm. (D) Quantification of fluorescent intensity of 3xFlag::mNeonGreen::VHA-13 in the isthmus of indicated genotypes (as shown in C) in late L4 larvae at 25°C. Mean ± SEM of N = 5, t-test, **p<0.01. (E) Quantification of fluorescent intensity of 3xFlag::mNeonGreen::VHA-13 in the isthmus of N2 in the presence or absence of the mir-1 transgene in late L4 larvae at 25°C. Transgenic worms (mir-1 transgene) were compared to non-transgenic segregants (N2) of the same strain. Mean ± SEM of N = 4, t-test, ***p<0.001. (F) Graphic showing the 3′UTR of endogenously tagged 3xFlag::mNeonGreen::vha-13. vha-13 wt: vha-13 WT 3′UTR. vha-13 MUT1: one miR-1 binding site (BS) is mutated. vha-13 MUT2: both miR-1 BSs are mutated. unc-54 3’UTR: the vha-13 3′UTR is substituted by unc-54 3′UTR. Nucleotide sequences of mutated miR-1 BSs are shown below WT. (G) Quantification of fluorescence intensity in the isthmus of L4 larvae with endogenously tagged 3xFlag::mNeonGreen::vha-13 of vha-13 MUT2 3′UTR in relation to vha-13 wt 3′UTR, in N2 and mir-1(gk276) mutant backgrounds at 25°C, using confocal imaging. Mean ± SEM of N = 3, one representative experiment, one-way ANOVA, ****p<0.0001, ns, not significant. (H) Western blot image of late L4 WT and mir-1 mutants expressing transgenic Flag-tagged vha-13 in body wall muscle (myo-3p::vha-13) with either the unc-54 3′UTR (labeled in red), which lacks miR-1 BSs, or the wt vha-13 3′UTR, which contains the two miR-1 BSs (labeled in black), immunoblotted with anti-Flag and anti-Histone H3 antibodies. Histone H3 loading control is shown below. Biological replicates (N = 3) separated by dashed lines. (I) Quantification of western blot shown in (H), with flag-tag intensity normalized to histone H3 loading control, mean ± SEM of N = 3, one-way ANOVA, ***p<0.001, ns, not significant. (J) Quantification of aggregates in Q35 worms expressing transgenic vha-13 in the body wall muscle (myo-3p::vha-13 wt;Q35) or non-transgenic segregants (Q35) of the same strain. 25 worms per genotype, mean ± SEM of one representative experiment, N = 4, t-test, ***p<0.001. (K) Motility of Q35 worms expressing transgenic vha-13 in the body wall muscle (myo-3p::vha-13 wt;Q35) or non-transgenic segregants (Q35) of the same strain in circle test. Mean ± SEM. One experiment of N = 2, t-test, ***p<0.001. (L) Pharyngeal pumping rate of myo-3p::vha-13 wt;Q35 and Q35 non-transgenic segregants of the same strain. One representative experiment of N = 4, mean ± SEM, t-test, ***p<0.001.
Figure 3—figure supplement 1
miR-1 regulates vha-13 via its 3' UTR and its regulation may be evolutionarily conserved.
(A) Quantification of pharyngeal fluorescent intensity of endogenous 3xFlag::mNeonGreen::VHA-5 in indicated genotypes in late L4s maintained at 25°C. One representative experiment of N = 3, mean ± SEM, t-test, ***p<0.001. (B) Quantification of fluorescent intensity of 3xFlag::mNeonGreen::vha-5 expression in the vulva of indicated genotypes. Mean ± SEM of N = 3, t-test, ns, not significant. (C) Schematic showing the conservation of miR-1 binding sites (BS) in the vha-13 3′UTR of different nematode species. (D) Images showing expression of endogenously tagged 3xFlag::mNeonGreen::VHA-13 in muscle dense body and hypodermis. Arrows indicate individual dense bodies. Rectangle highlights muscle section shown in Figure 3B. (E) Quantification of fluorescence intensity in the isthmus of L4 larvae with endogenously tagged 3xFlag::mNeonGreen::vha-13 with vha-13 MUT1 3′UTR in relation to vha-13 wt 3′UTR, in N2 and mir-1(gk276) backgrounds using confocal microscopy. Mean ± SEM of one representative experiment. N = 2, one-way ANOVA, ****p<0.00001, ns, not significant. (F) Thrashing assay of unc-54p::Q35::YFP (Q35) worms expressing vha-13 in body wall muscle (myo3p::vha-13 wt;Q35) or non-transgenic Q35 animals. 25 worms per genotype, mean ± SEM of one representative experiment, N = 4, t-test, ****p<0.0001. (G) Life span of Q35 worms overexpressing vha-13 in the body wall muscle (myo3p::vha-13 wt;Q35) and Q35 non-transgenic segregants of the same strain. One experiment of N = 4. Life span effects of two experiments were significant (Supplementary file 1a). Log-rank test, p=0.0017. (H) Atp6v1a and Atp6v1h mRNA expression in mouse skeletal muscle from WT and muscle-specific miR-1/miR-133a double knockout (dko) mice (dataset from Wüst et al., 2018, N = 3 mice per genotype, **q [adjusted p-value] < 0.01). (I) Atp6v1a mRNA expression in hearts from WT and miR-1-1/miR1-2 double knockout (dko) mice (dataset from Wei et al., 2014, *q [adjusted p-value] < 0.05).
Figure 4 with 1 supplement
mir-1 mutation enhances lysosomal biogenesis and acidification.
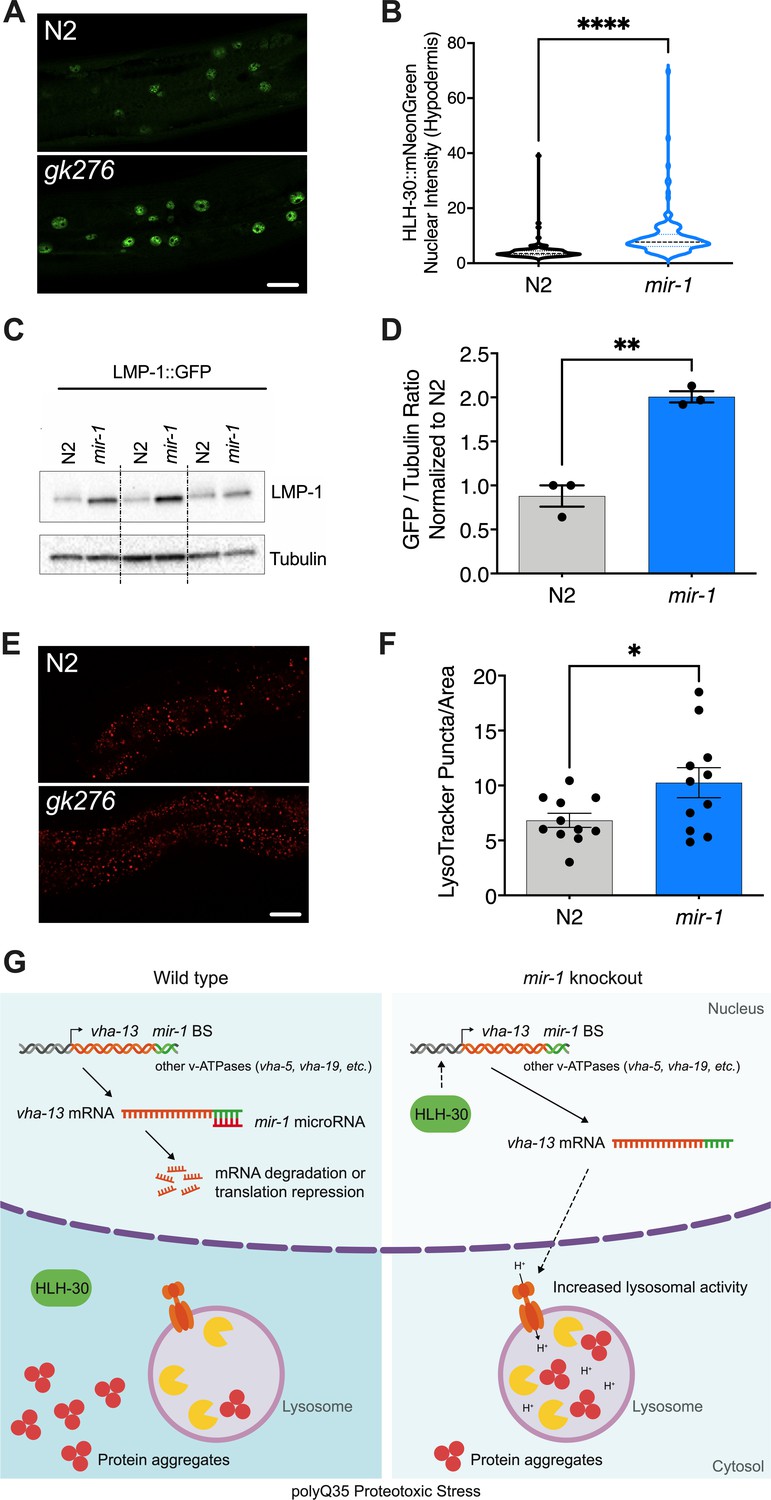
(A) Fluorescent image comparing HLH-30::mNeonGreen nuclear localization in the hypodermis of the mir-1(gk276) and wild-type (WT) (N2) backgrounds at day 4 of adulthood, maintained at 25°C. Scale bar 20 μm. (B) Quantitation of nuclear localization in (A). Violin plot, mean ± SEM of one representative experiment of N = 3, t-test, **** p<0.0001. (C) Western blot of LMP-1::GFP in WT and mir-1 mutants at the L4 stage, immunoblotted with anti-GFP or anti-α-tubulin antibodies. Biological replicates (N = 3) separated by dashed lines. (D) Quantification of the western blot in (C), normalized to α-tubulin loading control. N = 3 BR, line and error bars indicate mean ± SEM, t-test, **p<0.01. (E) Representative images of lysotracker staining in WT and mir-1(gk276) mutants at day 4 of adulthood at 25°C. Scale bar 20 μm. (F) Quantification of lysotracker images using a predefined squared area approximately spanning the second to fourth gut cell. Quantification was performed using ImageJ. N = 3 BR, line and error bars indicate mean ± SEM of combined experiments, t-test, *p<0.05. (G) Working model. miR-1 normally limits proteoprotective pathways, downregulating the expression of vha-13, other v-ATPases and factors by binding miR-1 binding site(s) in the 3′UTR (miR-1 BS) of the corresponding mRNA (WT, polyQ35 proteotoxic stress). Loss of miR-1 (mir-1 knockout, polyQ35 proteotoxic stress) results in de-repression of vha-13 and elevated lysosomal activity. Nuclear localization of HLH-30/TFEB, a master regulator of lysosome biogenesis, is also enhanced, collectively resulting in reduced number of aggregates under polyQ35 proteotoxic stress conditions.
Figure 4—figure supplement 1
mir-1 mutation does not affect total expression of HLH-30 in the pharynx.
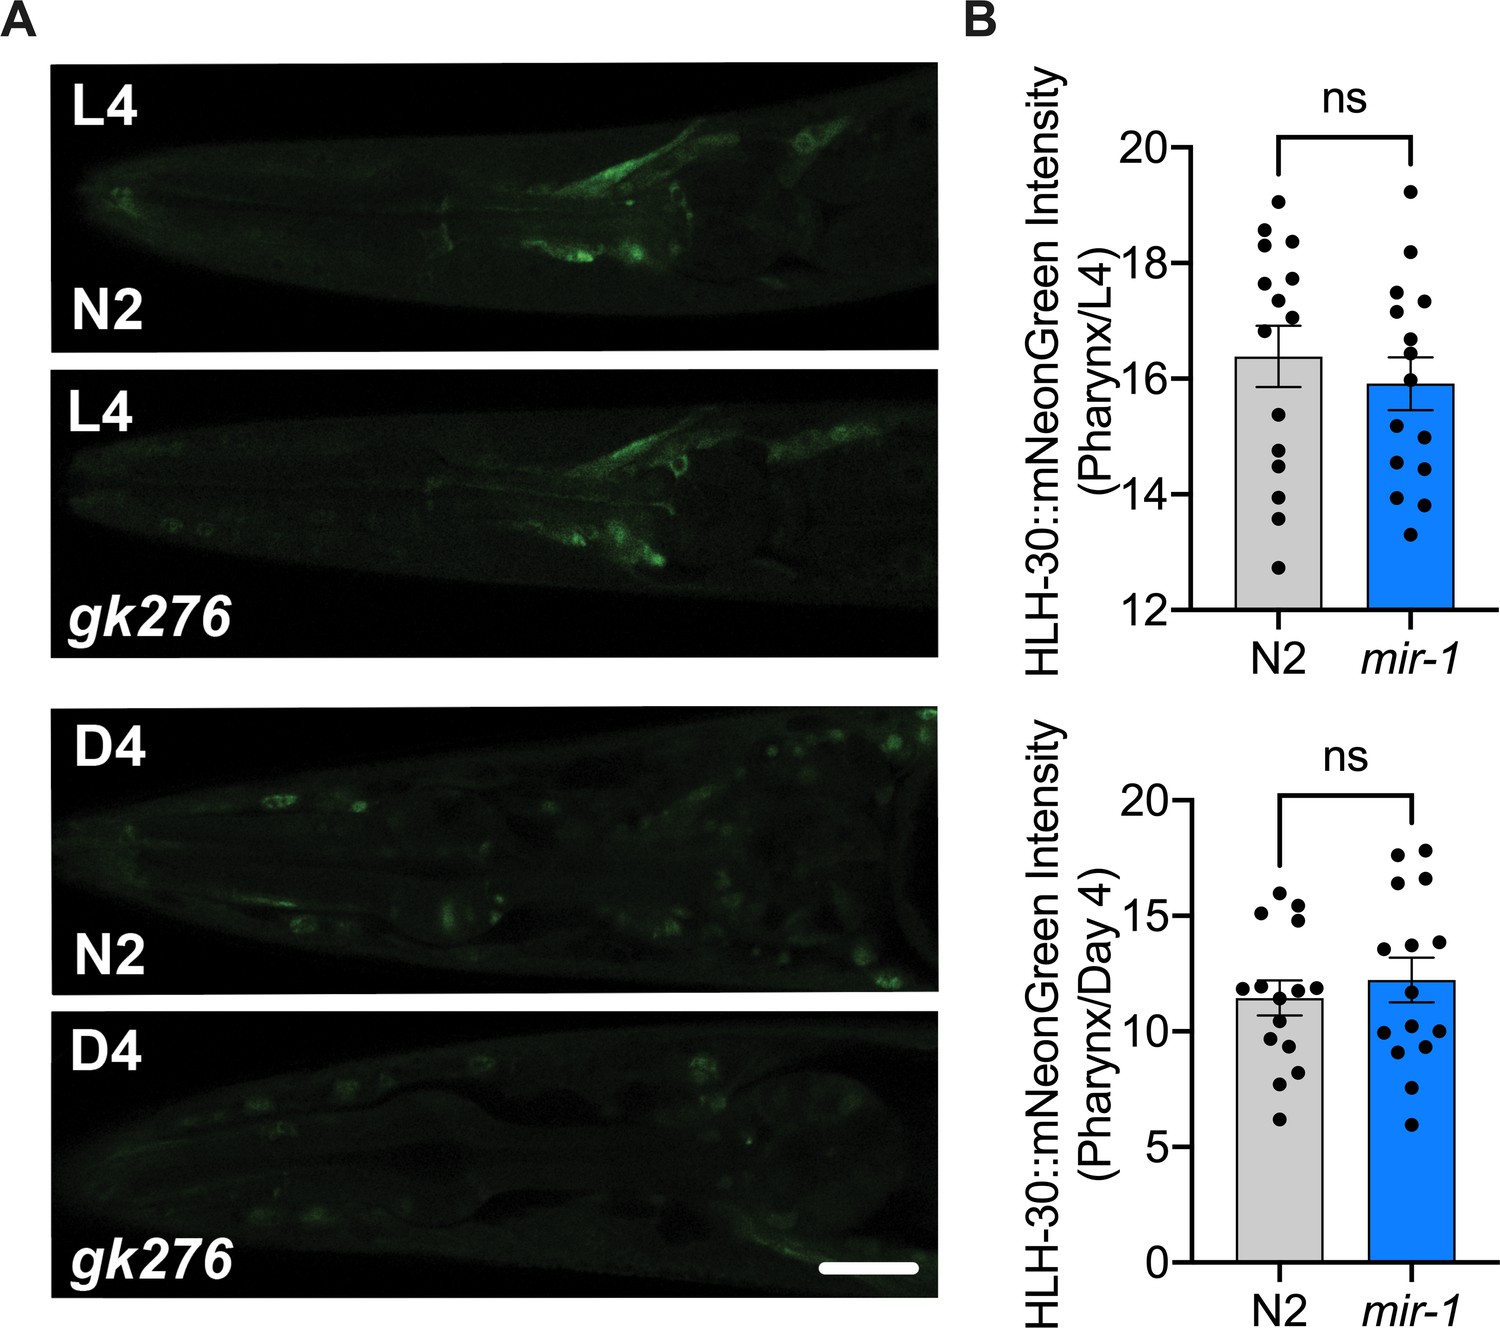
(A) Fluorescent image comparing HLH-30::mNeonGreen intensity in the pharynx of the mir-1(gk276) and wild-type (WT) (N2) backgrounds in L4s (top) or day 4 adults (bottom), grown at 25°C. Scale bar 20 μm. (B) Quantitation of nuclear localization in (A), dots represent individual animals. N = 2 biological replicates for L4 and N = 1 for day 4 adults, t-test, ns, not significant.
Tables
Key resources table
| Reagent type (species) or resource | Designation | Source or reference | Identifiers | Additional information |
|---|---|---|---|---|
| Gene (Caenorhabditis elegans) | mir-1 | WormBase | WBGene00003260 | |
| Gene (Caenorhabditis elegans) | vha-13 | WormBase | WBGene00013025 | |
| Gene (Caenorhabditis elegans) | vha-5 | WormBase | WBGene00006914 | |
| Gene (Caenorhabditis elegans) | hlh-30 | WormBase | WBGene00020930 | |
| Gene (Caenorhabditis elegans) | daf-16 | WormBase | WBGene00000912 | |
| Strain, strain background (Caenorhabditis elegans) | N2 Bristol | CGC | N2 Bristol RRID:WB-STRAIN:WBStrain00000001 | N2 WT |
| Strain, strain background (Caenorhabditis elegans) | mir-1(gk276) I | This paper | AA2508 RRID:WB-STRAIN:WBStrain00035886 | |
| Strain, strain background (Caenorhabditis elegans) | mir-1(dh1111) I | This paper | AA4575 | |
| Strain, strain background (Caenorhabditis elegans) | rmIs132[unc-54p::Q35::YFP] I | CGC | AM140 RRID:WB-STRAIN:WBStrain00000182 | N2;Q35 |
| Strain, strain background (Caenorhabditis elegans) | mir-1(gk276); rmIs132[unc-54p::Q35::YFP] I | This paper | AA4403 | gk276;Q35 |
| Strain, strain background (Caenorhabditis elegans) | mir-1(dh1111) rmIs132[unc-54p::Q35::YFP] I | This paper | AA4577 | dh1111;Q35 |
| Strain, strain background (Caenorhabditis elegans) | N2; dhEx965[mir-1p::mir-1, myo-2p::mCherry] | This paper | AA3275 | mir-1 transgene |
| Strain, strain background (Caenorhabditis elegans) | mir-1(gk276) I; rmIs132[unc-54p::Q35::YFP]; dhEx965[mir-1p::mir-1, myo-2p::mCherry] | This paper | AA4810 | |
| Strain, strain background (Caenorhabditis elegans) | N2; dhEx1206[myo3p::flag::HA::mCherry::vha-13cDNA::unc-54 3′UTR, myo-2p::GFP] | This paper | AA4865 | myo3p::vha-13::unc-54 3′UTR |
| Strain, strain background (Caenorhabditis elegans) | mir-1(gk276) I; dhEx1206[myo-3p::flag::HA::mCherry::vha-13cDNA::unc-54 3′UTR, myo-2p::GFP] | This paper | AA4866 | |
| Strain, strain background (Caenorhabditis elegans) | N2; dhEx1207[myo-3p::flag::HA::mCherry::vha-13cDNA::vha-13 3′UTR, myo-2p::GFP] | This paper | AA5067 | myo-3p::vha-13 wt 3′UTR |
| Strain, strain background (Caenorhabditis elegans) | mir-1(gk276) I; dhEx1207[myo-3p::flag::HA::mCherry::vha-13cDNA::vha-13 3′UTR, myo-2p::GFP] | This paper | AA5068 | |
| Strain, strain background (Caenorhabditis elegans) | vha-13(syb586[3xFlag::mNeonGreen::vha-13]) V | SunyBiotech | PHX586 | vha-13 wt 3′UTR |
| Strain, strain background (Caenorhabditis elegans) | mir-1(gk276) I; vha-13(syb586[3xFlag::mNeonGreen::vha-13]) V | This paper | AA4813 | |
| Strain, strain background (Caenorhabditis elegans) | vha-13(syb586[3xFlag::mNeonGreen::vha-13]) V; dhEx965[mir-1p::mir-1, myo-2p::mCherry] | This paper | AA4850 | vha-13 wt 3′UTR + mir-1 transgene |
| Strain, strain background (Caenorhabditis elegans) | vha-13(syb587,syb504[3xFlag::mNeonGreen::vha-13 miR-1 BS1 mutated]) V | SunyBiotech | PHX587 | vha-13 MUT1 3′UTR One miR-1 BS mutated |
| Strain, strain background (Caenorhabditis elegans) | mir-1(gk276) I; vha-13(syb587,syb504[3xFlag::mNeonGreen::vha-13 miR-1 BS1 mutated]) V | This paper | AA4184 | |
| Strain, strain background (Caenorhabditis elegans) | vha-13(syb2180,syb587,syb504[3xFlag::mNeonGreen::vha-13 miR-1 BS1,2 mutated]) V | SunyBiotech | PHX2180 | vha-13 MUT2 3′UTR Two miR-1 BSs mutated |
| Strain, strain background (Caenorhabditis elegans) | mir-1(gk276) I; vha-13(syb2180,syb587,syb504[3xFlag::mNeonGreen::vha-13 miR-1 BS,2 mutated]) V | This paper | AA5123 | |
| Strain, strain background (Caenorhabditis elegans) | vha-5(syb1093[3xFlag::mNeonGreen::vha-5]) IV | SunyBiotech | PHX1093 | |
| Strain, strain background (Caenorhabditis elegans) | mir-1(gk276) I; vha-5(syb1093[3xFlag::mNeonGreen::vha-5]) IV | This paper | AA5069 | |
| Strain, strain background (Caenorhabditis elegans) | hlh-30(syb809[hlh-30::mNeonGreen]) IV | SunyBiotech | PHX809 | |
| Strain, strain background (Caenorhabditis elegans) | mir-1(gk276) I; hlh-30(syb809[hlh-30::mNeonGreen]) IV | This paper | AA5195 | |
| Strain, strain background (Caenorhabditis elegans) | rmIs133[P(unc-54) Q40::YFP] | CGC | AM141 RRID:WB-STRAIN:WBStrain00000183 | N2;Q40 |
| Strain, strain background (Caenorhabditis elegans) | mir-1(gk276) I; rmIs133[P(unc-54) Q40::YFP] | This paper | AA3112 | gk276;Q40 |
| Strain, strain background (Caenorhabditis elegans) | N2; pkIs2386[Punc-54::alphasynuclein::YFP + unc-119(+)] | This paper | AA1311 | |
| Strain, strain background (Caenorhabditis elegans) | mir-1(gk276) I; pkIs2386[Punc-54::alphasynuclein::YFP + unc-119(+)] | This paper | AA5270 | |
| Strain, strain background (Escherichia coli) | OP50 | CGC | ||
| Strain, strain background (Escherichia coli) | DH5α | Life Technologies | ||
| Other | RNAi | Source BioScience, C. elegans RNAi Collection – Ahringer | Multiple | Supplementary file 1e |
| Other | RNAi | Source BioScience, C. elegans ORF-RNAi Resource – Vidal | Multiple | Supplementary file 1e |
| Other | hlh-30 RNAi | Source BioScience, C. elegans RNAi Collection – Ahringer | W02C12.3 | hlh-30i |
| Other | daf-16 RNAi | Source BioScience, C. elegans RNAi Collection – Ahringer | R13H8.1 | daf-16i |
| Other | vha-13 RNAi | Source BioScience, C. elegans RNAi Collection – Ahringer | Y49A3A.2 | vha-13i |
| Other | vha-5 RNAi | Source BioScience, C. elegans RNAi Collection – Ahringer | F35H10.4 | vha-5i |
| Recombinant DNA reagent | Plasmid L3781 | FireLab | Worm Expression vector | |
| Recombinant DNA reagent | Plasmid pDEST R4-R3 | Invitrogen | MultiSite Gateway destination vector | |
| Recombinant DNA reagent | Plasmid myo3p::flag::HA::mCherry::vha-13cDNA::unc-54 3′UTR | This paper | BA4331 | Vector pDEST R4-R3 |
| Recombinant DNA reagent | Plasmid myo3p::flag::HA::mCherry::vha-13cDNA::vha-13 3′UTR | This paper | BA4334 | Vector pDEST R4-R3 |
| Recombinant DNA reagent | Plasmid pPD122.11 | FireLab | Worm Expression vector | |
| Sequence-based reagent | Primer | This paper | Supplementary file 1h | |
| Commercial assay, kit | TaqMan assay for mir-1 | Life Technologies | Assay ID 000385 | |
| Antibody | Anti-GFP (mouse monoclonal) | Living Colors | JL-8 RRID:AB_10013427 | 1:2000 |
| Antibody | Anti-Histone H3 (rabbit polyclonal) | Abcam | ab1791 RRID:AB_302613 | 1:5000 |
| Antibody | Anti-α-Tubulin (mouse monoclonal) | Sigma | T6199 RRID:AB_477583 | 1:5000 |
| Antibody | Anti-FLAG (mouse monoclonal) | Sigma | F1804 RRID:AB_262044 | 1:2000 |
| Antibody | Anti-mouse IgG (goat polyclonal coupled with horseradish peroxidase) | Invitrogen | G-21040 RRID:AB_2536527 | 1:5000 |
| Antibody | Anti-rabbit IgG (goat polyclonal coupled with horseradish peroxidase) | Invitrogen | G-21234 RRID:AB_2536530 | 1:5000 |
| Chemical compound, drug | LysoTracker Red | Life Technologies | LysoTracker Red DND-99 |
Additional files
-
Supplementary file 1
Raw data.
(a) Life span and heat stress data. (b) Aggregate and behavior data. (c) CeleST data. (d) List of candidate genes with in silico predicted miR-1 binding sites using microRNA.org, TargetScanWorm, and PicTar. (e) RNAi motility screen. (f) Proteomic analysis of differentially regulated proteins in mir-1 vs. wild-type. (g) Microscopy data. (h) Primers.
- https://cdn.elifesciences.org/articles/66768/elife-66768-supp1-v1.xlsx
-
Transparent reporting form
- https://cdn.elifesciences.org/articles/66768/elife-66768-transrepform-v1.docx
Download links
A two-part list of links to download the article, or parts of the article, in various formats.
Downloads (link to download the article as PDF)
Open citations (links to open the citations from this article in various online reference manager services)
Cite this article (links to download the citations from this article in formats compatible with various reference manager tools)
miR-1 coordinately regulates lysosomal v-ATPase and biogenesis to impact proteotoxicity and muscle function during aging
eLife 10:e66768.
https://doi.org/10.7554/eLife.66768


