miR-1 coordinately regulates lysosomal v-ATPase and biogenesis to impact proteotoxicity and muscle function during aging
- Max Planck Institute for Biology of Ageing, Germany
- Department of Chemical Engineering, Texas Tech University, United States
- Cologne Excellence Cluster on Cellular Stress Responses in Aging-Associated Diseases (CECAD), University of Cologne, Germany
- Laboratory of Aging Biology, Department of Biochemistry and Tissue Biology, University of Campinas (UNICAMP), Brazil
- Experimental Medicine Research Cluster (EMRC), University of Campinas (UNICAMP), Brazil
- Obesity and Comorbidities Research Center (OCRC), University of Campinas (UNICAMP), Brazil
- State Key Laboratory of Cell Biology, Innovation Center for Cell Signaling Network, CAS Center for Excellence in Molecular Cell Science, Shanghai Institute of Biochemistry and Cell Biology, Chinese Academy of Sciences, University of Chinese Academy of Sciences, China
Abstract
Muscle function relies on the precise architecture of dynamic contractile elements, which must be fine-tuned to maintain motility throughout life. Muscle is also plastic, and remodeled in response to stress, growth, neural and metabolic inputs. The conserved muscle-enriched microRNA, miR-1, regulates distinct aspects of muscle development, but whether it plays a role during aging is unknown. Here we investigated Caenorhabditis elegans miR-1 in muscle function in response to proteostatic stress. mir-1 deletion improved mid-life muscle motility, pharyngeal pumping, and organismal longevity upon polyQ35 proteotoxic challenge. We identified multiple vacuolar ATPase subunits as subject to miR-1 control, and the regulatory subunit vha-13/ATP6V1A as a direct target downregulated via its 3′UTR to mediate miR-1 physiology. miR-1 further regulates nuclear localization of lysosomal biogenesis factor HLH-30/TFEB and lysosomal acidification. Our studies reveal that miR-1 coordinately regulates lysosomal v-ATPase and biogenesis to impact muscle function and health during aging.
Introduction
Aging is the major cause of progressive decline in all organ systems throughout the body. This is particularly evident in the musculature and often manifests as sarcopenia, the loss of muscle mass and strength. In fact, muscle frailty is a hallmark of tissue aging seen in species as diverse as worms, flies, mice, and humans (Cruz-Jentoft et al., 2010; Demontis et al., 2013; Herndon et al., 2002; Martinez et al., 2007; Miller et al., 2008; Nair, 2005). At the molecular level, frailty is often accompanied by a decline in muscle structure and function, as well as alterations in muscle proteostasis and metabolism. Nevertheless, muscle can respond positively to exercise and stress and rejuvenate even into older age, showing remarkable plasticity (Cartee et al., 2016; Distefano and Goodpaster, 2018; Pollock et al., 2018). A molecular study of muscle aging and plasticity in a genetically tractable model could shed light on the fundamental aspects of these processes.
microRNAs are small 22–26 nucleotide RNAs that bind with complementarity through their seed sequence to target mRNAs to downregulate gene expression (Gu and Kay, 2010). They can work as molecular switches or fine-tune gene regulation, and typically have multiple targets, thereby coordinating cellular programs. Many microRNAs are expressed in a tissue-specific manner and regulate programs cell autonomously, and could therefore potentially serve as tissue-specific therapeutic targets (Guo et al., 2015; Panwar et al., 2017). In addition, some microRNAs are found circulating in serum (Chen et al., 2008; Weber et al., 2010), raising the possibility that they can act cell non-autonomously as well.
miR-1 homologs are muscle-enriched microRNAs that are highly conserved in evolution and important for mammalian heart and muscle development (Zhao et al., 2007). Like in other animals, Caenorhabditis elegans mir-1 is expressed in body wall (‘skeletal’) and pharyngeal (‘cardiac’) muscle (Simon et al., 2008). Deletion mutants are viable and exhibit modest changes in the behavior of the neuromuscular junction (Simon et al., 2008) and autophagy (Nehammer et al., 2019), but little else is known of its normative function. In this work, we examined the potential role of miR-1 in regulating muscle function and proteostasis. Surprisingly, we found that under polyQ35 proteotoxic challenge, mir-1 mutation prevents aggregate formation and increases organismal motility and pharyngeal contractility during aging. Mechanistically, miR-1 regulates expression of several lysosomal v-ATPase subunits and targets a crucial regulatory component, vha-13/ATP6V1A, via its 3′UTR to impact proteotoxicity and longevity. Further, miR-1 regulates lysosomal acidification and nuclear localization of HLH-30/TFEB, a key regulator of lysosome biogenesis. These studies reveal an unexpected role of miR-1 in coordinating lysosomal function and health during aging.
Results
mir-1 mutation improves muscle motility upon polyQ35 challenge
mir-1 is a highly conserved microRNA expressed predominantly in C. elegans muscle tissues including pharyngeal muscle, body wall muscle, and sex muscles (Andachi and Kohara, 2016; Martinez et al., 2008). While microRNAs are known as important developmental regulators (Ivey and Srivastava, 2015), miR-1 expression also persists throughout adulthood, declining by half from day 1 to day 14 of adulthood (Figure 1—figure supplement 1A, data from Zhou et al., 2019). To unravel molecular miR-1 function, we first characterized the nature of several mir-1 mutations. The reference alleles (n4101, n4102) consist of large deletions of the region that could have confounding effects on nearby loci. We therefore focused on gk276, a smaller 192 base pair deletion that removes the mir-1 coding region as well as the downstream non-coding region, and used this deletion in our experiments. We also generated an independent mir-1 allele, dh1111, by CRISPR genome engineering (Figure 1A), which deletes a 53 base pair region within the mir-1 locus. Both alleles failed to express the mature miRNA as measured by TaqMan qPCR (Figure 1—figure supplement 1B), and thus are mir-1 null mutants.
Figure 1 with 1 supplement see all
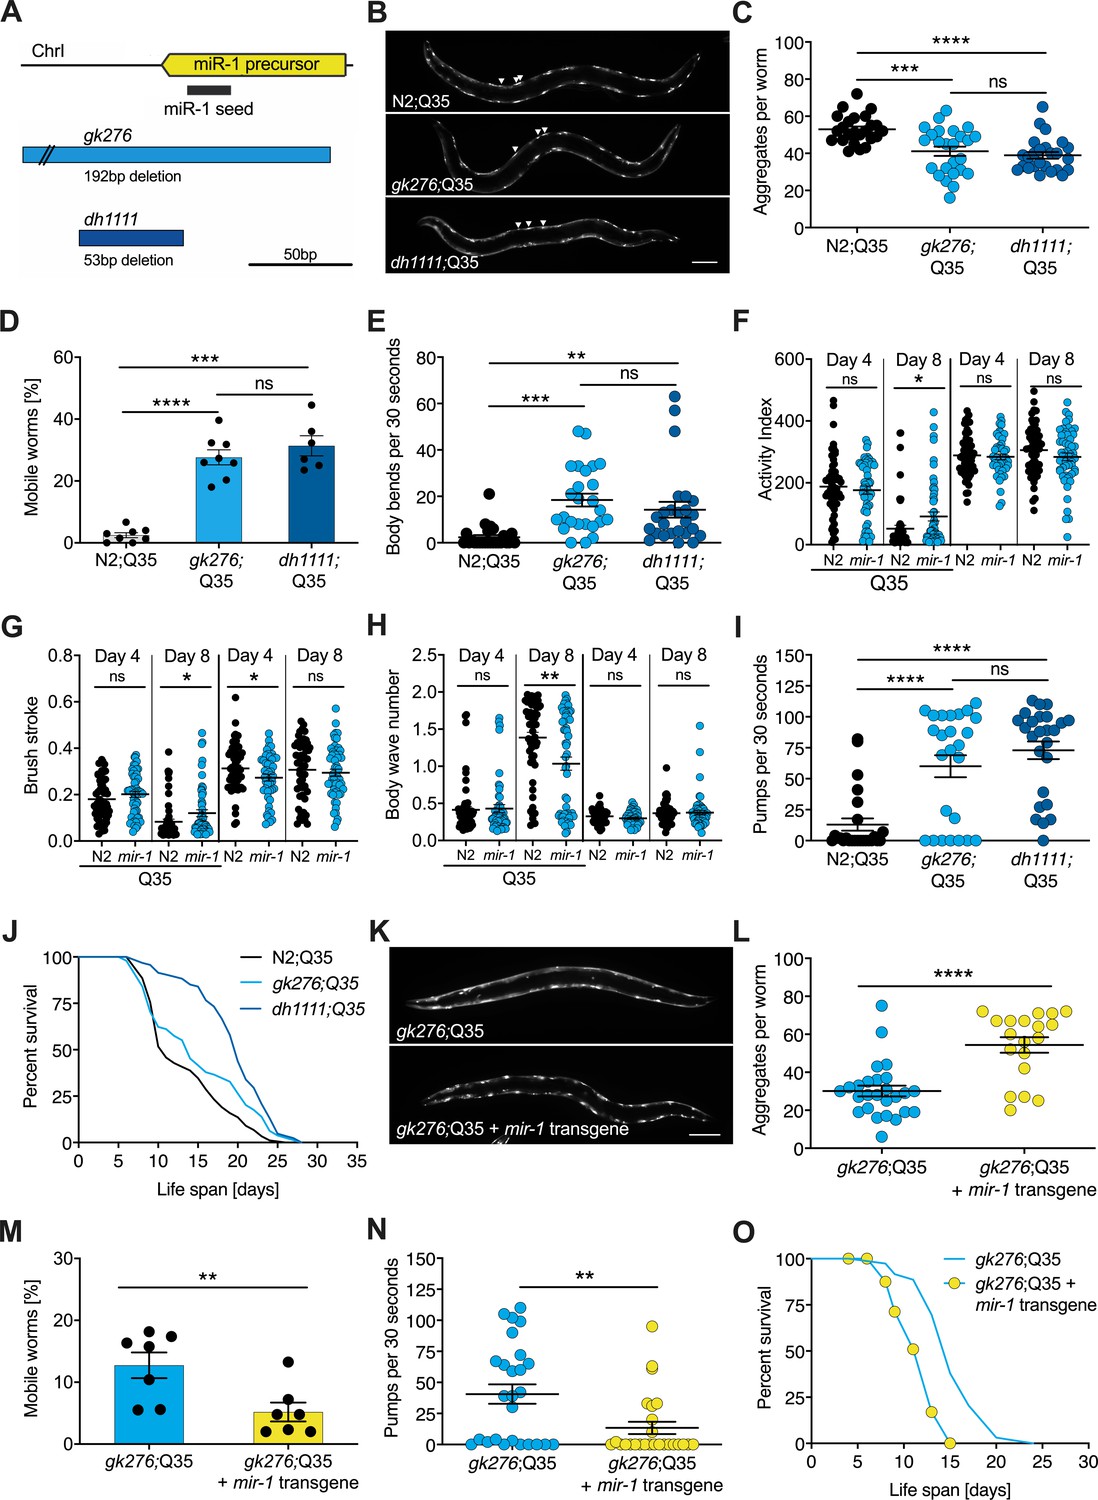
mir-1 mutants exhibit improved motility upon polyQ35 challenge.
(A) Schematic showing the mir-1 locus, deletion alleles mir-1(gk276) and mir-1(dh1111) (see Materials and methods). (B) Representative images of N2 wild-type (WT) and mir-1 mutant animals expressing unc-54p::Q35::YFP (Q35) showing loss of aggregates in the mir-1 background on day 4 of adulthood. Arrowheads point to aggregates. Scale bar 100 μm. (C) Quantification of Q35::YFP aggregates in (B). Each dot represents one animal, mean ± SEM from one representative experiment, N = 3, one-way ANOVA, Tukey’s multiple comparisons test, *** p<0.001, ****p<0.0001, ns, not significant. (D) Motility of indicated mir-1 alleles and N2 (WT) animals expressing unc-54p::Q35::YFP, measured by the circle test, day 8 of adulthood. Percent worms that left the circle after 30 min. Each dot represents one experiment. Mean ± SEM of N = 6–8. One-way ANOVA, ***p<0.001, ****p<0.0001, ns, not significant. (E) Motility of mir-1 alleles and N2 animals expressing unc-54p::Q35::YFP, measured by the thrashing assay. 25 worms per condition, each dot represents one animal, mean ± SEM from one representative experiment, N = 4, one-way ANOVA, **p<0.01 ***p<0.001, ns, not significant. CeleST analysis of activity index (F), brush stroke (G), and body wave number (H) comparing N2 and mir-1(gk276) mutant animals with or without unc-54p::Q35::YFP at days 4 and 8 of adulthood. Each dot represents one animal. t-test, *p<0.05 **p<0.01, ns, not significant. (I) Pharyngeal pumping rate measured on day 8 of adulthood in mir-1 alleles and WT animals expressing unc-54p::Q35::YFP. Each dot represents one animal, mean ± SEM from one representative experiment, N = 3, one-way ANOVA, ****p<0.0001, ns, not significant. (J) Life span experiments of mir-1 mutants and N2 animals expressing unc-54P::Q35::YFP. One experiment of N = 3. Log-rank test: N2;Q35 vs. gk276;Q35: p=0.03. N2;Q35 vs. dh1111;Q35: p<0.0001. (K) Presence of an extrachromosomal mir-1 transgene brings back aggregates in mir-1(gk276) mutants at day 4 of adulthood, showing rescue by the transgene. Transgenic worms were compared to non-transgenic segregants of the same strain. Scale bar 100 μm. (L) Quantification of Q35::YFP aggregates (from K), each dot represents total aggregate number of one animal, mean ± SEM from one representative experiment, N = 3, t-test, ****p<0.0001. (M) Motility of mir-1(gk276);Q35 animals in the presence or absence of the mir-1 transgene at day 8 of adulthood, measured by circle test. Transgenic worms were compared to non-transgenic segregants of the same strain. Each dot represents one experiment, mean ± SEM of N = 7. t-test, **p<0.01. (N) Pharyngeal pumping rate of mir-1(gk276); Q35 animals in the presence or absence of the mir-1 transgene. Transgenic worms were compared to non-transgenic segregants of the same strain. Each dot represents one animal, mean ± SEM from one representative experiment, N = 7, t-test, **p<0.01. (O) Life span experiments of mir-1(gk276);Q35 animals in the presence or absence of the mir-1 transgene. Transgenic worms were compared to non-transgenic segregants of the same strain. One representative experiment of N = 5, log-rank test, p<0.0001.
To investigate mir-1 function, we measured several physiological parameters. We found that mir-1 mutants gk276 and dh1111 developed normally, had normal brood size, and near normal life span (Figure 1—figure supplement 1C–E, Supplementary file 1a). Additionally, motility on solid media, thrashing in liquid medium, and pharyngeal pumping ability determined at days 8 and 14 of adulthood were similar to N2 wild-type (WT) controls (Figure 1—figure supplement 1F, G, Supplementary file 1b). Since mir-1 deletion showed little obvious phenotype on its own, we reasoned that some physiological differences might emerge under stress conditions, hence we tested heat and proteotoxic stress. We saw little distinction from WT with moderate heat stress by growth at 25°C nor heat shock resistance at 35°C (Figure 1—figure supplement 1E, H, Supplementary file 1a).
We next tested the idea that mir-1 mutants might differ in their response to proteotoxic stress. To do so, we used a strain expressing polyglutamine-35 tracts fused to yellow fluorescent protein (YFP) under the control of the muscle myosin-specific unc-54 promoter (unc-54p::Q35::YFP), which has been used previously in models of proteotoxicity and Huntington’s disease (Brignull et al., 2006; Morley et al., 2002). In these strains, initially soluble proteins become sequestered into insoluble aggregates, visible as foci in the muscle of the worm. Worms expressing the polyQ35 stretches showed progressive age-dependent protein aggregation, which became clearly visible by day 4 of adulthood. Interestingly, we observed that mir-1 mutants displayed significantly less aggregates (avg. 38 and 36, day 4 of adulthood) compared to age-matched WT controls (avg. 53) at this time (Figure 1B, C, Supplementary file 1b).
We further investigated the possible effect of proteotoxicity by measuring organismal motility of Q35 strains using the circle test. This test measures how many worms crawl out of a 1 cm circle within 30 min on day 8 of adulthood on agar plates. Day 8 was chosen as a timepoint where paralysis becomes visible, but animals are still viable. We observed that about 30% of the mir-1;Q35 mutants left the circle while only 2.5% of the control Q35 worms did so (Figure 1D, Supplementary file 1b). We also measured motility by counting the thrashing rate in liquid medium on day 8 of adulthood. Though the degree of paralysis was more variable, both mir-1 mutants gk276 and dh1111 were significantly more mobile (avg. 16, 15 body bends) compared to age-matched Q35 controls (avg. two body bends, Figure 1E, Supplementary file 1b).
To further characterize miR-1’s impact on muscle function, we performed CeleST analysis (Restif et al., 2014), a MATLAB-based algorithm that extracts various parameters of movement (wave initiation, travel speed, brush stroke, activity index) and gait (wave number, asymmetry, curl, stretch) from video footage. Typically activity measures decline with age, whereas gait abnormalities increase with age (Restif et al., 2014). We scored animals focusing on days 4 and 8 of adulthood comparing mir-1(gk276) and WT in the presence and absence of the Q35 array. In the absence of Q35, mir-1 mutants performed similar to WT (e.g., body wave) or were slightly different (wave initiation, travel speed, stretch) for some parameters (Supplementary file 1c). In the presence of Q35, however, mir-1(gk276) mutants did significantly better than WT for several measures of activity (activity index, brush stroke, travel speed, wave initiation rate) and gait (number of body waves) on day 8 (Figure 1F–H, Figure 1—figure supplement 1I–M, Supplementary file 1c), consistent with the idea that mir-1 mutation protects against Q35 proteotoxic stress during mid-life. mir-1 is also highly expressed in the pharynx, a contractile tissue similar to cardiac muscle. We observed that the pumping rate of mir-1;Q35 worms was significantly increased (gk276, avg. 60; dh1111, avg. 78) compared to Q35 controls (avg. 16) on day 8 of adulthood (Figure 1L, Supplementary file 1b). Furthermore, we found that the life span of mir-1(dh1111);Q35 strains was significantly extended (n = 3, mean 13 [WT] vs. 19 [dh1111] days) compared to Q35 alone (Figure 1J, Supplementary file 1a). A similar trend was seen with gk276 in two out of three experiments (Figure 1J, Supplementary file 1a). These findings suggest that mir-1 reduction can counter the intrinsic and systemic detrimental effects of Q35 proteotoxic challenge.
Introducing a WT mir-1 transgene into the mir-1(gk276) background restored normal levels of mature miR-1 (Figure 1—figure supplement 1N) and largely reversed mir-1 phenotypes, showing increased Q35 aggregates, decreased motility, pumping rate, and life span compared to non-transgenic controls (Figure 1K–O, Supplementary file 1a, b). The similarity of behavior among the different mir-1 alleles and the rescue of these phenotypes by the WT mir-1 transgene demonstrates that the mir-1 mutation is causal for removing muscle aggregates and improving mid-life motility.
To determine whether mir-1 loss generally protects against proteotoxic stress, we examined two other muscle-specific proteotoxic models: polyQ40 and human α-synuclein (α-syn). In contrast to polyQ35, which forms aggregates during adulthood, polyQ40 aggregates were already visible during development. We found aggregate numbers significantly reduced in mir-1(gk276);Q40 L4 worms (Supplementary file 1b). However, the motility of mir-1(gk276);Q40 worms, determined by 1 min thrashing assays, was unaffected at day 3 of adulthood and reduced in two out of three experiments at day 7 of adulthood compared to Q40 controls (Supplementary file 1b). Similarly, aggregate numbers were reduced in mir-1(gk276);α-syn worms at day 1 of adulthood compared to the α-syn control (Supplementary file 1b). Thrashing of mir-1(gk276);α-syn worms was significantly reduced on day 1 of adulthood, but by day 5 there was no significant difference in motility between mir-1(gk276);α-syn and α-syn worms (Figure 1—figure supplement 1O, Supplementary file 1b). Taken together, mir-1 loss reduced aggregate numbers in three different proteotoxic stress paradigms. However, reduced number of aggregates did not always directly correlate with improved motility, reinforcing the notion that protein aggregation may promote or aggravate health depending on the proteotoxic species and age (Cohen et al., 2006).
v-ATPase subunits are downstream mediators of miR-1-induced motility improvement
To identify downstream mediators of protein quality control improvement in mir-1 mutants, we used computational and proteomic approaches to find potential miR-1 targets. For the computational approach, we used publicly available prediction tools to identify genes harboring miR-1 seed binding sites in their 3′UTR, namely microRNA.org, TargetScanWorm, and PicTar (Betel et al., 2008; Jan et al., 2011; Lall et al., 2006). These prediction tools use distinct algorithms that often yield different and extensive sets of candidates (Figure 2A). Therefore, we limited ourselves mostly to candidates that were predicted as targets by all three algorithms. This yielded 68 overlapping candidates (Figure 2A; Supplementary file 1d). Interestingly, network analysis of these 68 genes using STRING (string-db.org) (Snel et al., 2000) revealed a tight cluster of predicted targets encoding 11/21 subunits of the vacuolar ATPase (Figure 2B). Five additional vacuolar ATPase genes were identified by two of the three prediction algorithms (Figure 2—figure supplement 1A). In addition, two genes that code transcription factors implicated in lysosome biogenesis, daf-16/FOXO and hlh-30/TFEB (Sardiello et al., 2009; Settembre et al., 2011), also contained predicted miR-1 binding sites in their 3′UTRs.
Figure 2 with 1 supplement see all
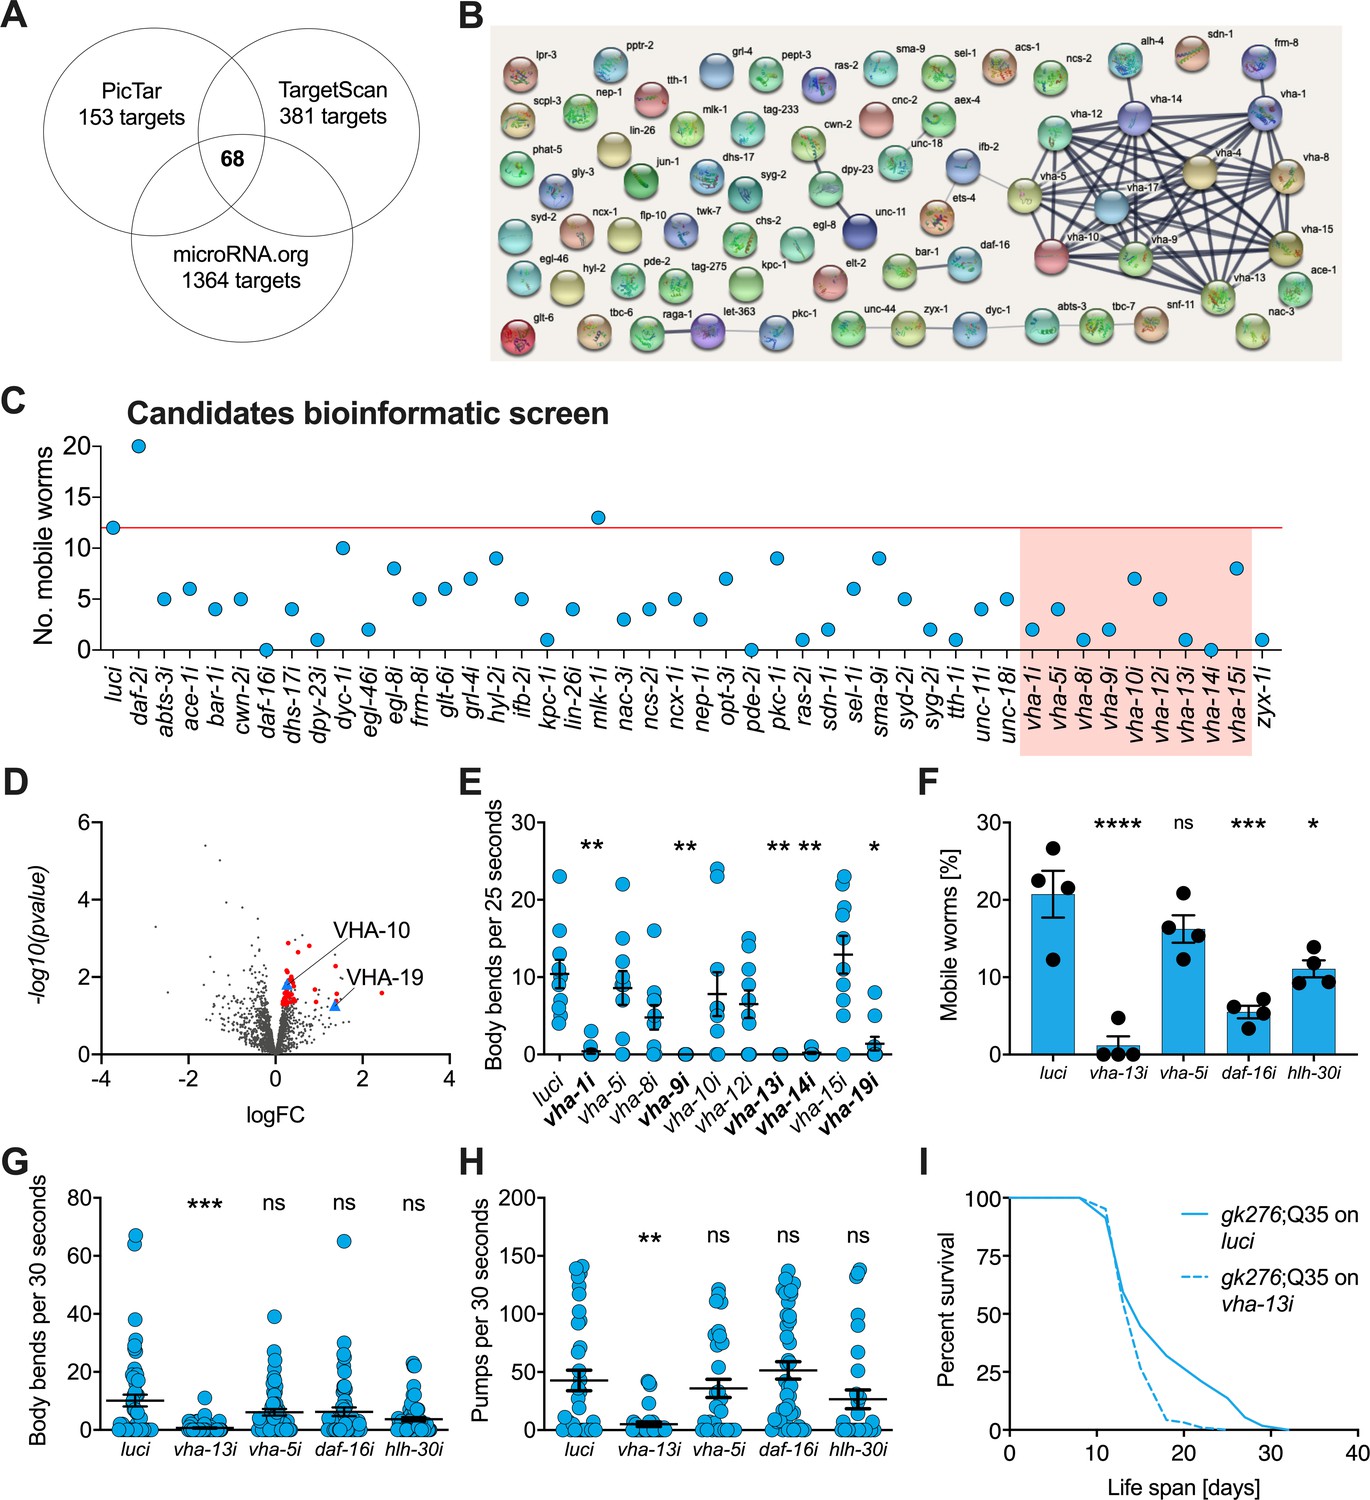
v-ATPase subunits are downstream mediators of mir-1-induced motility improvement.
(A) Computational screen for potential miR-1 targets using in silico predictions microRNA.org, TargetScanWorm (TargetScan), and PicTar identifies 68 shared candidates. (B) STRING network analysis of predicted miR-1 targets reveals a cluster of v-ATPase subunits. (C) Initial RNAi screen of computationally predicted candidates using the circle test on day 8 of adulthood reveals a number of candidates that reduced motility of mir-1(gk276);Q35. 20 worms per RNAi (N = 1). Red line: number of luciferase controls that left the circle. v-ATPases are highlighted in red. (D) Volcano plot of proteomic analysis showing differentially regulated proteins in mir-1(gk276) vs. N2 animals. VHA-10 and VHA-19 are indicated by blue triangles. Red dots and blue triangles show upregulated proteins tested in circle assay. N = 6 (mir-1) and 4 (N2) biological replicates. (E) Effect of v-ATPase subunit RNAi knockdown on mir-1(gk276);Q35 motility as measured in the thrashing assay. Animals are grown on the corresponding RNAi from L4 onwards. N = 1. Mean ± SEM, one-way ANOVA, only significant values are labeled: *p<0.05, **p<0.01. (F, G) Motility assay (circle test) and thrashing assay on day 8 of mir-1(gk276);Q35 worms upon vha-13, vha-5, daf-16, and hlh-30 RNAi knockdown. Control, luciferase RNAi (luci). Mean ± SEM of N = 4, one-way ANOVA, *p<0.05, ***p<0.001, ****p<0.0001, ns, not significant. (H) Pumping assay of mir-1(gk276);Q35 worms upon vha-13, vha-5, daf-16, and hlh-30 RNAi knockdown on day 8 of adulthood. Control, luciferase RNAi (luci). N = 3, mean ± SEM, one-way ANOVA, **p<0.01, ns, not significant. (I) Life span of mir-1(gk276);Q35 and Q35 worms upon vha-13 RNAi knockdown. Control, luciferase RNAi (luci). One experiment of N = 3, log-rank test: p<0.01.
Next, we carried out a functional screen of the selected candidates. We reasoned that mir-1 deletion likely results in an upregulation of these proteins, and that RNAi knockdown of the relevant genes should therefore abrogate the improved motility of mir-1;Q35 worms. Specifically, we tested 44 available RNAi clones (Supplementary file 1e) and scored motility using a rapid version of the circle test, measuring the ability of mir-1;Q35 worms grown on candidate RNAis to migrate out of a 1 cm diameter circle within 1 min (Figure 2C). 12/20 mir-1;Q35 worms left the circle when grown on luciferase control RNAi (luci). We considered genes as potential mir-1;Q35 suppressors if less than four worms left the circle upon RNAi knock down of the genes and prioritized candidates when only zero or one worm left. Among the selected candidates, vacuolar ATPase subunits vha-1, vha-8, vha-9, vha-13, and vha-14, as well as muscle gene zyx-1, stood out as molecules suppressing mir-1 motility (Figure 2C and Figure 2—figure supplement 1D).
As a parallel approach to identify miR-1 regulatory targets in an unbiased manner, we performed TMT shotgun proteomic analysis, comparing mir-1 mutants to WT worms on day 1 of adulthood. We identified approximately 1500–2000 proteins in the replicates (Figure 2D, Supplementary file 1f). Samples showed a high degree of correlation (Figure 2—figure supplement 1B) with minimal separation of WT and mir-1 genotypes, reflecting the subtle changes induced by mir-1 mutation at the organismal level. For further analysis, we therefore selected the 50 top upregulated proteins with available RNAi clones and tested them for their ability to suppress the motility phenotype using the circle test (Figure 2—figure supplement 1C, E, Supplementary file 1e), among them vha-10, vha-19, and zyx-1, which had previously been predicted to harbor mir-1 binding sites.
Based on the prominence of v-ATPase genes among both the informatic and the proteomic candidates, we systematically tested 10 of them in the thrashing assay, confirming v-ATPase subunits vha-1, vha-9, vha-13, vha-14, and vha-19 as likely mediators of mir-1;Q35 motility (Figure 2E). We further tested the impact of vha-5 and vha-13 on mir-1;Q35 phenotypes in more detail, as well as transcription factors daf-16/FOXO and hlh-30/TFEB as potential miR-1 targets that mediate lysosomal biogenesis. Using the circle test, thrashing assay, and pharyngeal pumping as readout (Figure 2F–H), we again verified in particular the role of vha-13 in reducing mir-1 motility. In addition, daf-16/FOXO and hlh-30/TFEB RNAi reduced motility as measured in the circle test, indicating a potential requirement for these transcription factors. We also confirmed that the effect on motility was specific to the mir-1 background for vha-5, vha-13, and hlh-30 since RNAi of these genes had no significant effect on motility in N2;Q35 worms (Figure 2—figure supplement 1F).
In summary, knockdown of 5 out of 10 tested v-ATPase subunits from both the computational and proteomics screen, as well as two transcriptional mediators of lysosome biogenesis, reduced or abolished mir-1 motility improvement either by circle test or thrashing, revealing these molecules to have congruent physiological effects. Therefore, we focused most of our further efforts on examining v-ATPase regulation by miR-1.
miR-1 directly regulates VHA-13 protein levels in muscle tissue
MicroRNAs regulate their targets by binding to the 3′UTR of client mRNAs, thereby decreasing RNA stability and translation. If miR-1 regulates v-ATPase subunits, then miR-1 loss would be predicted to de-repress v-ATPase mRNA and protein levels. Because the onset of Q35 aggregation becomes visible by day 4 of adulthood, we examined the mRNA expression of representative v-ATPase subunits at this time. We found that the mRNA levels of vha-5, vha-10, vha-13, and vha-19, as well as transcription factors hlh-30/TFEB and daf-16/FOXO, were increased approximately twofold in mir-1 mutants compared to age-matched WT worms (Figure 3A), consistent with the idea that these genes are miR-1 targets.
Figure 3 with 1 supplement see all

miR-1 directly regulates vha-13 via its 3′UTR in muscle tissue.
(A) RT-qPCR of vha-5, vha-10, vha-13, and vha-19, as well as daf-16 and hlh-30 mRNA levels in wild-type (WT) (N2) and mir-1(gk276) mutants on day 4 of adulthood. Mean ± SEM, N = 3–4, one-way ANOVA, **p<0.01, ***p<0.001. (B) Expression pattern of endogenously tagged 3xFlag::mNeonGreen::vha-13 in pharynx, excretory cell and canal, gut, vulva muscle (vum), hypodermis, and muscle (arrowheads indicate dense bodies). (C) Confocal images of the head region in worms carrying endogenously tagged 3xFlag::mNeonGreen::vha-13 in late L4 mir-1(gk276) and WT (N2) animals at 25°C. Red rectangle highlights the area of vha-13 expression in the isthmus used for determination of mNeonGreen intensity. Scale bar 20 μm. (D) Quantification of fluorescent intensity of 3xFlag::mNeonGreen::VHA-13 in the isthmus of indicated genotypes (as shown in C) in late L4 larvae at 25°C. Mean ± SEM of N = 5, t-test, **p<0.01. (E) Quantification of fluorescent intensity of 3xFlag::mNeonGreen::VHA-13 in the isthmus of N2 in the presence or absence of the mir-1 transgene in late L4 larvae at 25°C. Transgenic worms (mir-1 transgene) were compared to non-transgenic segregants (N2) of the same strain. Mean ± SEM of N = 4, t-test, ***p<0.001. (F) Graphic showing the 3′UTR of endogenously tagged 3xFlag::mNeonGreen::vha-13. vha-13 wt: vha-13 WT 3′UTR. vha-13 MUT1: one miR-1 binding site (BS) is mutated. vha-13 MUT2: both miR-1 BSs are mutated. unc-54 3’UTR: the vha-13 3′UTR is substituted by unc-54 3′UTR. Nucleotide sequences of mutated miR-1 BSs are shown below WT. (G) Quantification of fluorescence intensity in the isthmus of L4 larvae with endogenously tagged 3xFlag::mNeonGreen::vha-13 of vha-13 MUT2 3′UTR in relation to vha-13 wt 3′UTR, in N2 and mir-1(gk276) mutant backgrounds at 25°C, using confocal imaging. Mean ± SEM of N = 3, one representative experiment, one-way ANOVA, ****p<0.0001, ns, not significant. (H) Western blot image of late L4 WT and mir-1 mutants expressing transgenic Flag-tagged vha-13 in body wall muscle (myo-3p::vha-13) with either the unc-54 3′UTR (labeled in red), which lacks miR-1 BSs, or the wt vha-13 3′UTR, which contains the two miR-1 BSs (labeled in black), immunoblotted with anti-Flag and anti-Histone H3 antibodies. Histone H3 loading control is shown below. Biological replicates (N = 3) separated by dashed lines. (I) Quantification of western blot shown in (H), with flag-tag intensity normalized to histone H3 loading control, mean ± SEM of N = 3, one-way ANOVA, ***p<0.001, ns, not significant. (J) Quantification of aggregates in Q35 worms expressing transgenic vha-13 in the body wall muscle (myo-3p::vha-13 wt;Q35) or non-transgenic segregants (Q35) of the same strain. 25 worms per genotype, mean ± SEM of one representative experiment, N = 4, t-test, ***p<0.001. (K) Motility of Q35 worms expressing transgenic vha-13 in the body wall muscle (myo-3p::vha-13 wt;Q35) or non-transgenic segregants (Q35) of the same strain in circle test. Mean ± SEM. One experiment of N = 2, t-test, ***p<0.001. (L) Pharyngeal pumping rate of myo-3p::vha-13 wt;Q35 and Q35 non-transgenic segregants of the same strain. One representative experiment of N = 4, mean ± SEM, t-test, ***p<0.001.
We further investigated whether miR-1 regulates these gene products at the protein level. We endogenously tagged vha-5, vha-10, vha-13, and vha-19 (N-terminus) with 3xFlag-mNeonGreen-tag as well as hlh-30 (C-terminus) with mNeonGreen-tag by CRISPR/Cas9 genome editing. Tagging vha-19 and vha-10 caused lethality and was not pursued further. Tagged vha-5 showed significant upregulation in the pharynx in mir-1(gk276) mutants compared to WT, but not in vulva muscle (Figure 3—figure supplement 1A, B, Supplementary file 1g). However, vha-5 RNAi knockdown had no significant difference in motility compared to controls (Figure 2E–G, Supplementary file 1b). Further, we saw no obvious regulation of endogenously tagged HLH-30 protein levels in the pharynx in late L4 larvae or day 4 adults (Figure 4—figure supplement 1A, B, Supplementary file 1g), though we did see increased nuclear localization in the hypodermis in day 4 mir-1(gk276) adults (Figure 4A, B).
Figure 4 with 1 supplement see all
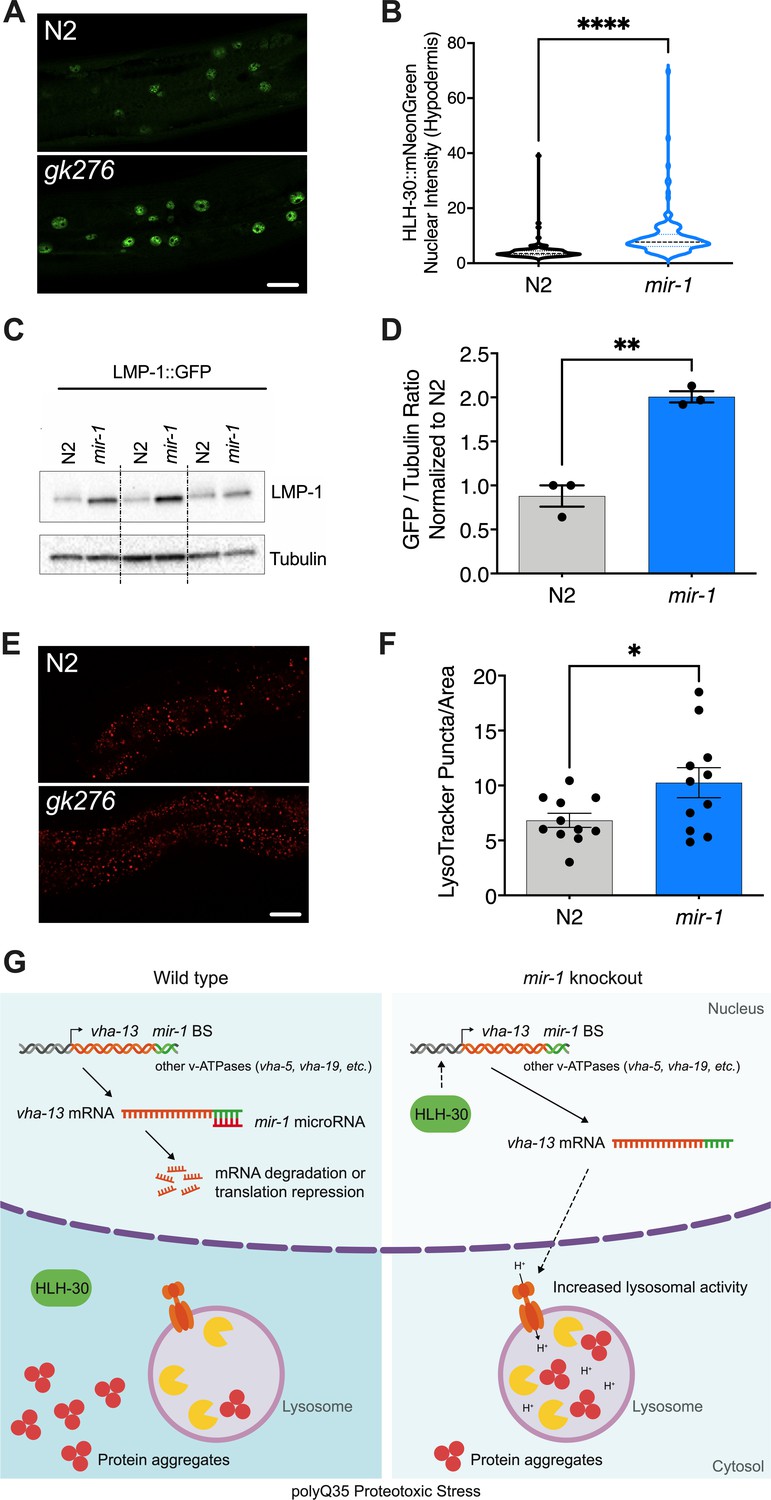
mir-1 mutation enhances lysosomal biogenesis and acidification.
(A) Fluorescent image comparing HLH-30::mNeonGreen nuclear localization in the hypodermis of the mir-1(gk276) and wild-type (WT) (N2) backgrounds at day 4 of adulthood, maintained at 25°C. Scale bar 20 μm. (B) Quantitation of nuclear localization in (A). Violin plot, mean ± SEM of one representative experiment of N = 3, t-test, **** p<0.0001. (C) Western blot of LMP-1::GFP in WT and mir-1 mutants at the L4 stage, immunoblotted with anti-GFP or anti-α-tubulin antibodies. Biological replicates (N = 3) separated by dashed lines. (D) Quantification of the western blot in (C), normalized to α-tubulin loading control. N = 3 BR, line and error bars indicate mean ± SEM, t-test, **p<0.01. (E) Representative images of lysotracker staining in WT and mir-1(gk276) mutants at day 4 of adulthood at 25°C. Scale bar 20 μm. (F) Quantification of lysotracker images using a predefined squared area approximately spanning the second to fourth gut cell. Quantification was performed using ImageJ. N = 3 BR, line and error bars indicate mean ± SEM of combined experiments, t-test, *p<0.05. (G) Working model. miR-1 normally limits proteoprotective pathways, downregulating the expression of vha-13, other v-ATPases and factors by binding miR-1 binding site(s) in the 3′UTR (miR-1 BS) of the corresponding mRNA (WT, polyQ35 proteotoxic stress). Loss of miR-1 (mir-1 knockout, polyQ35 proteotoxic stress) results in de-repression of vha-13 and elevated lysosomal activity. Nuclear localization of HLH-30/TFEB, a master regulator of lysosome biogenesis, is also enhanced, collectively resulting in reduced number of aggregates under polyQ35 proteotoxic stress conditions.
N-terminally tagged vha-13(syb586), however, was viable, showed expression that was regulated, and harbored two potential mir-1 binding sites in the 3′UTR (Figure 3F, Figure 3—figure supplement 1C). Moreover, vha-13 RNAi (vha-13i) significantly compromised the motility of mir-1;Q35 strains in the RNAi screens (Figure 2C), which we further confirmed through thrashing assays and the circle test (Figure 2E–G). vha-13i also significantly reduced pharyngeal pumping and life span in the mir-1;Q35 background compared to luci RNAi controls (Figure 2H, I, Supplementary file 1a, b), yet had relatively minor effects on the motility of N2;Q35 itself (Figure 2—figure supplement 1F). We therefore focused on vha-13 as a promising candidate to pursue in depth for regulatory interactions with miR-1.
We first characterized the expression pattern of vha-13(syb586[3xFlag::mNeonGreen::vha-13]) in more detail. The 3xFlag::mNeonGreen::vha-13 was strongly expressed in the excretory cell, canal, hypodermis, as well as gut (Figure 3B). In the hypodermis, 3xFlag::mNeonGreen::VHA-13 was localized in discrete foci (Figure 3B, Figure 3—figure supplement 1D). Notably, 3xFlag::mNeonGreen::VHA-13 also resided in miR-1-expressing tissues of body wall muscle, sex muscles, and pharynx, where it was more weakly expressed. Within muscle cells, VHA-13 localized to dense bodies (analogous to vertebrate Z disks) and intervening cytosol (Figure 3B, Figure 3—figure supplement 1D).
Because mir-1 is expressed in muscle tissues, we focused on quantifying the expression of vha-13 in these tissues. Strikingly, we observed that vha-13 levels were upregulated in the pharyngeal isthmus of mir-1(gk276) mutants (Figure 3C, D, Supplementary file 1g), while conversely, overexpression of the mir-1 transgene decreased levels in this tissue relative to WT (Figure 3E, Supplementary file 1g). To further investigate whether miR-1 directly regulates vha-13, we altered two predicted miR-1 binding sites (BS) in the 3′UTR (Figure 3F). We first mutated miR-1 binding site 1 (vha-13 BS1 [syb504], at position 188–195 of vha-13 3′UTR), and then additionally miR-1 binding site 2 (vha-13 BS2 [syb2180], at position 253–258 of vha-13 3′UTR) in the endogenously tagged vha-13(syb586) strain. When only BS1 was mutated (MUT1), we still saw residual regulation of vha-13 by miR-1 (Figure 3—figure supplement 1E, Supplementary file 1g). Mutating both miR-1 binding sites (BS1,2: MUT2), however, de-repressed VHA-13 levels in the isthmus in the WT background (Figure 3G). In double mutants containing both mir-1(gk276) and vha-13 BS1,2 mutations, no clear regulation of vha-13 expression was observed compared to the BS1,2 mutations alone (Figure 3G), suggesting that miR-1 modulates pharyngeal vha-13 expression through both potential miR-1 binding sites.
We next sought to characterize vha-13 regulation in the body wall muscle. However, it was not possible to accurately measure expression in this tissue using the 3xFlag::mNeonGreen::vha-13 strain due to the high expression levels in the adjacent hypodermis and gut. We therefore generated transgenic worms expressing Flag-tagged vha-13 containing its endogenous 3′UTR (3xFlag::vha-13::vha-13 3′UTR) under control of the muscle-specific myo-3 promoter. Consistent with results seen in pharyngeal muscle, vha-13 protein levels in the body wall muscle were also upregulated in mir-1 mutants compared to WT, as measured by western blots (Figure 3H, I). Exchanging the vha-13 3′UTR with the unc-54 3′UTR lacking miR-1 binding sites (vha-13::unc-54 3′UTR) blunted regulation by miR-1 (Figure 3F, I), indicating that vha-13 is repressed by miR-1 via its 3′UTR in both body wall and pharyngeal muscle.
Since mir-1 mutation resulted in vha-13 upregulation, we asked whether vha-13 overexpression was sufficient to yield phenotypes similar to mir-1 mutants. In accord with this idea, overexpressing vha-13 in the muscle of Q35 worms significantly reduced aggregate number, improved motility, and enhanced pharyngeal pumping ability (Figure 3J–L, Figure 3—figure supplement 1F, Supplementary file 1b). It also significantly increased the life span of Q35 animals compared to non-transgenic controls in two out of five experiments (Figure 3—figure supplement 1G, Supplementary file 1a). Altogether these data suggest that miR-1 and VHA-13 work in the same regulatory pathway to influence muscle physiology.
Since the regulation of vha-13 by miR-1 was robust and functionally relevant in C. elegans, we wondered whether this regulation may be evolutionarily conserved. We analyzed v-ATPase expression in transcriptome data from previously published muscle-specific miR-1/miR-133a double knockout mice (Wüst et al., 2018) and miR-1-1/miR-1-2 double knockout mice (Wei et al., 2014). In muscle-specific miR-1/133a double knockout mice, Atp6v1a/vha-13 and Atp6v1h/vha-15 are significantly upregulated by 2.6-fold and 2.1-fold, respectively (Figure 3—figure supplement 1H). In miR-1-1/miR-1-2 double knockout mice, Atp6v1a/vha-13 is significantly upregulated by 1.49-fold (Figure 3—figure supplement 1I). These findings suggest that miR-1-dependent regulation of vha-13/Atp6v1a may be conserved during evolution.
miR-1 affects lysosomal biogenesis
As the v-ATPase is an integral component of the lysosome, we asked whether miR-1 generally affects lysosomal structure and function. To test this idea, we first used a lmp-1p::lmp-1::gfp reporter strain. LMP-1 protein localizes to the membrane of lysosomes and is a marker for lysosomal biogenesis (Hermann et al., 2005). LMP-1 protein levels were significantly increased in mir-1 mutants compared to WT control, as measured by western blot analysis (Figure 4C, D). The v-ATPase hydrolyzes ATP to pump protons across the membrane, resulting in acidification of the lysosome lumen (Beyenbach and Wieczorek, 2006). We therefore asked whether mir-1 mutants affect the number of acidified lysosomes. Using Lysotracker Red, a dye that targets acidic membranous structures such as lysosomes (Chazotte, 2011), we observed an increase in the number of acidified puncta in mir-1 mutants at day 4 of adulthood (Figure 4E, F). Due to technical limitations, lysotracker staining could only be observed in the worm intestine. This result leaves open the question as to whether lysosomes are also regulated in the muscle and whether mir-1, being expressed in muscle tissue, might have a cell non-autonomous effect. Nonetheless, the overall increase in lysosome biogenesis is consistent with the upregulation of lysosomal components, such as the v-ATPase subunits, and a possible cause of miR-1-dependent regulation of proteostasis.
Discussion
Striated muscle is one of the most highly ordered tissues in the body, with molecular components organized in a lattice of contractile elements and attachments. This molecular apparatus is exposed to high energy and force during contraction, inflicting molecular damage requiring constant repair. Further, muscle is subject to growth, metabolic, and stress signaling pathways as well as neural inputs that also promote remodeling. Underlying muscle plasticity is the fine-tuned control of proteostasis, including protein synthesis, folding, trafficking, and turnover, which must be precisely orchestrated to maintain muscle structure and function (Demontis et al., 2013). A decline in these processes during aging leads to diminished muscle performance and frailty, yet it remains elusive how various aspects of muscle proteostasis are coordinated.
In this work, we discovered that the muscle-enriched microRNA miR-1 plays an important role in regulating muscle homeostasis via vacuolar ATPase function. Loss of mir-1 ameliorates age-related decline in motility induced by models of aggregate-prone polyQ35. By inference, mir-1 normally limits the proteoprotective effect in the polyQ35 model. Computational and proteomic screens identified v-ATPase subunits as highly enriched targets of miR-1 regulation, suggestive of coordinate regulation, and whose downregulation reduced polyQ35 proteoprotection. Expression studies confirmed that several subunits (e.g., vha-5, vha-10, vha-13, vha-19) showed miR-1-dependent regulation. In particular, we demonstrated that vha-13 expression is downregulated by miR-1 in muscle tissues via two distinct binding sites in its 3′UTR. Moreover, VHA-13 links miR-1 with muscle homeostasis since vha-13 downregulation abolished the improved mid-life motility, pharyngeal pumping, and life span of mir-1;Q35 strains, while vha-13 overexpression was sufficient to enhance these properties, similar to mir-1 mutation. In accord with our findings, immunoprecipitation and sequencing of microRNA complexes revealed a number of v-ATPase subunit mRNAs, including vha-13, vha-4, vha-10, and vha-17 as physically associated with C. elegans miR-1 (Grosswendt et al., 2014). Interestingly, mammalian homolog of VHA-13, ATP6V1A, as well as several other v-ATPase subunits, harbor predicted miR-1 binding sites (Stark et al., 2005). Transcriptome data from mice indicate that Atp6v1a is upregulated upon miR-1-1/miR-1–2 deletion or miR-1/miR-133a deletion (Wei et al., 2014; Wüst et al., 2018). These findings complement our results in C. elegans and suggest that the miR-1-ATP6V1A regulatory module could be conserved in evolution.
The v-ATPase is a multisubunit enzyme that acidifies the endolysosomal lumen to control a plethora of cellular activities. Acidification regulates protein trafficking, endocytic recycling, synaptic vesicle loading, and autophagy, as well as the activity of multiple acid hydrolases and nutrient and ion transporters. Moreover, the v-ATPase itself serves as a docking site for regulating mTOR and AMPK complexes and affects metabolism (Settembre et al., 2013; Zhang et al., 2014). Our studies highlight the importance of v-ATPase activity to muscle performance. A handful of studies ascribe a role for the v-ATPase in muscle. In mammalian cardiomyocytes, lipid loading inhibits the v-ATPase, leading to a decline in contractile function that could contribute to muscle deficits in diabetes (Wang et al., 2020). Lesions in VMA21 that disrupt v-ATPase assembly have also been shown to cause myopathies (Dowling et al., 2015). Conceivably the v-ATPase could play an important role in protein turnover and remodeling of muscle structure but could also impact muscle homeostasis through metabolic wiring or protein trafficking.
Surprisingly we also found that some mir-1 phenotypes were not strictly limited to muscle since we observed a global increase in levels of lysosomal LMP-1::GFP in western blots, increased lysosomal acidification in the intestine, as well as enhanced nuclear localization of HLH-30/TFEB in the hypodermis. Given that mir-1 is muscle-expressed, this observation could suggest cell non-autonomous regulation of lysosomal biogenesis and associated activities by miR-1, acting either directly or indirectly. Conceivably, miR-1 is secreted from muscle to affect physiology in other tissues. In mammals, miR-1 has been identified as a circulating microRNA found in serum exosomes upon exercise stress or cardiac infarction, suggesting that it could act systemically (Cheng et al., 2019; D’Souza et al., 2018). In this light, it is intriguing that the v-ATPase itself is implicated in exosomal activity (Liégeois et al., 2006). Alternately, miR-1 could act indirectly through production of a myokine that affects distal tissues.
miR-1 has been implicated in regulating a number of targets and physiologic processes. In mammals, miR-1 and its homolog miR-133 are essential to cardiac development and function, where they have been shown to regulate Notch ligand Dll1, the GTPase dynamin 2 (DNM2), Frizzled-7 (FZD7), and fibroblast growth factor receptor substrate 2 (FRS2) as targets (Ivey et al., 2008; Liu et al., 2011; Mitchelson and Qin, 2015). Surprisingly knockout of mammalian mir1/mir133 specifically in muscle has little overt effect on muscle structure, but rather regulates the developmental transition from glycolytic to oxidative metabolism via the Mef2/Dlk1-Dio3 axis, affecting running endurance (Wüst et al., 2018). Similarly, C. elegans miR-1 regulates mef-2, in this case affecting retrograde signaling at the neuromuscular junction (Simon et al., 2008). We also observed that animals lacking mir-1 have little overt change in muscle structure or function alone, though we saw upregulation of a number of muscle proteins and downregulation of mitochondrial proteins in our proteomic analysis. Indeed, most microRNA knockouts do not lead to observable phenotypes in C. elegans (Miska et al., 2007), suggesting that microRNAs often work redundantly or in response to stress to fine-tune gene expression.
We identified mir-1 as a suppressor of the muscle-specific polyQ35 proteotoxicity model, reducing protein aggregation and having beneficial effects on late-life motility, pumping rates (day 8 of adulthood), and life span. Recently, Pocock and colleagues reported that miR-1 downregulates the Rab GTPase TBC-7/TBC1D15, thereby promoting autophagic flux in worms and human cells (Nehammer et al., 2019). In C. elegans, they observed that mir-1(+) ameliorates polyQ40 proteotoxicity, seemingly contradicting our results. We found mir-1 deletion to reduce aggregate numbers in polyQ35, polyQ40, and α-syn models, while effects on motility varied among the three models. The relationship between aggregation and cellular toxicity remains controversial, and the uncoupling of aggregation and toxicity is observed in various disease models. Mammalian studies suggest context-dependent mir-1 effects, where mir-1 either promotes or inhibits autophagy (Ejlerskov et al., 2020; Hua et al., 2018; Xu et al., 2020). Whether miR-1 is proteoprotective or limits proteoprotection in C. elegans could hinge on many factors. Because microRNAs generally fine-tune regulation and often work in feedback circuits, their impact on physiology can be subtle, and small differences in culture conditions, genetic background, metabolic state, and aggregation onset during development or aging could give rise to divergent outcomes.
Among the putative miR-1 targets that we identified in C. elegans are the pro-longevity transcription factors DAF-16/FOXO and HLH-30/TFEB, which regulate lysosome biogenesis, proteostasis, and metabolism, and act in insulin/IGF and mTOR signaling pathways (Lin et al., 2018; O'Rourke and Ruvkun, 2013; Settembre et al., 2011). mir-1 mutation led to an upregulation of their mRNA during adulthood and enhanced nuclear localization of HLH-30. Further RNAi knockdown of these factors modestly diminished the motility improvement of mir-1 mutants in the circle test, consistent with roles in a miR-1 signaling pathway. Whether these transcription factors are direct targets of miR-1 regulation remains to be seen. Notably, miR-1-predicted targets also include pro-aging components of mTOR signaling such as let-363/mTOR and raga-1/RagA (targetscan.org), which also regulate the activity or localization of these transcription factors. Hence, the balance or timing of pro- and anti-aging factors could also differentially influence the physiological phenotype at a systemic level. Interestingly, VHA-13/ATP6V1A subunit has been shown to regulate mTOR lysosomal recruitment and activity (Chung et al., 2019) and mTOR signaling regulates the activity of TFEB at the lysosomal surface (Settembre et al., 2013). Upregulation of v-ATPase activity is also associated with the clearance of oxidized protein and rejuvenation of the C. elegans germline (Bohnert and Kenyon, 2017). Thus, in the future it will be interesting to further unravel the miR-1 molecular circuitry surrounding lysosomal function and proteostasis, and see whether miR-1 similarly regulates v-ATPase function in humans.
Materials and methods
Key resources table
| Reagent type (species) or resource | Designation | Source or reference | Identifiers | Additional information |
|---|---|---|---|---|
| Gene (Caenorhabditis elegans) | mir-1 | WormBase | WBGene00003260 | |
| Gene (Caenorhabditis elegans) | vha-13 | WormBase | WBGene00013025 | |
| Gene (Caenorhabditis elegans) | vha-5 | WormBase | WBGene00006914 | |
| Gene (Caenorhabditis elegans) | hlh-30 | WormBase | WBGene00020930 | |
| Gene (Caenorhabditis elegans) | daf-16 | WormBase | WBGene00000912 | |
| Strain, strain background (Caenorhabditis elegans) | N2 Bristol | CGC | N2 Bristol RRID:WB-STRAIN:WBStrain00000001 | N2 WT |
| Strain, strain background (Caenorhabditis elegans) | mir-1(gk276) I | This paper | AA2508 RRID:WB-STRAIN:WBStrain00035886 | |
| Strain, strain background (Caenorhabditis elegans) | mir-1(dh1111) I | This paper | AA4575 | |
| Strain, strain background (Caenorhabditis elegans) | rmIs132[unc-54p::Q35::YFP] I | CGC | AM140 RRID:WB-STRAIN:WBStrain00000182 | N2;Q35 |
| Strain, strain background (Caenorhabditis elegans) | mir-1(gk276); rmIs132[unc-54p::Q35::YFP] I | This paper | AA4403 | gk276;Q35 |
| Strain, strain background (Caenorhabditis elegans) | mir-1(dh1111) rmIs132[unc-54p::Q35::YFP] I | This paper | AA4577 | dh1111;Q35 |
| Strain, strain background (Caenorhabditis elegans) | N2; dhEx965[mir-1p::mir-1, myo-2p::mCherry] | This paper | AA3275 | mir-1 transgene |
| Strain, strain background (Caenorhabditis elegans) | mir-1(gk276) I; rmIs132[unc-54p::Q35::YFP]; dhEx965[mir-1p::mir-1, myo-2p::mCherry] | This paper | AA4810 | |
| Strain, strain background (Caenorhabditis elegans) | N2; dhEx1206[myo3p::flag::HA::mCherry::vha-13cDNA::unc-54 3′UTR, myo-2p::GFP] | This paper | AA4865 | myo3p::vha-13::unc-54 3′UTR |
| Strain, strain background (Caenorhabditis elegans) | mir-1(gk276) I; dhEx1206[myo-3p::flag::HA::mCherry::vha-13cDNA::unc-54 3′UTR, myo-2p::GFP] | This paper | AA4866 | |
| Strain, strain background (Caenorhabditis elegans) | N2; dhEx1207[myo-3p::flag::HA::mCherry::vha-13cDNA::vha-13 3′UTR, myo-2p::GFP] | This paper | AA5067 | myo-3p::vha-13 wt 3′UTR |
| Strain, strain background (Caenorhabditis elegans) | mir-1(gk276) I; dhEx1207[myo-3p::flag::HA::mCherry::vha-13cDNA::vha-13 3′UTR, myo-2p::GFP] | This paper | AA5068 | |
| Strain, strain background (Caenorhabditis elegans) | vha-13(syb586[3xFlag::mNeonGreen::vha-13]) V | SunyBiotech | PHX586 | vha-13 wt 3′UTR |
| Strain, strain background (Caenorhabditis elegans) | mir-1(gk276) I; vha-13(syb586[3xFlag::mNeonGreen::vha-13]) V | This paper | AA4813 | |
| Strain, strain background (Caenorhabditis elegans) | vha-13(syb586[3xFlag::mNeonGreen::vha-13]) V; dhEx965[mir-1p::mir-1, myo-2p::mCherry] | This paper | AA4850 | vha-13 wt 3′UTR + mir-1 transgene |
| Strain, strain background (Caenorhabditis elegans) | vha-13(syb587,syb504[3xFlag::mNeonGreen::vha-13 miR-1 BS1 mutated]) V | SunyBiotech | PHX587 | vha-13 MUT1 3′UTR One miR-1 BS mutated |
| Strain, strain background (Caenorhabditis elegans) | mir-1(gk276) I; vha-13(syb587,syb504[3xFlag::mNeonGreen::vha-13 miR-1 BS1 mutated]) V | This paper | AA4184 | |
| Strain, strain background (Caenorhabditis elegans) | vha-13(syb2180,syb587,syb504[3xFlag::mNeonGreen::vha-13 miR-1 BS1,2 mutated]) V | SunyBiotech | PHX2180 | vha-13 MUT2 3′UTR Two miR-1 BSs mutated |
| Strain, strain background (Caenorhabditis elegans) | mir-1(gk276) I; vha-13(syb2180,syb587,syb504[3xFlag::mNeonGreen::vha-13 miR-1 BS,2 mutated]) V | This paper | AA5123 | |
| Strain, strain background (Caenorhabditis elegans) | vha-5(syb1093[3xFlag::mNeonGreen::vha-5]) IV | SunyBiotech | PHX1093 | |
| Strain, strain background (Caenorhabditis elegans) | mir-1(gk276) I; vha-5(syb1093[3xFlag::mNeonGreen::vha-5]) IV | This paper | AA5069 | |
| Strain, strain background (Caenorhabditis elegans) | hlh-30(syb809[hlh-30::mNeonGreen]) IV | SunyBiotech | PHX809 | |
| Strain, strain background (Caenorhabditis elegans) | mir-1(gk276) I; hlh-30(syb809[hlh-30::mNeonGreen]) IV | This paper | AA5195 | |
| Strain, strain background (Caenorhabditis elegans) | rmIs133[P(unc-54) Q40::YFP] | CGC | AM141 RRID:WB-STRAIN:WBStrain00000183 | N2;Q40 |
| Strain, strain background (Caenorhabditis elegans) | mir-1(gk276) I; rmIs133[P(unc-54) Q40::YFP] | This paper | AA3112 | gk276;Q40 |
| Strain, strain background (Caenorhabditis elegans) | N2; pkIs2386[Punc-54::alphasynuclein::YFP + unc-119(+)] | This paper | AA1311 | |
| Strain, strain background (Caenorhabditis elegans) | mir-1(gk276) I; pkIs2386[Punc-54::alphasynuclein::YFP + unc-119(+)] | This paper | AA5270 | |
| Strain, strain background (Escherichia coli) | OP50 | CGC | ||
| Strain, strain background (Escherichia coli) | DH5α | Life Technologies | ||
| Other | RNAi | Source BioScience, C. elegans RNAi Collection – Ahringer | Multiple | Supplementary file 1e |
| Other | RNAi | Source BioScience, C. elegans ORF-RNAi Resource – Vidal | Multiple | Supplementary file 1e |
| Other | hlh-30 RNAi | Source BioScience, C. elegans RNAi Collection – Ahringer | W02C12.3 | hlh-30i |
| Other | daf-16 RNAi | Source BioScience, C. elegans RNAi Collection – Ahringer | R13H8.1 | daf-16i |
| Other | vha-13 RNAi | Source BioScience, C. elegans RNAi Collection – Ahringer | Y49A3A.2 | vha-13i |
| Other | vha-5 RNAi | Source BioScience, C. elegans RNAi Collection – Ahringer | F35H10.4 | vha-5i |
| Recombinant DNA reagent | Plasmid L3781 | FireLab | Worm Expression vector | |
| Recombinant DNA reagent | Plasmid pDEST R4-R3 | Invitrogen | MultiSite Gateway destination vector | |
| Recombinant DNA reagent | Plasmid myo3p::flag::HA::mCherry::vha-13cDNA::unc-54 3′UTR | This paper | BA4331 | Vector pDEST R4-R3 |
| Recombinant DNA reagent | Plasmid myo3p::flag::HA::mCherry::vha-13cDNA::vha-13 3′UTR | This paper | BA4334 | Vector pDEST R4-R3 |
| Recombinant DNA reagent | Plasmid pPD122.11 | FireLab | Worm Expression vector | |
| Sequence-based reagent | Primer | This paper | Supplementary file 1h | |
| Commercial assay, kit | TaqMan assay for mir-1 | Life Technologies | Assay ID 000385 | |
| Antibody | Anti-GFP (mouse monoclonal) | Living Colors | JL-8 RRID:AB_10013427 | 1:2000 |
| Antibody | Anti-Histone H3 (rabbit polyclonal) | Abcam | ab1791 RRID:AB_302613 | 1:5000 |
| Antibody | Anti-α-Tubulin (mouse monoclonal) | Sigma | T6199 RRID:AB_477583 | 1:5000 |
| Antibody | Anti-FLAG (mouse monoclonal) | Sigma | F1804 RRID:AB_262044 | 1:2000 |
| Antibody | Anti-mouse IgG (goat polyclonal coupled with horseradish peroxidase) | Invitrogen | G-21040 RRID:AB_2536527 | 1:5000 |
| Antibody | Anti-rabbit IgG (goat polyclonal coupled with horseradish peroxidase) | Invitrogen | G-21234 RRID:AB_2536530 | 1:5000 |
| Chemical compound, drug | LysoTracker Red | Life Technologies | LysoTracker Red DND-99 |
C. elegans strains and culture
Request a detailed protocolC. elegans strains were maintained at 20°C on nematode growth medium (NGM) plates seeded with a lawn of Escherichia coli strain OP50, unless noted otherwise. Strains are listed in the Key resources table.
Molecular cloning
Request a detailed protocolAll restriction digest reactions were performed with enzymes provided by NEB according to the user's manual. T4 DNA Ligase (NEB) was used for ligation reactions. Chemically competent DH5α E. coli (Life Technologies) was used for transformation following the manufacturer’s instructions. QIAprep Miniprep or Midiprep Kits (Qiagen) were used for plasmid purification. Cloning was verified by PCR followed by gel electrophoresis and sequencing.
To make the rescuing mir-1 transgene, primer pair ‘celmir1fwd2/rvs2’ was used to insert the mir-1 coding region into vector L3781 downstream of gfp. The mir-1 promoter was then cloned 5' to gfp using the primer pair ‘m1p fwd/rvs’. To make muscle-expressed vha-13 constructs, the vha-13 cDNA was amplified with Kpn1 overhangs using primers vha-13 fwd/rvs and cloned into vector pDEST R4-R3 to give myo-3p::flag::HA::mCherry::vha-13cDNA::unc-54 3'UTR. The unc-54 3'UTR was excised with Not1/BglI and replaced with the vha-13 3'UTR using primers vha-13U fwd/rvs to generate myo-3p::flag::HA::mCherry::vha-13cDNA::vha-13 3'UTR. Primers and plasmids are listed in the Key resources table and Supplementary file 1h.
Generation of transgenic worm strains
Request a detailed protocolTransgenic worms containing extrachromosomal arrays were generated by microinjection. To generate the myo-3p::flag::HA::mCherry::vha-13cDNA::unc-54 3'UTR strain, a mix of myo-3p::flag::HA::mCherry::vha-13cDNA::unc-54 3'UTR DNA (40 ng/ μl), myo-2p::gfp co-transformation marker (5 ng/ μl plasmid pPD122.11), and fill DNA (TOPO empty vector, 55 ng/μl) was injected into young N2 adults using an Axio Imager Z1 microscope (Zeiss) with a manual micromanipulator (Narishige) connected to a microinjector (FemtoJet 4x, Eppendorf). We obtained the strain AA4865: N2; dhEx1206[myo-3p::flag::HA::mCherry::vha-13cDNA::unc-54 3'UTR, myo-2p::gfp], which was then used to cross the transgene into other genetic backgrounds. A similar strategy was used to create AA5067, N2; dhEx1207[myo-3p::flag::HA::mCherry::vha-13cDNA::vha-13 3'UTR, myo-2p::GFP].
The mir-1 transgene strain was generated by injection mix containing mir-1p::mir-1 plasmid, myo-2p::mCherry co-transformation marker (5 ng/μl plasmid pPD122.11) and fill DNA (L3781 empty vector). The resultant strain AA3275 (N2; dhEx965[mir-1p::mir-1, myo-2p::mCherry]) was then used to cross the dhEx965 transgene to mir-1(gk276); rmIs132[p(unc-54) Q35::YFP] to give mir-1(gk276); rmIs132[p(unc-54) Q35::YFP]; dhEx965[mir-1p::mir-1, myo-2p::mCherry], AA4810. For transgenic worm strains, non-transgenic worms of the same strain were used as controls.
The mir-1 deletion allele dh1111 was generated using CRISPR/Cas9 mutagenesis. We designed CRISPR guides using the EnGen sgRNA Designer (https://sgrna.neb.com/#!/sgrna), synthesized guides with the Engen sgRNA synthesis kit and analyzed them by gel electrophoresis and tape station. We injected worms with an injection mix containing Cas9 EnGen (NEB), four sgRNAs against mir-1 (AAGAAGTATGTAGAACGGGG, GTAAAGAAGTATGTAGAACG, TATAGAGTAGAATTGAATCT, ATATAGAGTAGAATTGAATC), one sgRNA against dpy-10 (CGCTACCATAGGCACCACG), KCl, HEPES pH 7.4, and water. Prior to injection we incubated the mixture for 10 min at 37°C to allow activation of Cas9. Following injection, we singled out worms with Dpy and Rol phenotypes in the F1 generation and genotyped them for mir-1 deletion using mir-1 genotyping primers in the F2 (Supplementary file 1h). We sequenced the PCR products of candidate worms with Sanger sequencing and verified that the deletions resulted in loss of mir-1 expression using TaqMan-based quantification of mature miRNA levels.
Endogenous fluorescently tagged strains were generated by tagging vha-5 or vha-13 with 3xFlag-mNeonGreen tag at the N-terminus using CRISPR–Cas9 (SunyBiotech). The vha-13 3'UTR mutants BS1 and BS2 were generated using CRISPR–Cas9 by further mutating one or both putative miR-1 binding sites in the 3'UTR of the endogenous FLAG-mNeonGreen-tagged vha-13 gene (SunyBiotech). PHX809 hlh-30::mNeonGreen endogenously tagged hlh-30 was generated by placing mNeonGreen at the C-terminus using CRISPR–Cas9 (SunyBiotech).
Determination of progeny number
Request a detailed protocolSingle worms were maintained on an NGM agar plate and transferred every day until the reproductive period was complete. The number of F1 progeny per individual worm was counted at the L4 or young adult stage. Experiments were repeated at least three times.
Quantitation of polyQ and α-synuclein aggregates
Request a detailed protocolWhole-worm images of day 4 adults (Q34), L4s (Q40), or day 1 adults (α-synuclein) were taken with an Axiocam 506 mono (Zeiss) camera using the 5×, 10×, or 20× objective of a Zeiss Axio Imager Z1 microscope at defined exposure time (Q35: 20 ms, Q40: 10 ms, α-synuclein: 10 ms). Aggregate numbers were evaluated from the photos. Due to the smaller size and relatively lower number of aggregates in the α-synuclein model, a maximum intensity projection was created from a Z-stack of the head region and aggregates present from the nose tip to the posterior bulb were counted. Genotypes of the samples were blinded during the counting. Aggregates were defined as discrete structures or puncta above background.
Motility, thrashing, and pumping behavior
Request a detailed protocolTo analyze worm motility by the circle test, 20–25 worms of defined age (day 3 to day 14 of adulthood) were placed in the center of a 6 cm agar plate with bacteria, marked with 1 cm circle on the bottom. After a defined time period (1 or 30 min), the number of worms that left the circle was counted. To determine thrashing rate, individual worms were transferred to M9 buffer and the number of body bends in a 20–60 s interval was scored. Pharyngeal pumping rates were measured by counting grinder contraction in the terminal bulb in 20–30 s intervals. Genotypes were blinded during the experiments.
CeleST assay
Request a detailed protocolThe C. elegans Swim Test (CeleST) assay was used to assess animal motility while swimming; assays were conducted as described previously (Ibáñez-Ventoso et al., 2016; Restif et al., 2014). Four or five animals were picked and placed into the swimming arena, which was a 50 μl aliquot of M9 buffer inside a 10 mm pre-printed ring on the surface of a glass microscope slide (Thermo Fisher Scientific). Images of the animals within the swim arena were acquired with a LEICA MDG41 microscope at 1× magnification with a Leica DFC3000G camera. Image sequences of 30 s in duration were captured at a rate of ~16 frames per second. The established CeleST software was used to process the image sequences and extract eight measures that are descriptive of C. elegans swim motility. As not all images in a sequence are always successfully processed by the CeleST software, animals for which fewer than 80% of frames were valid were excluded from the analysis. For each measure, single measurements that did not fit within the range of normally observed values were deemed outliers and also excluded from the analysis. Unpaired Student’s t-test was used to test for statistical significance between two strains at adult days 4 and 8.
Life span and heat stress experiments
Request a detailed protocolLife span experiments were performed as described (Gerisch et al., 2007). Day 0 corresponds to the L4 stage. Life spans were determined by scoring a population of 100–120 worms per genotype every day or every other day. Worms that exploded, had internal hatch, or left the plate were censored. Heat stress experiments were performed at 35°C (Gerisch et al., 2007). Day 1 adult worms were transferred onto pre-heated (35°C) plates 6 cm plates seeded with OP50. Worms were kept at 35°C and scored every hour for live versus dead. Experiments were repeated at least three times. Data were analyzed with Microsoft Excel and GraphPad Prism Software. p values were calculated using the Log-rank (Mantel–Cox) test to compare two independent populations.
RNAi treatment
Request a detailed protocolWorms were grown from L4 onwards unless mentioned otherwise on E. coli HT115 (DE3) bacteria expressing dsRNA of the target gene under the control of an IPTG-inducible promoter. RNAi colonies were grown overnight at 37°C in Luria Broth with 50 μg/ml ampicillin and 10 μg/ml tetracycline. The cultures were spun down at 4000 rpm at 4°C for 10 min. 500 μl of onefold concentrated culture was seeded onto NGM plates containing 1 M isopropyl β-D-1-thiogalactopyranoside (IPTG) to induce dsRNA expression. RNAi clones were selected from the Ahringer or Vidal library (Kamath and Ahringer, 2003; Rual et al., 2004). Clone identity was confirmed by sequencing.
RNAi screen for mir-1 suppressors
Request a detailed protocolmir-1(gk276);Q35 worms were grown from L4 on RNAi of the candidates identified in the bioinformatic or proteomic screen. Worms were maintained in the presence of FUDR (40 μM 5-fluoro-2′-deoxyuridine, Sigma) until day 8 of adulthood. The circle test was performed as described above. The number of worms that left the circle was determined after 1 min. Selected candidates identified in the circle test were examined in the body bending assay (see above). The effect of selected candidate RNAi clones was additionally tested on polyQ35 in the WT background as counter screen. For this experiment, worms were grown until day 5 of adulthood. Motility assays were performed on day 5 of adulthood because Q35 WT worms were less motile than the mir-1(gk276);Q35 and were largely paralyzed by day 8.
RNA extraction and real-time qPCR analysis
Request a detailed protocolWorm populations (ca. 500 animals) were harvested on day 4 of adulthood and washed twice in cold M9. Worm pellets were taken up in 700 μl QIAzol reagent (Qiagen) and snap frozen in liquid nitrogen. Samples were subjected to four freeze/thaw cycles and homogenized with 1.0 mm zirconia/silica beads (Fisher Scientific) in a Tissue Lyser LT (Qiagen) for 15 min at full speed. After homogenization, 600 µl supernatant was transferred to fresh tubes and 120 μl chloroform were added to each tube. Components were mixed by vortexing and incubated for 2 min at room temperature. After 15 min centrifugation at 12,000 g 4°C, the aqueous phase was collected for total RNA extraction using the RNeasy or miRNeasy Mini Kit (Qiagen) according to the manufacturer’s instructions. RNA quantity and quality were determined on a NanoDrop 2000c (PeqLab RRID:SCR_020309) and cDNA was prepared using the iScript cDNA Synthesis Kit (BioRad). To quantify RNA expression, we used the Power SYBR Green Master Mix (Applied Biosystems) on a ViiA 7 Real-Time PCR system (Applied Biosystems). Four technical replicates were pipetted on a 384-well plate using the JANUS automated workstation (PerkinElmer). Expression of target RNA was calculated from comparative CT values, normalized to ama-1 or cdc-42 as internal controls using the corresponding ViiA7 software. All unpublished primers were validated by determination of their standard curves and melting properties. For quantification of mir-1, we used TaqMan probes from Life Technologies/Thermo Fisher Scientific (Assay ID 000385) and normalized to expression of U18 as measured by TaqMan probes from Life Technologies/Thermo Fisher Scientific (Assay ID 001764). We used N = 4 independent biological replicates, and four technical replicates for every biological sample (for primers, refer to Supplementary file 1h).
Western blot analysis
Request a detailed protocolFor western blot analysis, synchronized young adult or gravid day 1 adult worms were picked into Eppendorf tubes containing M9, snap frozen in liquid nitrogen, and lysed in 4× SDS sample buffer (Thermo Fisher) containing 50 mM DTT. After boiling and sonication, equal volumes were subjected to reducing SDS-PAGE and transferred to nitrocellulose membranes. The membranes were then blocked for 2 hr at room temperature in 5% milk in Tris-buffered Saline and Tween20 (TBST) and probed with the primary antibodies in TBST with 5% milk overnight at 4°C. Specific secondary antibodies (mouse or rabbit) were used at a concentration of 1:5000 in TBST with 5% milk at room temperature for 2 hr. The membranes were developed with Western Lightening Plus – Enhanced Chemiluminescence Substrate (PerkinElmer). Bands were detected on a ChemiDoc MP Imaging System (BioRad) and the intensity quantified using the corresponding Image Lab software (BioRad). Antibodies are listed in the Key resources table.
Proteomic analysis
Request a detailed protocolFor sample collection and preparation, day 1 N2 and mir-1(gk276) worms were synchronized by egg laying, and n ≥ 5000 worms per genotype were collected in M9. Samples were washed three times in M9 and directly frozen in liquid nitrogen and stored at –80°C. Five independent biological replicates of each genotype were collected for further analyses. For protein extraction, samples were thawed and boiled in lysis buffer (100 mM Tris-HCl, 6 M guanidinium chloride, 10 mM Tris(2-carboxyethyl)phosphine hydrochloride, 40 mM 2-chloroacetamide) for 10 min, lysed at high performance with a Bioruptor Plus sonicator (Diagenode) using 10 cycles of 30 s sonication intervals. The samples were then boiled again, centrifuged at 20,000 g for 20 min, and diluted 1:10 in 20 mM Tris pH 8.3/10% acetonitrile (ACN). Protein concentration was measured using BCA Protein Assays (Thermo Fisher). Samples were then digested overnight with rLys-C (Promega), the peptides were cleaned on a Supelco Visiprep SPE Vacuum Manifold (Sigma) using OASIS HLB Extraction cartridges (Waters). The columns were conditioned twice with methanol, equilibrated twice with 0.1% formic acid, loaded with the sample, washed three times with 0.1% formic acid, and the peptides eluted with 60% ACN/0.1% formic acid. The samples were dried at 30°C for roughly 4 hr in a Concentrator (Eppendorf) set for volatile aqueous substances. The dried peptides were taken up in 0.1% formic acid and the samples were analyzed by the Max Planck Proteomic Core facility. Mass spectrometry data acquisition, computational proteomic analysis, and differential expression analysis were performed as described (Tharyan et al., 2020). Upon inspection of the numbers of quantified proteins and the raw proteomic data, two replicates of N2 were excluded from further analysis. Proteomics data was deposited to the ProteomeXchange Consortium via the PRIDE partner repository (Perez-Riverol et al., 2019).
Microscopy and expression analysis
Request a detailed protocolFor confocal microscopy, vha-13, vha-5, and hlh-30 endogenously tagged with mNeonGreen were synchronized via egg and maintained at 25°C to induce mild stress. hlh-30 worms were imaged as L4s and day 4 adults, while vha-13 and vha-5 worms as L4s, because of high mNeonGreen background expression at day 4 adulthood. Worms were anesthetized with 40 μM sodium azide, mounted on slide with 2% agar pad, and imaged with a Leica TCS SP8 microscope equipped with HC PL APO CS2 63×/1.40 oil and white light laser. Images were analyzed using Photoshop or Fiji software. To quantitate acidic lysosomes, worms grown at 25°C were incubated 48 hr prior to imaging with 2 μM LysoTracker Red DND-99 (Life Technologies). Worms were imaged as day 4 adults as described above. The number of puncta in a predefined squared area in the intestine (approximately spanning the second to fourth gut cell) was counted.
Statistical analysis
Request a detailed protocolThe statistical tests performed in this study are indicated in the figure legends and in the Materials and methods. Data are represented as mean ± SEM or as individual data points, as stated in the figure legends. The number of replicates and animals for each experiment is enclosed in their respective figure legends.
Data availability
The mass spectrometry proteomics data have been deposited to the ProteomeXchange Consortium via the PRIDE partner repository (Perez-Riverol et al., 2019) with the dataset identifier PXD023544. All raw data underlying the figures are provided in the supplementary file.
-
ProteomeXchangeID PXD023544. Data from: miR-1 coordinately regulates lysosomal v-ATPase and biogenesis to impact proteotoxicity and muscle function during aging.
-
ArrayExpressID GEOD-17408. Metabolic maturation during muscle stem cell differentiation is achieved by miR-1/133a-mediated inhibition of the Dlk-Dio3 mega gene cluster.
-
NCBI Gene Expression OmnibusID GSE45760. Identification of dysregulated genes after deletion of miR-1-1 and miR-1-2.
References
-
The microRNA.org resource: targets and expressionNucleic Acids Research 36:D149–D153.https://doi.org/10.1093/nar/gkm995
-
The V-type H+ ATPase: molecular structure and function, physiological roles and regulationJournal of Experimental Biology 209:577–589.https://doi.org/10.1242/jeb.02014
-
Modeling polyglutamine pathogenesis in C. elegansMethods in Enzymology 412:256–282.https://doi.org/10.1016/S0076-6879(06)12016-9
-
Exercise promotes healthy aging of skeletal muscleCell Metabolism 23:1034–1047.https://doi.org/10.1016/j.cmet.2016.05.007
-
Labeling lysosomes in live cells with LysoTrackerCold Spring Harbor Protocols 2011:prot5571.https://doi.org/10.1101/pdb.prot5571
-
Covalent targeting of the vacuolar H+-ATPase activates autophagy via mTORC1 inhibitionNature Chemical Biology 15:776–785.https://doi.org/10.1038/s41589-019-0308-4
-
Mechanisms of skeletal muscle aging: insights from Drosophila and mammalian modelsDisease Models & Mechanisms 6:1339–1352.https://doi.org/10.1242/dmm.012559
-
Effects of exercise and aging on skeletal muscleCold Spring Harbor Perspectives in Medicine 8:a029785.https://doi.org/10.1101/cshperspect.a029785
-
X-linked myopathy with excessive autophagy: a failure of self-eatingActa Neuropathologica 129:383–390.https://doi.org/10.1007/s00401-015-1393-4
-
Circulatory exosomal miRNA following intense exercise is unrelated to muscle and plasma miRNA abundancesAmerican Journal of Physiology-Endocrinology and Metabolism 315:E723–E733.https://doi.org/10.1152/ajpendo.00138.2018
-
Genetic analysis of lysosomal trafficking in Caenorhabditis elegansMolecular Biology of the Cell 16:3273–3288.https://doi.org/10.1091/mbc.e05-01-0060
-
Automated analysis of C. elegans swim behavior using CeleST softwareJournal of Visualized Experiments 118:54359.https://doi.org/10.3791/54359
-
microRNAs as developmental regulatorsCold Spring Harbor Perspectives in Biology 7:a008144.https://doi.org/10.1101/cshperspect.a008144
-
A genome-wide map of conserved microRNA targets in C. elegansCurrent Biology 16:460–471.https://doi.org/10.1016/j.cub.2006.01.050
-
Mice lacking microRNA 133a develop dynamin 2–dependent centronuclear myopathyJournal of Clinical Investigation 121:3258–3268.https://doi.org/10.1172/JCI46267
-
Age-related changes in climbing behavior and neural circuit physiology in DrosophilaDevelopmental Neurobiology 67:778–791.https://doi.org/10.1002/dneu.20388
-
Roles of the canonical myomiRs miR-1, -133 and -206 in cell development and diseaseWorld Journal of Biological Chemistry 6:162–208.https://doi.org/10.4331/wjbc.v6.i3.162
-
Aging muscleThe American Journal of Clinical Nutrition 81:953–963.https://doi.org/10.1093/ajcn/81.5.953
-
MXL-3 and HLH-30 transcriptionally link lipolysis and autophagy to nutrient availabilityNature Cell Biology 15:668–676.https://doi.org/10.1038/ncb2741
-
miRmine: a database of human miRNA expression profilesBioinformatics 33:1554–1560.https://doi.org/10.1093/bioinformatics/btx019
-
The PRIDE database and related tools and resources in 2019: improving support for quantification dataNucleic Acids Research 47:D442–D450.https://doi.org/10.1093/nar/gky1106
-
TFEB links autophagy to lysosomal biogenesisScience 332:1429–1433.https://doi.org/10.1126/science.1204592
-
Signals from the lysosome: a control centre for cellular clearance and energy metabolismNature Reviews Molecular Cell Biology 14:283–296.https://doi.org/10.1038/nrm3565
-
STRING: a web-server to retrieve and display the repeatedly occurring neighbourhood of a geneNucleic Acids Research 28:3442–3444.https://doi.org/10.1093/nar/28.18.3442
-
Augmenting vacuolar H+-ATPase function prevents cardiomyocytes from Lipid-Overload induced dysfunctionInternational Journal of Molecular Sciences 21:1520.https://doi.org/10.3390/ijms21041520
-
The microRNA spectrum in 12 body fluidsClinical Chemistry 56:1733–1741.https://doi.org/10.1373/clinchem.2010.147405
-
MicroRNA‐1 facilitates hypoxia‐induced injury by targeting NOTCH3Journal of Cellular Biochemistry 121:4458–4469.https://doi.org/10.1002/jcb.29663
Article and author information
Author details
Martin Sebastian Denzel

Funding
Bundesministerium für Bildung und Forschung (0315893A)
- Adam Antebi
Deutscher Akademischer Austauschdienst (57518567)
- Adam Antebi
Max-Planck-Gesellschaft
- Adam Antebi
Fundação de Amparo à Pesquisa do Estado de São Paulo (2019/25958-9)
- Marcelo A Mori
Coordenação de Aperfeiçoamento de Pessoal de Nível Superior (88881.143924/2017-01)
- Marcelo A Mori
The funders had no role in study design, data collection and interpretation, or the decision to submit the work for publication.
Acknowledgements
AA would like to thank the MPI-AGE proteomics and imaging cores for services, the Caenorhabditis Genetics Center (CGC, University of Minnesota) for worm strains, the Bundesministerium für Bildung und Forschung for Sybacol funding, the Deutscher Akademischer Austauschdienst for funding, and the Max Planck Gesellschaft for core institutional support. MAM would like to thank Fundação de Amparo à Pesquisa do Estado de São Paulo (FAPESP) (grant number 2019/25958-9) and Coordenação de Aperfeiçoamento de Pessoal de Nível Superior CAPES (grant number 88881.143924/2017-01) for funding.
Copyright
© 2021, Schiffer et al.
This article is distributed under the terms of the Creative Commons Attribution License, which permits unrestricted use and redistribution provided that the original author and source are credited.
Metrics
-
- 2,178
- views
-
- 293
- downloads
-
- 16
- citations
Views, downloads and citations are aggregated across all versions of this paper published by eLife.
Citations by DOI
-
- 16
- citations for umbrella DOI https://doi.org/10.7554/eLife.66768
Download links
A two-part list of links to download the article, or parts of the article, in various formats.
Downloads (link to download the article as PDF)
Open citations (links to open the citations from this article in various online reference manager services)
Cite this article (links to download the citations from this article in formats compatible with various reference manager tools)
miR-1 coordinately regulates lysosomal v-ATPase and biogenesis to impact proteotoxicity and muscle function during aging
eLife 10:e66768.
https://doi.org/10.7554/eLife.66768


