Antimicrobials from a feline commensal bacterium inhibit skin infection by drug-resistant S. pseudintermedius
- Department of Dermatology, University of California, San Diego, United States
- College of Veterinary Medicine, University of Arizona, United States
- Department of Pharmacology, University of California, San Diego, United States
- Skaggs School of Pharmacy and Pharmaceutical Sciences, University of California, San Diego, United States
- Division of Biological Sciences, University of California, San Diego, United States
- Sydney School of Veterinary Science, University of Sydney, Australia
Figures
Figure 1 with 2 supplements
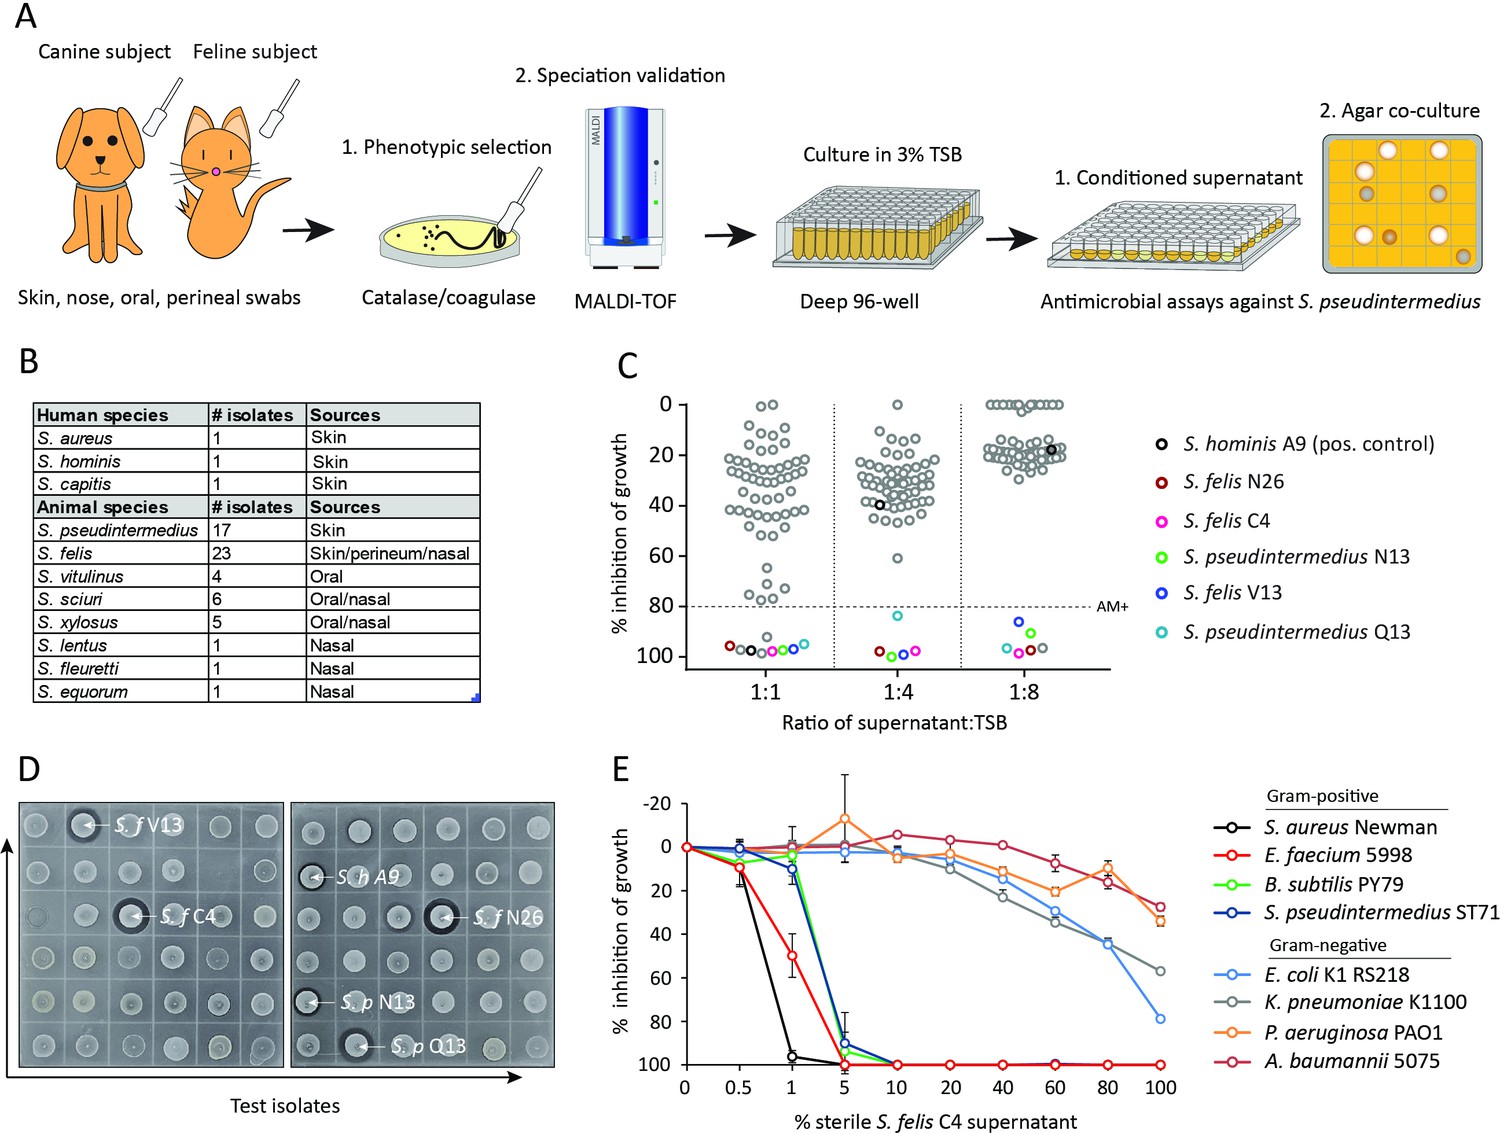
Screening and discovery of a feline skin commensal bacterium that inhibits drug-resistant gram-positive pathogens.
(A) Illustration of the selection and screening strategy of animal-derived staphylococci against the growth of methicillin-resistant S. pseudintermedius (MRSP) ST71 in liquid culture and agar co-culture assays. (B) The panel of 58 feline and canine isolates selected for antimicrobial testing, as well as human-derived S. hominis A9 and S. capitis E12 positive control antimicrobial strains and the non-antimicrobial S. aureus 113 negative control. (C) Inhibition of S. pseudintermedius ST71 growth by OD600, relative to TSB control at 100%, after 18 h incubation in 50%, 25%, or 12.5 % (1:1, 1:4, 1:8 ratio) sterile conditioned supernatant from all staphylococci isolates. Greater than 80 % inhibition of growth was considered antimicrobial (AM+). (D) Images of the agar co-culture assay showing zone of inhibition (black circle surrounding colony) produced by all staphylococci test isolates against S. pseudintermedius ST71, including S. felis C4, N26, V13 (S. f C4, S. f N26, S. f V13), S. pseudintermedius N13 and Q13 (S. p N13 and S. p Q13), and positive control S. hominis A9 (S. h A9, all indicated by arrows). (E) Inhibition of bacterial growth by OD600, normalized to TSB alone at 100%, against select gram-positive and gram-negative pathogens after 18 h incubation (48 h incubation for E. faecium) in the presence of increasing amounts of sterile conditioned supernatant from S. felis C4 overnight growth. Error bars indicate SEM. Representative of three separate experiments.
-
Figure 1—source data 1
Source data for Figure 1C (% growth of S.p ST71 in SN of animal isolates) and Figure 1E (% growth of gram positive and gram negative pathogens in S. felis C4 SN).
- https://cdn.elifesciences.org/articles/66793/elife-66793-fig1-data1-v2.xlsx
-
Figure 1—source data 2
Source data for Figure 1D (labeled and unlabeled images of the antimicrobial agar assay).
- https://cdn.elifesciences.org/articles/66793/elife-66793-fig1-data2-v2.zip
Figure 1—figure supplement 1
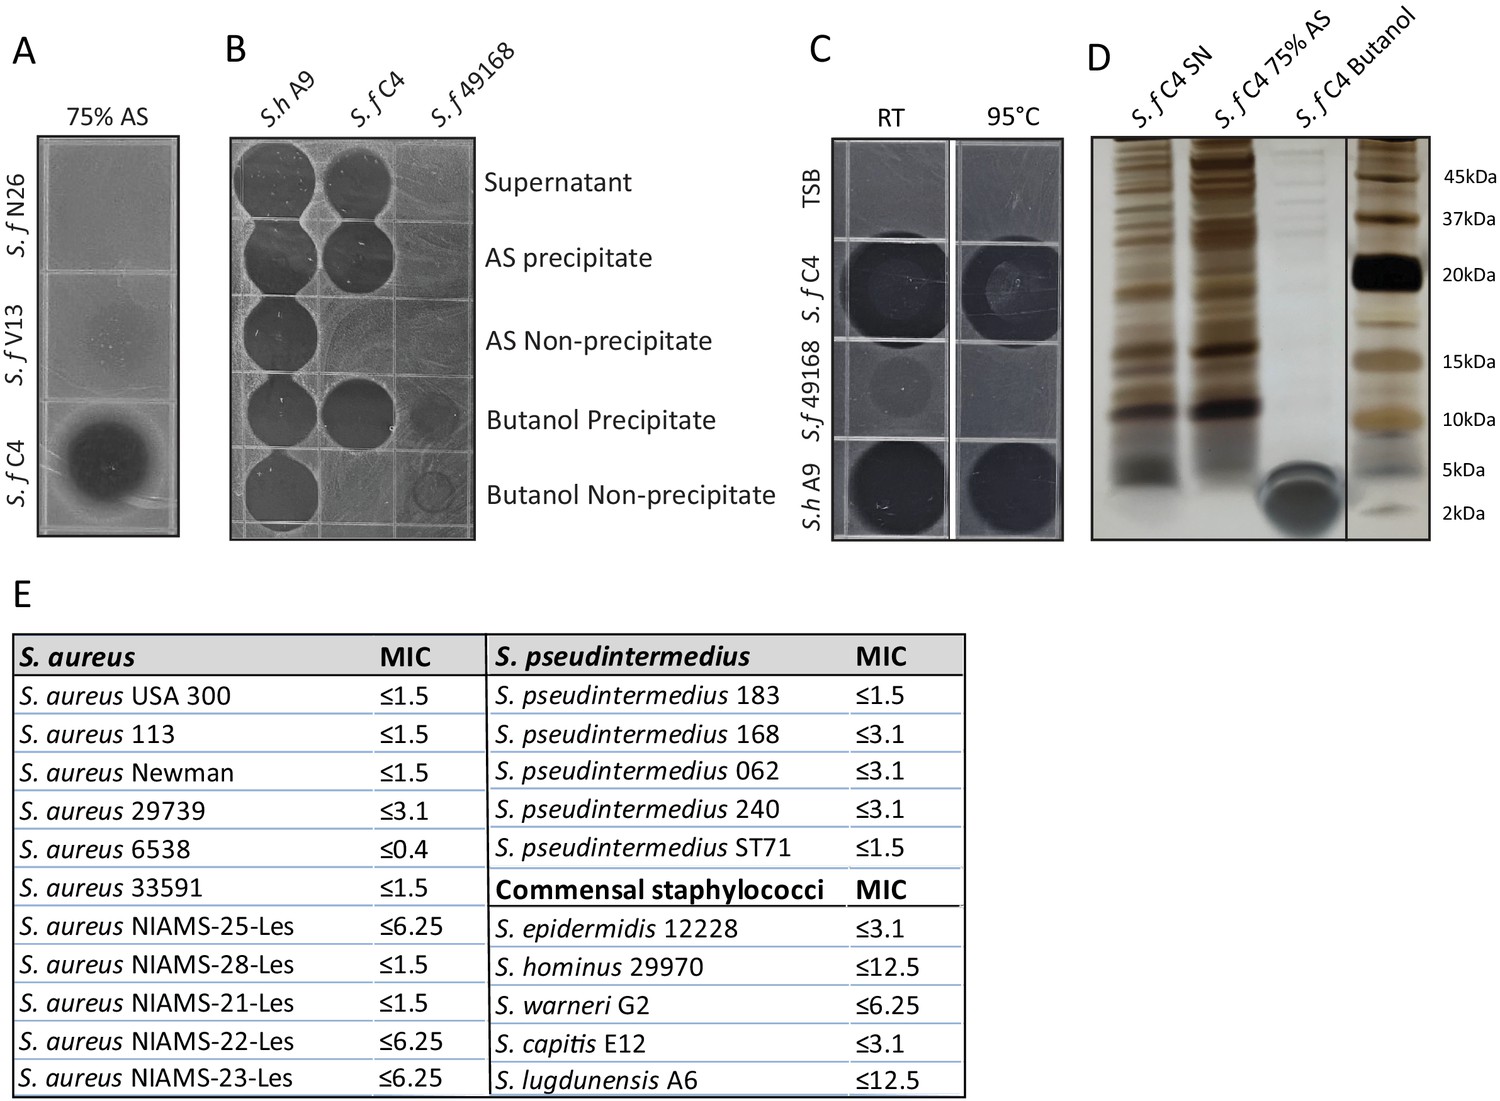
Generation of a partially purified antimicrobial extract from S. felis C4.
(A) Supernatant of indicated antimicrobial S. felis strains (S. f C4, N26, V13 were incubated with) were incubated with 75 % ammonium sulfate (AS) and the resulting precipitate was inoculated onto agar containing S. pseudintermedius ST71, to determine antimicrobial activity. (B) Supernatant of S. felis C4, positive-control S. hominis A9, or negative-control S. felis ATCC 49168 was extracted in 75 % AS or 25 % n-butanol and activity of the precipitate and non-precipitate fractions were assayed against S. pseudintermedius ST71. (C) Supernatant of S. felis C4 (S. f C4), S. hominis A9 (S. h A9), S. capitis E12 (S. c E12) or TSB alone, were maintained at room temperature (RT) for 1 week or boiled at 95 °C, for 30 min and activity determined by inoculation directly onto agar containing S. pseudintermedius ST71. (D) Total protein silver stain of S. felis C4 supernatant before precipitation or after precipitation in 75 % AS or 25 % butanol. (E) Minimum inhibitory concentration (MIC) table of the S. felis C4 extract against multiple isolates of S. aureus and S. pseudintermedius as well as several common commensal CoNS.
-
Figure 1—figure supplement 1—source data 1
Source data for Figure 1—figure supplement 1A (labeled and unlabeled images of the antimicrobial agar assay).
- https://cdn.elifesciences.org/articles/66793/elife-66793-fig1-figsupp1-data1-v2.zip
-
Figure 1—figure supplement 1—source data 2
Source data for Figure 1—figure supplement 1B (labeled and unlabeled images of the antimicrobial agar assay).
- https://cdn.elifesciences.org/articles/66793/elife-66793-fig1-figsupp1-data2-v2.zip
-
Figure 1—figure supplement 1—source data 3
Source data for Figure 1—figure supplement 1C (labeled and unlabeled images of the antimicrobial agar assay).
- https://cdn.elifesciences.org/articles/66793/elife-66793-fig1-figsupp1-data3-v2.zip
-
Figure 1—figure supplement 1—source data 4
Source data for Figure 1—figure supplement 1D (labeled and unlabeled images of the silver-stained bacterial protein before and after extraction).
- https://cdn.elifesciences.org/articles/66793/elife-66793-fig1-figsupp1-data4-v2.zip
Figure 1—figure supplement 2
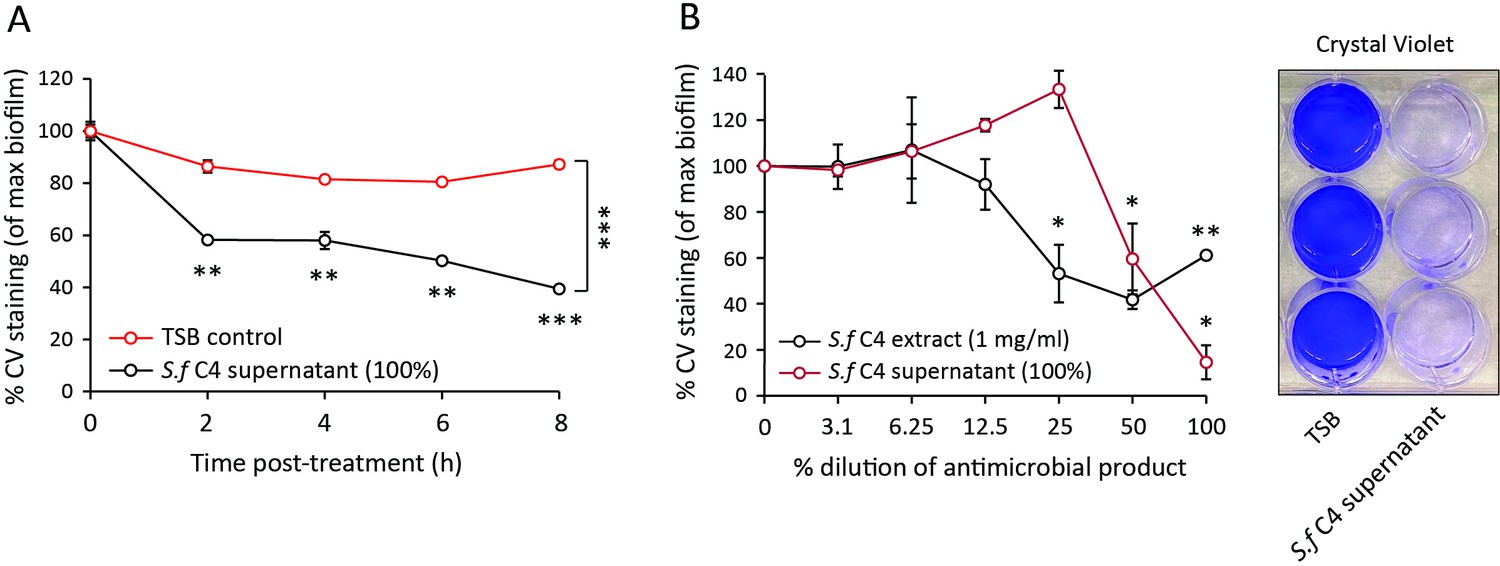
S. felis C4 supernatant and extract disrupt S. pseudintermedius biofilm.
(A) Decrease in crystal violet staining of a 4 h preformed S. pseudintermedius ST71 biofilm during 8 h incubation with 100% S. felis C4 sterile supernatant. (B) Decrease in crystal violet staining of a 4 h preformed S. pseudintermedius ST71 biofilm after 24 h incubation with serially diluted S. felis C4 sterile supernatant (100%) or S. felis C4 extract (1 mg/ml). Right inset is a representative image of crystal violet staining after incubation with 100% S. felis C4 supernatant. (A–B) Error bars indicate SEM. Representative of two separate experiments. A two-tailed, unpaired Student’s t test was performed. p values: *p < 0.05; **p < 0.01; ***p < 0.001.
-
Figure 1—figure supplement 2—source data 1
Source data for Figure 1—figure supplement 2A,B (raw values for the biofilm inhibition).
- https://cdn.elifesciences.org/articles/66793/elife-66793-fig1-figsupp2-data1-v2.xlsx
Figure 2
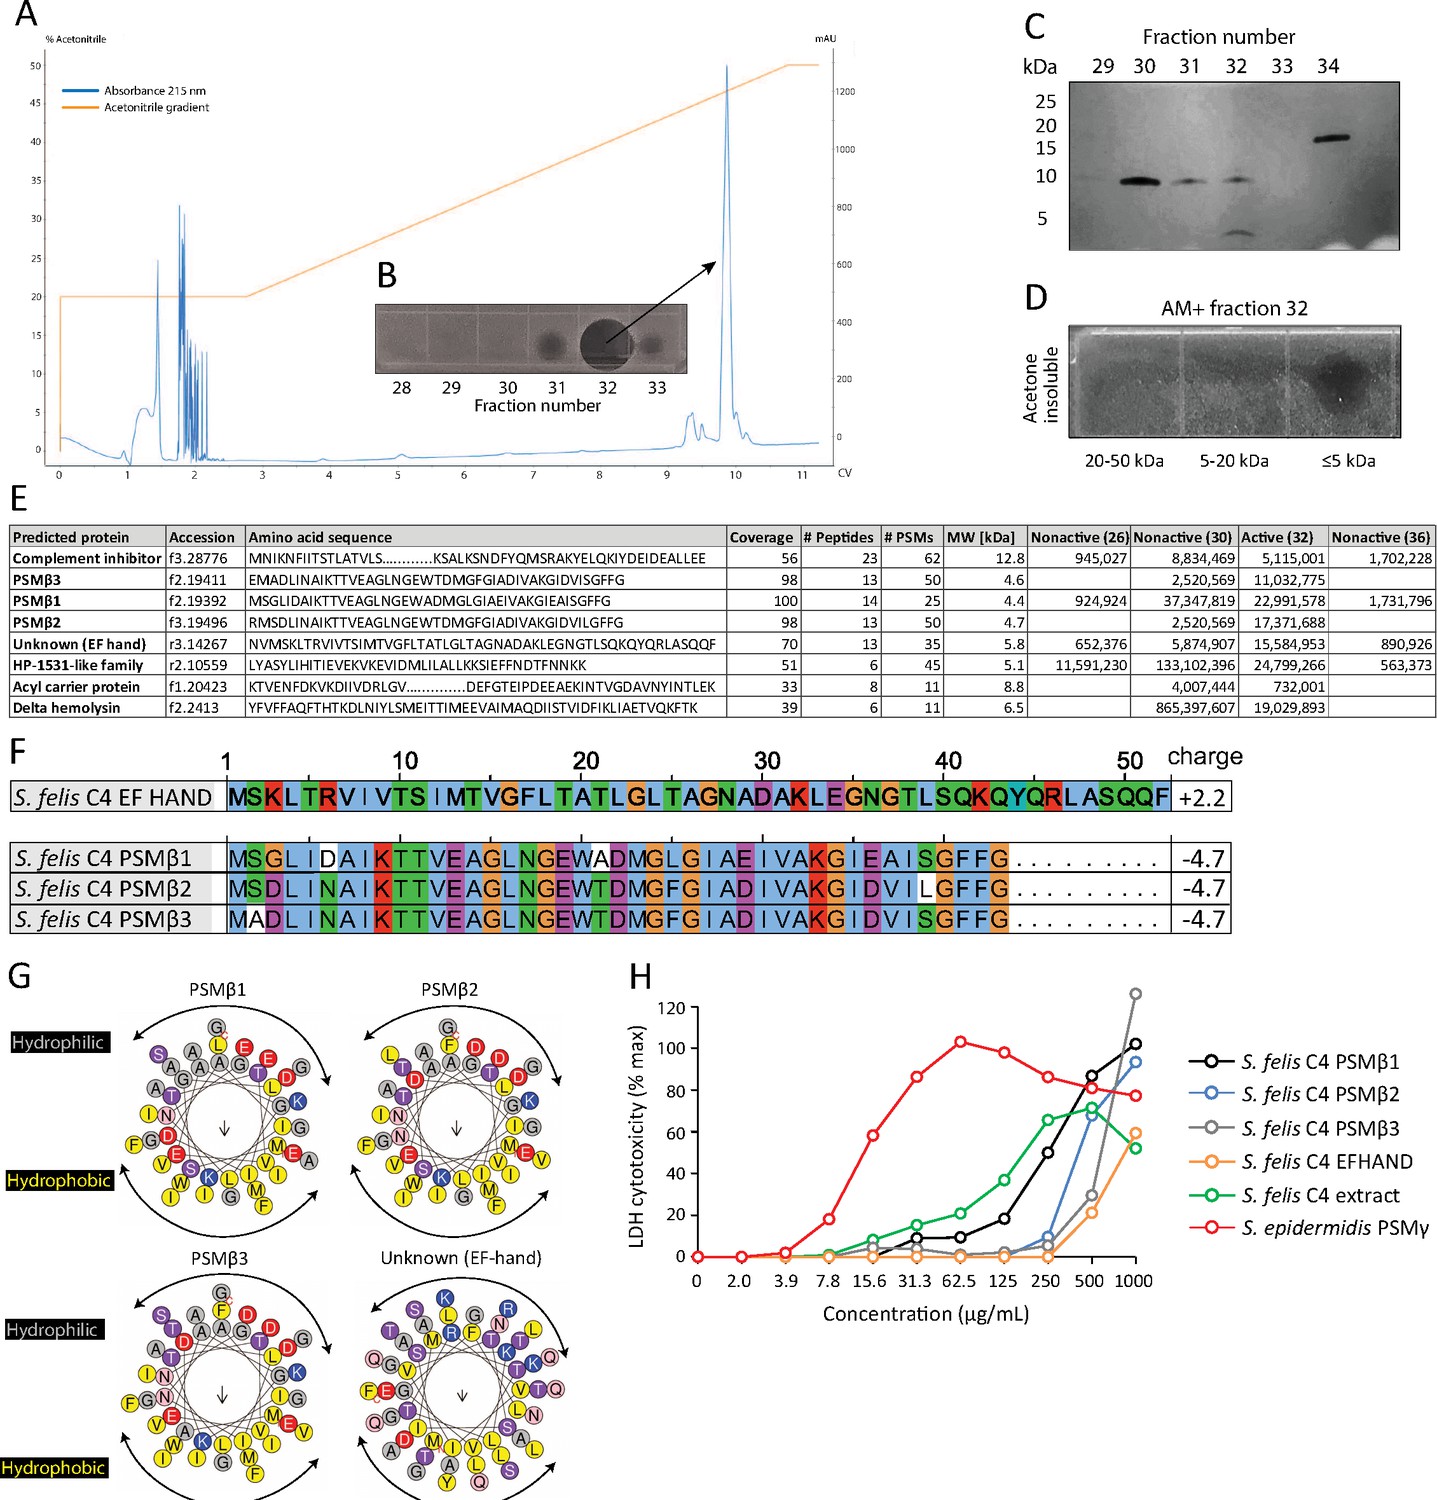
HPLC purification yields an antimicrobial fraction from S. felis C4 supernatant.
(A) Reverse-phase high-performance liquid chromatography (HPLC) elution profile from sterile supernatant of S. felis C4 strain loaded onto a C8 column. (B) Inset image of antimicrobial activity exhibited by fraction 32 against S. pseudintermedius ST71 corresponding to the indicated peak. (C) Silver stain of total protein content in the different fractions indicated. (D) Radial diffusion assay of antimicrobial activity of the AM + fraction 32 after extraction and acetone precipitation of proteins within different sized silver stain gel fragments. (E) Mass spectrometry (MS) table of the top eight peptide hits obtained from HPLC fractions that were active (fraction 32) or inactive (26, 30, 36) against S. pseudintermedius ST71. (F) ClustalW multiple amino acid sequence alignment of all three S. felis C4 genetically-encoded PSMβ peptides with predicted net charge at pH 7.4 (Prot pi) and amino acid sequence of a EF-hand domain-containing peptide with unknown function. (G) Alpha helical wheel plots of S. felis C4 PSMβ1–3 and EF-HAND domain peptide, indicating conserved α-helical, amphipathic-like structures with indicated hydrophobic yellow residues confined to one side (indicated by arrow) and gray hydrophilic residues on the opposing side. (H) LDH release in NHEKs after 24 h treatment with increasing concentrations of S. felis C4 extract, S. felis C4 EF-HAND synthetic peptide, S. felis formylated synthetic PSMβ1, PSMβ2, PSMβ3, or positive control cytotoxic PSMγ from S. epidermidis. Percentage (%) cytotoxicity measured by maximum LDH release into supernatant collected after untreated cell freeze thaw.
-
Figure 2—source data 1
Source data for Figure 2B (labeled and unlabeled images of the antimicrobial agar assay from HPLC fractions).
- https://cdn.elifesciences.org/articles/66793/elife-66793-fig2-data1-v2.tif
-
Figure 2—source data 2
Source data for Figure 2C (labeled and unlabeled images of the silver-stained bacterial protein after HPLC purification).
- https://cdn.elifesciences.org/articles/66793/elife-66793-fig2-data2-v2.tif
-
Figure 2—source data 3
Source data for Figure 2D (labeled and unlabeled images of the antimicrobial agar assay from active fraction 32 and nonactive fraction 28 after acetone precipitation).
- https://cdn.elifesciences.org/articles/66793/elife-66793-fig2-data3-v2.tif
-
Figure 2—source data 4
Source data for Figure 2E (raw and annotated MS data) and Figure 2H (LDH cytotoxicity values).
- https://cdn.elifesciences.org/articles/66793/elife-66793-fig2-data4-v2.xlsx
Figure 3 with 3 supplements
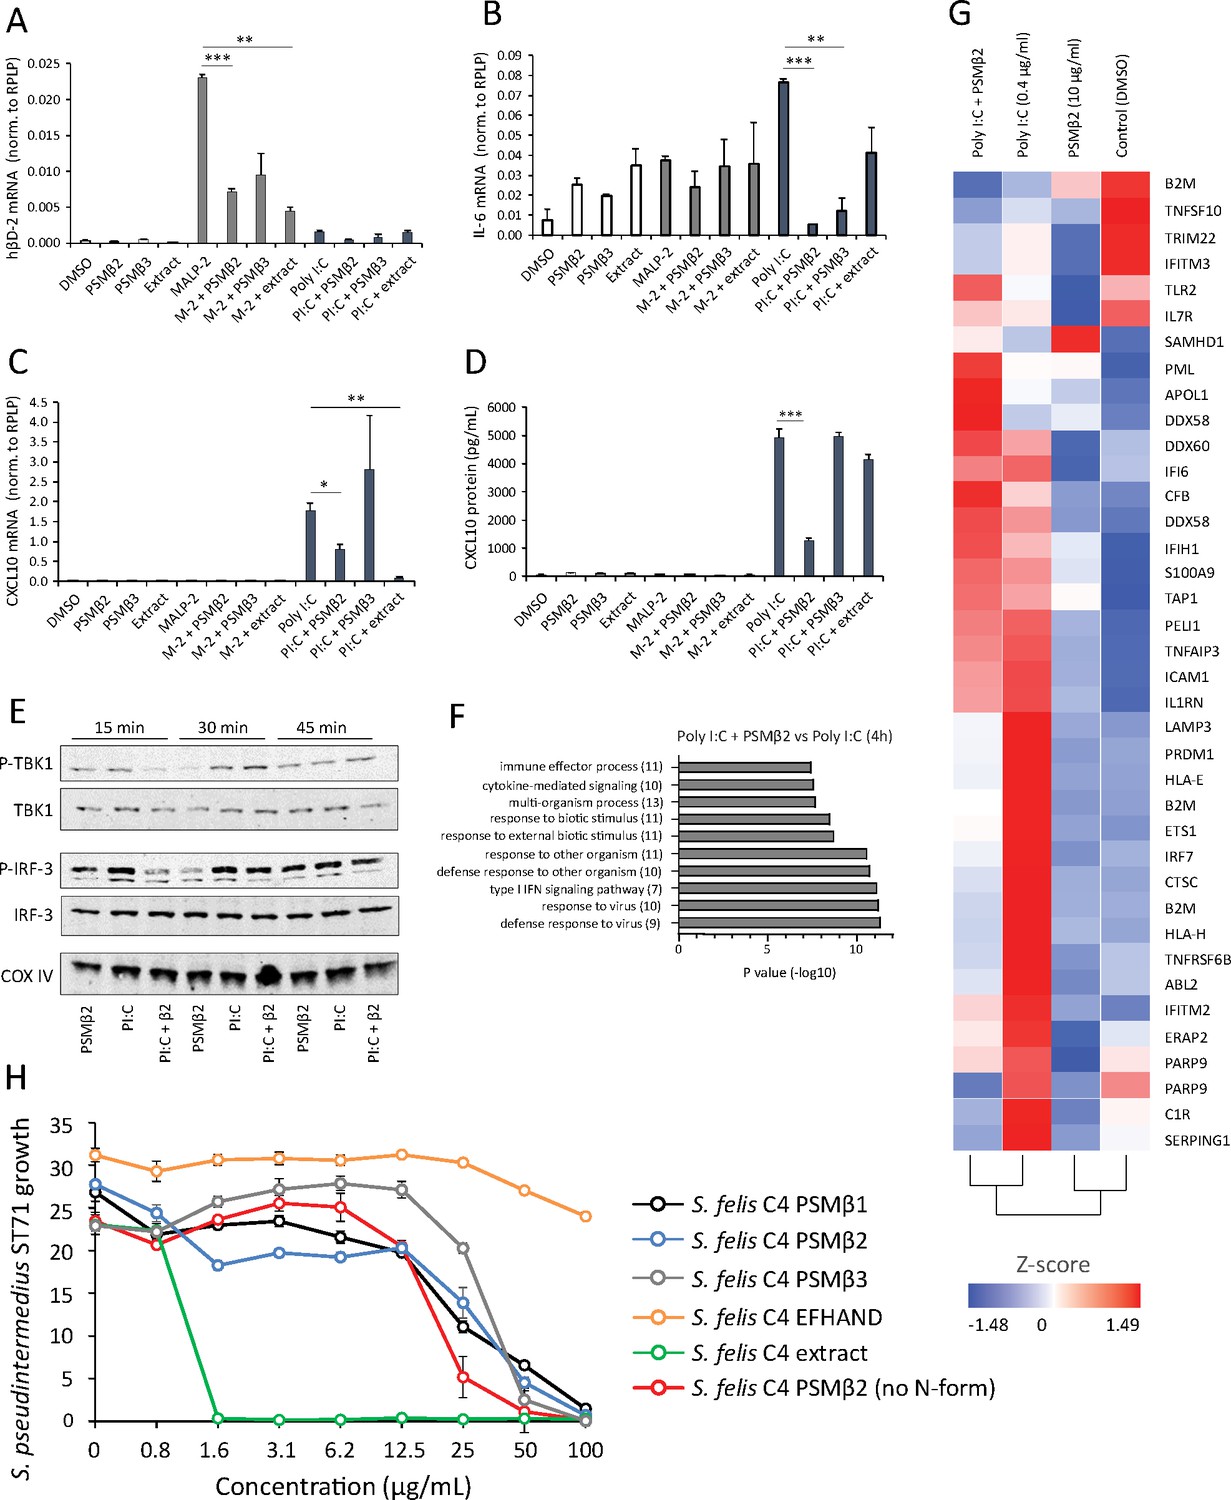
Antimicrobial S. felis C4 extract and PSMβ suppress TLR-mediated inflammation.
mRNA transcript abundance of hBD2 (A), IL-6 (B) and CXCL10 (C) as measured by qPCR in NHEKs stimulated with or without TLR2/6 agonist MALP-2 (M-2) (200 ng/ml) or TLR3 agonist Poly I:C (PI:C) (0.4 μg/ml) in the presence or absence of S. felis C4 extract, PSMβ2 or PSMβ3 (10 μg/ml) or DMSO control (0.1%) at 4 hr post-treatment. (D) Quantification of CXCL10 protein by ELISA from the supernatant of NHEKs stimulated with MALP-2 or Poly I:C in the presence or absence of S. felis extract, PSMβ2, PSMβ3 or DMSO control 24 hr post-treatment. (A–D) Error bars indicate SEM. One-way ANOVA with multiple corrections (Tukey’s correction) was performed. p values: * p < 0.05; ** p < 0.01; *** p < 0.001. (E) Time-course of the TLR3 signaling cascade by immunoblot of phosphorylated TBK1 (P-TBK1) and IRF-3 (P-IRF-3) proteins after stimulation of NHEKs with Poly I:C (PI:C), PSMβ2 (β2), or co-treatment with Poly I:C and PSMβ2 (PI:C+β2). (F) Gene ontology (GO) pathway analysis of genes downregulated in NHEKs after 4 hr co-treatment with Poly I:C and PSMβ2 versus treatment with Poly I:C alone. (G) Hierarchical clustering and Heatmap visualization of selected genes from GO enriched ‘immune response’ pathway (1.5-fold change) 4 hr post-treatment with DMSO, PSMβ2 or Poly I:C alone or with Poly I:C and PSMβ2 cotreatment. (H) Growth of S. pseudintermedius ST71 (OD600 nm) after 18 hr incubation with increasing concentrations of S. felis C4 extract, formylated peptides PSMβ1, PSMβ2, PSMβ3, EFHAND domain-containing peptide or non-formylated PSMβ2. Error bars indicate SEM. Representative of two independent experiments.
-
Figure 3—source data 1
Source data for Figure 3A–C (gene expression values measured by qPCR), Figure 3D (secreted CXCL10 values measured by ELISA), Figure 3F (gene list for GO terms) and Figure 3H (growth of S.p ST71 in the presence of peptides and extract).
- https://cdn.elifesciences.org/articles/66793/elife-66793-fig3-data1-v2.xlsx
-
Figure 3—source data 2
Source data for Figure 3E (labeled and unlabeled western blots of (P) TBK1, (P) IRF3 and COXIV).
- https://cdn.elifesciences.org/articles/66793/elife-66793-fig3-data2-v2.tif
Figure 3—figure supplement 1
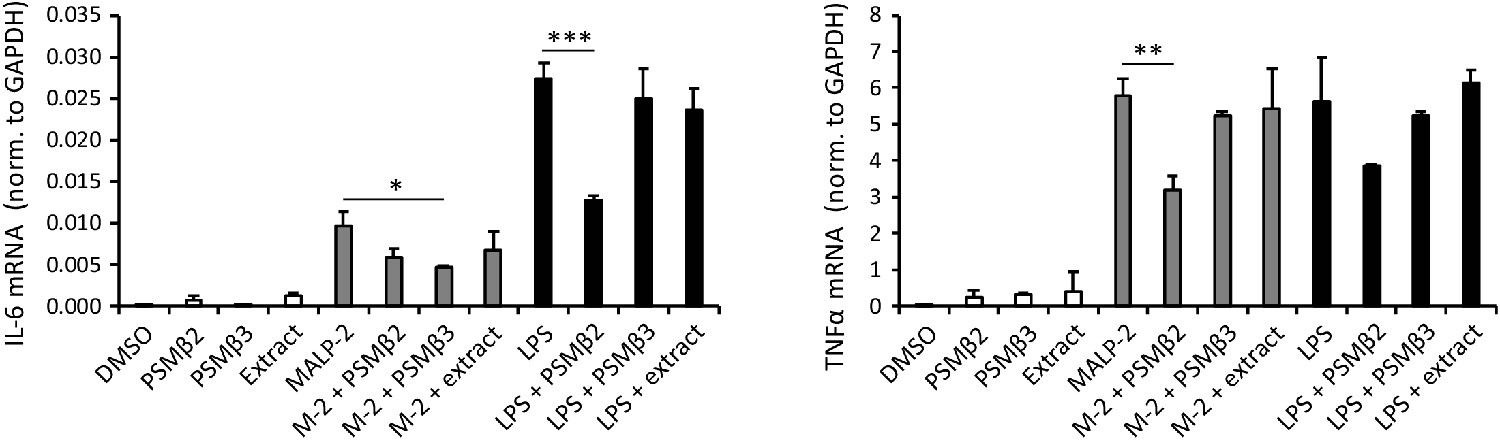
S. felis C4 PSMβ2 reduces TLR2- and TLR4-stimulated transcripts in THP-1 macrophages.
Transcript abundance of inflammatory cytokines IL-6 and TNFα in THP-1 cells stimulated with or without TLR2/6 agonist MALP-2 (200 ng/ml) or TLR4 agonist LPS (1 μg/ml) in the presence or absence of S. felis C4 extract, PSMβ2 or PSMβ3 (10 μg/ml) or DMSO control (0.1%) 4 hr post-treatment. Error bars indicate SEM. One-way ANOVA with multiple corrections (Tukey’s correction) was performed. p values: * p < 0.05; **, p < 0.01; *** p < 0.001.
Figure 3—figure supplement 2
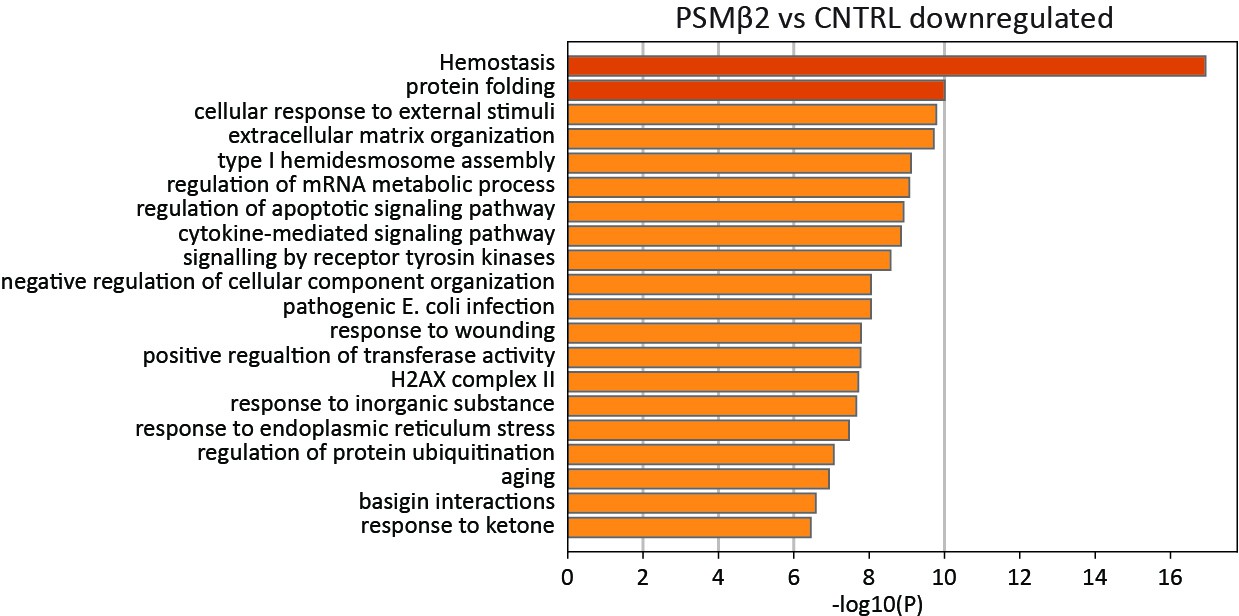
S. felis C4 PSMβ2 downregulates transcripts associated with cytokine signaling.
GO pathway analysis of genes down-regulated in NHEKs at 24 hr post treatment with PSMβ2 versus DMSO control.
Figure 3—figure supplement 3
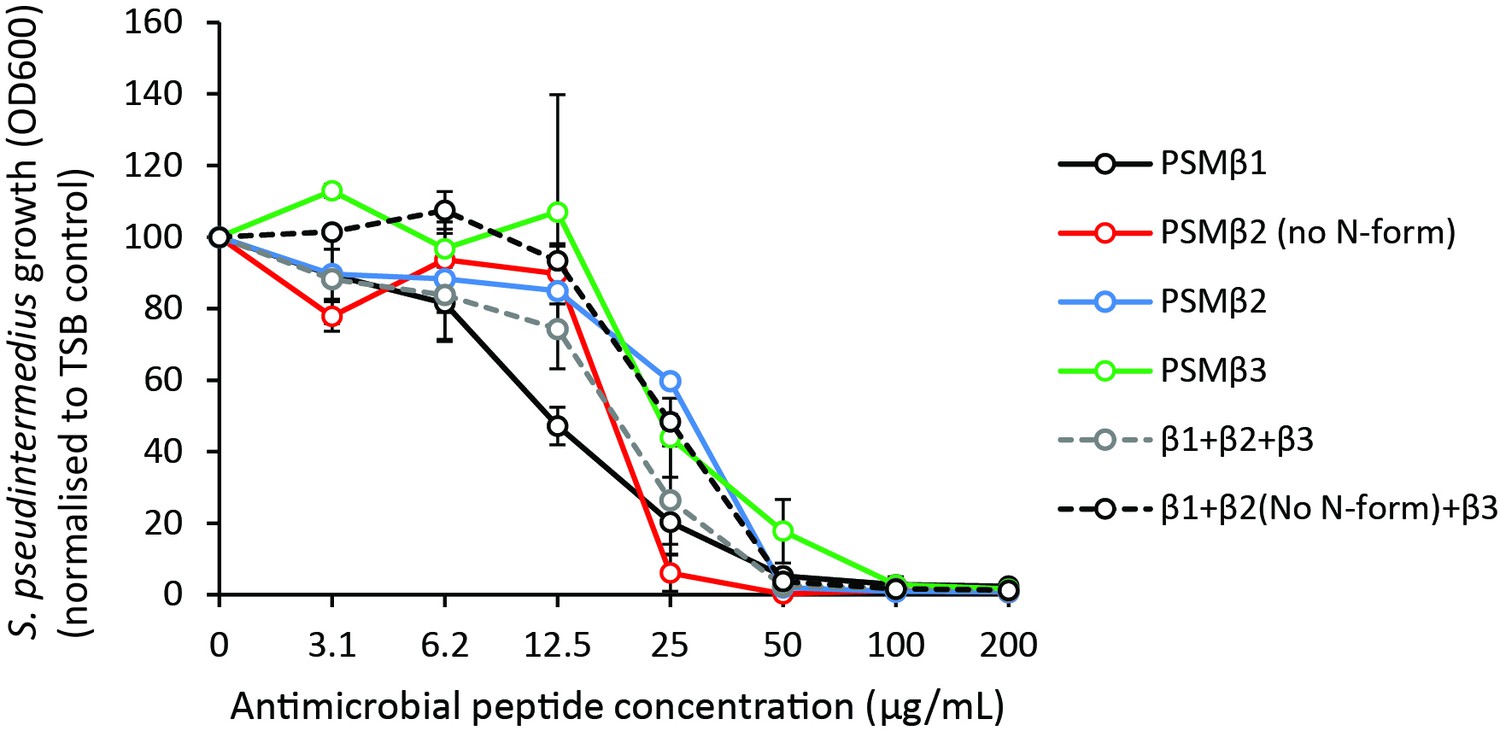
PSMβ do not exhibit synergistic antimicrobial activity.
Growth of S. pseudintermedius ST71 (OD600), normalized to TSB alone at 100% at 18 hr post-treatment with N-formylated and non-N-formylated (no N-f) PSMβ peptides alone or in combination. Error bars indicated SEM.
Figure 4 with 1 supplement
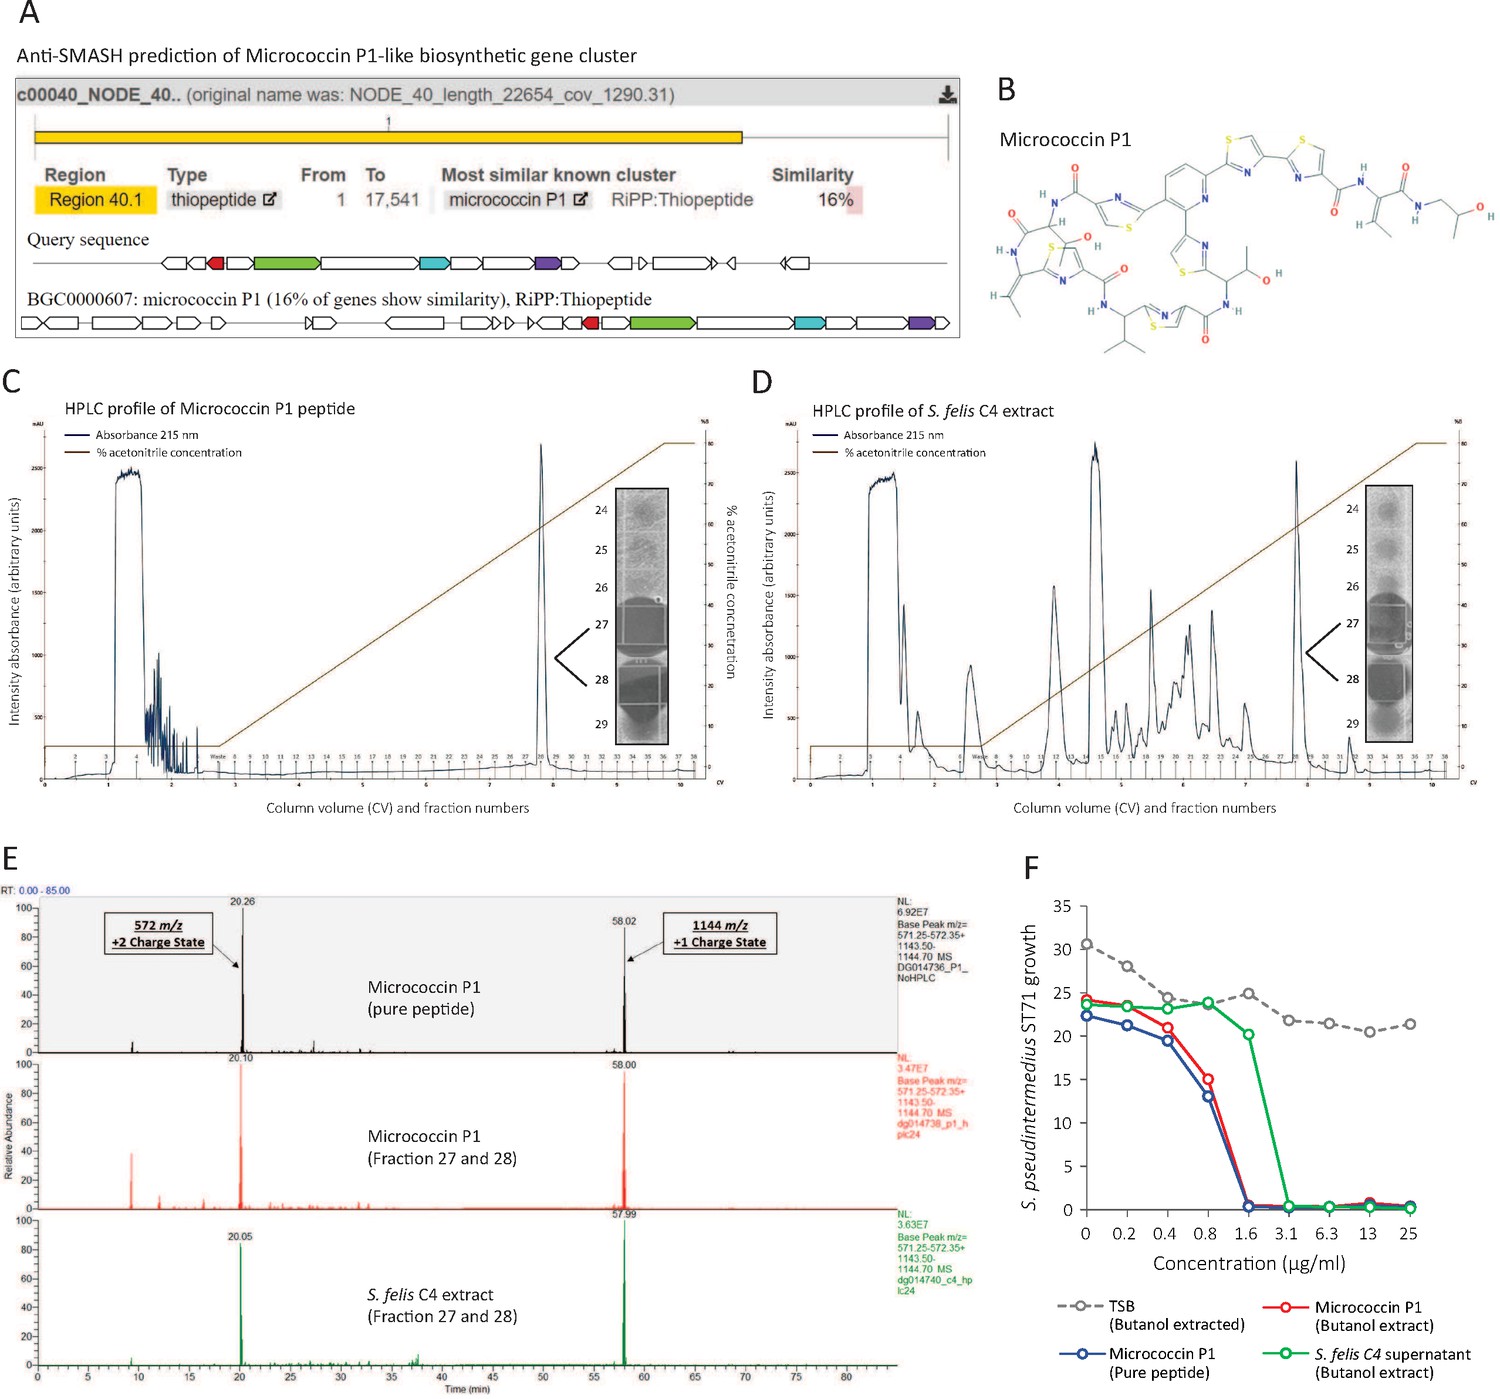
Identification of a micrococcin P1-like antimicrobial in S. felis C4 extract.
(A) Prediction of a biosynthetic gene cluster (BCG) in the S. felis C4 genome that has predicted similarity to a micrococcin P1 thiopeptide-encoding BCG. (B) Micrococcin P1 chemical structure downloaded from PubChem. (C) HPLC chromatogram of pure micrococcin P1 showing a single major peak eluted at 59 % acetonitrile into fractions 27 and 28. Inset image shows antimicrobial activity of fractions 27 and 28 against S. pseudintermedius ST71. (D) HPLC chromatogram of S. felis C4 extract showing a single major peak eluted at 59 % acetonitrile into fractions 27 and 28. Inset image shows antimicrobial activity of fractions 27 and 28 against S. pseudintermedius ST71. (E) Mass spectrometry chromatogram of similar masses and charge states generated from the synthetic peptide micrococcin P1 (top panel), HPLC fractions 27 and 28 from micrococcin P1 (middle panel) and HPLC fractions 27 and 28 from S. felis C4 extract (bottom panel). (F) Antimicrobial activity of negative control TSB, S. felis C4 supernatant and micrococcin P1 (before or after extraction with n-butanol) against S. pseudintermedius ST71 (OD600 nm) after 18 hr. Representative of two independent butanol extractions and antimicrobial assays.
-
Figure 4—source data 1
Source data for Figure 4C and D (labelled and unlabelled images of the antimicrobial agar assay from HPLC fractions of micrococcin P1 and S. felis C4 extract).
- https://cdn.elifesciences.org/articles/66793/elife-66793-fig4-data1-v2.tif
Figure 4—figure supplement 1
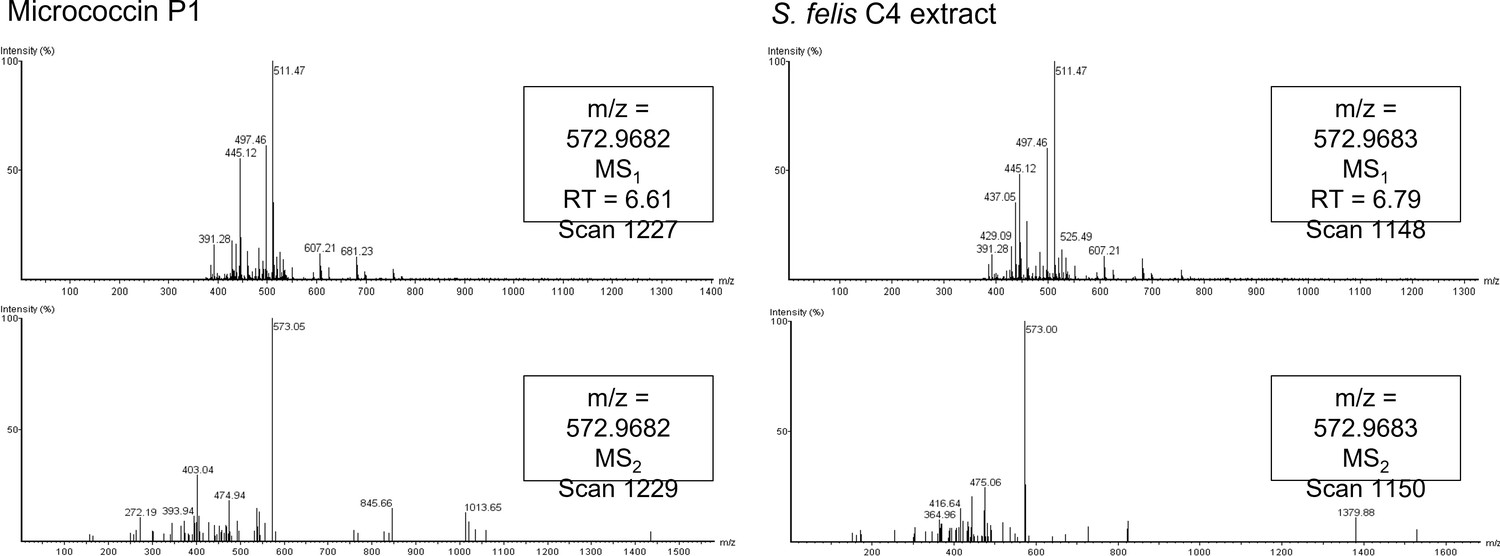
Spectral fingerprint of micrococcin P1 from HPLC eluted fractions.
Mass spectra fragmentation patterns generated from C8 HPLC active fractions of micrococcin P1 (left panels) and S. felis C4 extract (right panels). Spectral fingerprinting indicates both samples contain molecules of a similar mass (1144 daltons) to the expected molecular weight of micrococcin P1.
Figure 5
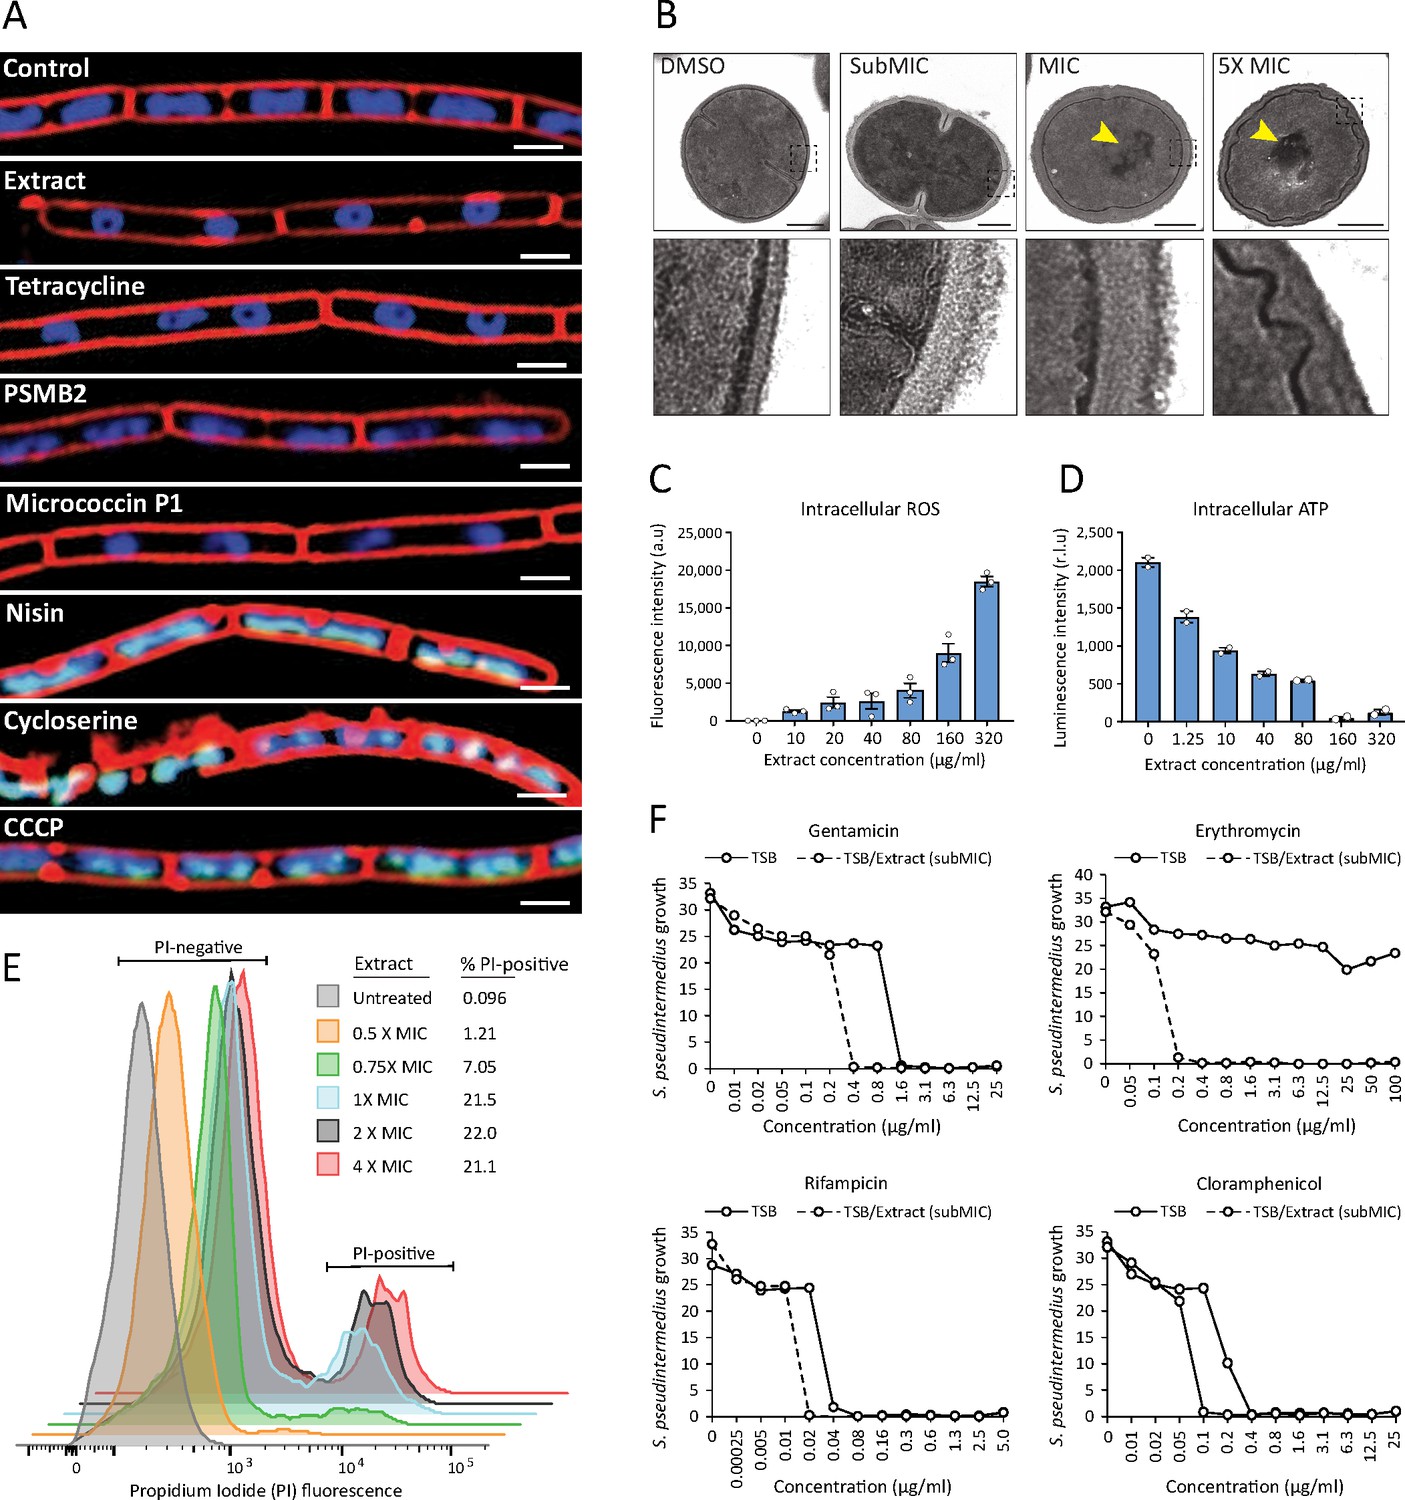
S. felis C4 antimicrobials target the bacterial cell membrane inhibit protein translation.
(A) Cytological profiles of B. subtilis PY79 upon treatment with 1 X MIC of S. felis C4 extract, tetracycline, PSMβ2, micrococcin P1, nisin, cycloserine, CCCP (carbonyl cyanide m-chlorophenylhydrazine) and DMSO control. Fluorescent microscopy images were taken 2 hr post-treatment, except for cycloserine, nisin and CCCP which were at 30 m post-treatment. The cell membrane was stained red with FM4-64, DNA-stained blue with DAPI, or green with SYTOX when the integrity of the membrane was compromised. Scale bar = 2 μm. (B) TEM images of S. pseudintermedius ST71 after 1 hr treatment with S. felis C4 extract or DMSO control at the indicated concentrations. Yellow arrows highlight areas of condensed DNA. Lower image panels represent higher magnification of regions highlighted by dashed black boxes. Scale = 250 nm. (C) Total ROS accumulation in S. pseudintermedius ST71 after 1 hr treatment in increasing concentrations of S. felis C4 extract. Error bars indicate SEM. (D) Total intracellular ATP accumulation in S. pseudintermedius ST71 after 1 hr treatment in increasing concentrations of S. felis C4 extract. Error bars indicate SEM. (C–D) representative of two separate experiments. (E) Flow cytometric LIVE/DEAD viability assay and quantification of SYTO9-positive S. pseudintermedius ST71 that were propidium iodide-positive (PI) or PI-negative at 4 hr post-treatment with increasing concentrations of S. felis C4 extract. Representative of two independent experiments. (F) Growth of S. pseudintermedius ST71 (OD600 nm) in TSB or TSB supplemented with a sub inhibitory 0.25 X MIC (0.4 μg/ml) of S. felis C4 extract after 18 hr incubation with increasing concentrations of rifampicin, gentamicin, erythromycin or cloramphenicol. Representative of three independent experiments.
-
Figure 5—source data 1
Source data for Figure 5A (folder of uncropped images generated by bacterial cytological profiling of B. subtilis PY79).
- https://cdn.elifesciences.org/articles/66793/elife-66793-fig5-data1-v2.zip
-
Figure 5—source data 2
Source data for Figure 5B (Uncropped EM images of S.p ST71).
- https://cdn.elifesciences.org/articles/66793/elife-66793-fig5-data2-v2.tif
-
Figure 5—source data 3
Source data for Figure 5C and D (values of ROS and ATP measured by luminescence) and Figure 5F (growth of S.p ST71 in the presence of antibiotics).
- https://cdn.elifesciences.org/articles/66793/elife-66793-fig5-data3-v2.xlsx
Figure 6
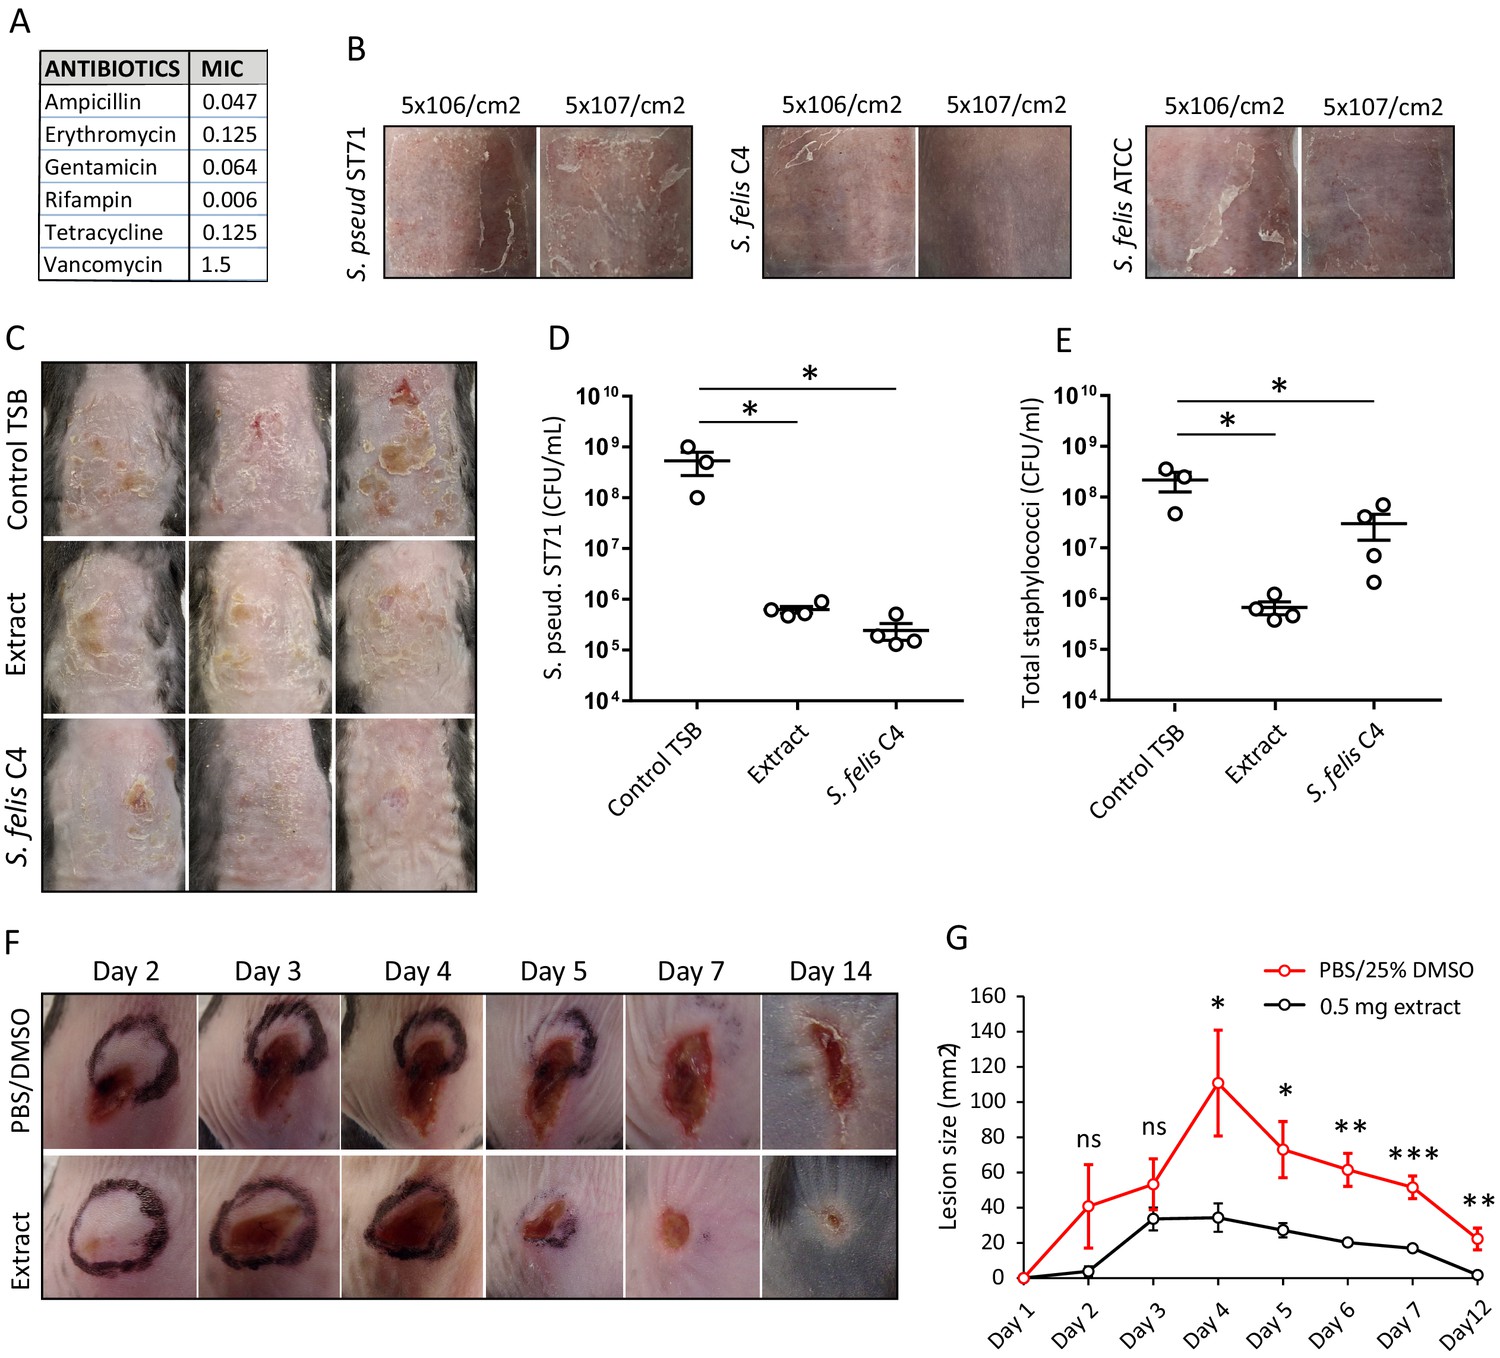
Live bacteriotherapeutic intervention with S. felis C4 protects against S. pseudintermedius colonization in mice.
(A) Minimum inhibitory concentrations (MIC) of the indicated antibiotics against S. felis C4. (B) Representative images of the dorsal skin of 8–10 week-old SKH1 mice 3 days post-challenge with live S. felis C4, S. pseudintermedius ST71 (S. pseud ST71) or S. felis ATCC (49168), inoculated at the indicated amounts. n = 2, per treatment group. (C–E) 5 × 10⁷ CFU/cm2 of S. pseudintermedius ST71 was applied onto the back skin of C57BL/6 mice for 48 hr and challenged with TSB, S. felis C4 extract (1 mg) or live S. felis C4 (5 × 10⁷ CFU/cm2) for 72 hr. Post-treatment, mouse back skin was photographed (C) and swabbed to enumerate S. pseudintermedius ST71 CFU on selective Baird-Parker egg yolk tellurite agar (D) or total staphylococci CFU on selective mannitol-salt agar plates (E). n = 3 for TSB and n = 4 for extract and S. felis C4. Error bars indicate SEM. One-way ANOVA with multiple comparisons (Dunnett’s correction) was performed. p values: *p < 0.05; (F–G) At day 0, 1 × 10⁷ CFU of S. pseudintermedius ST71 was intradermally injected into the back skin of 8–10 week-old C57BL/6 mice and at 1 hr post-infection two inoculations of S. felis C4 extract (250 μg) or PBS/25 % DMSO control were injected adjacent to the infection site. (F) Representative images of S. pseudintermedius ST71-induced dermonecrosis over time after receiving control PBS/DMSO or S. felis C4 extract. (G) Quantification of lesion size (mm2) over time as measured by L x W of lesions. n = 4 for DMSO/PBS and n = 5 for extract. Error bars indicate SEM. A two-tailed, unpaired Student’s t-test was performed. p values: *p < 0.05; **p < 0.01; ***p < 0.001.
-
Figure 6—source data 1
Source data for Figure 6D and E (CFU counts on mouse back skin for S.p ST71 and total CoNS) and Figure 6G (measurements of lesion sizes over time in S. p ST71 infected skin).
- https://cdn.elifesciences.org/articles/66793/elife-66793-fig6-data1-v2.xlsx
Tables
Key resources table
| Reagent type (species) or resource | Designation | Source or reference | Identifiers | Additional information |
|---|---|---|---|---|
| Strain, strain background (Escherichia coli) | K1(RS218) | PMID:26205862 | Provided by the Nizet lab | |
| Strain, strain background (Acinetobacter baumannii) | AB 5075 | PMID:24865555 | Provided by the Nizet lab | |
| Strain, strain background (Pseudomonas aeruginosa) | PAO1 | PMID:10984043 | This study | |
| Strain, strain background (Staphylo coccus aureus) | Newman, USA300,113, 6538, 33,591 | ATCC, PMID:17951380 | This study | |
| Strain, strain background (Staphylo coccus aureus) | NIAMS | PMID:28228596 | Lesional skin of atopic dermatitis patients | |
| Strain, strain background (Enterococcus faecium) | VRE 5998 | Provided by Nizet lab | ||
| Strain, strain background (Klebsiella pneumoniae) | K1100 | PMID:31353294 | Provided by Nizet lab | |
| Strain, strain background (Bacillus subtilis) | PY79 | PMID:24356846 | This study | |
| Cell line (Homo-sapiens) | (NHEK) normal human epidermal keratinocytes | Thermo Fisher | C0015C | |
| Antibody | Anti-Phospho-TBK1/NAK (Ser172) (Rabbit mAb) | Cell Signaling | Cat# D52C2 | WB (1:1,000) |
| Antibody | Anti-TBK1/NAK (Rabbit mAb) | Cell Signaling | Cat# D1B4 | WB (1:1,000) |
| Antibody | Anti-Phospho-IRF-3 (Ser396) (Rabbit mAb) | Cell Signaling | Cat# 4D4G | WB (1:1,000) |
| Antibody | Anti-IRF-3 (Rabbit mAb) | Cell Signaling | Cat# D83B9 | WB (1:1,000) |
| Antibody | Anti-COX IV (Rabbit mAb) | Cell Signaling | Cat# 3E11 | WB (1:1,000) |
| Antibody | LICOR IRDye 680RD Donkey anti-Goat IgG | Licor | Cat# LIC-926–68074 | WB (1:10,000) |
| Antibody | LICOR IRDye 800CW Donkey anti-Rabbit IgG | Licor | Cat# LIC-925–32213 | WB (1:10,000) |
| Sequence- based reagent | DEFB4A | Integrated DNA Technologies | PrimeTime predesigned qPCR primers | Assay ID# Hs.PT.58.40718840 |
| Sequence- based reagent | GAPDH | Integrated DNA Technologies | PrimeTime predesigned qPCR primers | Assay ID# Hs.PT.39a.22214836 |
| Sequence- based reagent | IL-6 | Integrated DNA Technologies | PrimeTime predesigned qPCR primers | Assay ID# Hs.PT.58.40226675 |
| Sequence- based reagent | CXCL10 | Integrated DNA Technologies | PrimeTime predesigned qPCR primers | Assay ID# Hs.PT.58.3790956.g |
| Commercial assay or kit | Thermo Pierce Silver stain kit | Thermo Fisher | Cat. #: 24,612 | |
| Commercial assay or kit | iTaq universal SYBR green supermix | Biorad | Cat. #: 1725121 | |
| Commercial assay or kit | Pierce BCA Protein Assay Kit | Thermo Fisher | Cat. #: 23,225 | |
| Commercial assay or kit | Pierce LDH Cytotoxicity Assay Kit | Thermo Scientific | Cat. #: PI88954 | |
| Commercial assay or kit | Human IP-10 ELISA Set | BD Biosciences | Cat. #: 550,926 | |
| Commercial assay or kit | PureLink RNA Mini Kit | Thermo Fisher | Cat. #: 12183025 | |
| Commercial assay or kit | LIVE/DEAD BacLight Bacterial Viability Kit | Thermo Fisher | Cat. #: L7012 | |
| Commercial assay or kit | 2 ml 96-well sterile deepWell plates | Fisher Scientific | Cat. #: 12-565-605 | |
| Chemical compound, drug | n-butanol 99.9% | Sigma Aldrich | Cat. #: 537,993 | |
| Chemical compound, drug | Crystal violet solution (1%) | Sigma Aldrich | Cat. #: V5265 | |
| Chemical compound, drug | Micrococcin P1 | Cayman Chemical | Cat. #: 17,093 | |
| Chemical compound, drug | Poly I:C | InvivoGen | Cat. #: tlrl-pic | |
| Chemical compound, drug | MALP-2 | Enzo Life Sciences | Cat. #: ALX-162–027 C050 | |
| Chemical compound, drug | Precision Plus Protein Dual Xtra Prestained Protein Standard | Biorad | Cat. #: 1610377 | |
| Chemical compound, drug | Human keratinocyte growth supplement | Thermo Fisher | Cat. #: S0015 | |
| Chemical compound, drug | Trypsin/EDTA solution (TE) | Thermo Fisher | Cat. #: R001100 | |
| Chemical compound, drug | Defined trypsin inhibitor | Thermo Fisher | Cat. #: R007100 | |
| Chemical compound, drug | EpiLife medium with 60 μM calcium | Thermo Fisher | Cat. #: MEPI500CA | |
| Chemical compound, drug | Antibiotic Antimycotic Solution (100 X) | Millipore Sigma | Cat. #: A5955 | |
| Chemical compound, drug | RIPA Lysis and Extraction Buffer | Fisher Scientific | Cat. #: PI89900 | |
| Chemical compound, drug | Halt Protease and Phosphatase Inhibitor Cocktail (100 X) | Thermo Fisher | Cat. #: 78,440 | |
| Chemical compound, drug | Intercept (PBS) Blocking Buffer | Licor | Cat. #: 927–70001 | |
| Software, algorithm | GraphPad Prism 7.03 | GraphPad Software Inc | ||
| Software, algorithm | FlowJo V10 | BD Biosciences |
Additional files
Download links
A two-part list of links to download the article, or parts of the article, in various formats.
Downloads (link to download the article as PDF)
Open citations (links to open the citations from this article in various online reference manager services)
Cite this article (links to download the citations from this article in formats compatible with various reference manager tools)
Antimicrobials from a feline commensal bacterium inhibit skin infection by drug-resistant S. pseudintermedius
eLife 10:e66793.
https://doi.org/10.7554/eLife.66793


