Expansion of CD10neg neutrophils and CD14+HLA-DRneg/low monocytes driving proinflammatory responses in patients with acute myocardial infarction
- Department of Cardiology and Angiology, Hannover Medical School, Germany
Figures
Figure 1 with 2 supplements

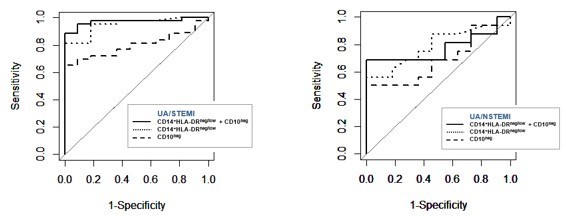
Increased circulating levels of CD14+HLA-DRneg/low monocytes in patients with AMI.
(A) Gating strategy to identify CD14+HLA-DRneg/low monocytes. (B) Circulating levels of CD14+HLA-DRneg/low monocytes in patients with unstable angina (UA; n=11), non-ST-elevation MI (NSTEMI, n=16), and ST-elevation MI (STEMI, n=44). (C) Linear regression analysis between circulating levels of CD14+HLA-DRneg/low monocytes and maximum CK (CKmax) in patients with acute coronary syndrome. (D) Receiver operator characteristic (ROC) curve of CD14+HLA-DRneg/low monocytes discriminating UA/STEMI and UA/NSTEMI patients and the combination of CD14+HLA-DRneg/low monocytes (n/µL) with CKmax. *p<0.05, vs. UA; †p<0.05, vs. NSTEMI.
Figure 1—figure supplement 1
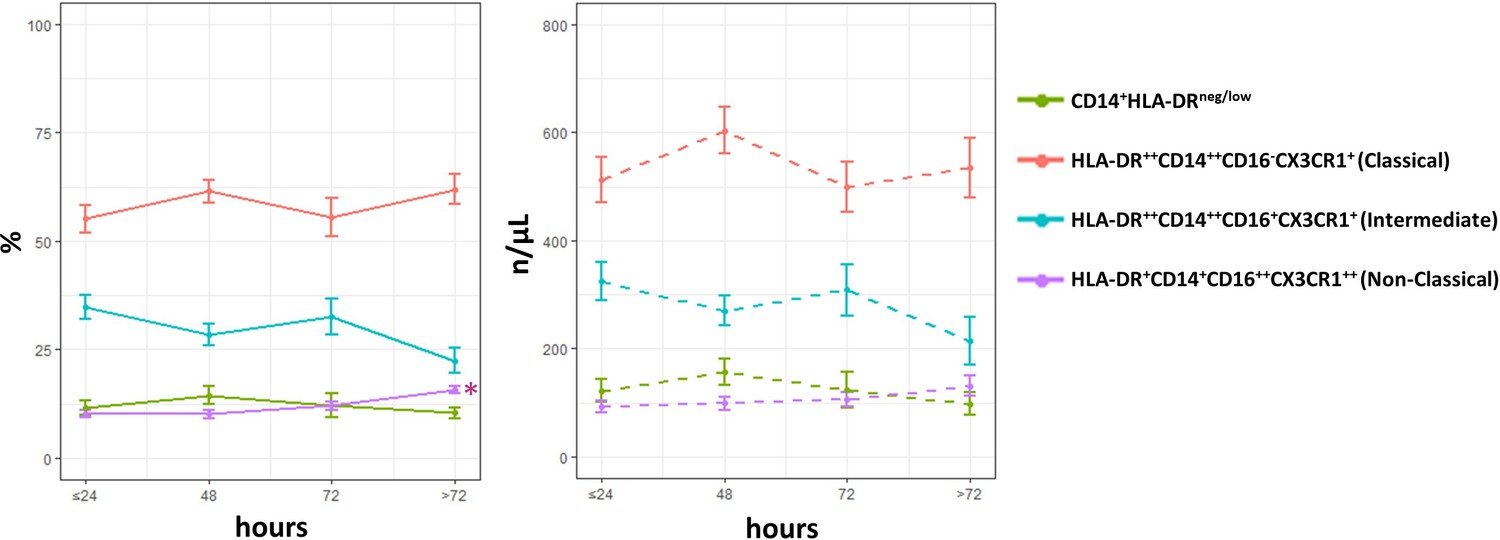
Time course analysis of subset-frequencies and circulating levels of monocytes in patients with unstable angina (UA; n=11), non-ST-elevation MI (NSTEMI, n=16), and ST-elevation MI (STEMI, n=44).
Phenotypic characterization was performed within the initial 24 hr and up to day 5 after onset of symptoms in patients with ACS. *p<0.01 vs. ≤ 24 hr. Error bars represent SEM.
Figure 1—figure supplement 2
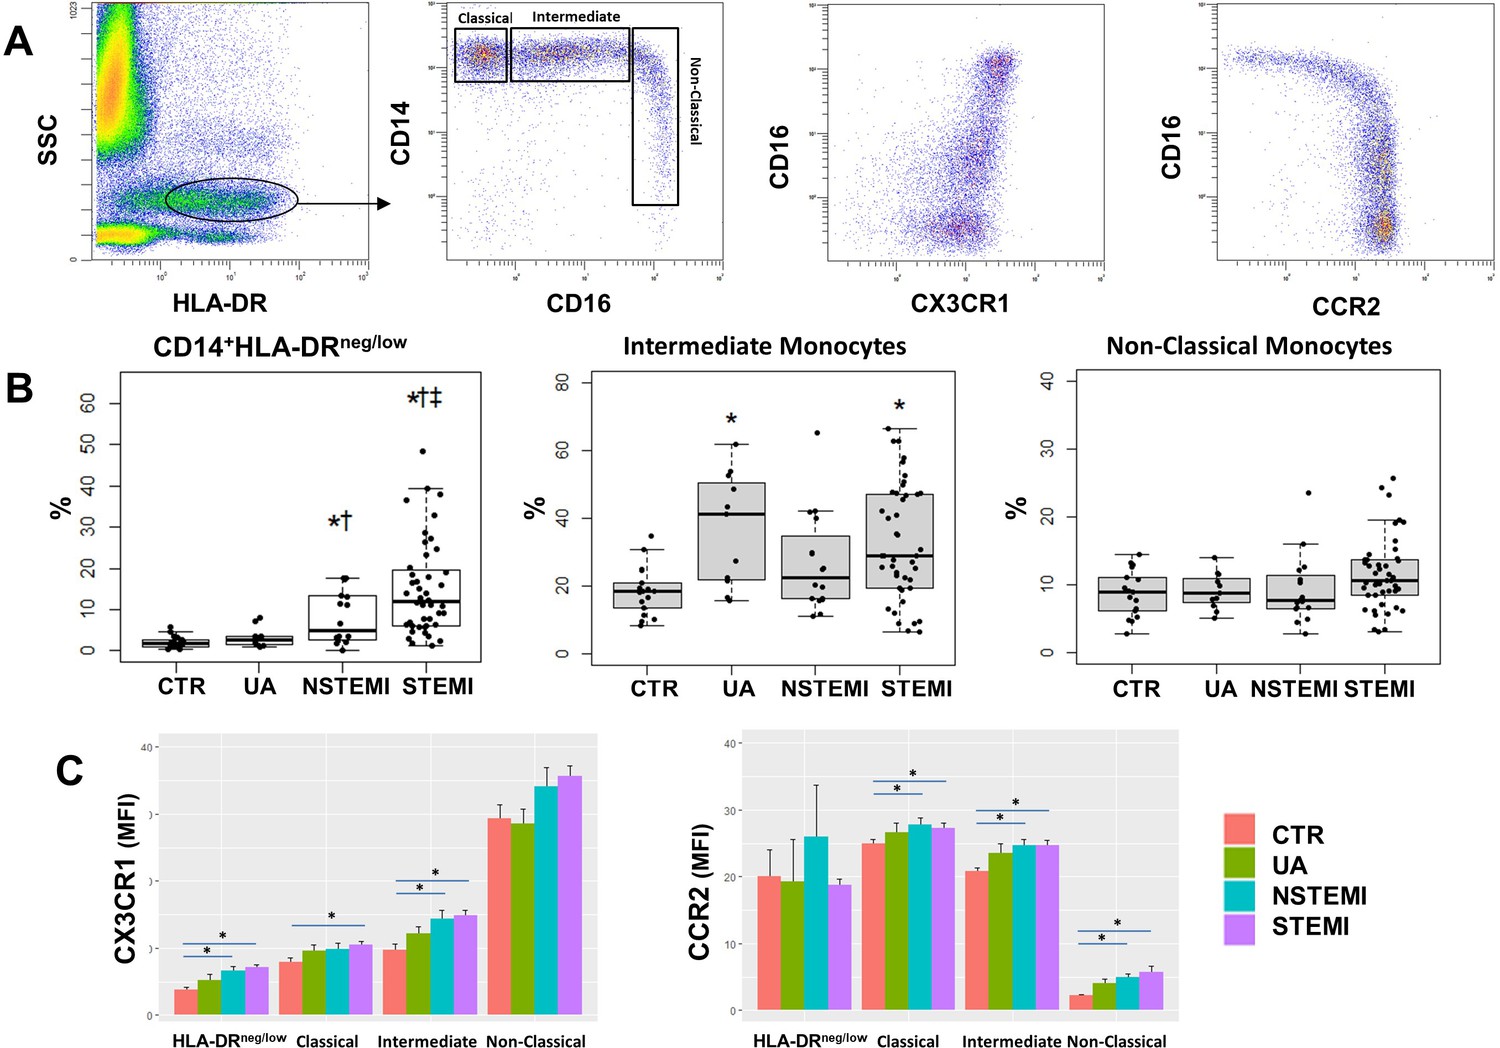
Monocyte subset-frequencies.
(A) Gating strategy to identify classical (HLA-DR++CD14++CD16-CX3CR1+), intermediate (HLA-DR++CD14++CD16+CX3CR1+) and non-classical (HLA-DR+CD14+CD16++CX3CR1++) monocytes. (B) Percentages of CD14+HLA-DRneg/low, intermediate and non-classical monocytes in control subjects (CTR, n=17) and in patients with unstable angina (UA; n=11), non-ST-elevation MI (NSTEMI, n=16), and ST-elevation MI (STEMI, n=44). (C) Mean fluorescence intensity (MFI) of CX3CR1 and CCR2 on monocyte subsets. *p<0.05 vs. CTR; †p<0.05 vs. UA; ‡p<0.05 vs. NSTEMI.
Figure 2 with 1 supplement
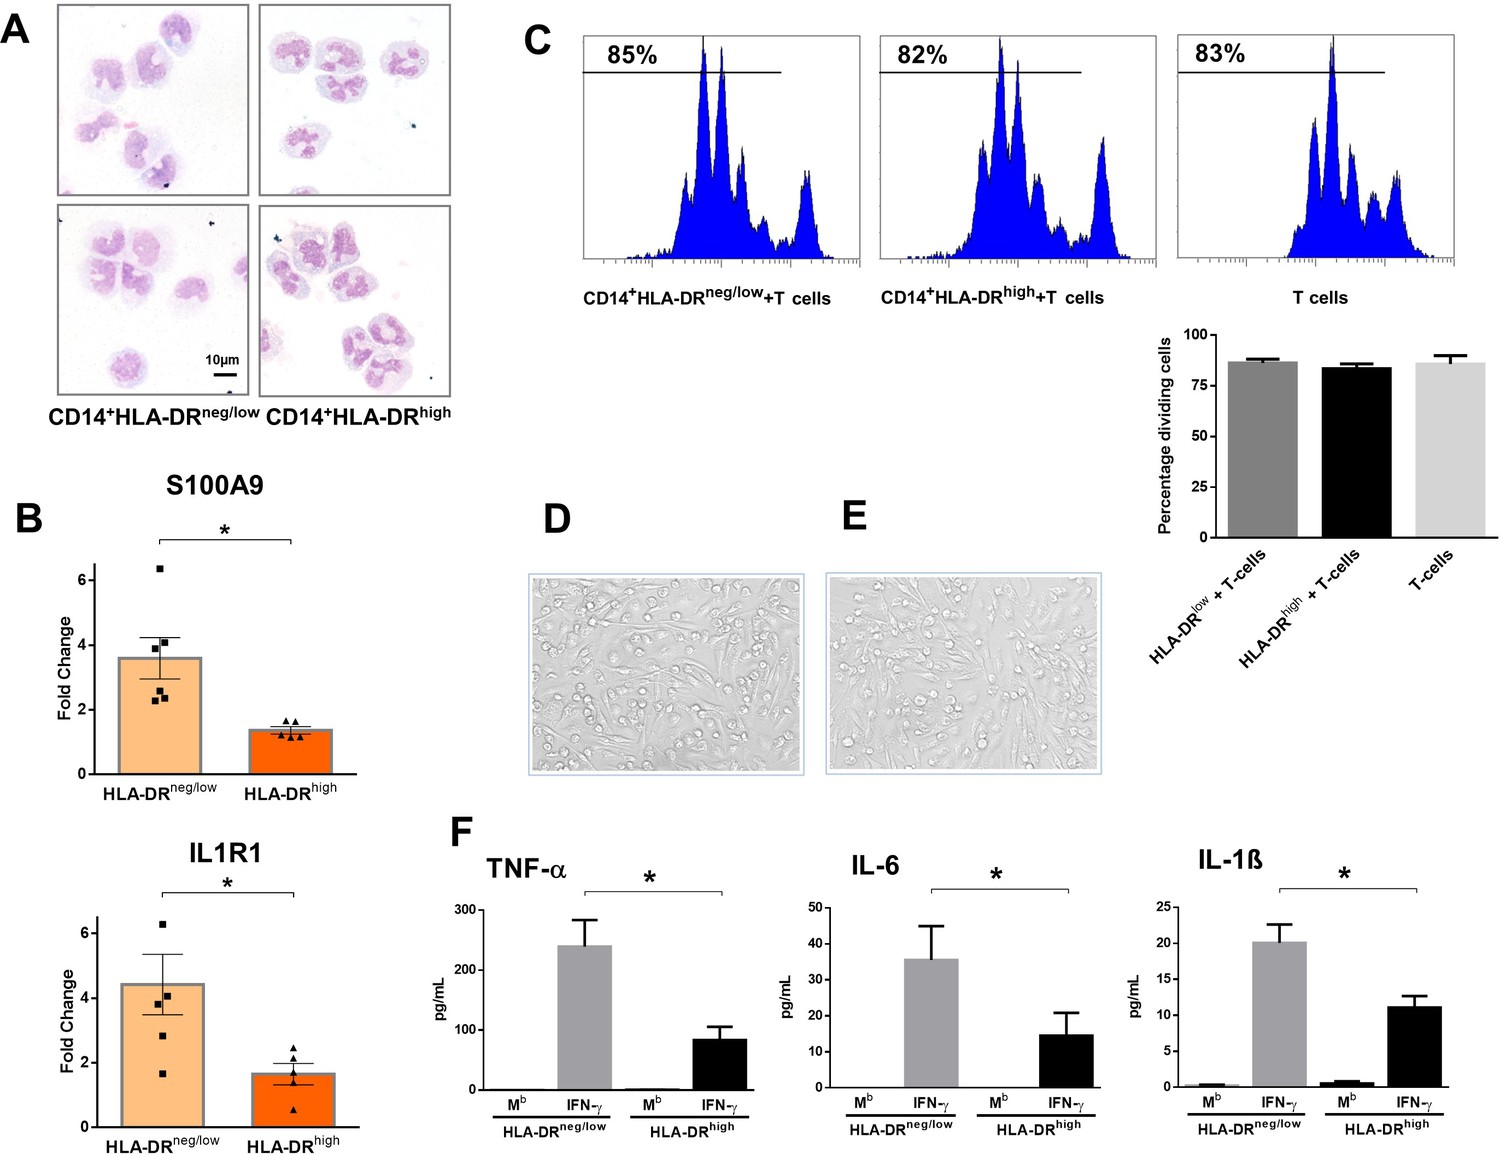
CD14+HLA-DRneg/low monocytes from patients with AMI are not immunosuppressive but exhibit an inflammatory phenotype.
(A) May-Grünwald Giemsa stained cytospin preparations of CD14+HLA-DRneg/low and CD14+HLA-DRhigh monocytes. (B) Relative RNA expression of S100A9 and IL1R1 in CD14+HLA-DRneg/low versus CD14+HLA-DRhigh monocytes. (C) T-cell proliferation in the presence of CD14+HLA-DRneg/low or CD14+HLA-DRhigh monocytes assessed by CellTrace Violet dilution after 96 hr of co-culture. (D) Macrophages differentiated from CD14+HLA-DRneg/low monocytes and (E) CD14+HLA-DRhigh cells by 4‐day culture with M-CSF. (F) TNF-α, IL-6, and IL-1ß in supernatants of macrophage cultures upon stimulation with IFN-γ. Mb=baseline. CD14+HLA-DRneg/low/CD14+HLA-DRhigh cells were isolated by flow-cytometric sorting from patients with AMI (n=5–6). Data are presented as mean ± SEM. *p<0.05.
Figure 2—figure supplement 1
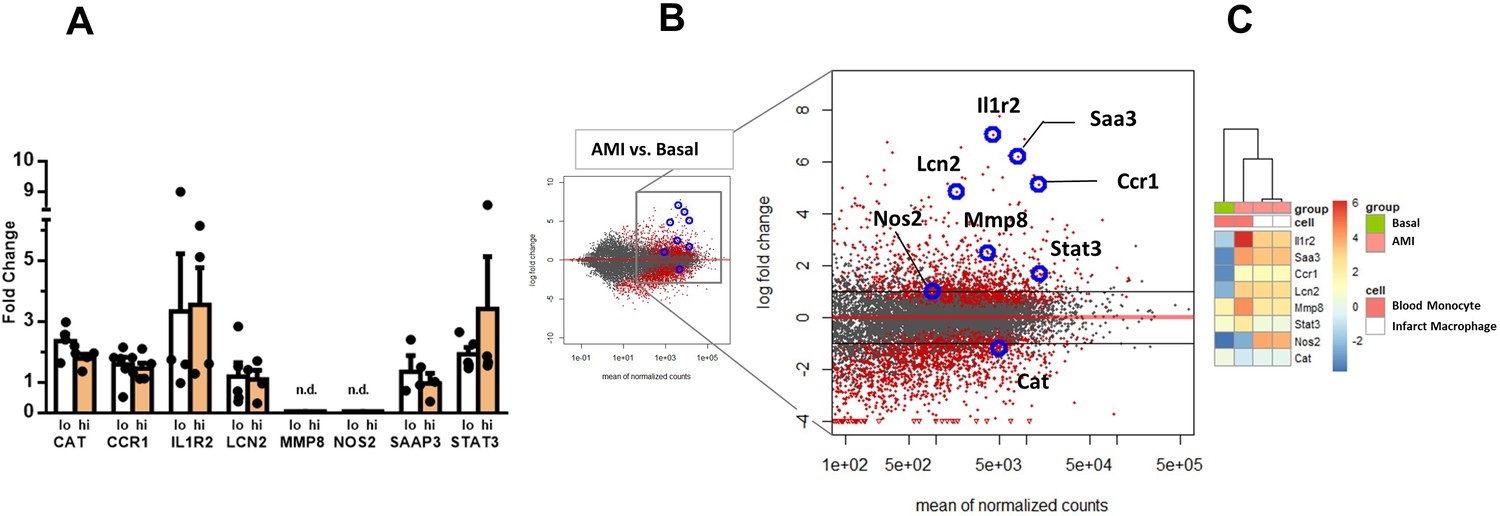
Expression of genes dysregulated in circulating monocytes and infarct macrophages in a mouse model of reperfused AMI.
(A) RT-qPCR showing the expression of CAT, CCR1, IL1R2, LCN2, MMP8, NOS2, STAT3, SAAP3 in CD14+HLA-DRneg/low (lo) versus CD14+HLA-DRhigh (hi) monocytes FACS-sorted from blood of patients with AMI. Data are presented as mean ± SEM, (n=3–5); n.d., not detectable. (B) MA plots showing genes regulated in circulating monocytes in a mouse model of reperfused AMI. RNA sequencing was performed on monocytes FACS-sorted from blood of sham-operated mice (Basal) and mice subjected to 1 hr of coronary occlusion followed by 6 hr of reperfusion. Genes upregulated/downregulated by AMI in monocytes were similarly regulated in (C) infarct macrophages FACS–sorted from the ischemic region 24 hr after AMI.
Figure 3 with 1 supplement
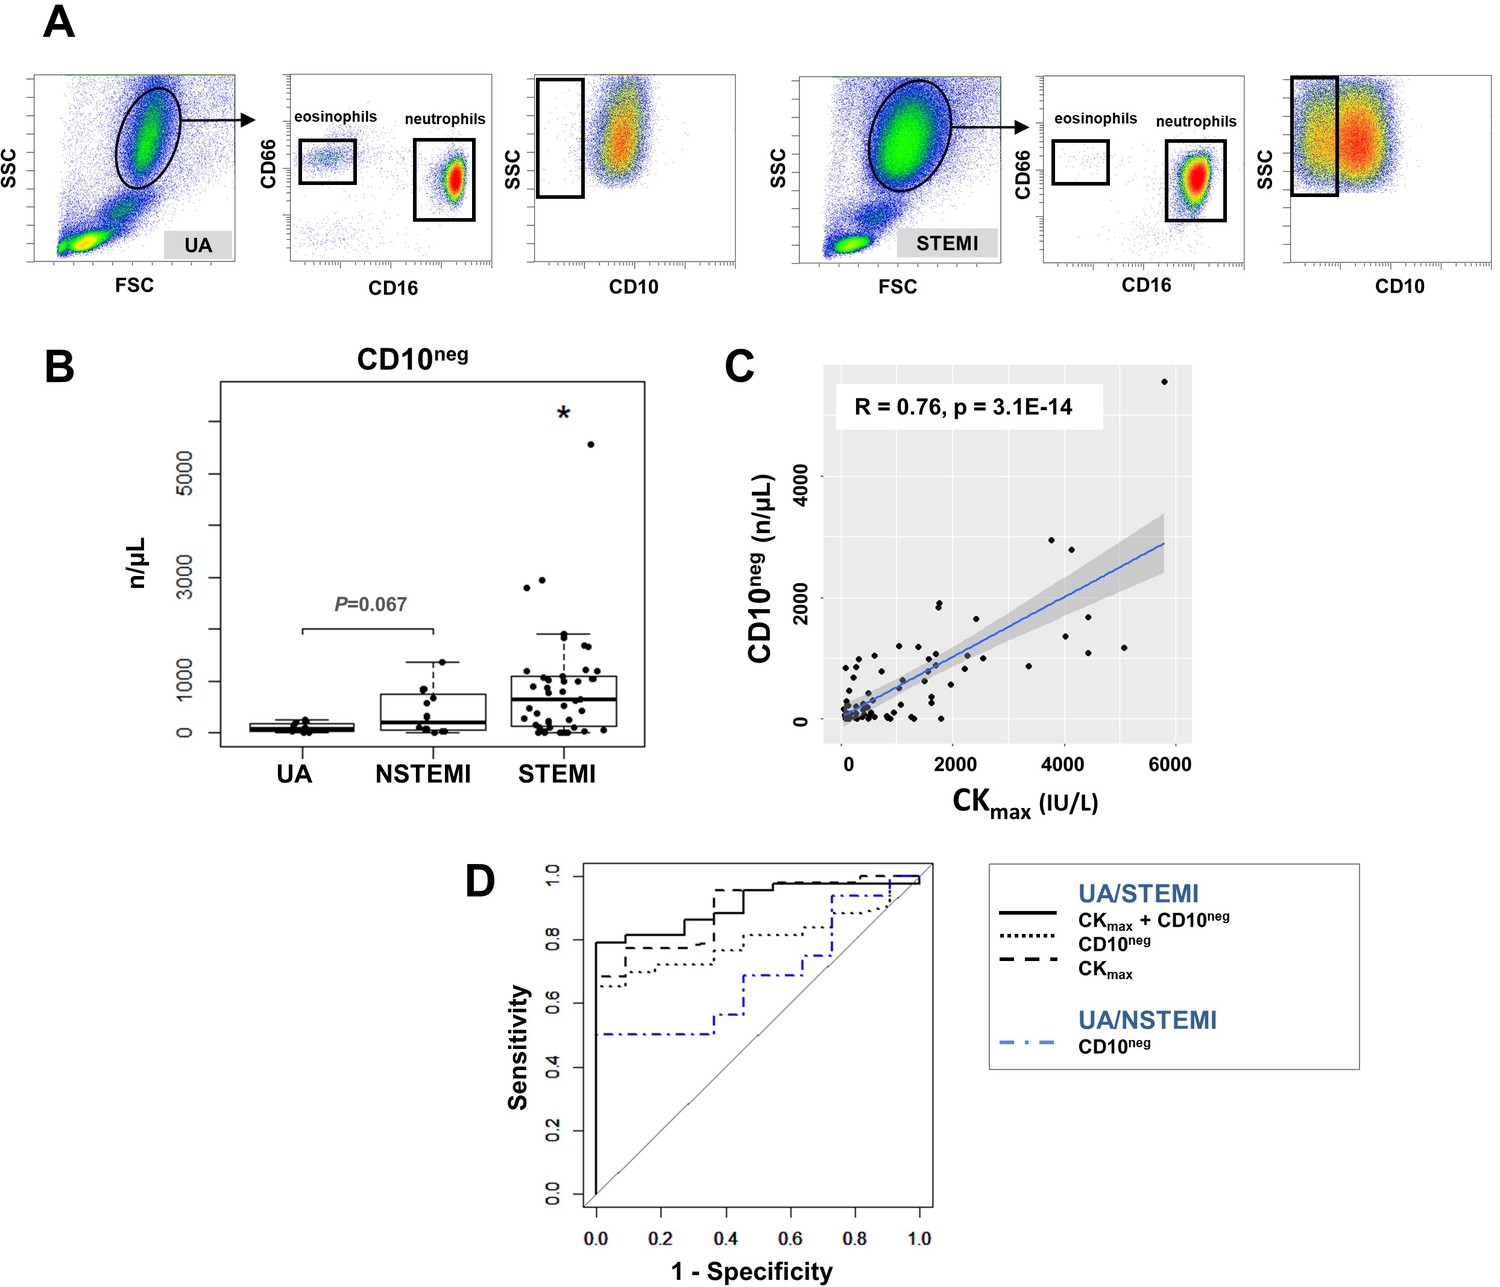
Circulating normal-density CD10neg neutrophils increase in patients with AMI.
(A) Gating strategy to identify CD10neg neutrophils. (B) Circulating levels of CD16+CD66b+CD10neg neutrophils in patients with unstable angina (UA; n=11), non-ST-elevation MI (NSTEMI, n=16), and ST-elevation MI (STEMI, n=44). (C) Linear regression analysis between circulating levels of CD10neg neutrophils and maximum CK (CKmax). (D) Receiver operator characteristic (ROC) curve of CD10neg neutrophils (n/µL) discriminating UA/STEMI and UA/NSTEMI patients and the combination of CD10neg neutrophils with CKmax in patients with acute coronary syndrome. *p<0.05 vs. UA.
Figure 3—figure supplement 1
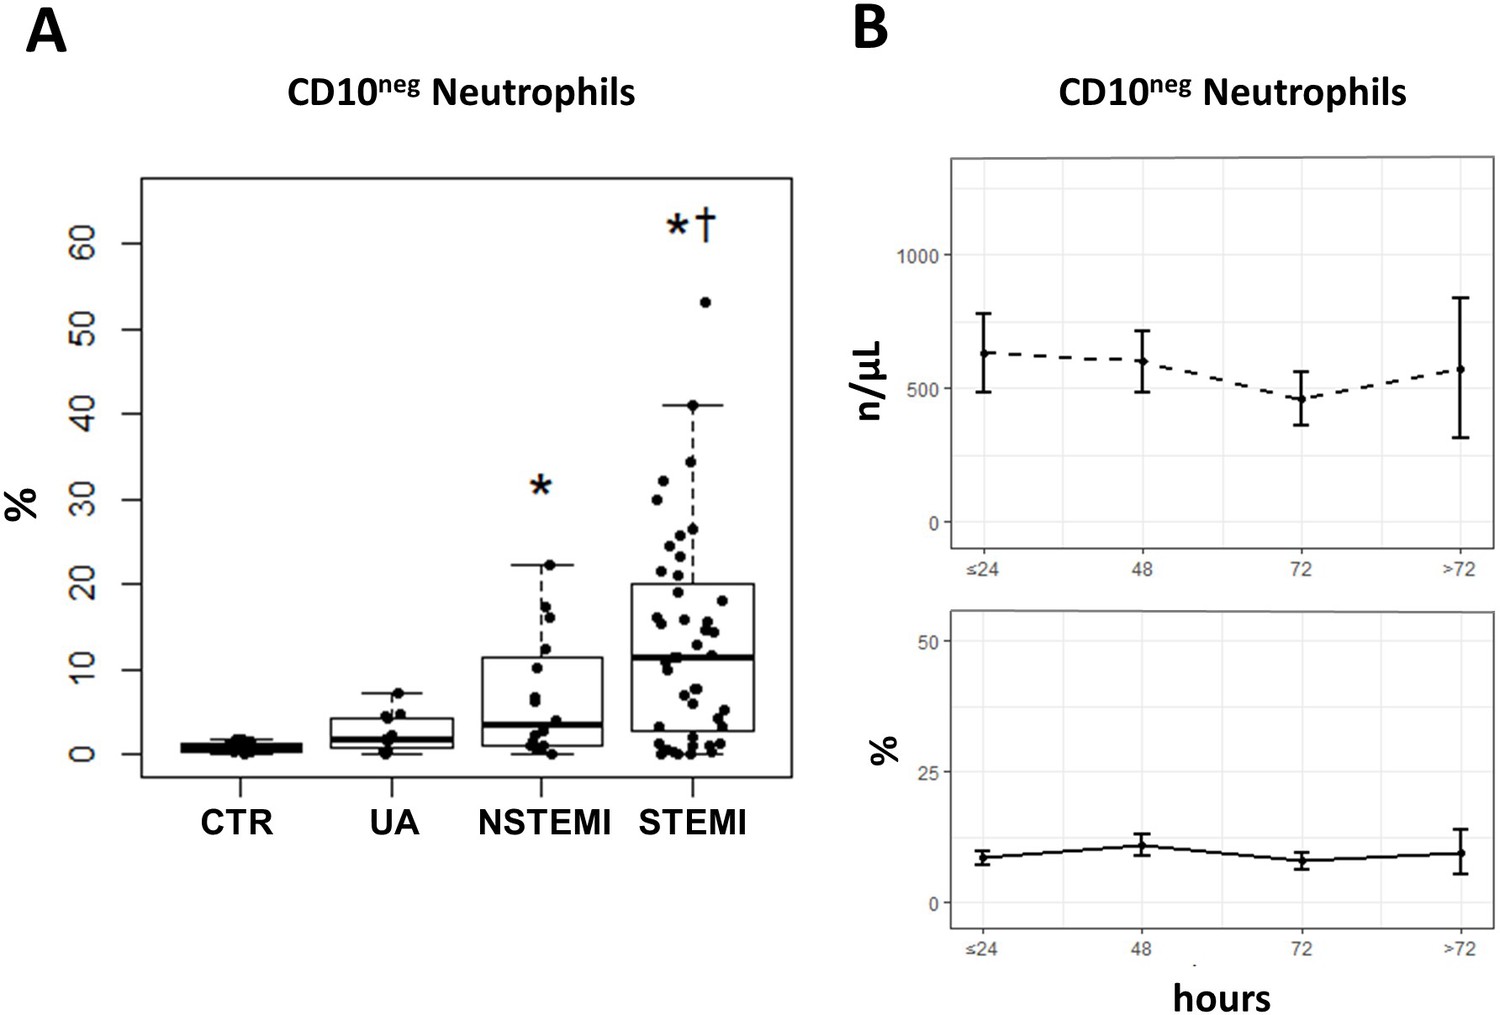
Increased frequency of CD10negneutrophils in patients with AMI.
(A) Percentages of circulating CD16+CD66b+CD10neg neutrophils in patients with unstable angina (UA; n=11), non-ST-elevation MI (NSTEMI, n=16), and ST-elevation MI (STEMI, n=44). (B) Time course analysis of circulating levels and frequencies of CD16+CD66b+CD10neg neutrophils. Phenotypic characterization was performed within the initial 24 hr and up to day 5 after onset of symptoms in patients with ACS. *p<0.05, vs. CTR; †p<0.05 vs. UA. Error bars represent SEM.
Figure 4 with 3 supplements
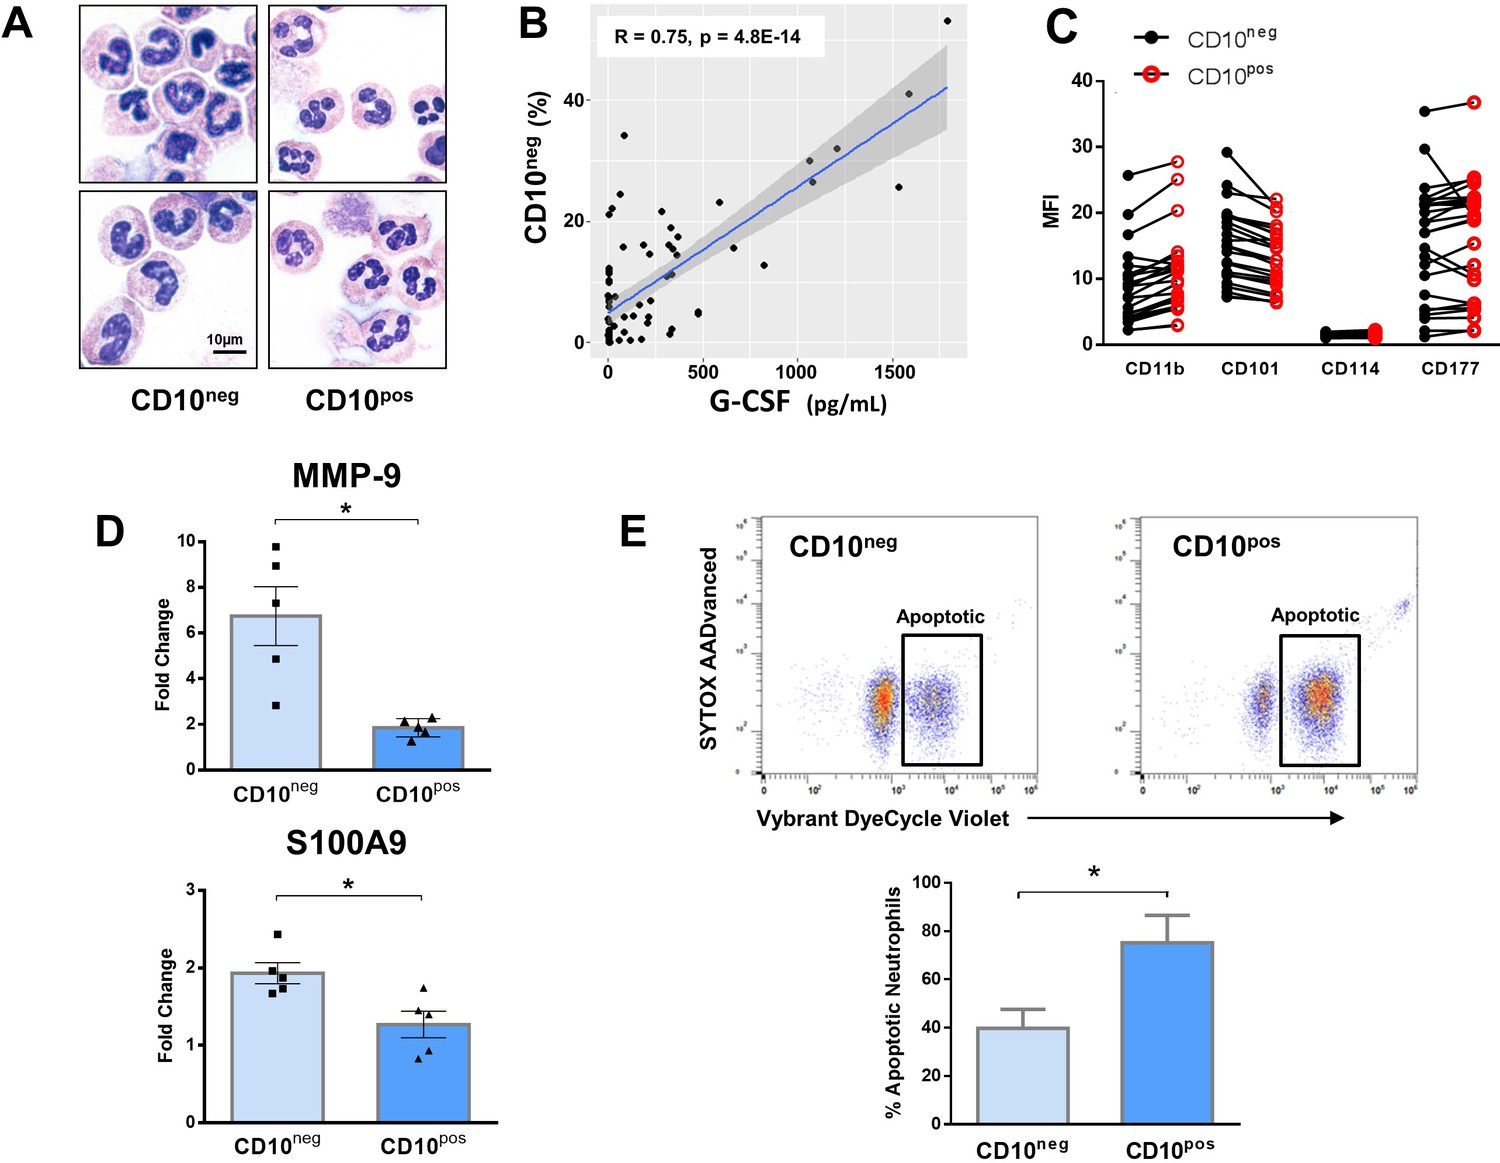
Immature CD10neg neutrophils from patients with AMI express high amounts of MMP-9 and S100A9 and display resistance to apoptosis.
(A) May-Grünwald Giemsa stained cytospin preparations of CD16+CD66b+CD10neg (CD10neg) and CD16+CD66b+CD10pos (CD10pos) neutrophils. (B) Linear regression analysis between the percentages of CD16+CD66b+CD10neg neutrophils and circulating levels of G-CSF in patients with acute coronary syndrome (n=71). (C) Mean fluorescence intensity (MFI) of CD11b, CD101, CD114, and CD177 on CD10neg versus CD10pos neutrophils (n=25). (D) Relative RNA expression of MMP-9 and S100A9 in CD10neg versus CD10pos neutrophils. (E) Percentage of apoptotic neutrophils assessed by flow cytometry using Vybrant DyeCycle Violet stain and SYTOX AADvanced stain. CD10neg/CD10pos neutrophils were isolated by flow-cytometric sorting from patients with AMI (n=4–5). *p<0.05.
Figure 4—figure supplement 1
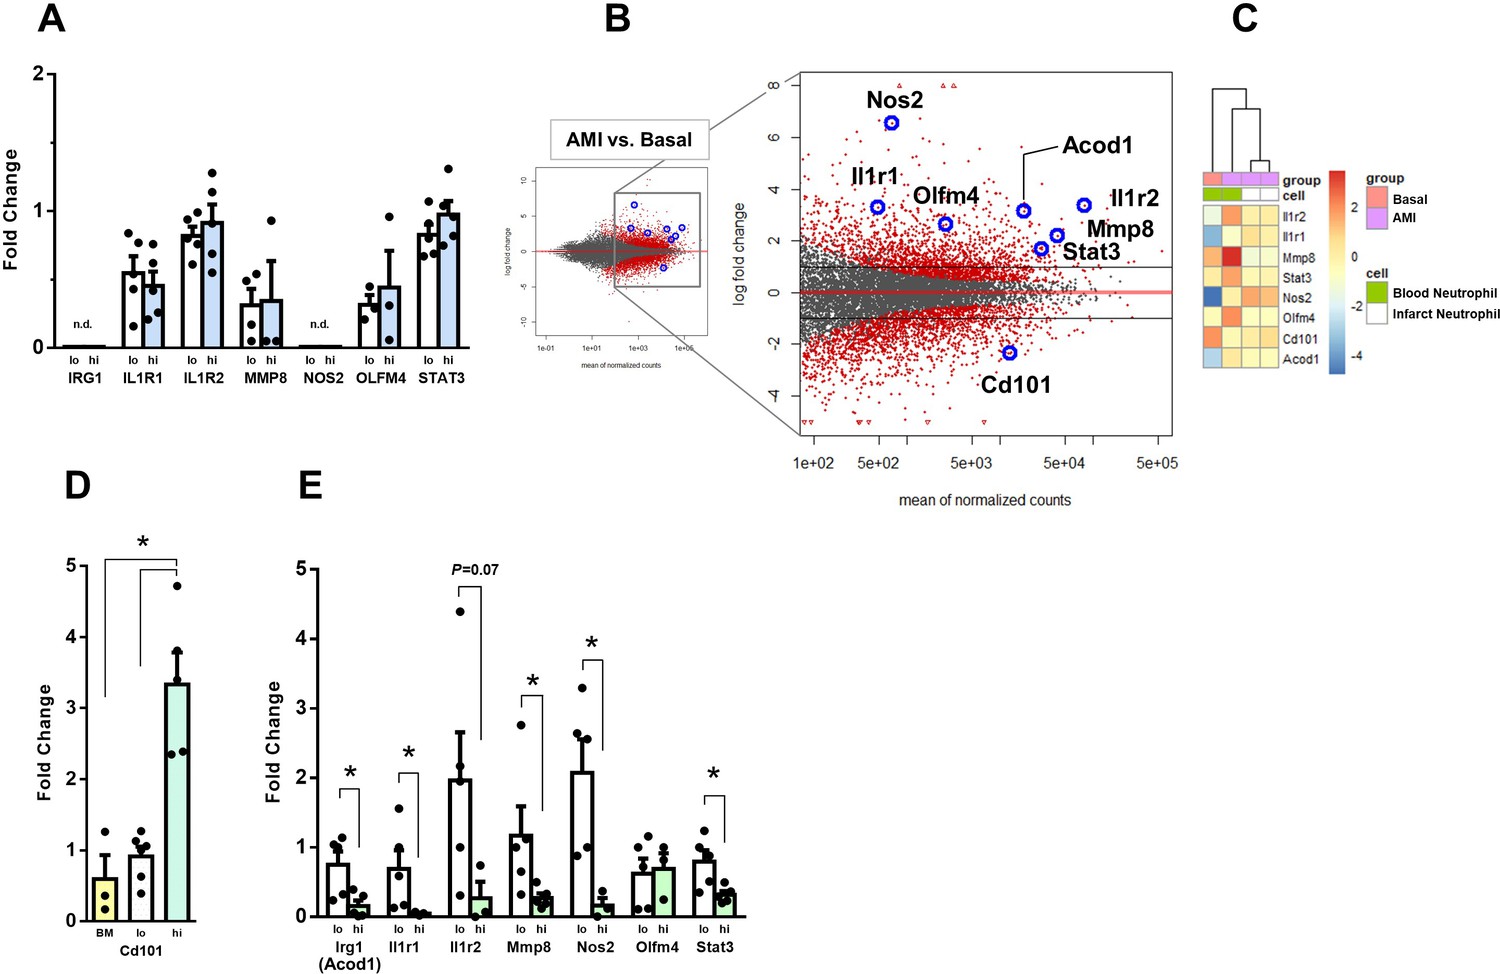
Expression of genes regulated in circulating neutrophils and infarct neutrophils in a mouse model of reperfused AMI.
(A) RT-qPCR showing the expression of IRG1, IL1R1, IL1R2, MMP8, NOS2, OLFM4, STAT3 in CD10neg (lo) versus CD10pos (hi) neutrophils FACS-sorted from blood of patients with AMI, (n=3–5); n.d., not detectable. (B) MA plots showing genes regulated in circulating neutrophils in a mouse model of reperfused AMI. RNA sequencing was performed on neutrophils FACS-sorted from blood of sham-operated mice (Basal) and mice subjected to 1 hr of coronary occlusion followed by 6 hr of reperfusion. Genes upregulated/downregulated by AMI in neutrophils were similarly regulated in (C) infarct neutrophils FACS–sorted from the ischemic region 24 hr after AMI. (D) RT-qPCR showing Cd101 expression in bone marrow CD101neg (BM) and peripheral blood CD101neg (lo) versus CD101pos (hi) neutrophils. (E) Expression of Irg1, Il1r1, Il1r2, Mmp8, Nos2, Olfm4, and Stat3 in circulating CD101neg (lo) versus CD101pos (hi) neutrophils. CD11bposLy6GposCD101neg (lo) and CD11bposLy6GposCD101pos (hi) cells were isolated by FACS sorting after AMI. (n=3–5). *p<0.05.
Figure 4—figure supplement 2
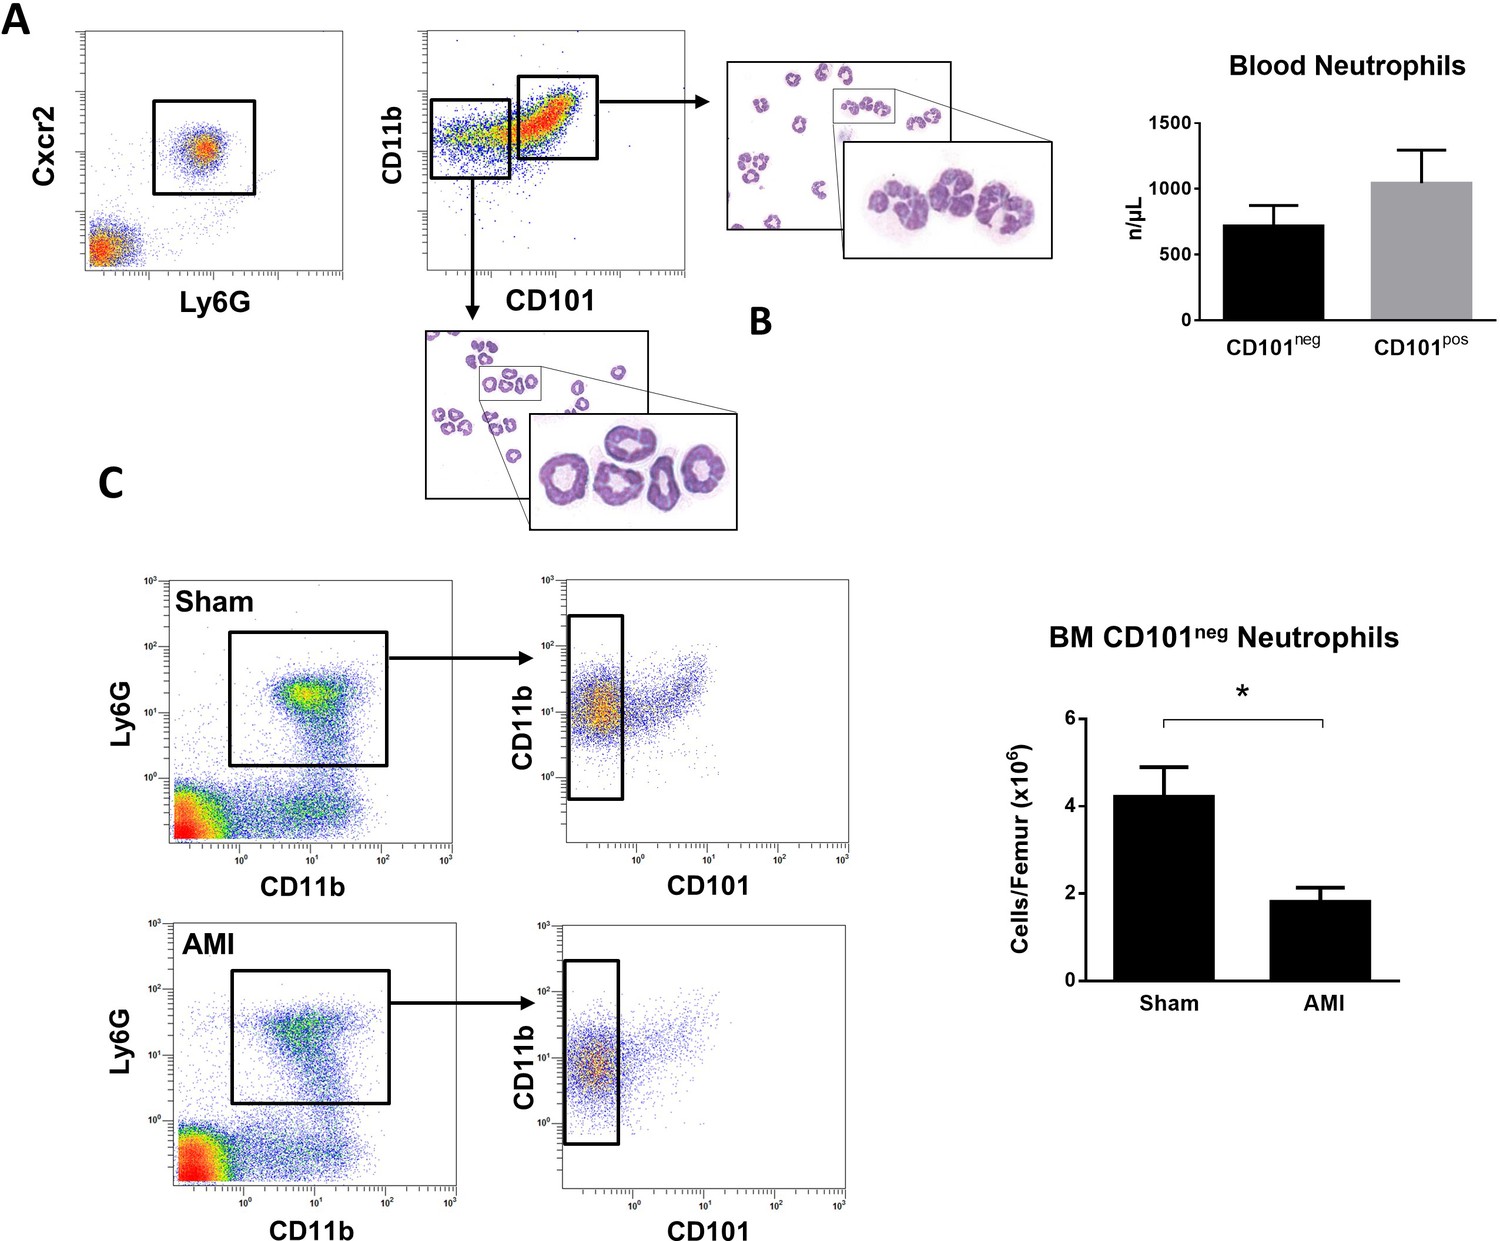
Immature CD101neg neutrophils are rapidly released into the bloodstream after reperfusion in a mouse model of AMI.
(A) Representative gating strategy to identify circulating immature neutrophils among CD11bposLy6GposCXCR2pos cells and number of CD11bdimCD101neg and CD11bbrightCD101pos neutrophils released into the bloodstream 90 min after reperfusion. (B) May-Grünwald Giemsa stained cytospin preparations of sorted CD11bdimCD101neg and CD11bbrightCD101pos neutrophils. (C) Flow cytometric analysis and number of CD101neg neutrophils in bone marrow from sham-operated mice (Sham) and mice subjected to coronary occlusion followed by 6 hr of reperfusion (AMI). Data are presented as mean ± SEM (n=3–4). *p<0.05.
Figure 4—figure supplement 3
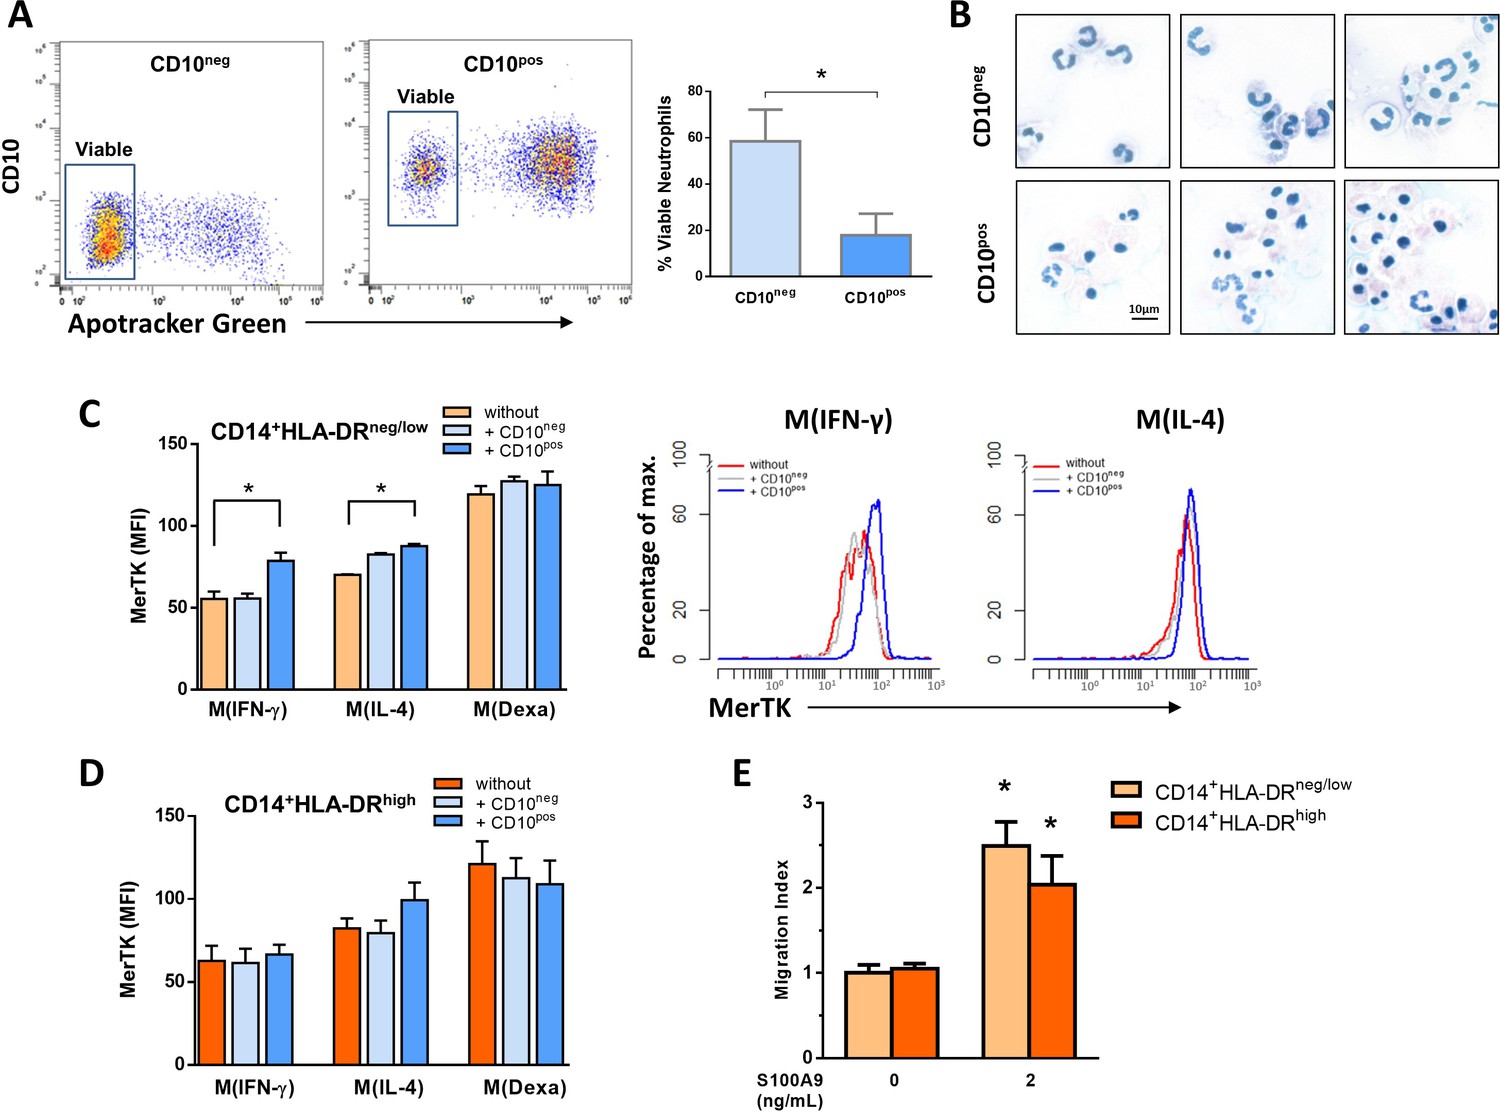
Interactions between CD10negneutrophils and CD14+HLA-DRneg/lowmonocytes.
(A) Percentage of live CD10neg/CD10pos neutrophils assessed by flow cytometry using Apotracker Green. Flow plots show a small number of apoptotic CD10neg neutrophils after 24 hr in vitro culture. (B) Wright-Giemsa stained cytospin preparations of CD10neg and CD10pos neutrophils after 24 hr in vitro culture. (C, D) Mean fluorescence intensity (MFI) of MerTK on CD14posCD163pos monocyte-derived macrophages. CD14+HLA-DRneg/low and CD14+HLA-DRhigh monocytes were differentiated to macrophages by 4‐day culture with M-CSF and stimulated with IFN-γ M(IFN-γ), IL-4 M(IL-4) and dexamethasone M(Dexa) in presence or absence of neutrophil supernatants from CD10neg neutrophils or CD10pos neutrophils. (E) Chemotactic response to human S100A9 of CD14+HLA-DRneg/low and CD14+HLA-DRhigh monocytes. CD10neg/CD10pos neutrophils and CD14+HLA-DRneg/low/CD14+HLA-DRhigh monocytes were isolated from patients with AMI (n=3–4). *p<0.05.
Figure 5

Multiple intercorrelations among CD10neg neutrophils, HLA-DRneg/low monocytes and immune-inflammation markers.
Spearman-correlation matrix of CD16+CD66b+CD10neg neutrophils (%), CD14+HLA-DRneg/low monocytes (%) and circulating levels of MMP-9, S100A9/S100A8, IL-6, IL-1ß, TNF-α, MPO, and NGAL (levels). UA (n=11), NSTEMI (n=10), and STEMI (n=26). Each circle illustrates a significant correlation between different couples of parameters (p<0.05). The correlation coefficient is colored and sized up according to the value; square leaved blank indicates not significant correlation.
Figure 6
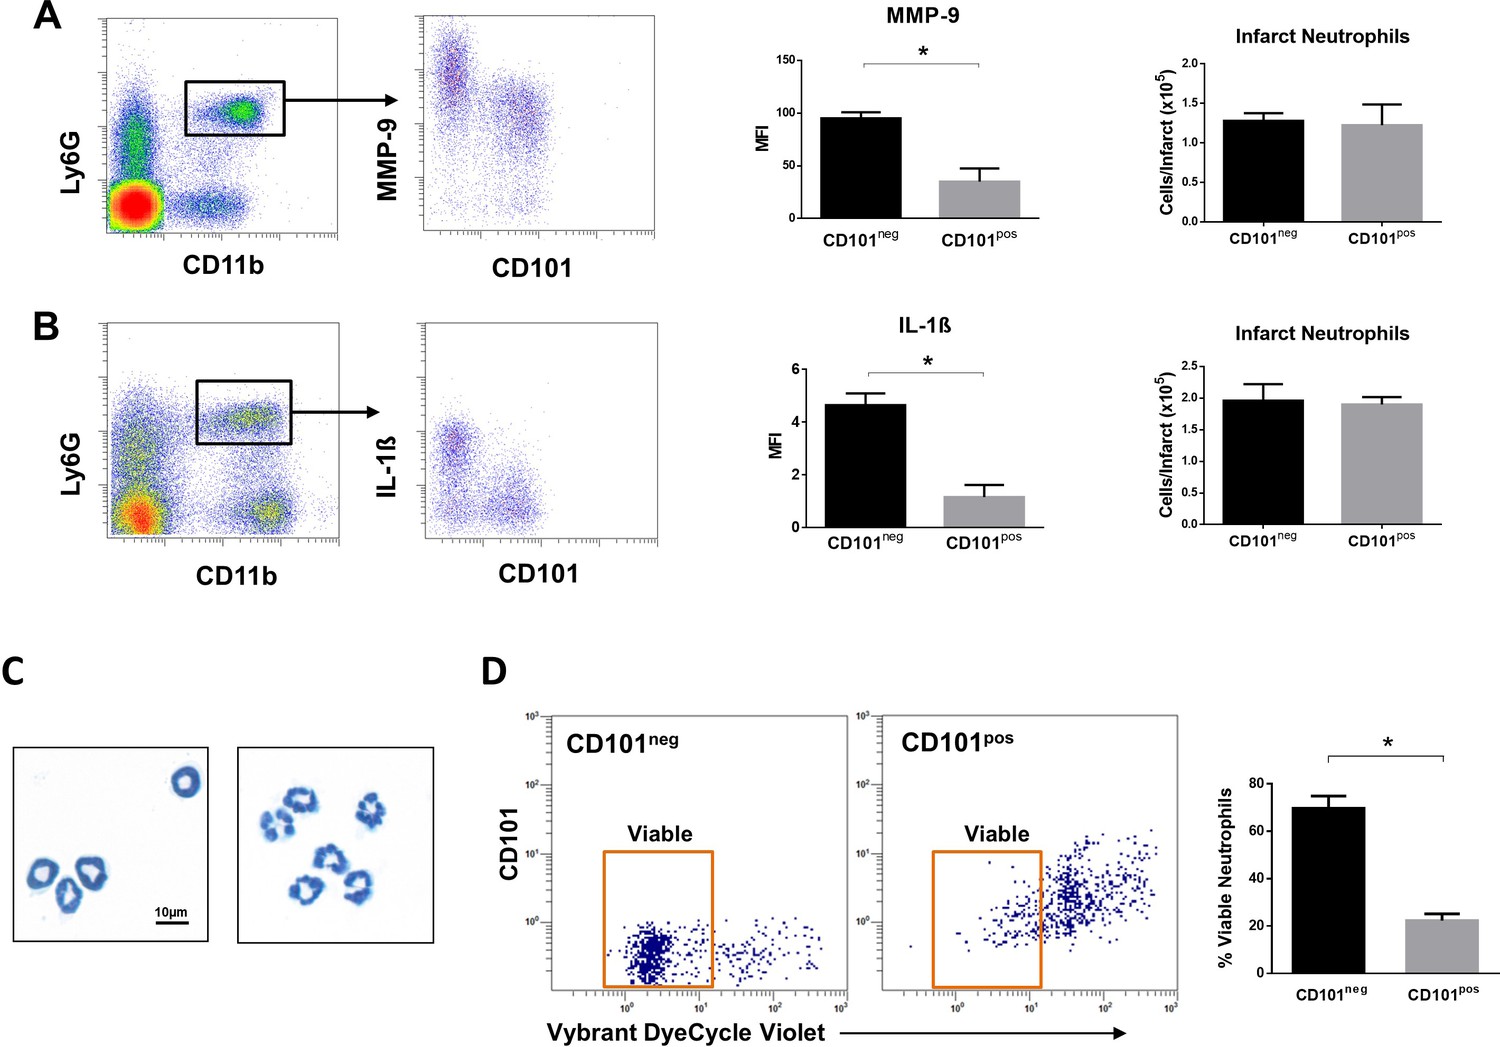
Immature CD101neg neutrophils are rapidly recruited to ischemic sites, are a major source of MMP-9 and IL-1ß in the reperfused myocardium and exhibit resistance to apoptosis.
(A) Flow cytometric gating strategy to identify neutrophils in the ischemic region, mean fluorescent intensity (MFI) of MMP-9 on CD101neg and CD101pos neutrophils, number of CD101neg and CD101pos neutrophils 3 hr after reperfusion. (B) Flow cytometry identifying infarct neutrophils, mean fluorescent intensity of IL-1ß on CD101neg and CD101pos neutrophils, number of CD101neg and CD101pos neutrophils 24 hr after reperfusion. (C) Wright-Giemsa stained cytospin preparations of CD101neg and CD101pos neutrophils isolated by cell sorting from ischemic myocardium 24 hr after reperfusion. (D) Rate of apoptosis of infarct CD101neg/CD101pos neutrophils determined by flow cytometry using Vybrant DyeCycle Violet stain after 24 hr in vitro culture. CD11bposLy6GposCD101neg (CD101neg) and CD11bposLy6GposCD101pos (CD101pos) cells were isolated by cell sorting from ischemic myocardium 24 hr after reperfusion. Data are presented as mean ± SEM (n=3–4). *p<0.05.
Figure 7
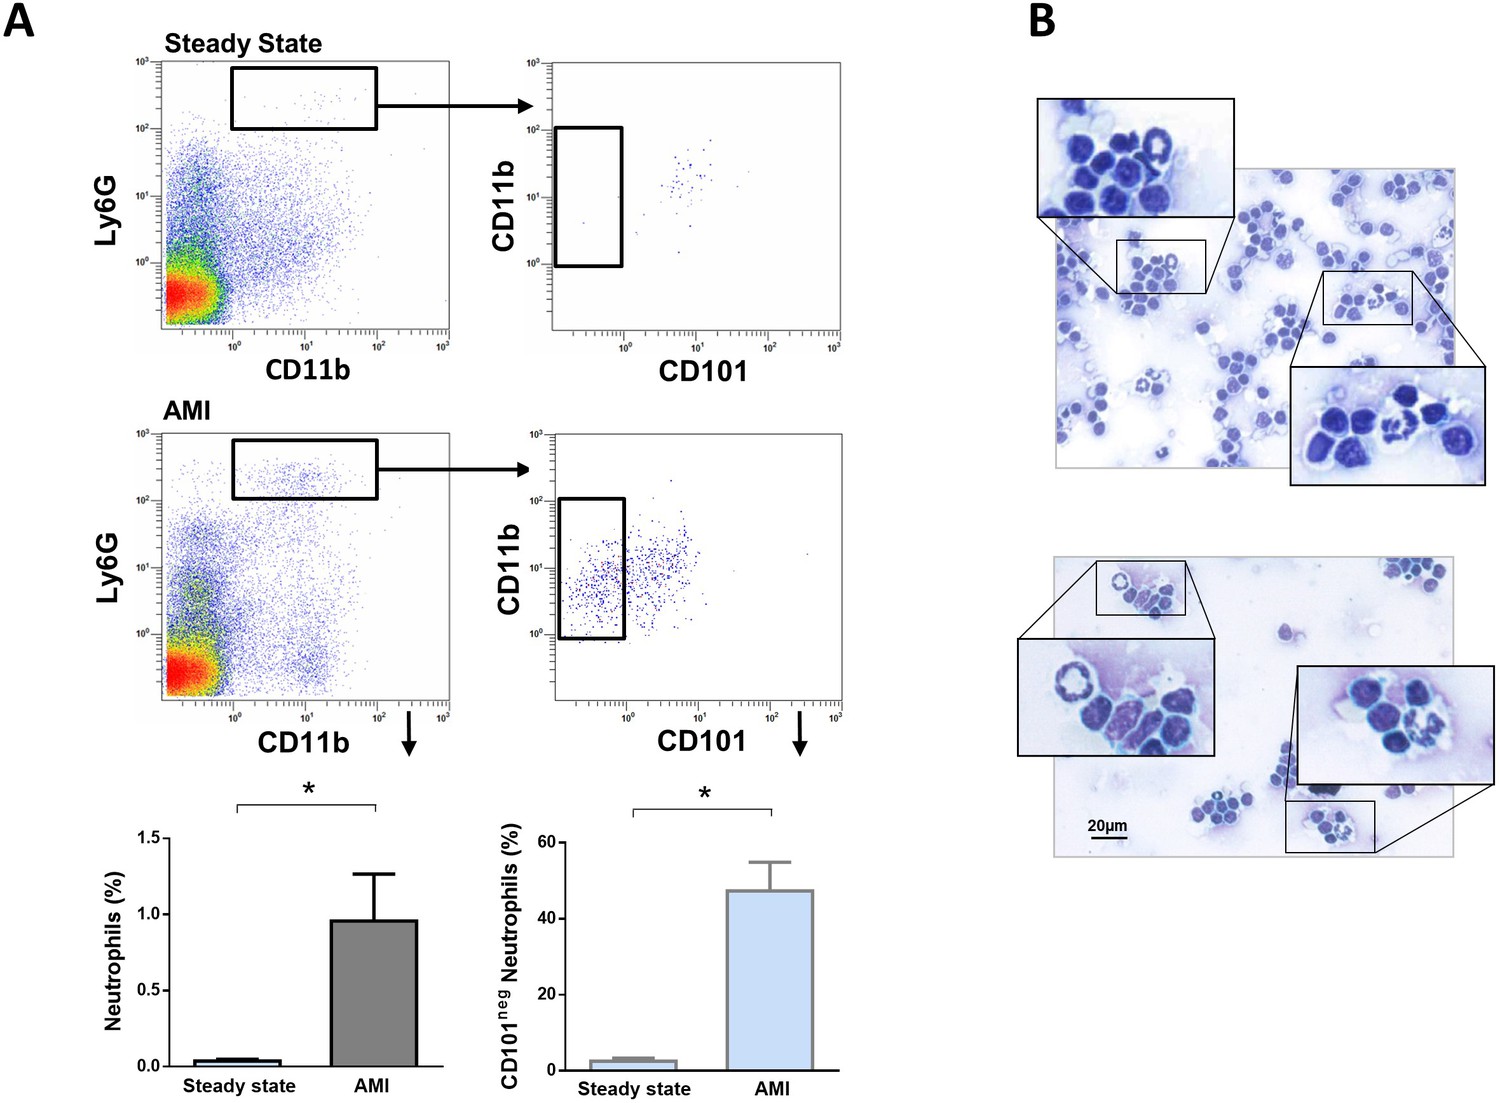
Immature CD101neg neutrophils are present in mediastinal lymph nodes draining the heart after acute MI.
(A) Flow cytometric analysis of neutrophil subsets in mediastinal lymph nodes at steady state and 3 hr after reperfusion (AMI). (B) Cytospins of mediastinal lymph node cell suspensions stained with Wright's Giemsa. Mice were subjected to 1 hr of coronary occlusion and heart-draining lymph nodes were isolated 3 hr after reperfusion. Data are presented as mean ± SEM (n=3). *p<0.05.
Figure 8 with 2 supplements
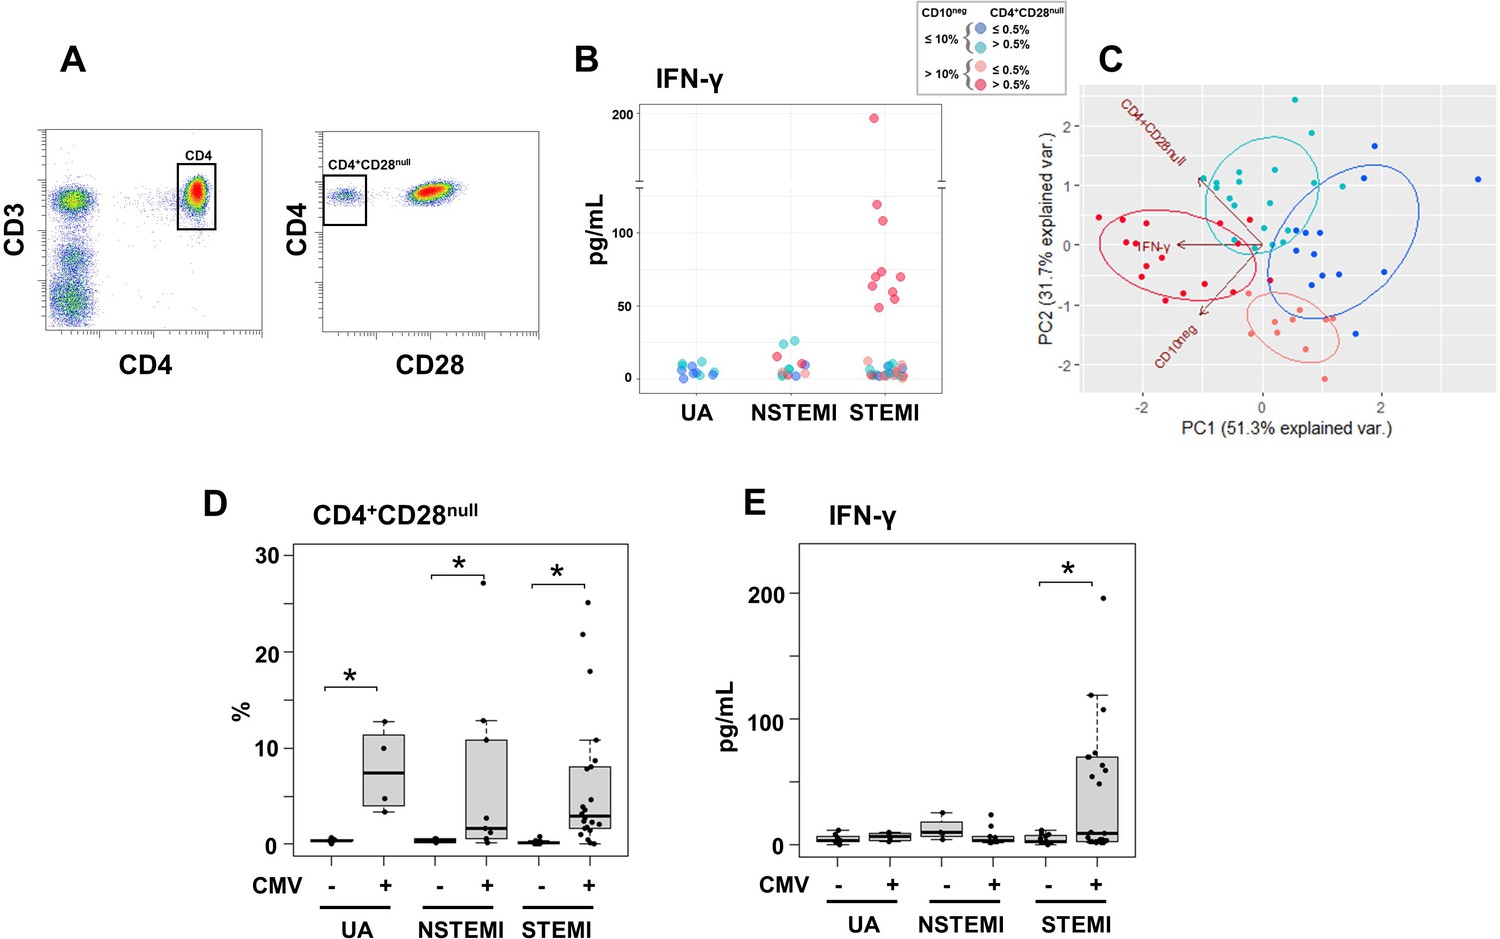
Elevated IFN-γ levels in patients with expanded CD10neg neutrophils and increased frequency of CD4+CD28null T-cells.
(A) Gating strategy identifying CD4+CD28null T-cells. (B) Scatter plot showing IFN-γ levels according to frequency of CD10neg neutrophils and CD4+CD28null T-cells. (C) Principal component analysis (PCA) showing clustering according to circulating levels of IFN-γ, CD10neg neutrophils and CD4+CD28null T-cells. Patients were stratified based on frequency of CD10neg neutrophils (≤10% or >10%) and frequency of CD4+CD28null T-cells (≤0.5% or >0.5%). (D) Frequency of CD4+CD28null T-cells in patients with acute coronary syndrome stratified according to cytomegalovirus (CMV) serostatus. (E) circulating IFN-γ levels stratified according to CMV serostatus. UA (n=11), NSTEMI (n=13), and STEMI (n=34). *p≤0.05.
Figure 8—figure supplement 1
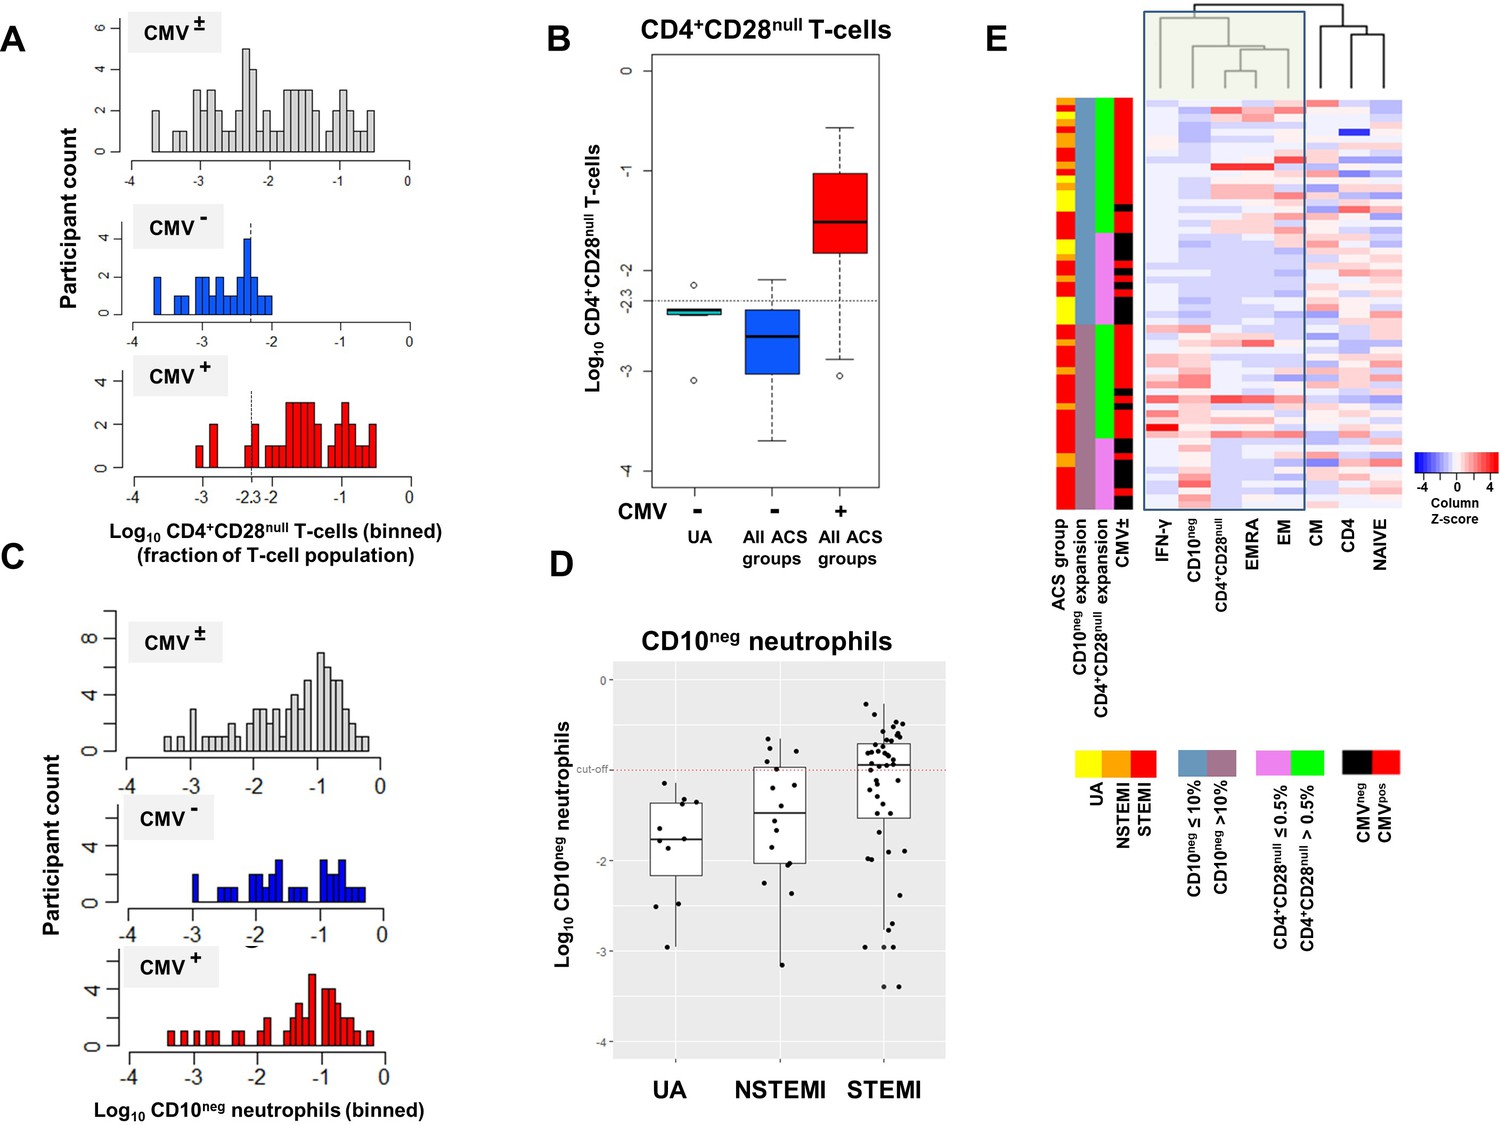
(A) CD4+CD28null T-cell frequency distribution (log10-transformed CD4+ T-cell fractions) of CMV± (top, n=58), CMV- (middle, n=23), and CMV+ (bottom, n=35) acute coronary syndrome (ACS) patients. CD4+CD28null T-cells displayed a bimodal distribution related to CMV-seropositivity. (B) Boxplots show the log10-transformed frequency of CD4+CD28null T-cells in CMV--UA, CMV- (blue) and CMV+ (red) -ACS patients. Expansion index (dotted line) was calculated as UQ+1.5xIQR of CMV--UA patients chosen as reference group. CD4+CD28null T-cell frequency more than 0.5% was considered as an index of expansion; UQ (upper quantile), IQR (inter-quantile range). (C) CD10neg neutrophils (CD10neg) frequency distribution (log10-transformed) of CMV± (top, n=71), CMV- (middle, n=31), and CMV+ (bottom, n=40) ACS patients. (D) Boxplots show the log10-transformed frequency of CD10neg in UA, NSTEMI and STEMI patients. Expansion index (dotted line) was calculated as UQ+1.5xIQR of UA patients. According, patients with CD10neg frequency more than 10% had expansion. (E) Scaled frequency of CD4+CD28null T-cells and CD10neg neutrophils stratified by criteria of cell expansion. Hierarchical clustering performed on columns highlights the relationship among CD10neg neutrophils, CD4+CD28null T-cells, IFN-γ production and CMV seropositivity.
Figure 8—figure supplement 2
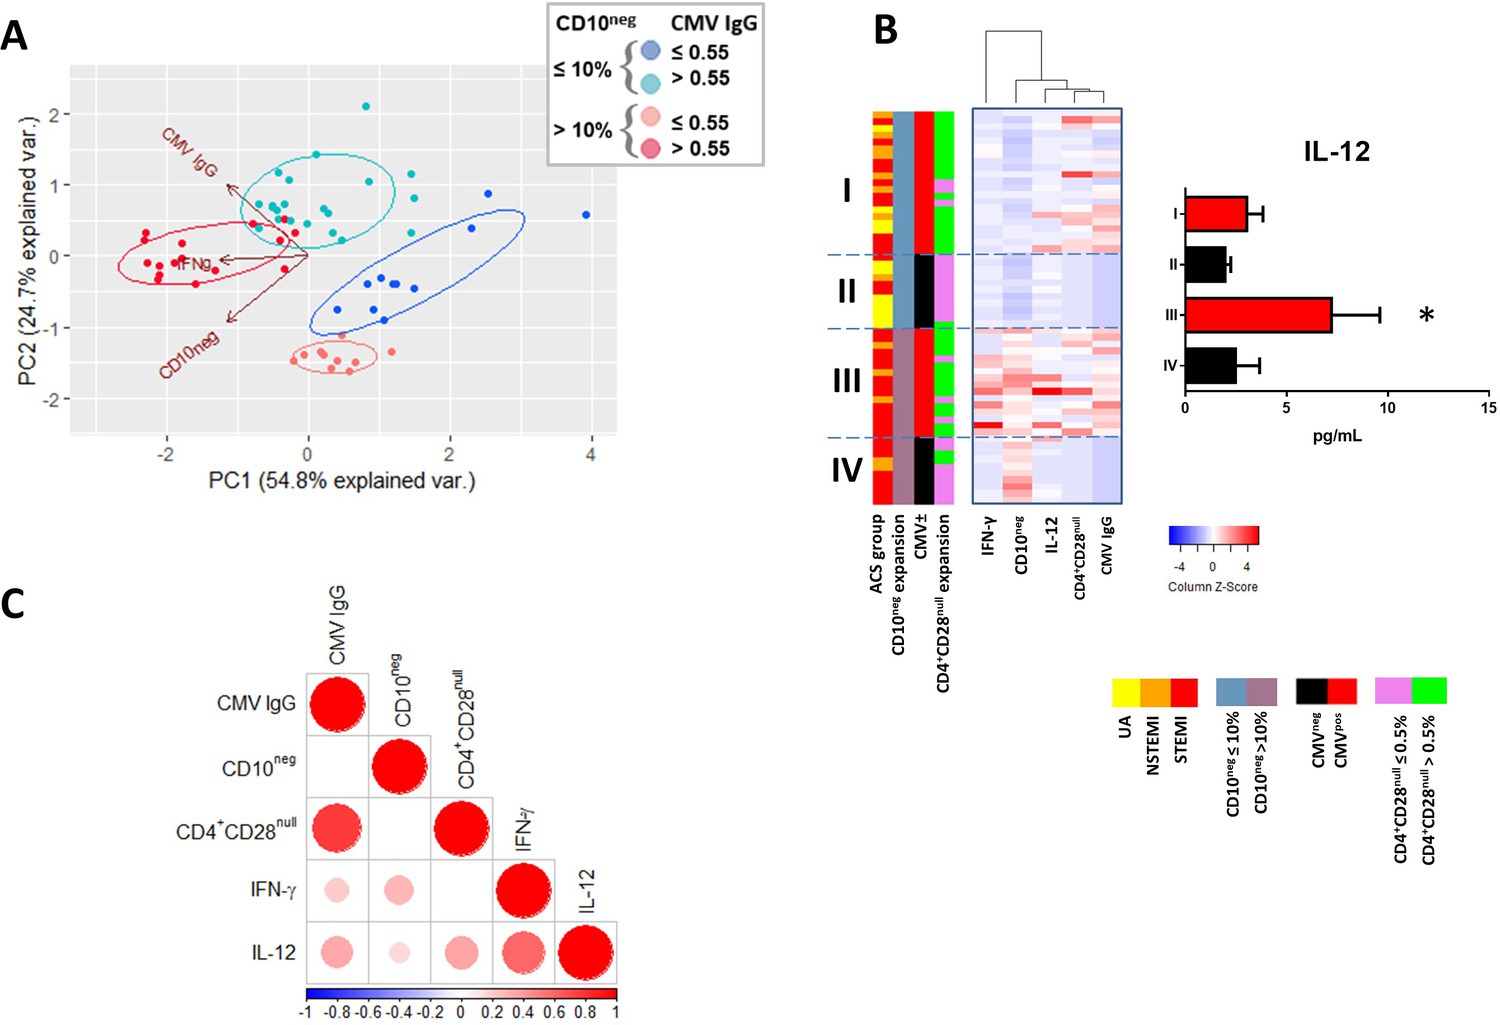
Relationship among the peripheral expansion of immature CD10neg neutrophils, CMV IgG titers, CD4+CD28null T-cells, and circulating levels of IFN-γ and IL-12 in patients with AMI.
(A) Principal component analysis (PCA) showing clustering according to circulating levels of IFN-γ, CD10neg neutrophils and CMV IgG titers. Patients were stratified based on frequency of CD10neg neutrophils (≤10% or >10%) and titer of CMV IgG (≤0.55 or >0.55 AU/mL). (B) Scaled frequency of CD10neg neutrophils stratified by criteria of cell expansion and scaled levels of CMV seropositivity. Hierarchical clustering performed on columns highlights the relationship among CD10neg neutrophils, CD4+CD28null T-cells, IFN-γ, IL-12 levels and CMV seropositivity. *p<0.05, IL-12 belonging to IIIrd vs. first, IInd, and IVth cluster. (C) Spearman-correlation matrix of CMV IgG titers (AU/mL), CD16+CD66b+CD10neg neutrophils (%), CD4+CD28null T-cells (%) and circulating levels of IFN-γ, and IL-12. Each circle illustrates a significant correlation between different couples of parameters (p<0.05). The correlation coefficient is colored and sized up according to the value; square leaved blank indicates not significant correlation.
Figure 9 with 1 supplement
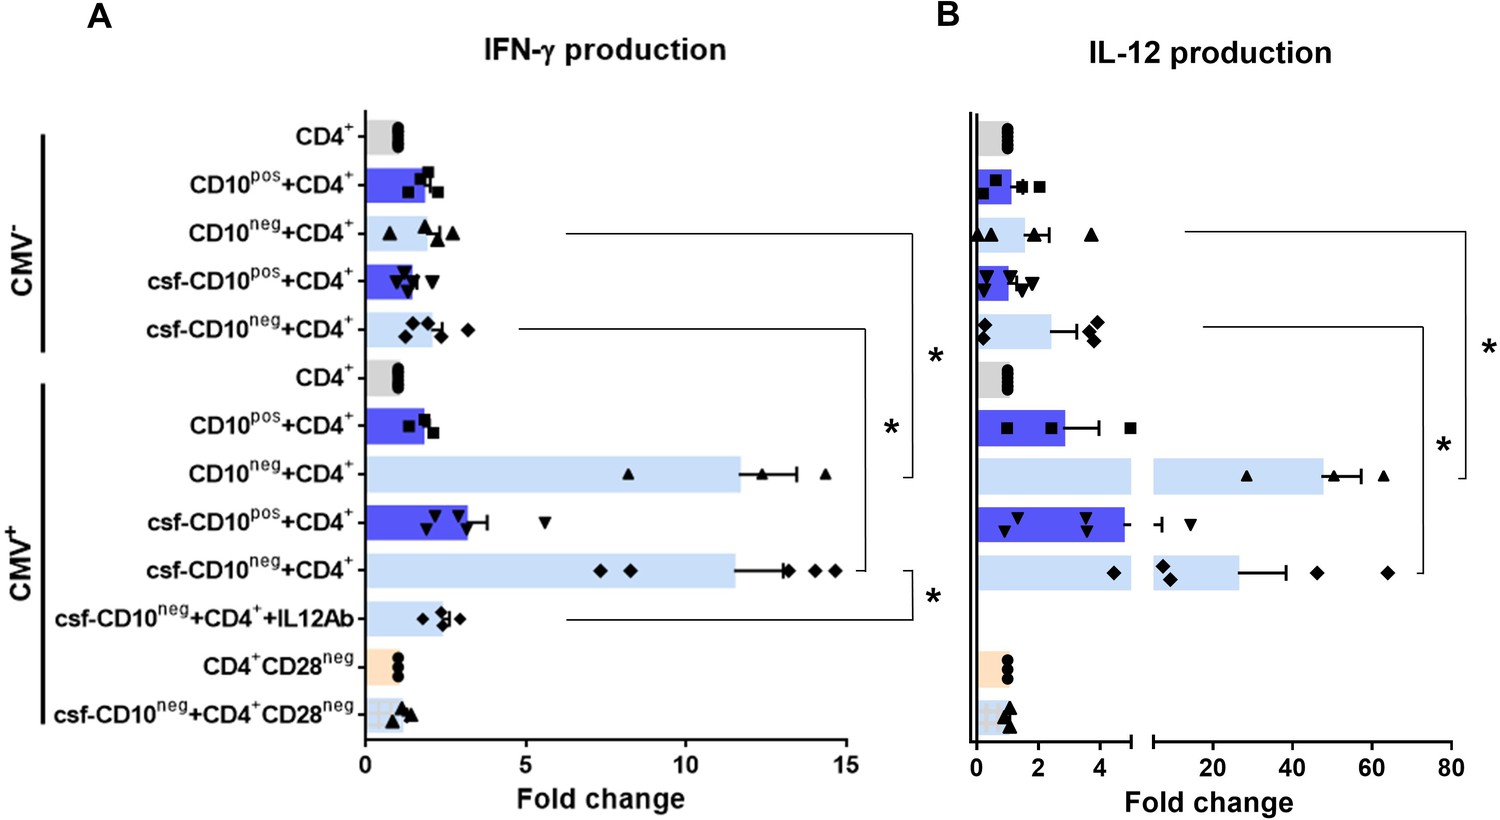
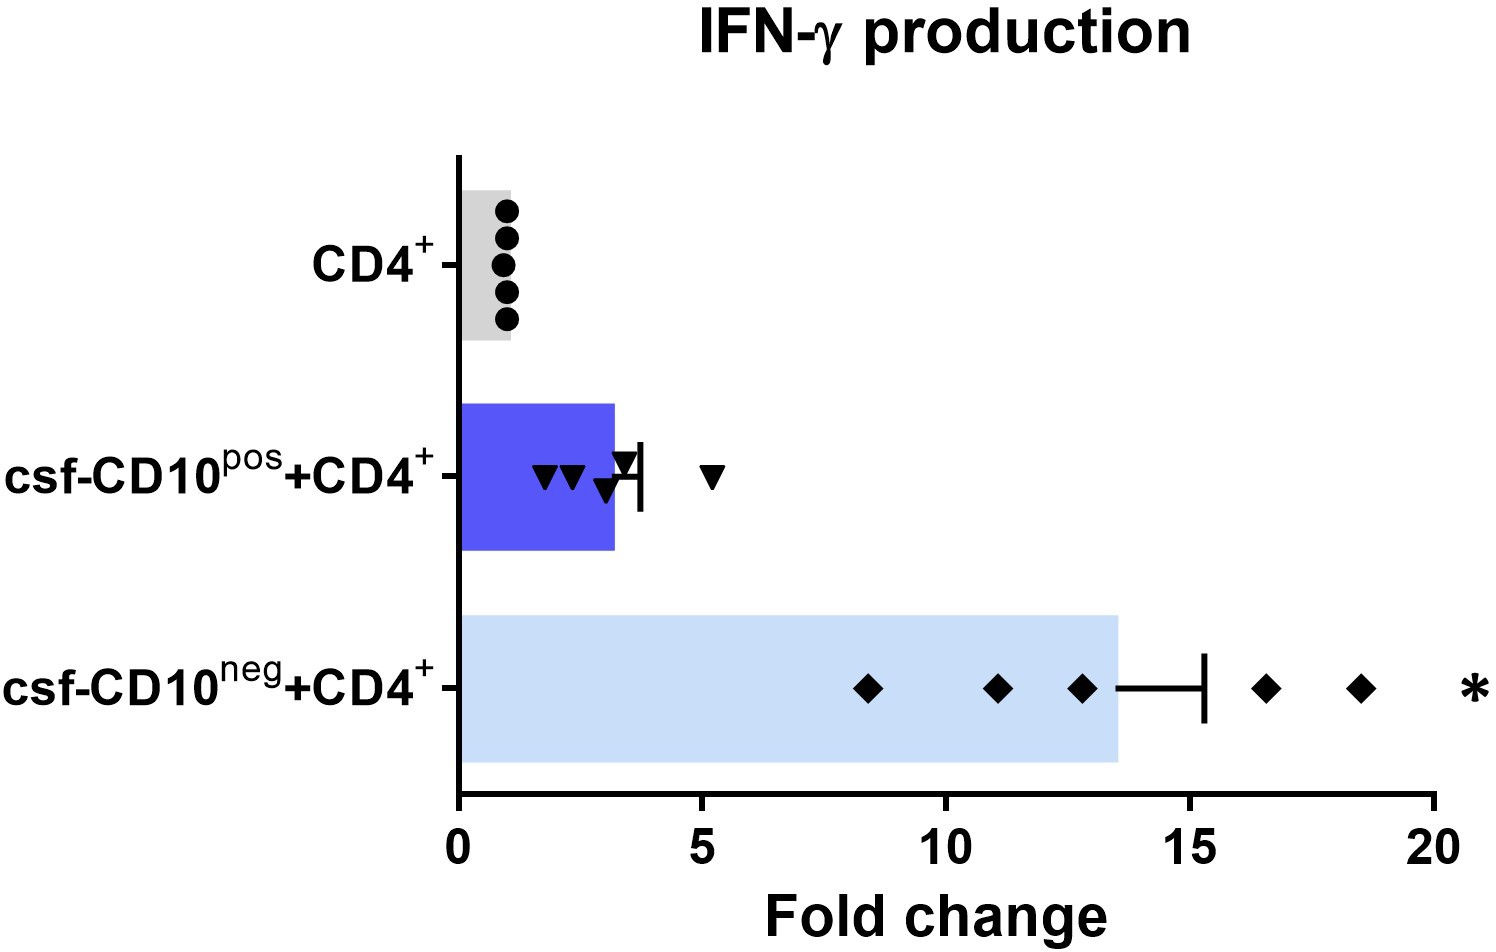
CD10neg neutrophils enhance IFN-γ production by CD4+ T-cells via induction of interleukin-12.
(A) IFN-γ and (B) interleukin-12 production by CD4+ T-cells stimulated with anti-CD3/CD28 beads and co-cultured for 24 hr in absence (CD4+) or presence of CD10pos neutrophils (CD10pos+CD4+), CD10neg neutrophils (CD10neg+CD4+) using a transwell system or cultured with cell-free supernatants derived from CD10pos neutrophils (csf-CD10pos+CD4+), CD10neg neutrophils (csf-CD10neg+CD4+), CD10neg neutrophils in the presence of neutralizing anti-IL-12 antibody (csf-CD10neg+CD4++IL12Ab). CD4+CD28null T-cells were stimulated with anti-CD3/CD28 beads (CD4+CD28neg) and cultured with cell-free supernatants derived from CD10neg neutrophils (csf-CD10neg+CD4+CD28neg). CD10neg/CD10pos neutrophils, CD4+ T-cells and CD4+CD28null T-cells were isolated from CMV-seronegative (CMV-) or CMV-seropositive (CMV+) patients with AMI (n=3–5). Data are represented as fold-change to respective CD3/CD28-stimulated cells and presented as mean ± SEM. *p≤0.05.
Figure 9—figure supplement 1
IFN-γ production by CD4+ T-cells from CMV-seropositive AMI patients stimulated with anti-CD3/CD28 beads and cultured for 24 hr in absence (CD4+) or presence of cell-free supernatants derived from CD10pos neutrophils (csf-CD10pos+CD4+) or CD10neg neutrophils (csf-CD10neg+CD4+).
D10neg/CD10pos neutrophils were isolated from CMV-seronegative patients with AMI. Data are represented as fold-change to respective CD3/CD28-stimulated cells. (n=5). *p<0.05 vs. CD4+, csf-CD10pos+CD4+.
Figure 10
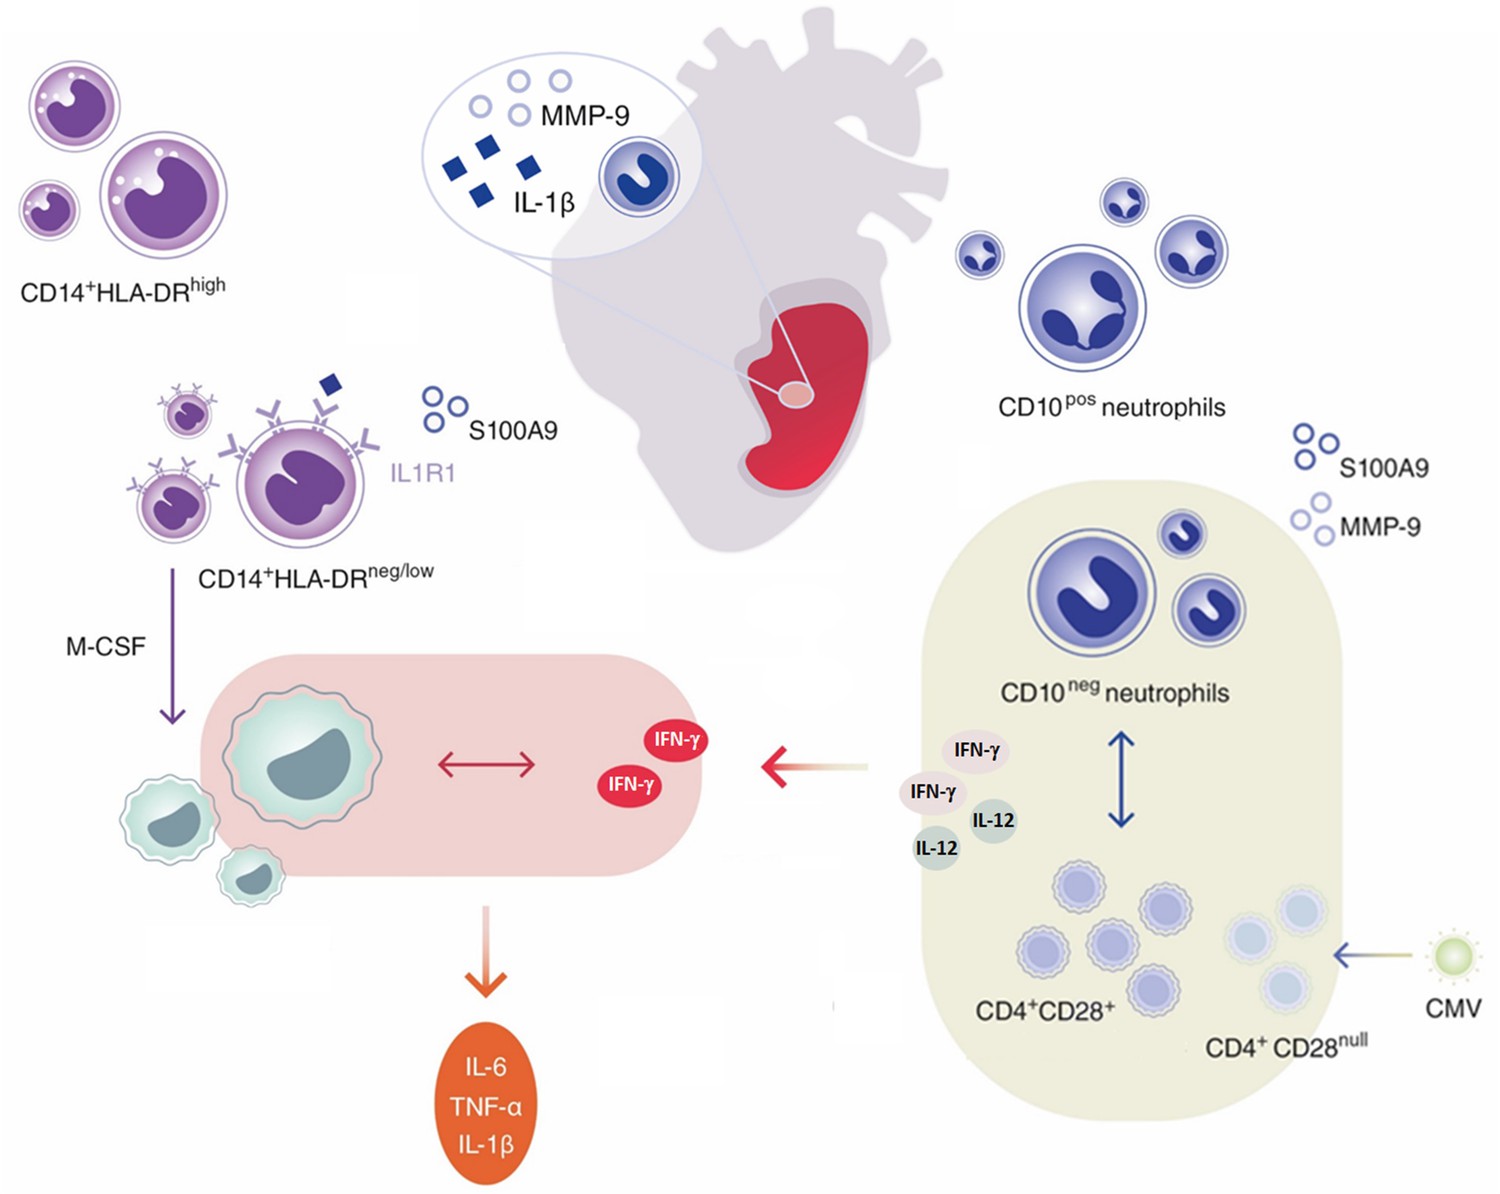
Immature CD10neg neutrophils and HLA-DRneg/low monocytes inducing proinflammatory and adaptive immune responses emerge in patients with large acute myocardial infarction.
Author response image 1
Tables
Table 1
General traits.
| UA (N=11) | NSTEMI (N=16) | STEMI (N=44) | ||
|---|---|---|---|---|
| Age (years) | 63.3±2.5 | 64.9±3.4 | 60.6±1.7 | |
| Gender | Male/Female | 9/2 | 14/2 | 36/8 |
| BMI (kg/m2) | 27.5±0.9 | 28.2±0.9 | 27.5±0.7 | |
| Blood analyses | LDL (mg/dL) | 92.2±19.2 | 95.5±9.5 | 138.2±7.3 |
| CK (IU/L) | 120.0 (87.0–444.0) | 189.0 (126.8–377.0) | 373.5 (110.5–931.2) | |
| CKmax (IU/L) | 120.0 (86.5–440.0) | 403.5 (150.5–578.2) | 1343.5 (574.8–1917.0) | |
| CK-MB (IU/L) | 19.0 (17.0–22.0) | 32.0 (23.5–57.0) | 47.0 (24.5–91.5) | |
| LVEF (%) | 53.3±3.7 | 54.1±2.2 | 51.0±1.5 | |
| Troponin (ng/L) | 12.8 (5.3–22.7) | 99.0 (36.7–273.5) | 337.0 (84.0–962.0) | |
| Creatinine (µmol/L) | 83.0±4.5 | 88.6±4.8 | 98.5±8.3 | |
| CRP (mg/L) | 1.6 (0.7–3.4) | 1.8 (1.1–4.3) | 2.5 (1.2–4.7) |
-
Data are presented as mean ± SEM or as median (IQR). LDL, low density lipoprotein; CK, creatine kinase; CKmax, maximum CK; CK-MB, creatine kinase-myocardial band; LVEF, left ventricular ejection fraction; CRP, C-reactive protein.
Table 2
Leukocyte count and monocyte subsets.
| CTR (N = 17) | UA (N=11) | NSTEMI (N=16) | STEMI (N=44) | p (K-W) | |
|---|---|---|---|---|---|
| Neutrophil (103/µL) | 3.25 (2.74–3.42) | 4.05 (3.65–4.56)* | 5.72 (4.80–7.79)*† | 6.13 (5.18–7.04)*† | <0.0001 |
| Monocyte (103/µL) | 0.65 (0.53–0.74) | 0.74 (0.49–0.80) | 0.88 (0.72–1.03)*† | 0.99 (0.77–1.25)*† | <0.001 |
| Lymphocyte (103/µL) | 2.20 (1.96–2.47) | 1.82 (1.55–1.98) | 1.97 (1.77–2.49) | 2.07 (1.58–2.64) | 0.30 |
| Lymphocyte/neutrophil ratio | 0.70 (0.57–0.79) | 0.45 (0.38–0.56)* | 0.32 (0.28–0.44)* | 0.35 (0.27–0.45)* | <0.0001 |
| Eosinophil (103/µL) | 0.16 (0.10–0.30) | 0.15 (0.12–0.16) | 0.21 (0.14–0.34) | 0.12 (0.06–0.20) | 0.08 |
| Classical monocyte (n/µL) | 476 (334–583) | 332 (244–388) | 510 (454–719)† | 505 (388–666)† | <0.05 |
| Intermediate monocyte (n/µL) | 130 (73–145) | 186 (131–367)* | 204 (144–310)* | 249 (167–442)* | <0.001 |
| Non-classical monocyte (n/µL) | 48 (30–64) | 50 (37–67) | 64 (47–108) | 102 (60–138)*† | <0.001 |
-
Data are presented as median (IQR). Kruskal-Wallis (K-W) test; *p<0.05 vs. Control (CTR); †p<0.05 vs. UA.
Table 3
Immune inflammation markers.
| UA (N=11) | NSTEMI (N=10) | STEMI (N=26) | p (K-W) | |
|---|---|---|---|---|
| MMP-9 (ng/mL) | 429 (320-461) | 447 (324-597) | 544 (466-758)* | <0.01 |
| S100A8/A9 (ng/mL) | 7332 (4638–9461) | 13802 (9152–21066)* | 17352 (8592–27830)* | <0.05 |
| NGAL (ng/mL) | 264 (198-318) | 328 (211-473) | 417 (312-653)* | <0.05 |
| MPO (ng/mL) | 221 (153-337) | 323 (158-443) | 389 (230-487)* | 0.05 |
| IL-6 (pg/mL) | 11.2 (9.2–21.1) | 30.6 (24.5–57.4)* | 47.7 (22.0–102.1)* | <0.01 |
| TNF-α (pg/mL) | 1.8 (1.3–15.7) | 4.6 (2.9–7.2) | 12.1 (5.0–21.8) | 0.14 |
| IL-1ß (pg/mL) | 2.4 (2.3–2.9) | 4.2 (2.4–7.9) | 10.0 (2.5–16.4)* | 0.05 |
-
Data are presented as median (IQR). Kruskal-Wallis (K-W) test; *p<0.05 vs. UA.
Table 4
CD4+ T-cells Subsets.
| UA (N=11) | NSTEMI (N=13) | STEMI (N=34) | p (K-W) | |
|---|---|---|---|---|
| NAIVE (n/µL) | 440 (338-511) | 497 (328-567) | 382 (312-627) | n.s. |
| CM (n/µL) | 300 (233-364) | 278 (242-328) | 334 (210-478) | n.s |
| EM (n/µL) | 122 (91-140) | 114 (86-137) | 102 (80-165) | n.s. |
| EMRA (n/µL) | 55 (30-77) | 42 (24-66) | 47 (29-109) | n.s. |
| CD4+CD28null (n/µL) | 4 (3–39) | 5 (4–28) | 10 (1-38) | n.s. |
-
Data are presented as median (IQR). NAIVE, CCR7+CD45RA+; CM, CCR7+CD45RA-; EM, CCR7-CD45RA-; EMRA, CCR7-CD45RA+. Kruskal-Wallis (K-W) test; n.s., not significant.
Appendix 1—key resources table
| Reagent type (species) or resource | Designation | Source or reference | Identifiers | Additional information |
|---|---|---|---|---|
| biological sample (Homo sapiens) | Peripheral Blood Leukocytes | Medizinische Hochschule Hannover | Freshly isolated from Human | |
| biological sample (Mus musculus) | Peripheral Blood, Heart, Lymph Node, Bone Marrow Leukocytes | Medizinische Hochschule Hannover | Freshly isolated from Mus musculus | |
| antibody | anti-human CD14-APC-H7 (Mouse monoclonal) | BD Biosciences | Cat# 560180 RRID:AB_1645464 | 1:50 |
| antibody | anti-human HLA-DR-FITC (Mouse monoclonal) | BioLegend | Cat# 307604 RRID:AB_314682 | 1:30 |
| antibody | anti-human HLA-DR-PE (Mouse monoclonal) | BioLegend | Cat# 307606 RRID:AB_314684 | 1:30 |
| antibody | anti-human HLA-DR-PerCP/Cy5.5 (Mouse monoclonal) | BioLegend | Cat# 307630 RRID:AB_893567 | 1:30 |
| antibody | anti-human CD16- BV605 (Mouse monoclonal) | BioLegend | Cat# 302040 RRID:AB_2562990 | 1:50 |
| antibody | anti-human CX3CR1-PE (Mouse monoclonal) | BioLegend | Cat# 341604 RRID:AB_1595456 | 1:50 |
| antibody | anti-human CCR2-PerCP/Cy5.5 (Mouse monoclonal) | BioLegend | Cat# 357204 RRID:AB_2562004 | 1:50 |
| antibody | anti-human CD66b-FITC (Mouse monoclonal) | BioLegend | Cat# 305104 RRID:AB_314496 | 1:30 |
| antibody | anti-human CD10-BV421 (Mouse monoclonal) | BioLegend | Cat# 312218 RRID:AB_2561833 | 1:20 |
| antibody | anti-human CD10-PE (Mouse monoclonal) | BioLegend | Cat# 312203 RRID:AB_314914 | 1:20 |
| antibody | anti-human CD3-APC-H7 (Mouse monoclonal) | BD Biosciences | Cat# 56076 RRID:AB_1645475 | 1:30 |
| antibody | anti-human CD4-APC (Mouse monoclonal) | BD Biosciences | Cat# 561840 RRID:AB_10895807 | 1:30 |
| antibody | anti-human CD28-BV421 (Mouse monoclonal) | BioLegend | Cat# 302930 RRID:AB_2561910 | 1:30 |
| antibody | anti-human CCR7-Alexa Fluor 488 (Mouse monoclonal) | BioLegend | Cat# 353206 RRID:AB_10916389 | 1:30 |
| antibody | anti-human CD45RA-PE (Mouse monoclonal) | BioLegend | Cat# 304108 RRID:AB_314412 | 1:30 |
| antibody | anti-human CD114-PE (Mouse monoclonal) | BioLegend | Cat# 346106 RRID:AB_2083867 | 1:25 |
| antibody | anti-human CD177-FITC (Mouse monoclonal) | BioLegend | Cat# 315804 RRID:AB_2072603 | 1:25 |
| antibody | anti-human CD11b-PerCP/Cy5.5 (Mouse monoclonal) | BioLegend | Cat# 301328 RRID:AB_10933428 | 1:25 |
| antibody | anti-human CD101-PE (Mouse monoclonal) | BioLegend | Cat# 331011 RRID:AB_2716106 | 1:25 |
| antibody | anti-human MERTK-APC (Mouse monoclonal) | BioLegend | Cat# 367612 RRID:AB_2687289 | 1:25 |
| antibody | anti-human CD163-FITC (Mouse monoclonal) | BD Biosciences | Cat# 563697 RRID:AB_2738379 | 1:25 |
| antibody | anti-IL-12 | R and D Systems | Cat# MAB219 RRID:AB_2123616 | 4 µg/mL |
| antibody | Isotype control | R and D Systems | Cat# MAB002 RRID:AB_357344 | 4 µg/mL |
| antibody | CD16/CD32 Mouse BD Fc Block RUO (Rat monoclonal) | BD Biosciences | Cat# 553142 RRID:AB_394657 | 1:50 |
| antibody | anti-mouse CD45-PerCP/Cy5.5 (Mouse monoclonal) | BioLegend | Cat# 109828 RRID:AB_893350 | 1:100 |
| antibody | anti-mouse CD45-PerCP/Cy5.5 (Rat monoclonal) | BD Biosciences | Cat# 550994 RRID:AB_394003 | 1:100 |
| antibody | anti-mouse F4/80-BV421 (Rat monoclonal) | BD Biosciences | Cat# 565411 RRID:AB_2734779 | 1:100 |
| antibody | anti-mouse F4/80-APC (Rat monoclonal) | BioLegend | Cat# 123116 RRID:AB_893481 | 1:100 |
| antibody | anti-mouse CD11b-Super Bright 600 (Rat monoclonal) | eBioscience | Cat# 63-0112-82 RRID:AB_2637408 | 1:100 |
| antibody | anti-mouse CD11b- PerCP/Cy5.5 (Rat monoclonal) | BD Biosciences | Cat# 550993 RRID:AB_394002 | 1:100 |
| antibody | anti-mouse CD4-Alexa Fluor 488 (Rat monoclonal) | BioLegend | Cat# 100423 RRID:AB_389302 | 1:100 |
| antibody | anti-mouse CD115-Brilliant Violet 605 (Rat monoclonal) | BioLegend | Cat# 135517 RRID:AB_2562760 | 1:100 |
| antibody | anti-mouse CD115-Alexa Fluor 488 (Rat monoclonal) | BioLegend | Cat# 135512 RRID:AB_11218983 | 1:100 |
| antibody | anti-mouse Ly-6G-APC (Rat monoclonal) | BioLegend | Cat# 127613 RRID:AB_1877163 | 1:100 |
| antibody | anti-mouse Ly-6G-PE (Rat monoclonal) | BD Biosciences | Cat# 551461 RRID:AB_394208 | 1:200 |
| antibody | anti-mouse Ly-6G-APC-H7 (Rat monoclonal) | BD Biosciences | Cat# 565369 RRID:AB_2739207 | 1:100 |
| antibody | anti-mouse CXCR2-Alexa Fluor 647 (Mouse monoclonal) | BioLegend | Cat# 149604 RRID:AB_2565563 | 1:100 |
| antibody | anti-mouse CXCR2-PE (Rat monoclonal) | BioLegend | Cat# 149609 RRID:AB_2565689 | 1:100 |
| antibody | anti-mouse CD101-Alexa Fluor 647 (Rat monoclonal) | BD Biosciences | Cat# 564473 RRID:AB_2738821 | 1:100 |
| antibody | anti-mouse CD101-PE (Rat monoclonal) | eBioscience | Cat# 12-1011-80 RRID:AB_1210729 | 1:100 |
| antibody | anti-MMP-9 (Goat polyclonal) | R and D Systems | Cat# AF909 RRID:AB_355706 | 1:100 |
| antibody | anti IL-1ß (Rabbit polyclonal) | Abcam | Cat# ab9722 RRID:AB_308765 | 1:100 |
| antibody | anti-goat IgG (H+L) Cross-Adsorbed Secondary Antibody Alexa Fluor 488 (Donkey polyclonal) | Invitrogen | Cat# A-11055 RRID:AB_2534102 | 1:500 |
| antibody | anti-rabbit IgG (H+L) Highly Cross-Adsorbed Secondary Antibody Alexa Fluor 488 (Goat polyclonal) | Invitrogen | Cat# A-11034 RRID:AB_2576217 | 1:500 |
| commercial assay or kit | MACSxpress Whole Blood Neutrophil Isolation | Miltenyi Biotec | Cat# 130-104-434 | |
| commercial assay or kit | PrepEase RNA Spin | Affymetrix | Cat# PN78766 | |
| commercial assay or kit | RNeasy Plus Mini | QIAGEN | Cat# 74134 | |
| commercial assay or kit | Dynabeads Untouched Human T-cells | Invitrogen | Cat# 11344D | |
| commercial assay or kit | CellTrace Violet Cell Proliferation | Invitrogen | Cat# C34571 | |
| commercial assay or kit | OpTmizer CTS T-Cell Expansion | Gibco | Cat# A1048501 | |
| commercial assay or kit | Dynabeads Human T-Activator CD3/CD28 | Gibco | Cat# 11131D | |
| commercial assay or kit | VybrantDyeCycle Violet/SYTOX AADvanced Apoptosis | Invitrogen | Cat# A35135 | |
| commercial assay or kit | Apotracker Green | Biolegend | Cat# 427402 | |
| commercial assay or kit | MojoSort Human CD4 T Cell Isolation | BioLegend | Cat# 480009 | |
| commercial assay or kit | CD28 MicroBead | Miltenyi Biotec | Cat# 130-093-247 | |
| commercial assay or kit | LEGENDplex | BioLegend | Cat# 740180 | |
| commercial assay or kit | LEGENDplex | BioLegend | Cat# 740589 | |
| commercial assay or kit | LEGENDplex | BioLegend | Cat# 740929 | |
| commercial assay or kit | CMV-IgG-ELISA PKS | Medac Diagnostika | Cat# 115-Q-PKS | |
| commercial assay or kit | Human IFN-gamma Quantikine ELISA | R and D Systems | Cat# DIF50 | |
| commercial assay or kit | iScript Reverse Transcription Supermix | Bio-Rad | Cat# 1708840 | |
| commercial assay or kit | SsoAdvanced Universal SYBR Green Supermix | Bio-Rad | Cat# 172–5271 | |
| chemical compound, drug | VersaLyse Lysing Solution | Beckman Coulter | Cat# A09777 | |
| chemical compound, drug | Ficoll-Paque Premium | SIGMA | Cat# GE17-5442-02 | |
| chemical compound, drug | ß-mercaptoethanol | Sigma Aldrich | Cat# 63689 | |
| chemical compound, drug | Heat Inctivated Fetal Bovin Serum | Gibco | Cat# A3840001 | |
| chemical compound, drug | May Grünwald Stain Solution | Polysciences | Cat# 24981–1 | |
| chemical compound, drug | May Grünwald Giemsa Phosphate Buffer | Polysciences | Cat# 25032–1 | |
| chemical compound, drug | Wright Giemsa Stain Solution | Polysciences | Cat# 24985–1 | |
| chemical compound, drug | Wright Giemsa Stain Phosphate Buffer | Polysciences | Cat# 24984–1 | |
| chemical compound, drug | Wright-Giemsa Stain Set | Astral Diagnostics | Cat# 5585 | |
| chemical compound, drug | Recombinant Human M-CSF Protein | R and D Systems | Cat# 216-MC-005 | 20 ng/mL |
| chemical compound, drug | Recombinant Human IFN-gamma Protein | R and D Systems | Cat# 285-IF | 20 ng/mL |
| chemical compound, drug | Recombinant Human IL-4 | Miltenyi Biotec | Cat# 130-093-920 | 20 ng/mL |
| chemical compound, drug | Dexamethasone | Sigma Aldrich | Cat# D1756 | 1 µM |
| chemical compound, drug | PenStrep | Gibco | Cat# 15140122 | |
| chemical compound, drug | L-Glutamine | Gibco | Cat#25030081 | |
| chemical compound, drug | Human S100A9 | Invitrogen | Cat# A42590 | 2 ng/mL |
| chemical compound, drug | RBC Lysis Buffer | BioLegend | Cat# 420301 | |
| chemical compound, drug | Liberase | Roche Diagnostics | Cat# 5466202001 | |
| chemical compound, drug | Cytofix/Cytoperm Fixation/Permeabilization Kit | BD Biosciences | Cat# 554714 | |
| other | ChemoTxDisposable Chemotaxis System | Neuro Probe | Cat# NRP-106–8 | |
| other | Transwell Inserts | Thermo Scientific | Cat# 140620 |
Additional files
Download links
A two-part list of links to download the article, or parts of the article, in various formats.
Downloads (link to download the article as PDF)
Open citations (links to open the citations from this article in various online reference manager services)
Cite this article (links to download the citations from this article in formats compatible with various reference manager tools)
Expansion of CD10neg neutrophils and CD14+HLA-DRneg/low monocytes driving proinflammatory responses in patients with acute myocardial infarction
eLife 10:e66808.
https://doi.org/10.7554/eLife.66808


