Visualizing synaptic plasticity in vivo by large-scale imaging of endogenous AMPA receptors
- Department of Neuroscience, Johns Hopkins University School of Medicine, United States
- Kavli Neuroscience Discovery Institute, United States
- Center for Imaging Science, Johns Hopkins University School of Engineering, United States
- Department of Biomedical Engineering, Johns Hopkins University, United States
Figures
Figure 1 with 2 supplements
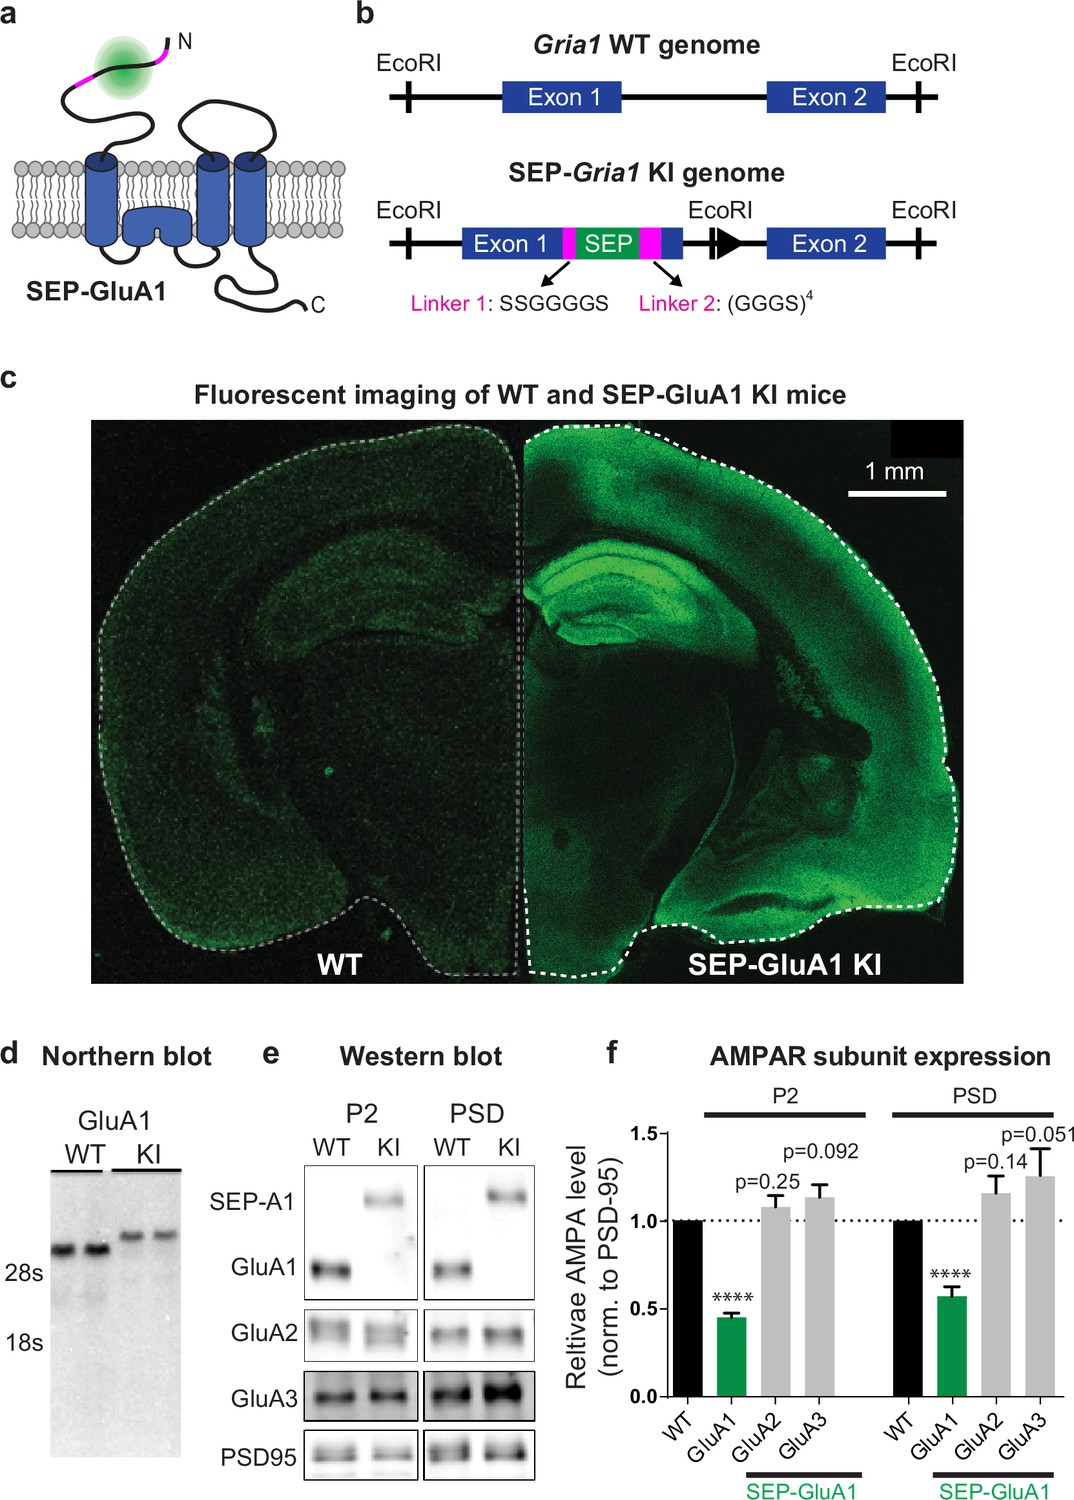
Generation and biochemical characterization of SEP-GluA1 knockin (KI) mouse line.
(a) SEP tag (green) was targeted to extracellular N-terminus of GluA1 AMPARs (blue), enabling visualization of only the functional complement of AMPARs on the cell surface. SEP-GluA1 linkers depicted in magenta. (b) Schematic of genetic locus of SEP tag on exon 1, within the Gria1 gene encoding GluA1. Two linkers flank the SEP insert. (c) Live, confocal image of acute slice of SEP-GluA1. Note the bright fluorescent signal throughout hippocampus and neocortex, indicating widespread expression of SEP-labeled GluA1-containing AMPARs. Age- and coronal region-matched wild-type (WT) tissue was imaged with the same laser power and presented with identical contrast as SEP-GluA1. (d) Representative northern blot of mRNA expression of WT and SEP-GluA1 KI mice. SEP-GluA1 is noticeably larger than WT GluA1 due to the inclusion of the SEP tag. (e, f) Representative western blot and quantification of AMPA receptor subunit expression in hippocampus after normalization to PSD95 in the P2 and postsynaptic density (PSD) fractions of WT and SEP-GluA1 mice. GluA1 expression is reduced relative to WT (n = 7; ****p<0.0001, Student’s t-test). Full, uncropped blots of all bands can be found in Figure 1—source data 1.
-
Figure 1—source data 1
Uncropped images of western blots used to display representative bands in Figure 1e.
Blots were stained for GluA1 (top left), GluA2 (bottom left), GluA3 (top right), and PSD-95 (bottom right). Lanes corresponding to homozygous SEP-GluA1 (HM), heterozygous SEP-GluA1 (Het), and wild-type C57BL6 (WT) mice are indicated, for both the P2 and postsynaptic density (PSD) fractions. Size ladder is indicated in magenta. Black boxes indicate cropped regions of representative blots in Figure 1e.
- https://cdn.elifesciences.org/articles/66809/elife-66809-fig1-data1-v2.pdf
-
Figure 1—source data 2
Original files of western blots used to display representative bands stained for GluA1 and GluA3 in Figure 1e.
- https://cdn.elifesciences.org/articles/66809/elife-66809-fig1-data2-v2.zip
-
Figure 1—source data 3
Original files of western blots used to display representative bands stained for GluA2 and PSD-95 in Figure 1e.
- https://cdn.elifesciences.org/articles/66809/elife-66809-fig1-data3-v2.zip
-
Figure 1—source data 4
Quantification of Western blots.
- https://cdn.elifesciences.org/articles/66809/elife-66809-fig1-data4-v2.xlsx
Figure 1—figure supplement 1
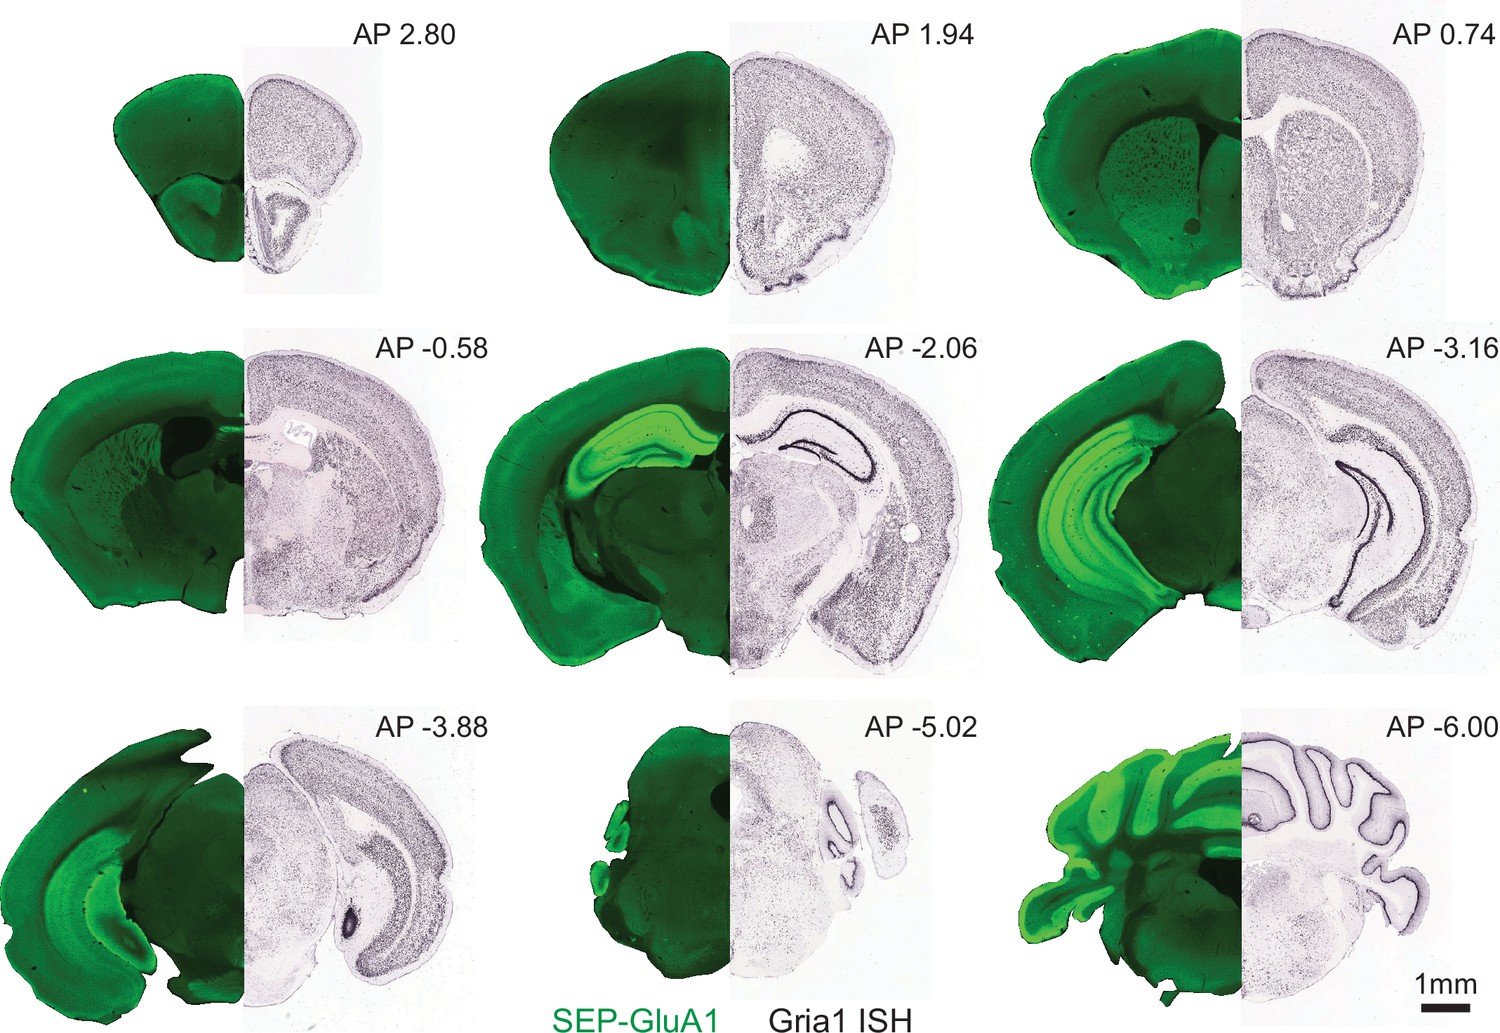
Expression atlases of SEP-GluA1 and Gria1.
Images are endogenous SEP-GluA1 signal (left side, PFA-fixed sections imaged on Keyence slide scanner at 10×) and in situ hybridization of Gria1 mRNA expression (right side, from Allen Brain Atlas). Homozygous SEP-GluA1 brains (100-μm-thick sections) at indicated anterior/posterior positions relative to bregma. SEP-GluA1 expression pattern is similar to GluA1 mRNA expression in wild-type (WT) mice throughout the brain.
Figure 1—figure supplement 2
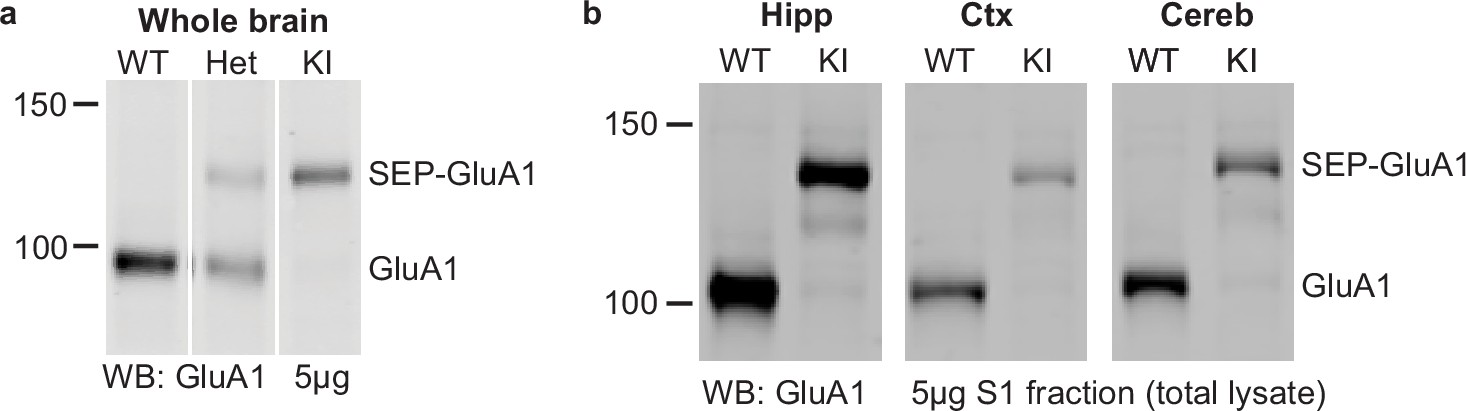
Region-specific differences in GluA1 expression in SEP-GluA1 KI mice.
(a) Whole-brain total homogenate (5 μg) from wild-type (WT), heterozygous SEP-GluA1 (Het) or homozygous SEP-GluA1 (KI) mice was blotted for GluA1. Samples run on the same gel, with image cropped to put lanes next to each other. (b) S1 fractions (5 μg), as a proxy for total homogenate, from hippocampus (Hipp), cortex (Ctx), and cerebellum (Cereb) were blotted for GluA1. In both (a) and (b), the higher band indicates SEP-GluA1 and shows reduced total levels of GluA1 in KI animals irrespective of brain region.
Figure 2
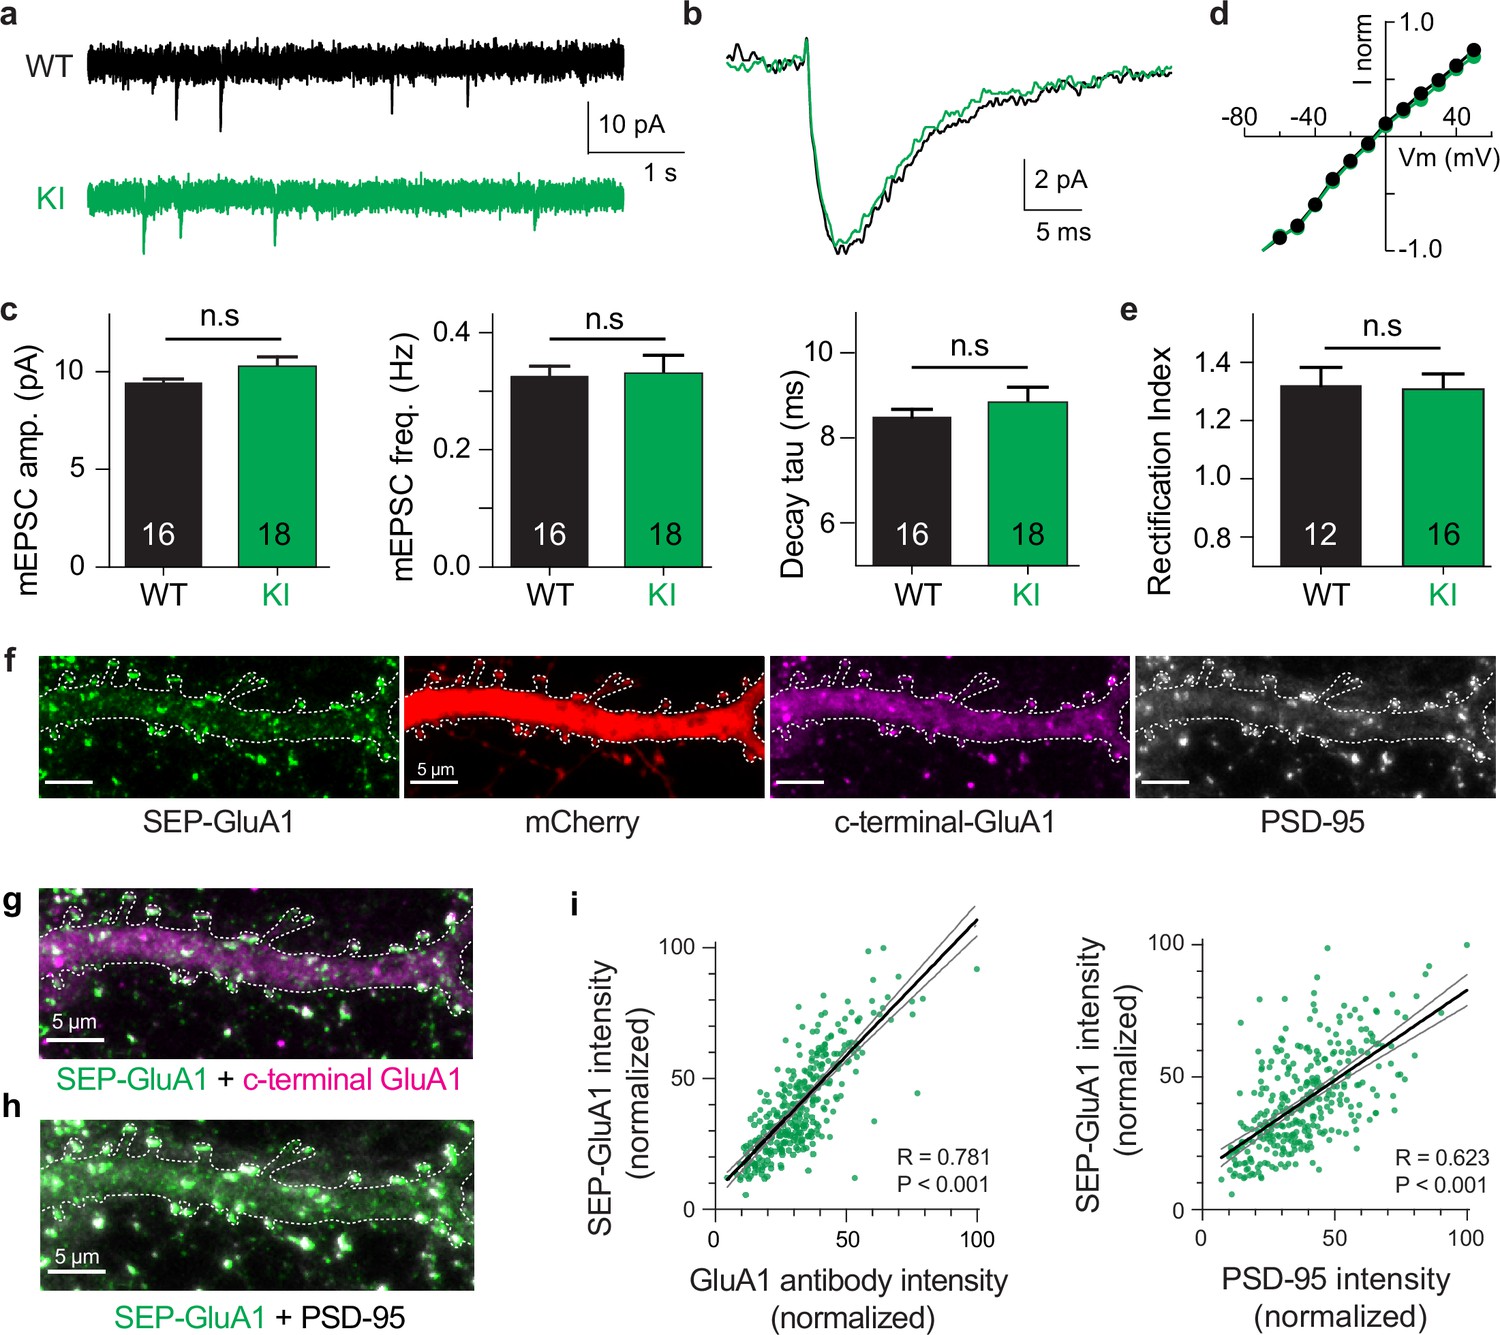
Normal synaptic physiology and receptor trafficking in SEP-GluA1 knockin (KI) mice.
(a–e) Whole-cell voltage-clamp recordings from CA1 neurons in acute hippocampal slices of aged-matched wild-type (WT) and homozygous SEP-GluA1 KI littermates. (a, b) Representative traces of miniature excitatory postsynaptic currents (EPSCs) from WT (black) and SEP-GluA1 knockinKI (green) mice. (c) Quantification of amplitude, frequency, and kinetics of miniature EPSCs. No differences were observed in any electrophysiological parameters between WT and KI mice. N = 16 and 18 cells from WT and KI, respectively. Unpaired t-tests were used for all comparisons. Mean ± SEM. mEPSC amplitude: WT 9.43 ± 0.20, N = 16; KI 10.26 ± 0.51, N = 18; p>0.05. Frequency: WT 0.33 ± 0.02; KI 0.33 ± 0.03122; p>0.05. Rise time: WT 2.46 ± 0.040; KI 2.49 ± 0.07; p>0.05. Tau decay: WT 8.49 ± 0.18; KI 8.83 ± 0.36; p>0.05. (d, e) No differences in rectification were observed between WT and KI mice. Rectification index is the negative slope of the IV curve (between –10 and –60 mV) divided by the positive slope (between +10 and + 50 mV). Mean ± SEM. WT: 1.32 ± 0.048, N = 12; KI: 1.33 ± 0.042, N = 16; p>0.05. (f–h) Confocal images of cultured SEP-GluA1 (green) neurons, with an mCherry cell-fill (red) and stained with antibodies for c-terminal-GluA1 (magenta) and PSD-95 (gray). Overlap of SEP-GluA1 with c-terminal-GluA1 (g) and SEP-GluA1 with PSD-95 (h) is rendered in white. (i) Quantifying overlap between endogenous SEP-GluA1 signal and immunofluorescence. A significant correlation is observed between the fluorescent intensity of endogenous SEP and the immunofluorescent signal of both GluA1 (R = 0.781, p<0.001, Pearson correlation, n = 332 spines) and PSD-95 (R = 0.623, p<0.001, Pearson correlation, n = 332 spines). Lines represent linear regression (thick black) with 95% confidence interval (thin gray).
-
Figure 2—source data 1
Raw data used to make Figure 2 plots.
- https://cdn.elifesciences.org/articles/66809/elife-66809-fig2-data1-v2.xlsx
Figure 3
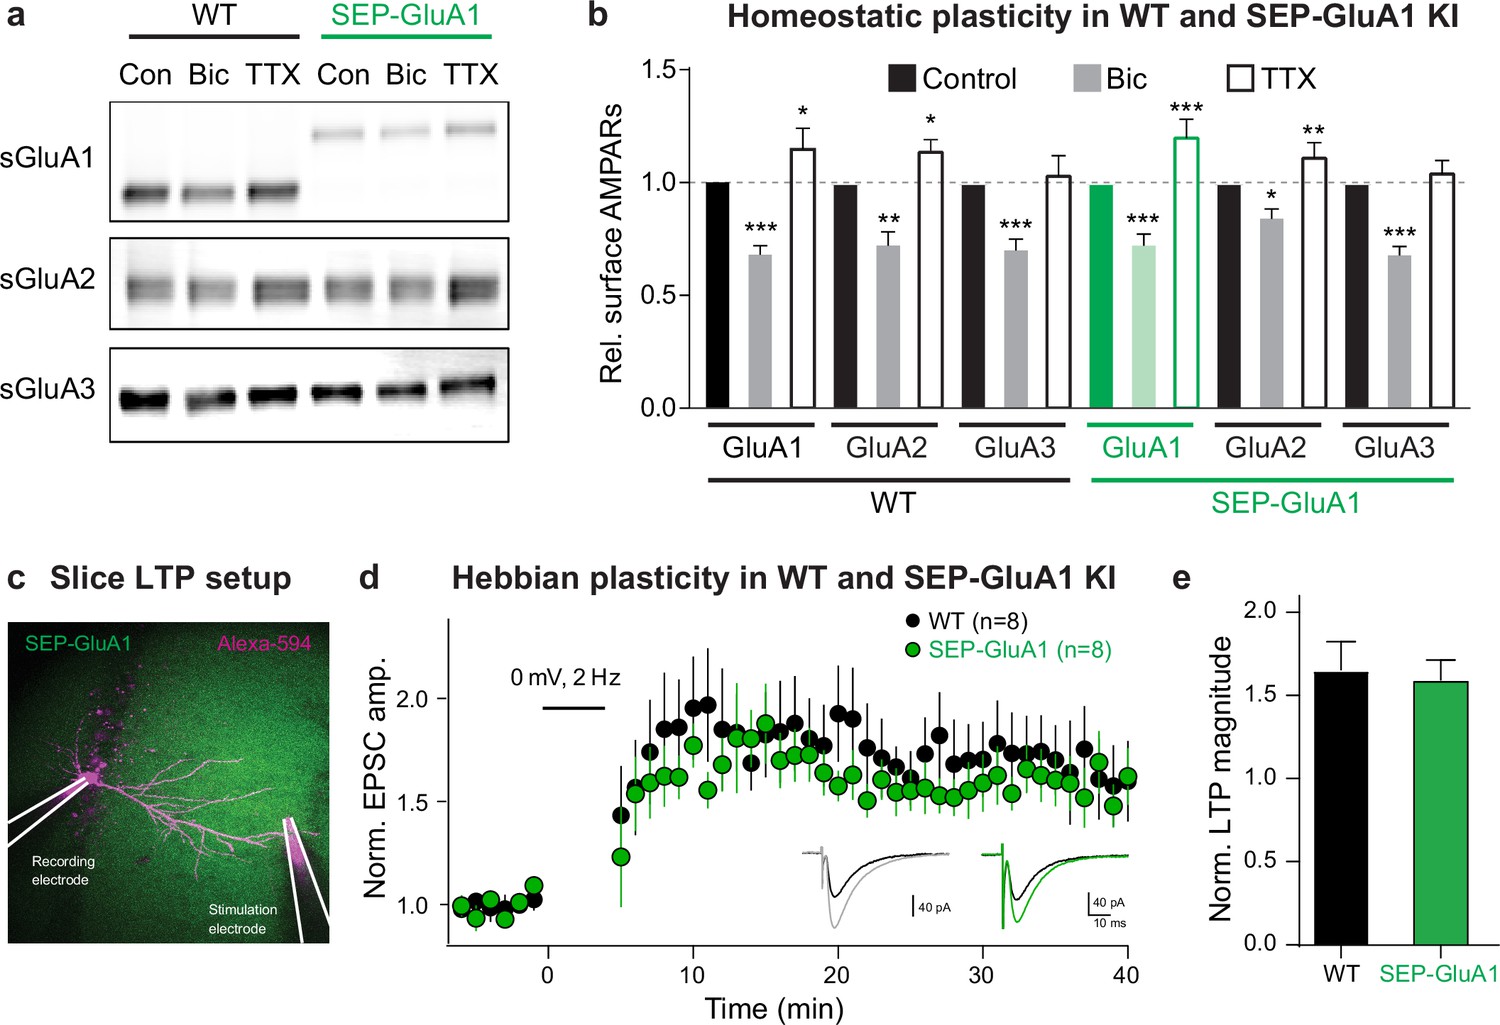
Normal homeostatic and Hebbian plasticity in SEP-GluA1 knockin (KI) mice.
(a) Representative western blot of surface GluA1, GluA2, and GluA3 in wild-type (WT) and KI mouse neurons under baseline conditions (Con), following homeostatic downscaling in bicuculline (Bic), and following homeostatic upscaling in tetrodotoxin (TTX). (b) Bar plot of all homeostatic plasticity experiments (n = 7–8; *p<0.05, **p<0.01, ***p<0.001; one-way ANOVA). (c) Induction of long-term potentiation (LTP) in WT and SEP-GluA1 KI mice. Fluorescent image depicting experimental setup. CA1 pyramidal neurons were patched and filled with Alexa-594. A stimulating electrode in stratum radiatum was used to evoke excitatory postsynaptic currents (EPSCs). After recording baseline EPSCs for at least 5 min, a pairing protocol consisting of 200 pulses was delivered at 2 Hz. (d) Average EPSC amplitude normalized to baseline for WT (black) and KI (green) littermates over course of LTP induction. Inset: example traces of EPSCs from baseline (black) and 30–40 min following LTP induction (WT gray and KI green). (e) Average change in EPSC amplitude normalized to the baseline period for WT and SEP-GluA1 KI littermates. A significant potentiation of EPSC amplitude was observed in both WT and KI mice, which was not different between genotypes, indicating normal induction and expression of LTP in SEP-GluA1 KI mice. Unpaired t-tests, p>0.05, mean ± SEM; WT: 1.66 ± 0.17, n = 8; KI: 1.59 ± 0.34, n = 8. Full, uncropped blots of all bands can be found in Figure 1—source data 1.
-
Figure 3—source data 1
Uncropped images of western blots used to display representative bands in Figure 3a.
Blots were stained for surface expression of GluA1 (top), GluA2 (middle), and GluA3 (bottom). Lanes corresponding to control (Con), bicuculline (Bic), and tetrodotoxin (TTX) conditions are indicated, for both wild-type (WT) and SEP-GluA1 mice. Size ladder is indicated in magenta. Each blot contains two biological replicates. Black boxes indicate cropped regions of representative blots in Figure 3a.
- https://cdn.elifesciences.org/articles/66809/elife-66809-fig3-data1-v2.pdf
-
Figure 3—source data 2
Original files of western blots used to quantify surface expression of GluA1 in Figure 3a.
- https://cdn.elifesciences.org/articles/66809/elife-66809-fig3-data2-v2.zip
-
Figure 3—source data 3
Original files of western blots used to quantify surface expression of GluA2 in Figure 3a.
- https://cdn.elifesciences.org/articles/66809/elife-66809-fig3-data3-v2.zip
-
Figure 3—source data 4
Original files of western blots used to quantify surface expression of GluA3 in Figure 3a.
- https://cdn.elifesciences.org/articles/66809/elife-66809-fig3-data4-v2.zip
-
Figure 3—source data 5
Raw data used to make Figure 3 plots.
- https://cdn.elifesciences.org/articles/66809/elife-66809-fig3-data5-v2.xlsx
Figure 4
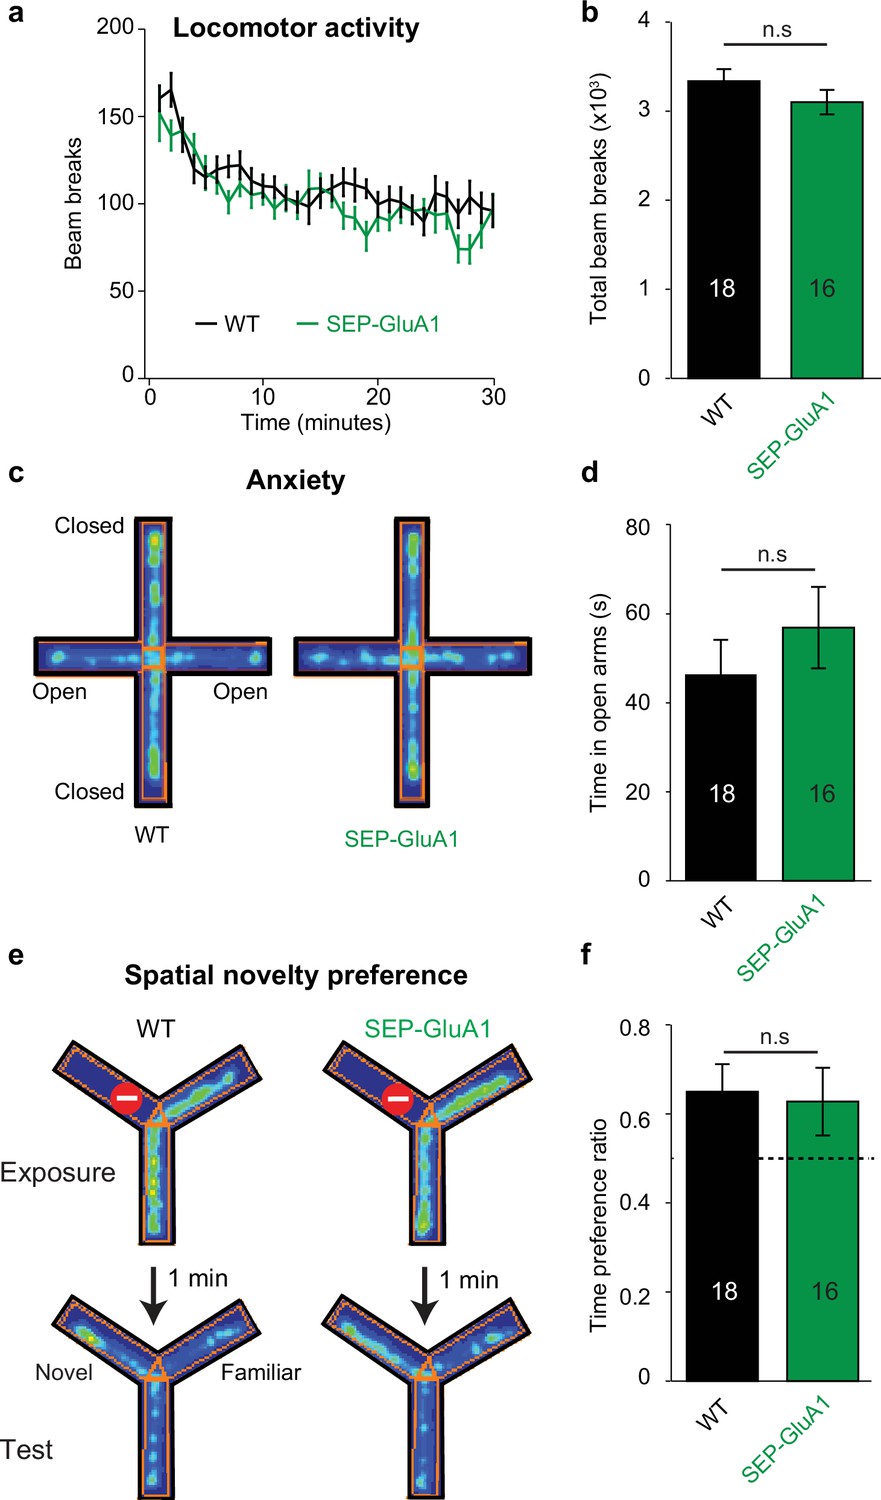
Normal behavior in SEP-GluA1 knockin (KI) mice.
(a, b) SEP-GluA1 mice display normal locomotion. Age-matched, WT (n = 18) and homozygous SEP-GluA1 KI (n = 16) littermates were placed in an open chamber and locomotion was assessed by counting the total number of beam breaks in a 30 min session. No differences were detected between wild-type (WT) and KI mice (repeated measures ANOVA; F1,30 = 1.561, p=0.221), between sexes (F1,30 = 1.346, p=0.255), or in a sex * genotype-dependent manner (F1,30 = 0.3, p=0.588). (c, d) SEP-GluA1 mice display normal anxiety. WT (n = 18) and KI (n = 16) littermates were placed in an elevated plus maze and anxiety was assessed by measuring the time spent in the open arm. For representative WT and KI animals, time spent in a particular location is indicated in pseudo color, with warm colors indicating higher occupancy. No differences were detected between WT and KI mice (ANOVA; F1,30 = 1.545, p=0.224), between sexes (F1,30 = 0.160, p=0.692), or in a sex * genotype-dependent manner (F1,30 = 4.139, p=0.051). (e, f) SEP-GluA1 mice display normal short-term spatial memory. Spatial novelty preference was assessed in WT (n = 18) and KI (n = 16) littermates using a Y-maze. WT and KI mice showed a preference for exploration of the novel arm. For representative WT and KI animals, time spent in a particular location is indicated in pseudo color, with warm colors indicating higher occupancy. There was no difference in the time preference ratio (time in novel arm/(time in novel arm + time in familiar arm)) between genotypes (ANOVA; F1,30 = 0.004, p=0.951), between sexes (F1,30 = 1.277, p=0.267), or in a sex * genotype-dependent manner (F1,30 = 2.434, p=0.129). Dotted line indicates chance-level performance.
-
Figure 4—source data 1
Raw data used to make Figure 4 plots.
- https://cdn.elifesciences.org/articles/66809/elife-66809-fig4-data1-v2.xlsx
Figure 5 with 1 supplement

SEP intensity correlates with functional synaptic strength.
(a) Two-photon (2p) image of a cultured SEP-GluA1 neuron filled with Alexa-594 via somatic patch pipette, imaged at 910 nm, with locations of glutamate uncaging indicated as blue dots and manually identified dendritic spines circled in yellow. (b) Representative uncaging-evoked excitatory postsynaptic current (uEPSC) following 1 ms pulse of 730 nm light at 20 mW (blue dot) in 2.5 mM MNI-glutamate. (c) Significant linear correlation between SEP-GluA1 intensity and uEPSC amplitude. SEP-GluA1 intensity was defined as the sum of green fluorescence intensity within manual synaptic annotations from five adjacent 0.5-μm-spaced Z-planes. n = 155 spines from 22 cells (*p<0.05, Pearson’s chi-squared test). (d–f) Tracking synaptic plasticity with SEP-GluA1 in vitro. (d) Plots of SEP-GluA1 intensity and uEPSC amplitude 5 min before and 30 min after delivery of a long-term potentiation (LTP) induction stimulus consisting of high-frequency pairing of glutamate uncaging (30 pulses at 0.5 Hz, 1 ms pulse of 730 nm laser) and postsynaptic depolarization (0 mV for 0.5 s, beginning concurrently with uncaging pulse). Red, spines that received LTP stimulus (n = 10); black, spines that did not receive LTP stimulus (n = 42). *p<0.01 using one-way ANOVA. (e) Longitudinal images of two control spines and one spine that received LTP stimulus. (f) Representative uEPSCs during the baseline period (–5 min) and 30 min after LTP induction.
-
Figure 5—source data 1
Raw data used to make Figure 5 plots.
- https://cdn.elifesciences.org/articles/66809/elife-66809-fig5-data1-v2.xlsx
Figure 5—figure supplement 1
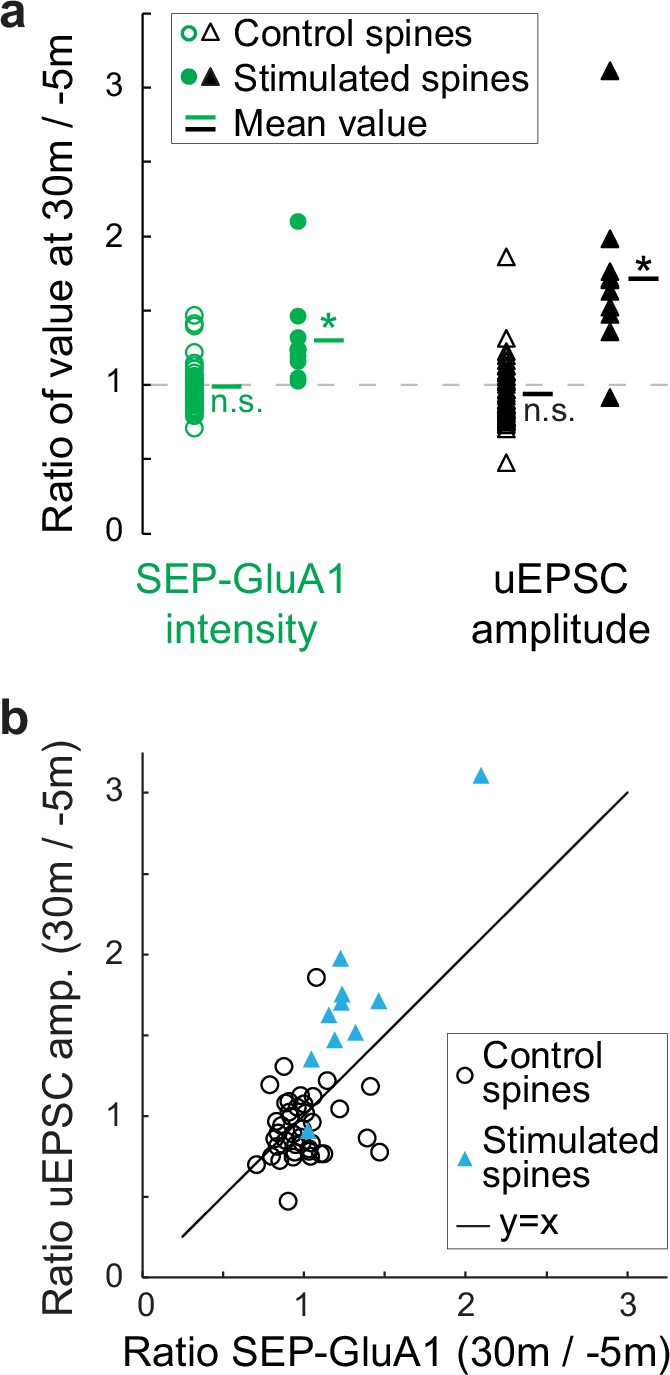
Synaptic potentiation is expressed as increased SEP-GluA1 intensity and functional strength in vitro, and this correlation remains strong following long-term potentiation (LTP) in vitro.
(a) Ratios of SEP-GluA1 intensity and uncaging-evoked excitatory postsynaptic current (uEPSC) amplitude at 30 min vs. –5 min, for both potentiated (closed symbols, n = 10) and unpotentiated spines (open symbols, n = 42). Potentiation stimulus was 30 1 ms pulses of 730 nm light at 0.5 Hz, paired with postsynaptic depolarization to 0 mV for 0.5 s, beginning concurrently with uncaging pulse. The ratio of SEP-GluA1 intensity (green circles) did not change in control unpotentiated spines, but was significantly increased in potentiated spines (p<0.05, one-sample t-test compared to a baseline of 1.0). The ratio of uEPSC amplitude (black triangles) did not change in control unpotentiated spines, but was significantly increased in potentiated spines (p<0.01, one-sample t-test compared to a baseline of 1.0). (b) Significant linear correlation between SEP-GluA1 intensity and uEPSC amplitude in both potentiated (closed blue triangles) and unpotentiated (open black circles) spines (*p<0.05, Pearson’s chi-squared test). Note that potentiated spines display greater SEP-GluA1 intensity and uEPSC amplitude compared to unpotentiated spines.
-
Figure 5—figure supplement 1—source data 1
Raw data used to make Figure 5—figure supplement 1 plots.
- https://cdn.elifesciences.org/articles/66809/elife-66809-fig5-figsupp1-data1-v2.xlsx
Figure 6 with 1 supplement

SEP-GluA1 signal completely recovers after photobleaching in vivo.
(a) Representative in vivo two-photon (2p) images throughout fluorescence recovery after photobleaching (FRAP) in a SEP-GluA1 mouse. A sparse subset of neurons was filled with tdTomato to visualize dendrites and spines. Yellow arrows denote spines that were bleached (at t = 0 min; bleaching area depicted in parentheses) and spines that were not bleached are indicated by white arrows. Scale bar 10 µm. (b) Fluorescence recovery of SEP-GluA1 signal after photobleaching in spines of L2/3 excitatory neurons in mouse somatosensory cortex. Symbols represent mean and error bars represent SEM. Time points between 0 and 30 min were fitted to a one-phase decay exponential curve (solid line), with plateau = 0.526 ± 0.057, rate constant of recovery (k) = 0.09 ± 0.027 (value ± SEM) and tau = 11.15 min. Shaded area represents 95% confidence interval of the fit. n = 66 spines from three mice. (c) Heatmap of SEP-GluA1 signal from individual bleached and unbleached spines normalized to their respective baseline at different time points throughout FRAP. Rows represent individual spines sorted by signal intensity immediately after photobleaching (t = 0 min). Bleached spines: n = 66 spines from three mice. Unbleached spines: n = 132 spines from three mice.
-
Figure 6—source data 1
Raw data used to make Figure 6 plots.
- https://cdn.elifesciences.org/articles/66809/elife-66809-fig6-data1-v2.xlsx
Figure 6—figure supplement 1
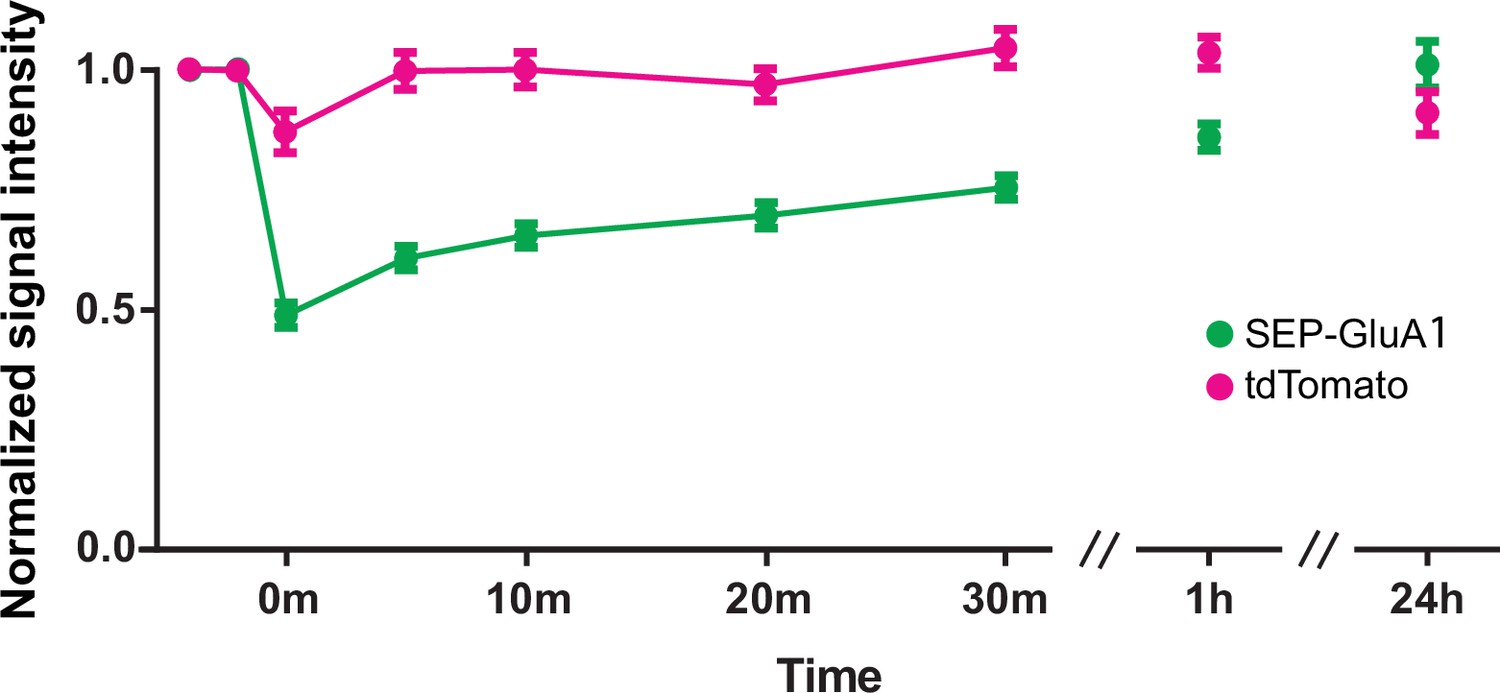
Fluorescence recovery of tdTomato cell fill and SEP-GluA1 signal after photobleaching.
Relative fluorescence levels (normalized to their respective baseline) of tdTomato cell fill and SEP-GluA1 in spines of L2/3 excitatory neurons in mouse somatosensory cortex at indicated time points during fluorescence recovery after photobleaching (FRAP). Symbols represent mean and error bars represent SEM. n = 66 spines from three mice.
Figure 7 with 3 supplements
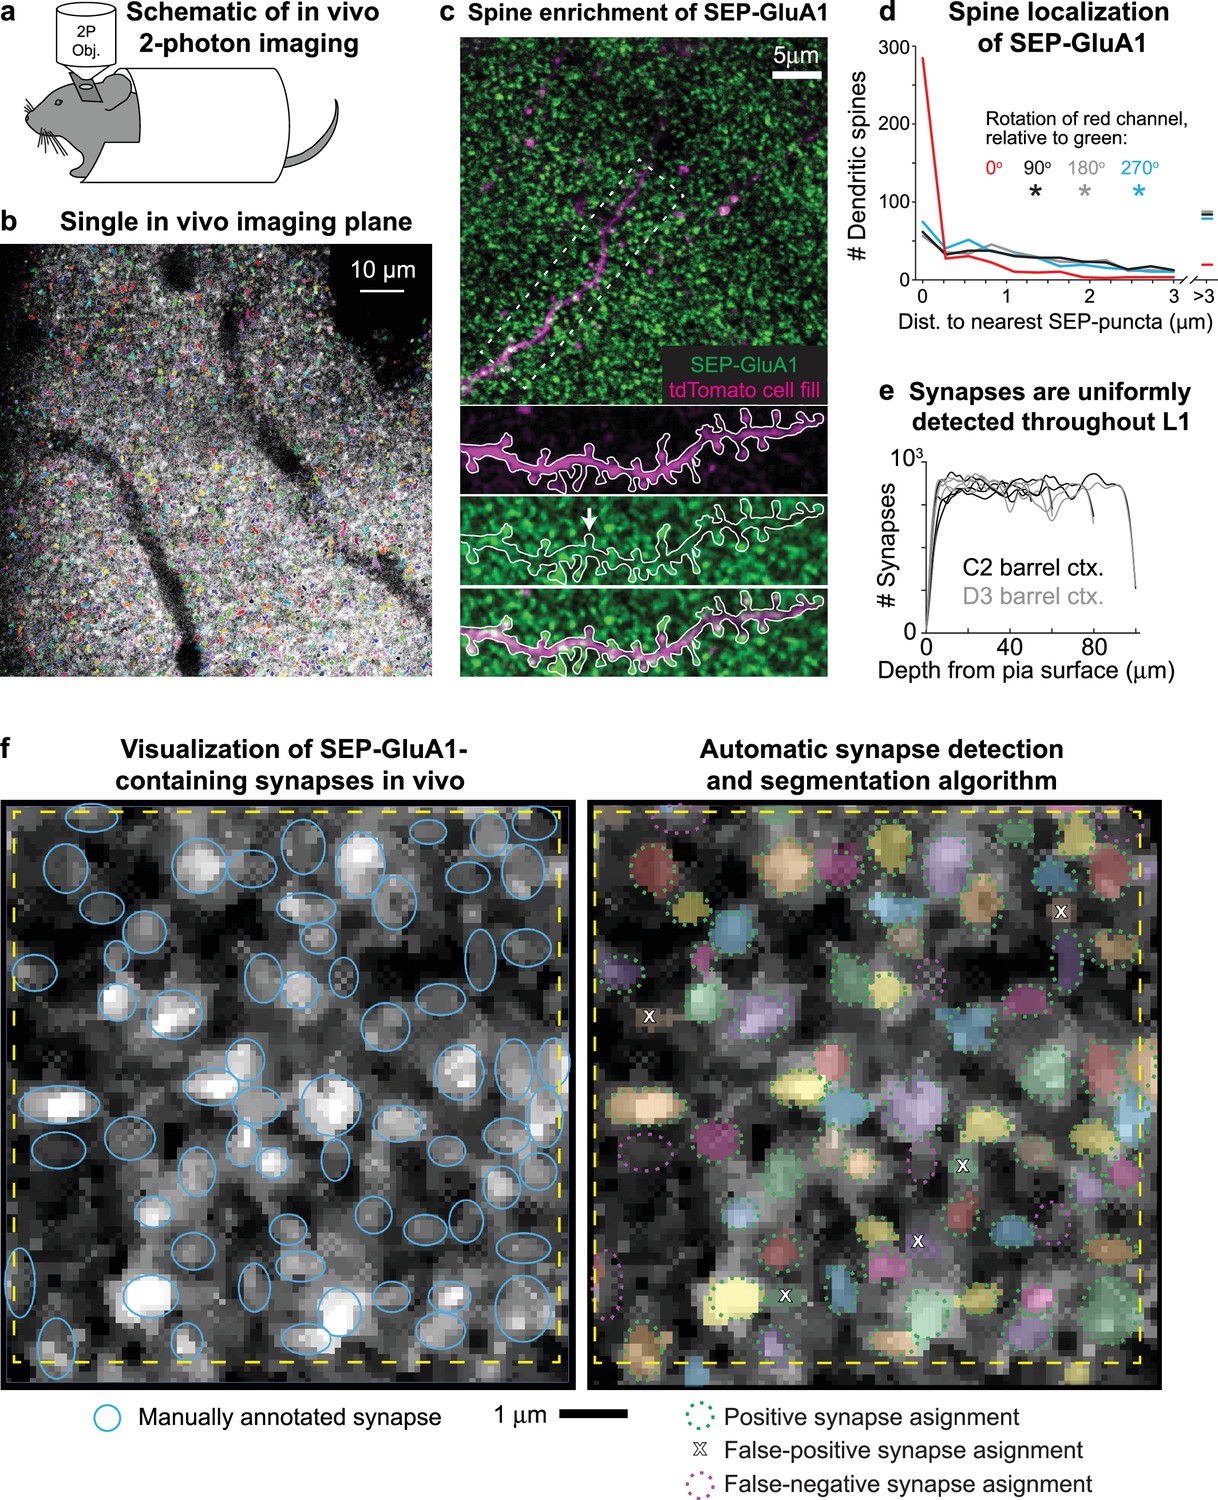
Visualizing SEP-GluA1 synapses in vivo using two-photon (2p) microscopy.
(a) Schematic of in vivo 2p imaging. (b) Large-scale automatic detection and segmentation of SEP-GluA1-containing synapses in L1 barrel cortex. Automatically detected synapses are rendered in arbitrary colors. Dark areas likely correspond to either vasculature or cell bodies. (c) Single in vivo imaging plane showing SEP-GluA1 synapses (green) and a single layer 2/3 pyramidal cell filled with tdTomato (magenta). White arrow denotes a spine devoid of SEP-GluA1 signal. (d) SEP-GluA1 is enriched in dendritic spines. 78% of automatically detected dendritic spines (visualized using a sparse tdTomato cell fill) contained a SEP-GluA1 synapse, defined as edge-to-edge separation of red spines and green puncta <0.25 μm. This overlap occurred at a substantially higher rate than chance as the distance between spines (magenta channel) and their nearest SEP neighbor (green channel) significantly increased when the magenta channel was rotated either 90, 180, or 270° relative to green (n = 504 spines; *p<0.001; Mann–Whitney U test, relative to unrotated). (e) GluA1-containing synapses were uniformly detected throughout L1 barrel cortex, up to a depth of 100 μm below the pial surface. (f) Left: single in vivo imaging plane displaying raw, unprocessed SEP-GluA1 signal, taken 47 μm deep in layer 1 (L1) of barrel cortex. Putative GluA1-containing synapses are identified as bright puncta. Manual synaptic annotations are overlaid as blue ovals. Right: same cortical plane, but with automatically identified and segmented synapses rendered in arbitrary colors. Manual annotations are overlaid, recolored either green or magenta, corresponding to true positives (defined as >50% of total 3D voxels shared between manual and automatic annotations) or false negative (defined as manual annotations that did not overlap with an automatic detection), respectively; false positives (defined as automatically detected synapses that did not overlap with a manual annotation) are indicated by an X. Scale bar is 1 μm.
Figure 7—figure supplement 1
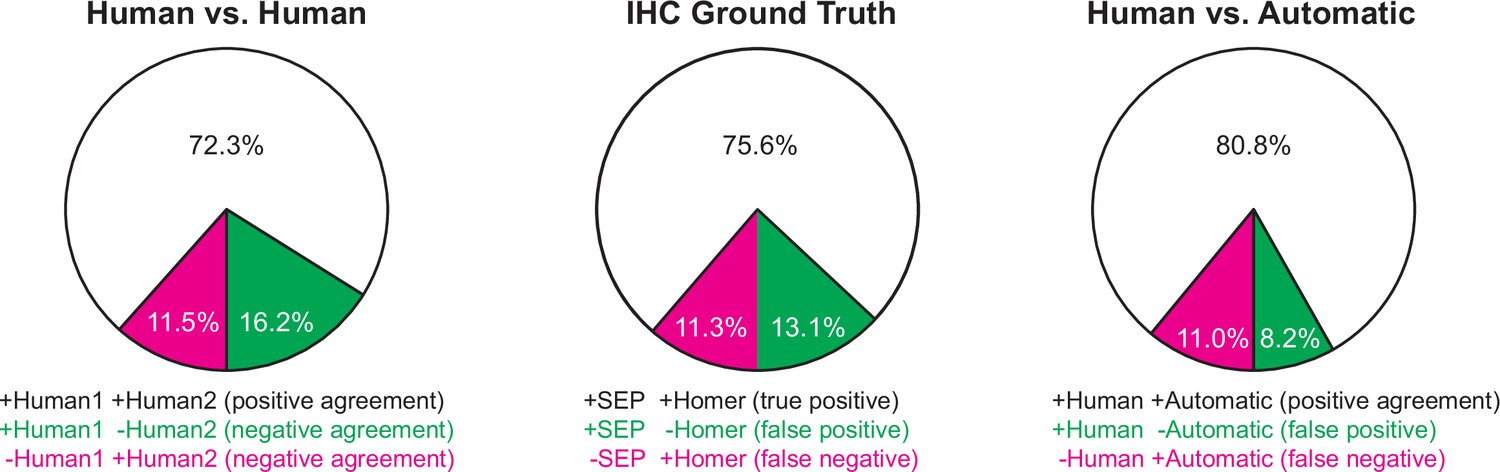
Rates of agreement and error for synapse detection methods.
For all plots, rates of agreement (positive annotation in both channels being compared) are shown in white and errors (positive annotation in one channel and negative in the other) are shown in magenta or green. Left: IHC ground truth is comparison of overlap of automatically detected SEP-GluA1 and Homer puncta in vitro. Middle: human vs. automatic is comparison of overlap of automatically detected SEP-GluA1 and manually annotated SEP-GluA1 from the same volume of tissue imaged in vivo. Right: human vs. human is comparison of overlap between two different expert human annotators from the same volume of tissue imaged in vivo. For all comparisons, a threshold of >50% shared voxels defined overlap.
Figure 7—figure supplement 2
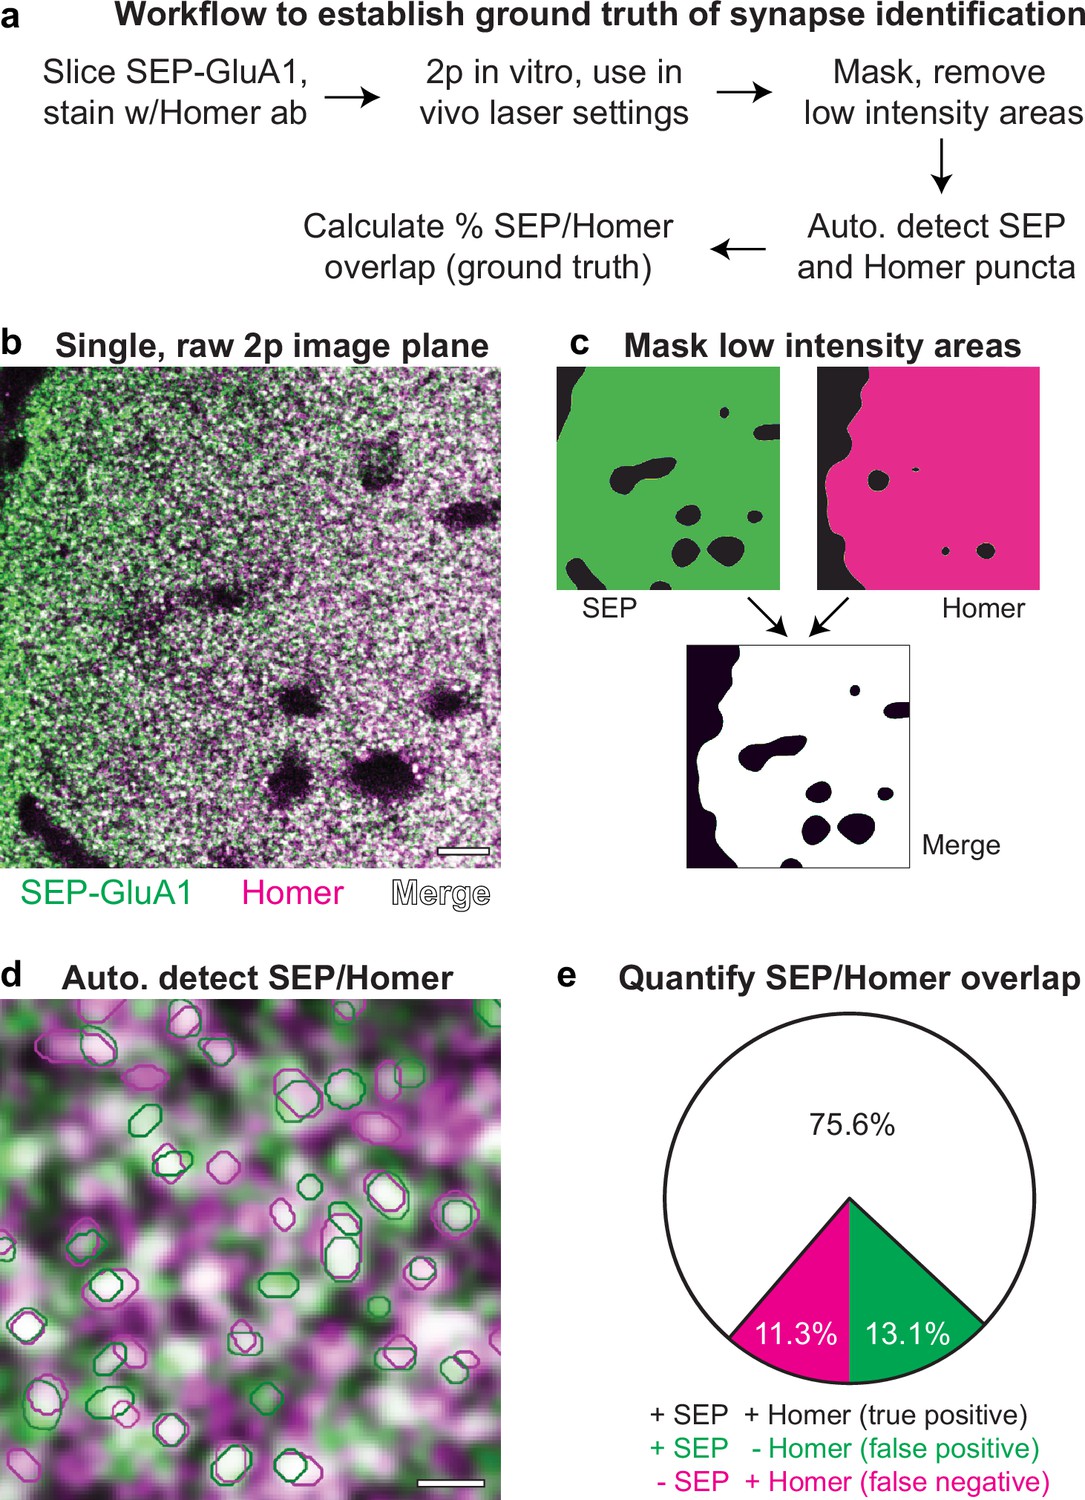
Schematic of in vitro automatic detection of Homer and SEP-GluA1 puncta.
(a) Workflow to establish ground truth of synapse detection. (b) Representative, raw image of in vitro two-photon (2p) signal of layer I SEP-GluA1 (green) barrel cortex stained with a Homer antibody (magenta); voxels displaying overlap of SEP-GluA1 and Homer are rendered in white. (c) Schematic of masking to remove low-intensity regions. Regions lacking detectable SEP fluorescence were excluded by thresholding, removing areas with a z score of less than –1 in a blurred image (see Materials and methods). (d) Zoomed-in image of raw in vitro 2p signal, with overlaid automatic detections/segmentations of SEP-GluA1 (green circles) and Homer (magenta circles). (e) Quantification of ground truth for synapse detection. True positive rate reflects rate of overlap between SEP-GluA1 and Homer, false-positive rate reflects rate of SEP-GluA1 detection without overlapping Homer, and false-negative rate reflects rate of Homer detection without overlapping SEP-GluA1. A threshold of >50% total voxel overlap defined overlap.
Figure 7—figure supplement 3
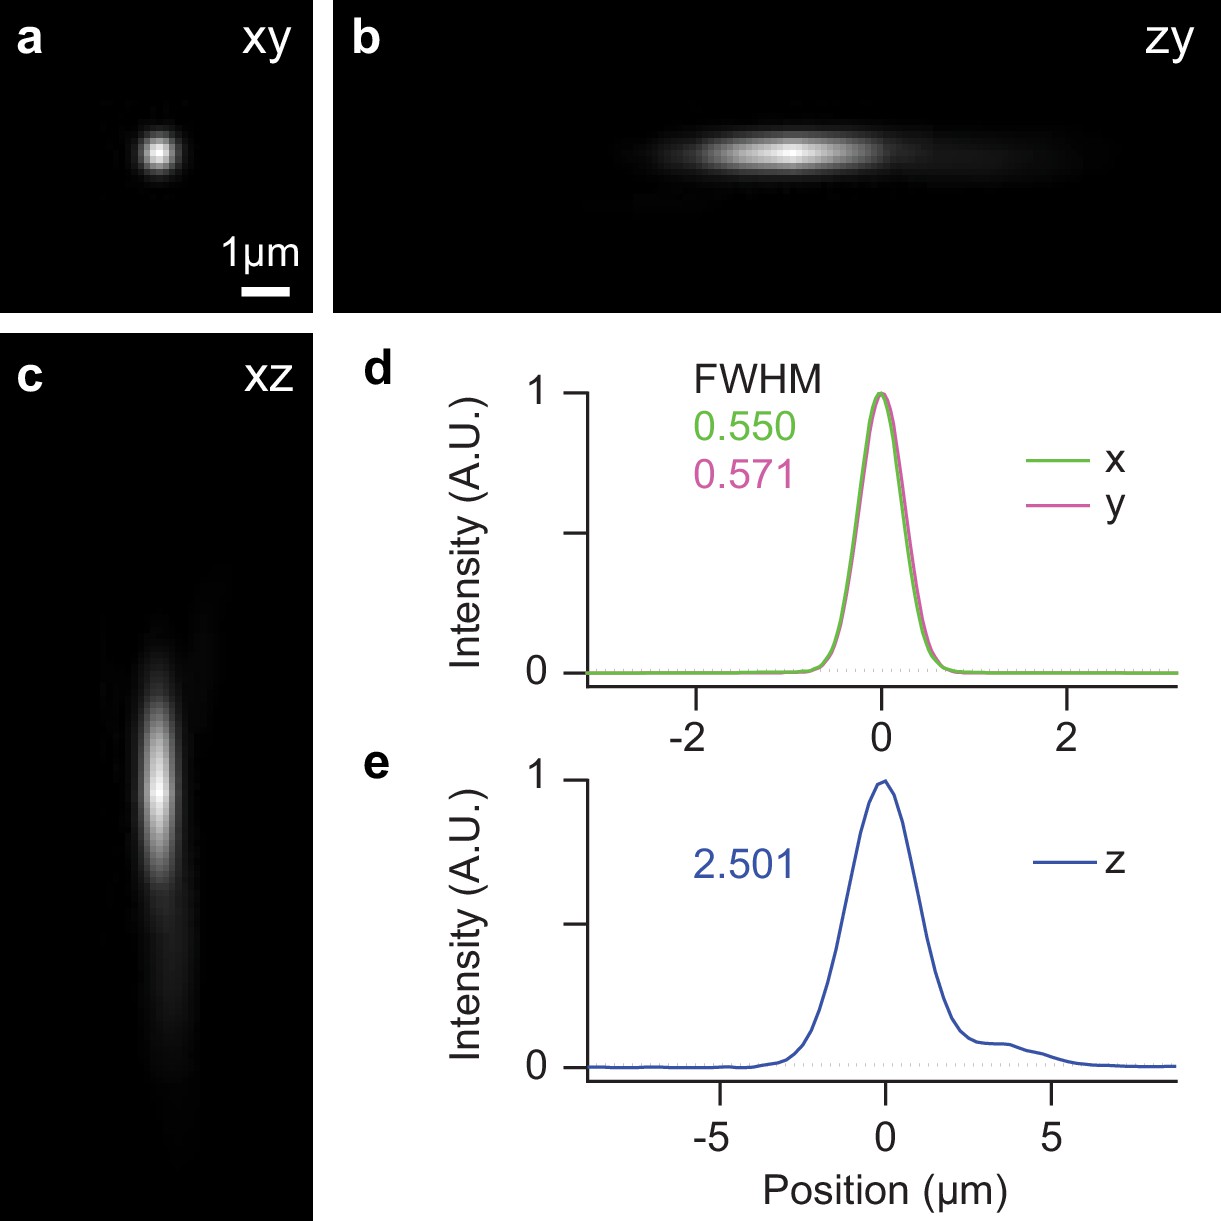
Radial and axial point spread function (PSF) of two-photon (2p) microscope.
(a–c) Reconstructed PSF from averaged 2p images of 1 μm TetraSpeck microspheres imaged at 910 nm in the GFP channel (scale bar: 1 μm). PSF fluorescence intensity profiles were visualized across the intensity center of the z- (a), y- (b), and x-axes (c). (d, e) Linear profile of normalized intensity distribution shown in (a–c). The full width at half maximum (FWHM) of these profiles gives a direct estimate of the radial (d) and axial (e) PSF.
Figure 8
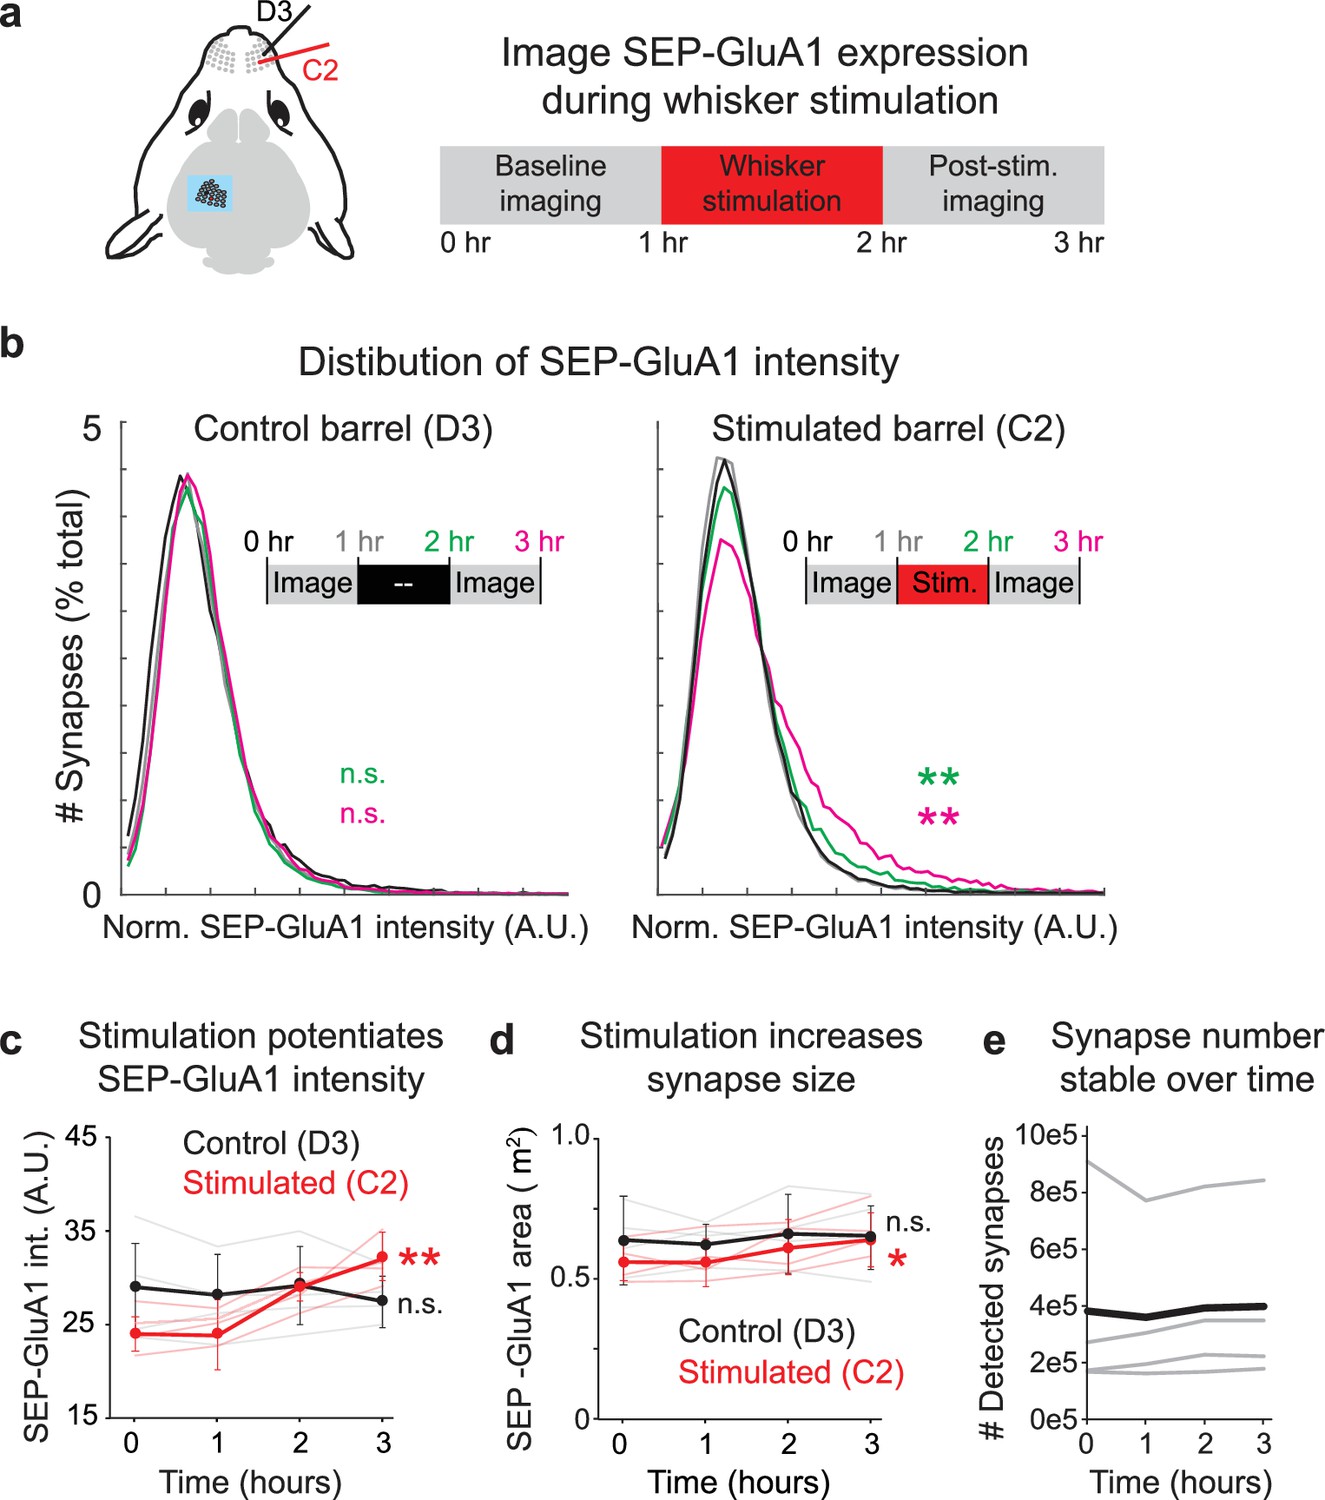
Tracking synaptic plasticity during sensory experience.
(a) Schematic of whisker stimulation and in vivo imaging of barrel cortex. The control unstimulated (D3) and stimulated barrel (C2) were imaged twice at baseline. The C2 whisker was mechanically stimulated with 10 Hz vibration for 1 hr, after which imaging of both barrels resumed. (b) Distribution of normalized SEP-GluA1 intensity in barrel cortex over time in one representative homozygous SEP-GluA1 mouse. Left: distribution of SEP-GluA1 intensity was stable over time in the control, unstimulated D3 barrel. Right: significant rightward shift in SEP-GluA1 intensity in the C2 barrel following whisker stimulation (for 1 hr, between the 1 and 2 hr time points), indicating net synaptic potentiation. **p<0.01, Mann–Whitney U test relative to within-mouse baseline period (pooled 0 and 1 hr time points). (c) Whisker stimulation induces barrel-selective synaptic potentiation. Plot of mean SEP-GluA1 fluorescent intensity from all automatically detected SEP puncta over time in the control (black, D3) and stimulated (red, C2) barrel. n = 4 mice, **p<0.01, two-way ANOVA, comparing each imaging session to the two pooled baseline sessions (0 and 1 hr). Error bars represent standard deviation. (d) Whisker stimulation induces barrel-selective synapse enlargement. Plot of mean area of all automatically detected SEP puncta over time in the control (black, D3) and stimulated (red, C2) barrel. Synapse area was defined as the maximum area in a single 2D imaging plane for each automatically segmented SEP-GluA1 puncta. *p<0.05, two-way ANOVA, comparing each imaging session to the two pooled baseline sessions (0 and 1 hr). (e) Number of detected synapses was stable over time. Total synapse count from each individual mouse (thin gray) and mean (n = 4, thick black) are presented.
-
Figure 8—source data 1
Raw data used to make Figure 8 plots.
- https://cdn.elifesciences.org/articles/66809/elife-66809-fig8-data1-v2.zip
Author response image 1
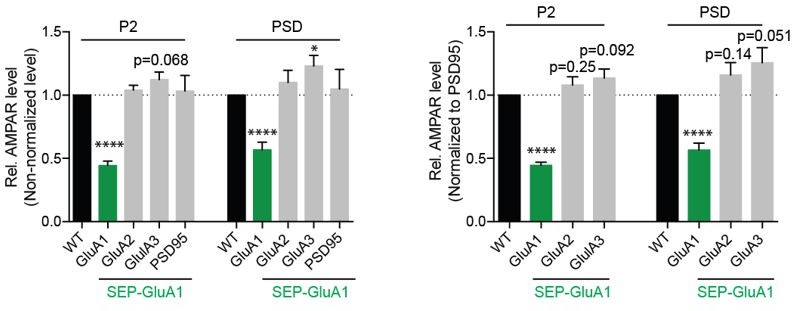
Quantification of AMPA receptor subunit expression with or without normalization to PSD95 in the P2 and postsynaptic density (PSD) fractions of WT and SEP-GluA1 mice.
(n=7; *p < 0.05; ****p < 0.0001, Student’s T-test).
Videos
Video 1
Representative in vivo two-photon (2p) imaging volume of SEP-GluA1 knockin.
The imaging volume displayed is 98 × 98 × 130 μm section of layer I barrel cortex, with SEP-GluA1 synapses in green and a sparse cell fill in magenta. Overlap between green/magenta voxels is rendered in white. The video begins at the pial surface, moving ventrally towards layer II/III, with depth indicated in the lower right. Note the high density of green puncta, each corresponding to a single GluA1-containing synapse. Punctate synaptic labels are observed uniformly up to a depth of ~100 μm, below which the signal begins to degrade, likely due to light scattering. In this SEP-GluA1 × Ai9 mouse, a random subset of layer II/III pyramidal cells was filled using a dilute (1:20k) AAV-CaMK2-Cre virus. Voxel size is 0.096 × 0.096 × 1 μm. Resolution is 1024 × 1024 pixels in XY and a 1 μm step size. Images were median filtered with a radius of 1 and contrast enhanced. Scale bar is 10 μm.
Video 2
3D rendering of filled dendrite with SEP-GluA1 puncta in spines.
The imaging volume displayed is a 30 × 30 × 15 μm section of layer I barrel cortex. Note the enrichment of SEP-GluA1 puncta (green) in dendritic spines (magenta) and the paucity of SEP signal in the dendritic shaft. There are many green puncta outside of the filled cell, likely corresponding to GluA1-containing synapses in spines of unlabeled cells. 3D volume was rendered using Imaris. Dynamic scale bar in lower left.
Video 3
3D rendering of SEP-GluA1 puncta in layer I barrel cortex.
35 × 50 × 15 μm imaging volume. Note the extreme density of green puncta, each corresponding to a single GluA1-containing synapse. Rendered using Imaris. Dynamic scale bar in lower left.
Tables
Key resources table
| Reagent type (species) or resource | Designation | Source or reference | Identifiers | Additional information |
|---|---|---|---|---|
| Antibody | Anti-GluA1C-terminal(rabbit polyclonal) | Oku and Huganir, 2013 | JH4294 | (1: 2000)Made in houseShared upon request |
| Antibody | Anti-GFP(chicken polyclonal) | Abcam | Ab13970RRID:AB_300798 | (1:2000) |
| Antibody | Anti-Psd-95(mouse monoclonal) | NeuroMab | Clone K28/43Cat # 75-028RRID:AB_2292909 | IF (1:500)WB (1:5000) |
| Antibody | Anti-Homer 1(rabbit polyclonal) | Synaptic Systems | 160-003 | (1:1000) |
| Antibody | Anti-GluA2N-terminal(mouse monoclonal) | This paper | 032.19.9 | (1:2000)Made in houseShared upon request |
| Antibody | Anti-GluA3N-terminal(rabbit polyclonal) | This paper | JH4300 | (1:1000)Made in houseShared upon request |
| Cell line (Mus musculus) | SEP-GluA1 primary cultured neurons | This paper | SEP-GluA1 | Made in houseWill deposit to Jackson Labs |
| Genetic reagent (M. musculus) | SEP-GluA1 knockin mice | This paper | SEP-GluA1 | Made in houseWill deposit to Jackson Labs |
| Genetic reagent (M. musculus) | Ai9 (B6.Cg-Gt(ROSA) 26Sortm9(CAG-tdTomato) Hze/J) mice | The Jackson Laboratory | Jax # 007909RRID:IMSR_JAX:007909 | |
| Other | AAV-CaMKII-Cre virus | Addgene/Penn Vector | #105558-AAV1 | (1:10,000–1:50,000) |
| Software, algorithm | Fiji image processing software | Fiji | ||
| Software, algorithm | GraphPad Prism 9 | GraphPad Prism 9 | ||
| Software, algorithm | ANYmaze animal tracking software | Stoelting | ||
| Software, algorithm | Clampex 10.7 | Molecular Devices | ||
| Software, algorithm | Clampfit 10.7 | Molecular Devices | ||
| Software, algorithm | Mini Analysis Program v 6 | Synaptosoft Inc | ||
| Software, algorithm | Igor Pro 6.3 | WaveMetrics | ||
| Software, algorithm | In vivo synapse detector | This paper | https://github.com/twardlab/synapse_labeling (copy archived at swh:1:rev:5a274f9cb8afbad23bea698f02e43418e136ca8d), Graves et al., 2020 | |
| Software, algorithm | Imaris 9.6.0 | Oxford Instruments | ||
| Software, algorithm | Matlab2020b | MathWorks | ||
| Software, algorithm | ScanImage | Vidrio Technologies | ||
| Software, algorithm | StackGPS | This paper | https://github.com/ingiehong/StackGPS, (copy archived at swh:1:rev:60b7378461a650d86c20e4a4f7cfb2c5aff3f20a), Hong, 2021 | |
| Software, algorithm | ImageJ | ImageJ |
Additional files
Download links
A two-part list of links to download the article, or parts of the article, in various formats.
Downloads (link to download the article as PDF)
Open citations (links to open the citations from this article in various online reference manager services)
Cite this article (links to download the citations from this article in formats compatible with various reference manager tools)
Visualizing synaptic plasticity in vivo by large-scale imaging of endogenous AMPA receptors
eLife 10:e66809.
https://doi.org/10.7554/eLife.66809


