Dnmt3a knockout in excitatory neurons impairs postnatal synapse maturation and increases the repressive histone modification H3K27me3
- Department of Cognitive Science, University of California, San Diego, United States
- Computational Neurobiology Laboratory, Salk Institute for Biological Studies, United States
- Genomic Analysis Laboratory, Salk Institute for Biological Studies, United States
- Bioinformatics and Systems Biology Graduate Program, University of California, San Diego, United States
- Waitt Advanced Biophotonics Core, Salk Institute for Biological Studies, United States
- Howard Hughes Medical Institute, Salk Institute for Biological Studies, United States
- Department of Psychiatry, University of California, San Diego, United States
Figures
Figure 1 with 5 supplements
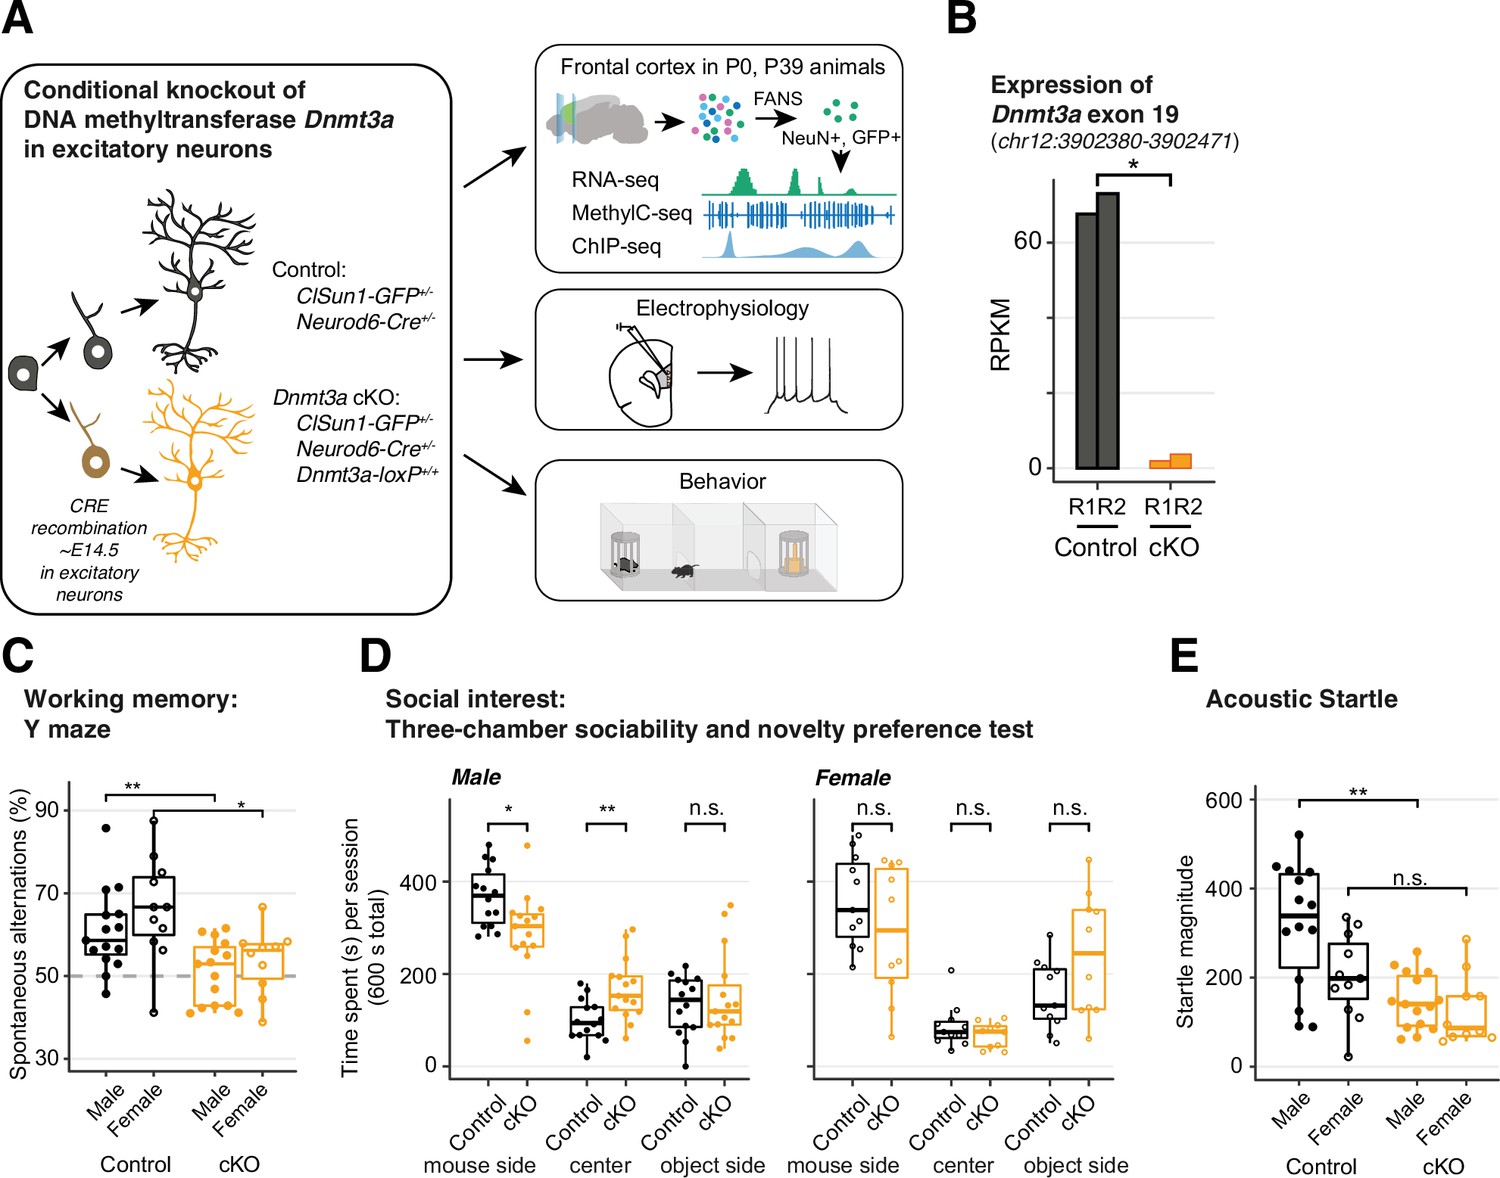
Dnmt3a conditional knockout (cKO) in cortical pyramidal neurons during mid-gestation impaired working memory, social interest, and acoustic startle responses.
(A) An experimental model of the conditional loss of Dnmt3a in excitatory neurons. P0 and P39, postnatal day 0 and 39. FANS, fluorescence-activated nuclei sorting. (B) RNA-seq confirmation of the deletion of Dnmt3a exon 19 in P39 excitatory neurons. RPKM, reads per kilobase per million. R1/2, replicate 1/2. *, t-test p=0.014. (C) Dnmt3a cKO mice made fewer spontaneous alternations in the Y-maze test of working memory (Wilcoxon test, **, p=0.0079; *, p=0.011; n=15 male control, 15 male cKO, 11 female control, 10 female cKO). (D) Male Dnmt3a cKO mice spent less time interacting with an unfamiliar mouse, indicating reduced social interest (Wilcoxon test; *, p=0.01048; **p=0.006833; n=14 male control, 15 male cKO, 11 female control, 10 female cKO). (E) Male Dnmt3a cKO mice had decreased startle response to a 120 dB acoustic pulse (Wilcoxon test, **, p=0.0019; n.s., not significant; n=14 male control, 15 male cKO, 11 female control, 10 female cKO).
Figure 1—figure supplement 1
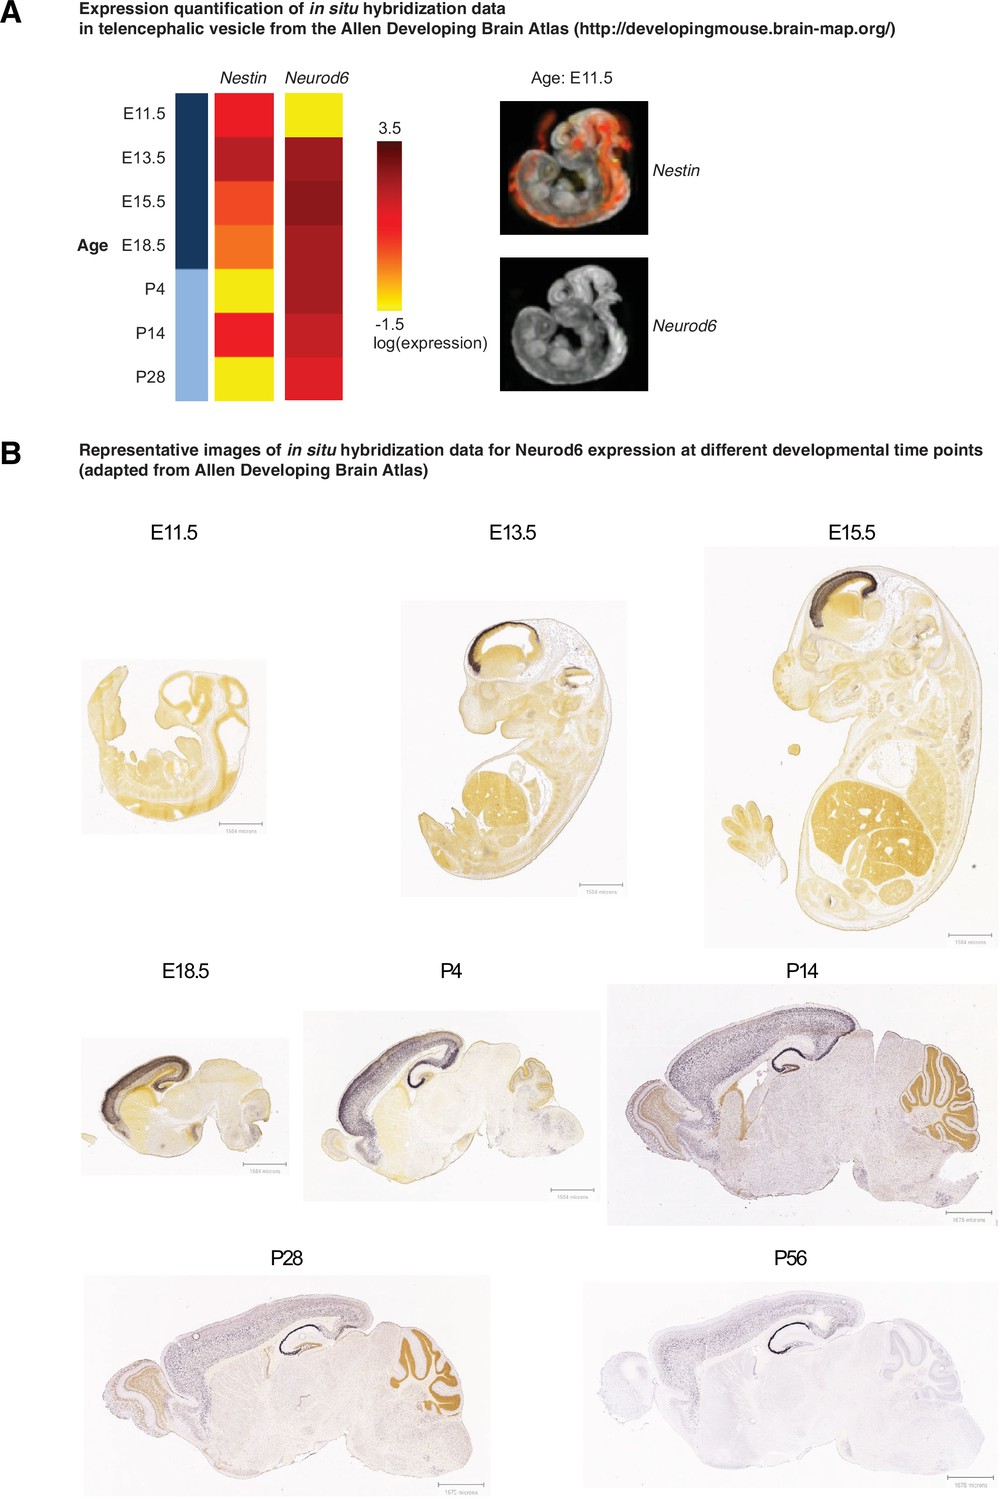
Neurod6 starts to express between embryonic day E11 and E13.
(A) Expression quantification of in situ hybridization data of gene Nestin and Neurod6 in telencephalic vesicle from the Allen Developing Brain Atlas (http://developingmouse.brain-map.org/). Left panel, heatmap of the gene expression across ages during development. Right panel, example images of the gene expression in E11.5. Image credit: Allen Institute. E11.5–18.5, embryonic days; P4–28, postnatal days. (B) Expression of Neurod6 at different developmental time points (embryonic days 11.5, 13.5, and 15.5, and postnatal days 4, 14, 28, and 56). Images were taken from the Allen Developing Brain Atlas.
Figure 1—figure supplement 2
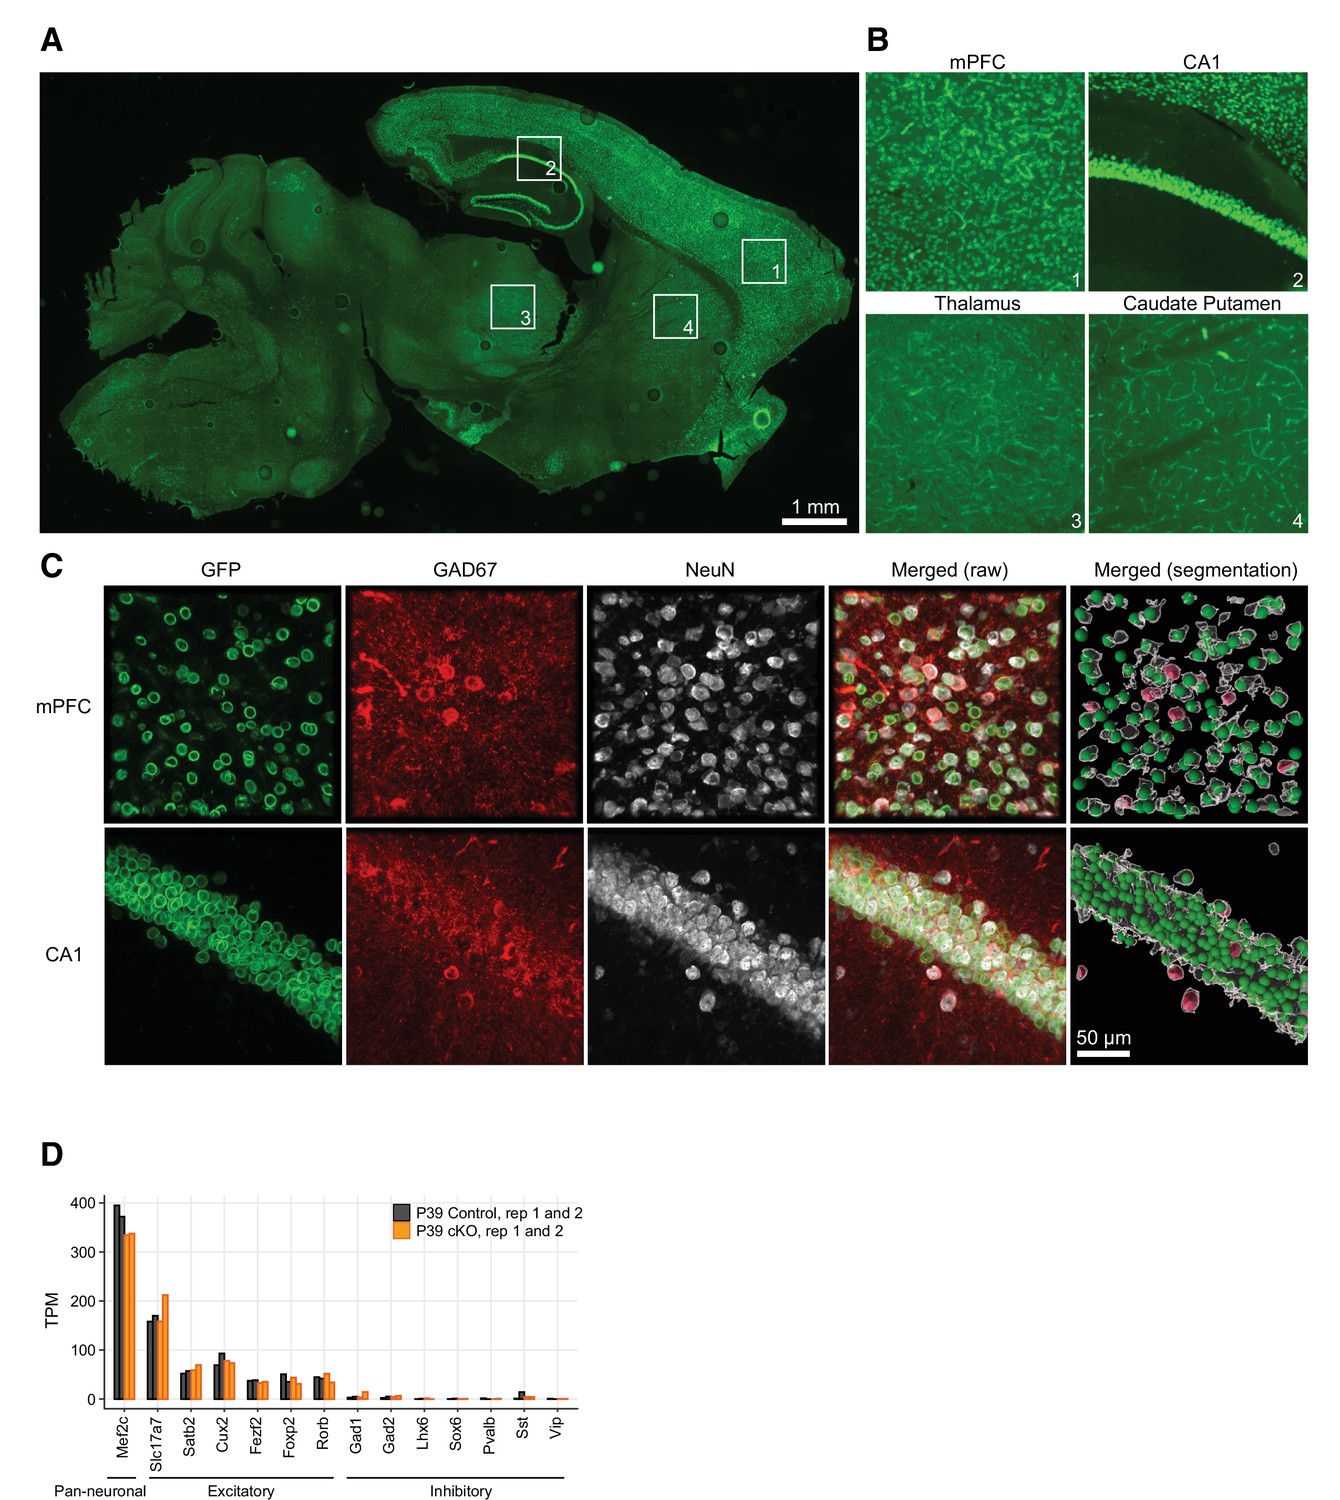
Neurod6-dependent Cre recombination occurred only in excitatory neurons.
(A–C) Cell-type-specific expression of nuclear membrane tag (Sun1-sfGFP-myc) in non-inhibitory NEUROD6+ neurons in mouse brain. (A) Overview (10× magnification) of a sagittal section stained with anti-GFP antibody. Note that the Sun1-sfGFP nuclear tag expression is region-specific, as described for the characterization of the NexCre mouse line (Goebbels et al., 2006). The numbered insets in (A) are enlarged and shown in (B), as example regions where the nuclear membrane tag is expressed (mPFC and CA1 hippocampal region) and where it is not (caudate putamen and thalamus). (C) Confocal images (60× magnification, maximum intensity projection) of mouse brain slices (40 µm thick) triple-labeled with antibodies anti-GFP (Sun1-sfGFP-tag, green channel), anti-GAD67 (inhibitory cells marker, red channel), and anti-NeuN (neuronal marker, gray). Note that Sun1-sfGFP-tag is only expressed in neurons that are not inhibitory. (D) Expression of pan-neuronal, excitatory, and inhibitory neuron marker genes in our RNA-seq data. TPM, transcripts per million.
Figure 1—figure supplement 3
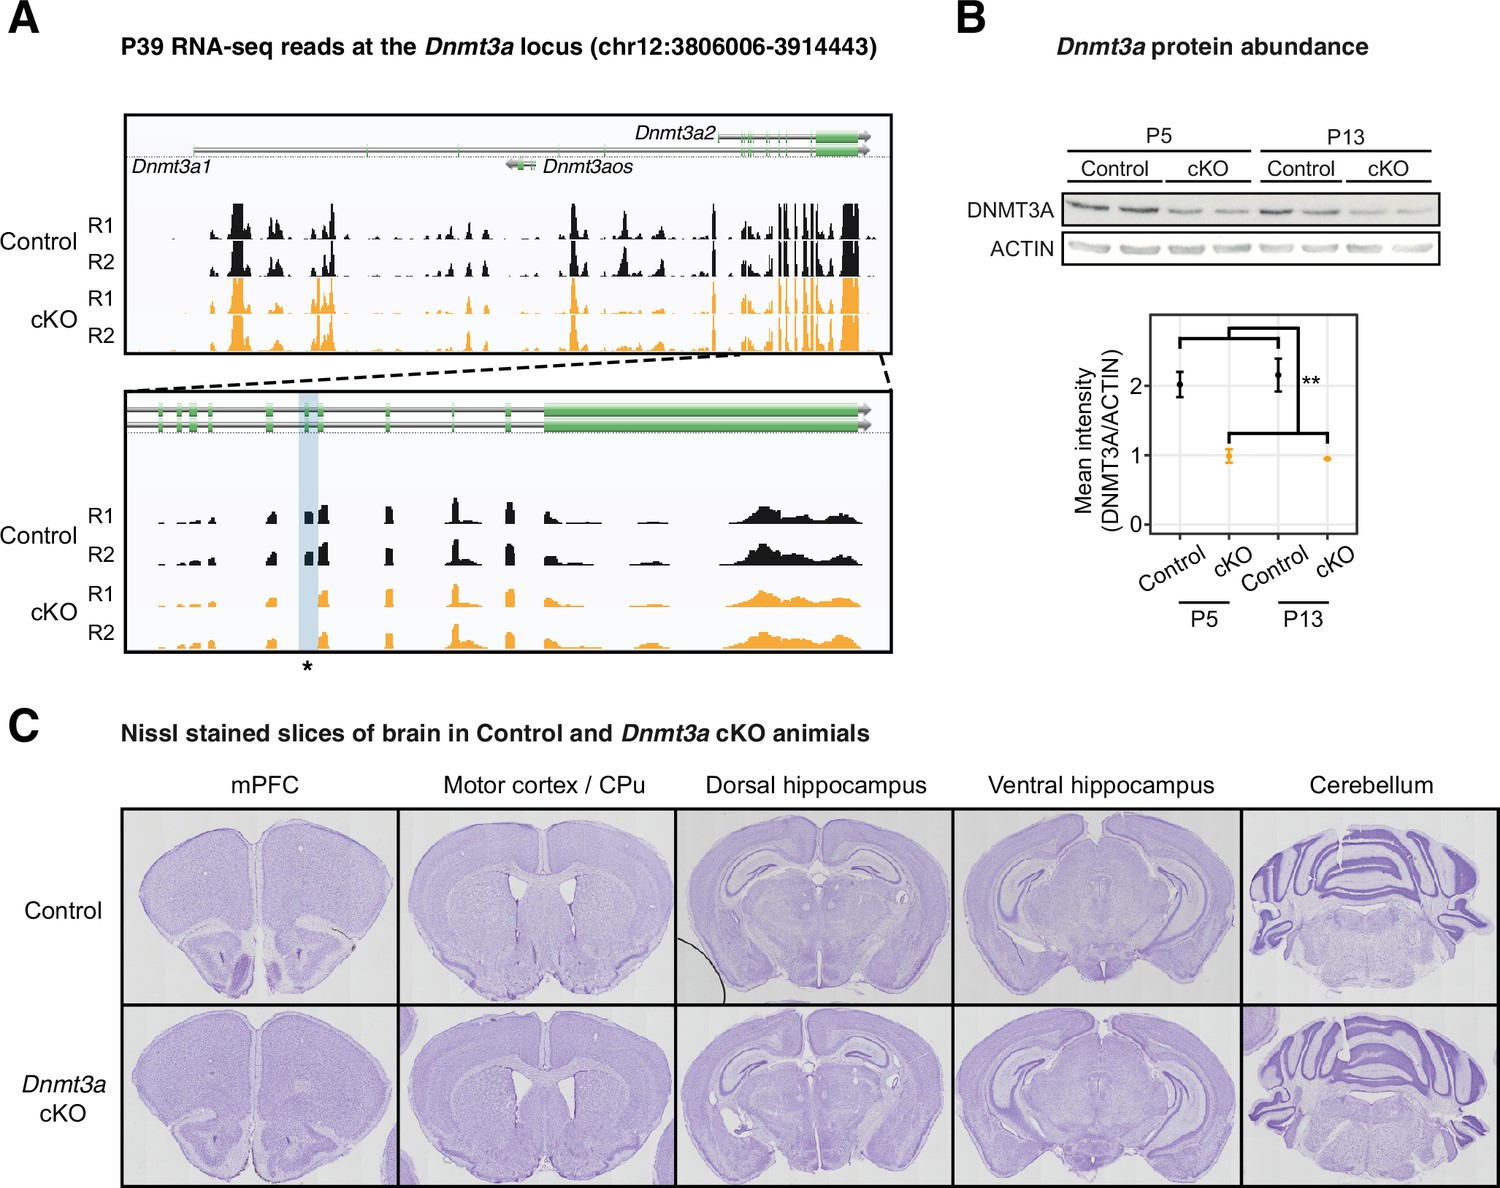
Dnmt3a was disrupted on both the mRNA and protein levels in the Dnmt3a conditional knockout (cKO) excitatory neurons.
(A) Genome browser tracks of mRNA-seq data show confirmation of the deletion of Dnmt3a exon 19 in P39 Dnmt3a cKO excitatory neurons. The targeted exon region is highlighted in the light blue shaded box with an asterisk. R1/2, replicate 1/2. (B) The protein product of the Dnmt3a gene is disrupted in the cKO sample. Top panel, Western blot; Bottom panel, quantification of the protein abundance. P5 and P13, postnatal days 5 and 13. **, t-test p=0.0017. (C) Nissl-stained slices show no morphological alterations in the brain of the Dnmt3a cKO animals. mPFC, medial prefrontal cortex; CPu, caudate putamen.
Figure 1—figure supplement 4
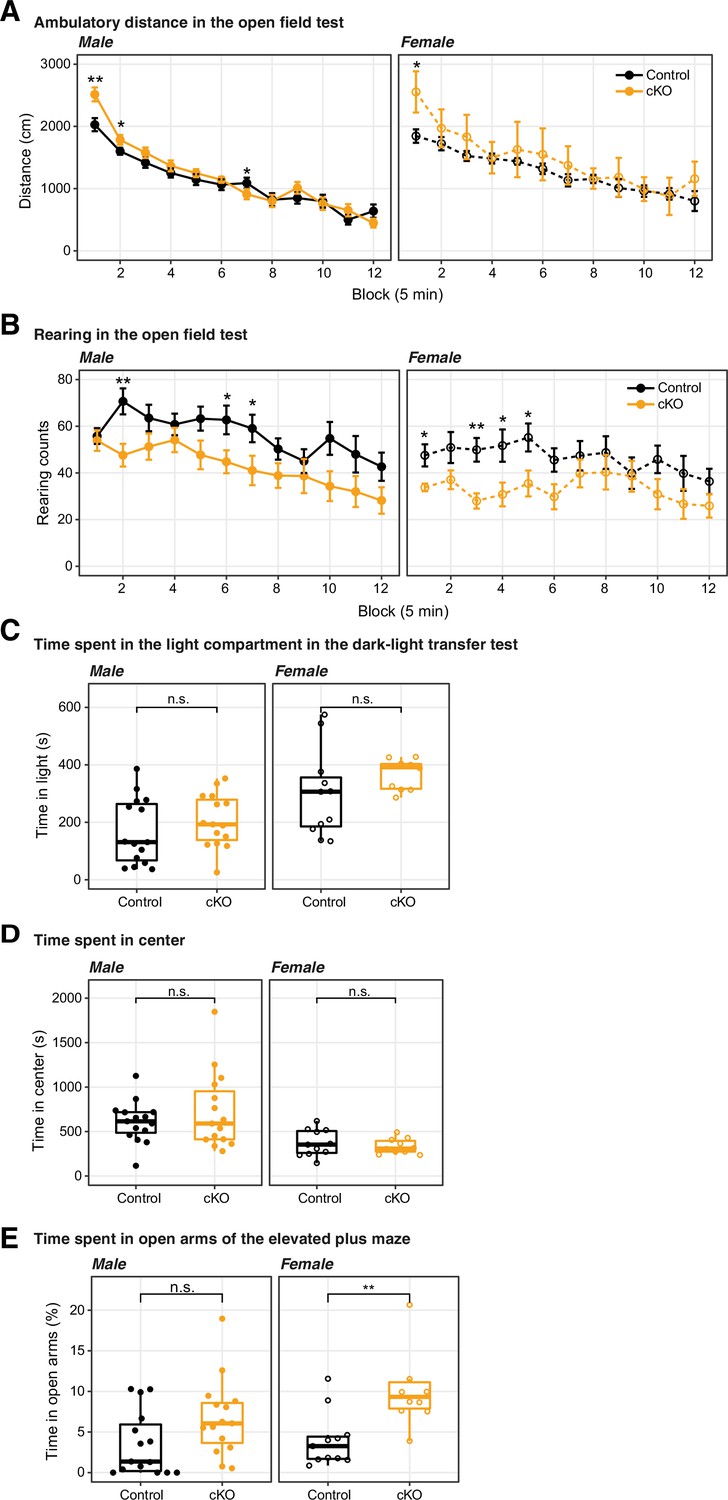
The conditional ablation of Dnmt3a in pyramidal neurons did not significantly impair motor activity nor increased anxiety levels.
(A) and (D) Dnmt3a conditional knockout (cKO) mice displayed normal behavior in the open field test, traveling a similar distance (A) as control mice, and also showing a similar degree of center activity (D) (B) The exploratory activity was slightly decreased in Dnmt3a cKO animals, as suggested by an attenuated rearing behavior. (C) The time spent in light in the dark-light transfer test was not significantly affected by the lack of Dnmt3a. (E) The female, but not the male, cohort of Dnmt3a cKO mice spent significantly more time than control mice in the open arms of the elevated plus maze, consistent with lower anxiety levels (Wilcoxon test, **, p=0.0048; n.s., not significant.). In the line plots (A–B), data were presented as mean ± SEM In all boxplots (C–E), the middle horizontal bar represents the median; the lower and upper hinges correspond to the first and third quartiles, and the whisker extends from the hinge to the value no further than 1.5 * IQR from the hinge, where IQR is the interquartile range. The values of individual experiments are represented by dots superimposed on the boxplots. Wilcoxon test significance: *, p<0.05; **, p<0.01; n.s., not significant.
Figure 1—figure supplement 5
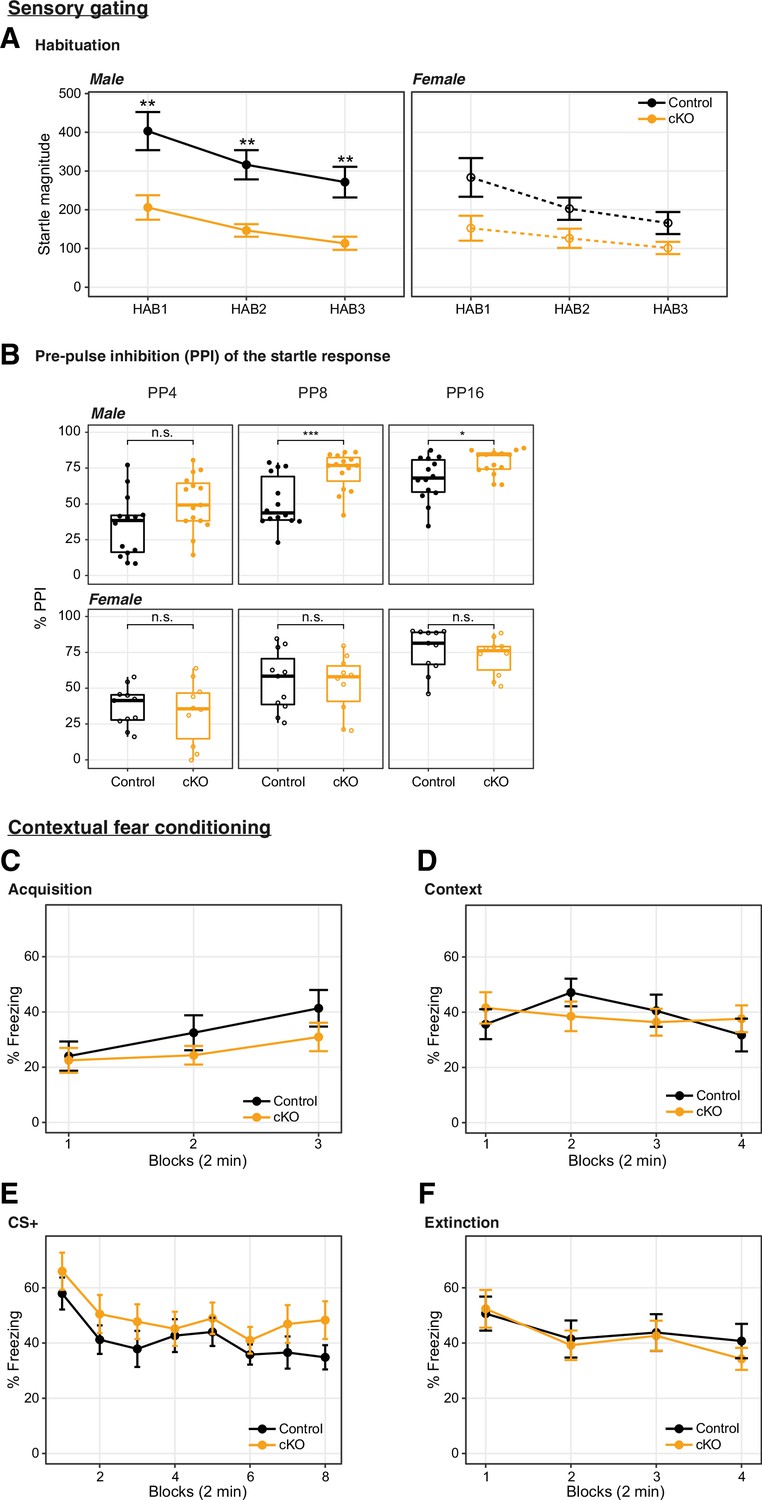
Dnmt3a conditional knockout (cKO)-induced impairment of startle response was accompanied by increased prepulse inhibition (PPI), and the cKO did not affect fear memory.
(A) The increased PPI accompanied the impairment in startle responses to a 120 dB tone played at three time points during the recording session (HAB1 – beginning of the session; HAB2 – middle of the session; HAB3 – end of the session) (Wilcoxon test p=0.0027, 0.0019, and 0.0035 in male HAB1, HAB2, HAB3, respectively, and not significant in female). The habituation to the 120 dB auditory tone (i.e. the relative reduction in startle response throughout the experiment) was not significantly different between genotypes. (B) The percentage of PPI at prepulse intensity of 69, 73, and 81 dB (4, 8, and 16 dB above the 65 dB background, respectively) was increased in male, but not female mice (Wilcoxon test, ***, p=0.00076; *, p=0.016; n.s, not significant). (C–F) Fear learning and extinction were tested over 4 consecutive days. N=14–15 per group. (C) Fear acquisition to three tone-shock pairings occurred on day 1; (D) contextual fear in relation to the acquisition context (8 min, Block = 2 min) was measured on day 2; (E) cued fear recall and extinction training occurred on day 3 (Block = 4 tone trials); and (F) extinction recall (Block = 4 tone trials) occurred on day 4. Wilcoxon test reported no significant changes between the Dnmt3a cKO and control. In boxplots (A), the middle horizontal bar represents the median; the lower and upper hinges correspond to the first and third quartiles, and the whisker extends from the hinge to the value no further than 1.5 * IQR from the hinge, where IQR is the interquartile range. The values of individual experiments are represented by dots superimposed on the boxplots. In the line plots (B–F), data were presented as mean ± SEM.
Figure 2 with 2 supplements
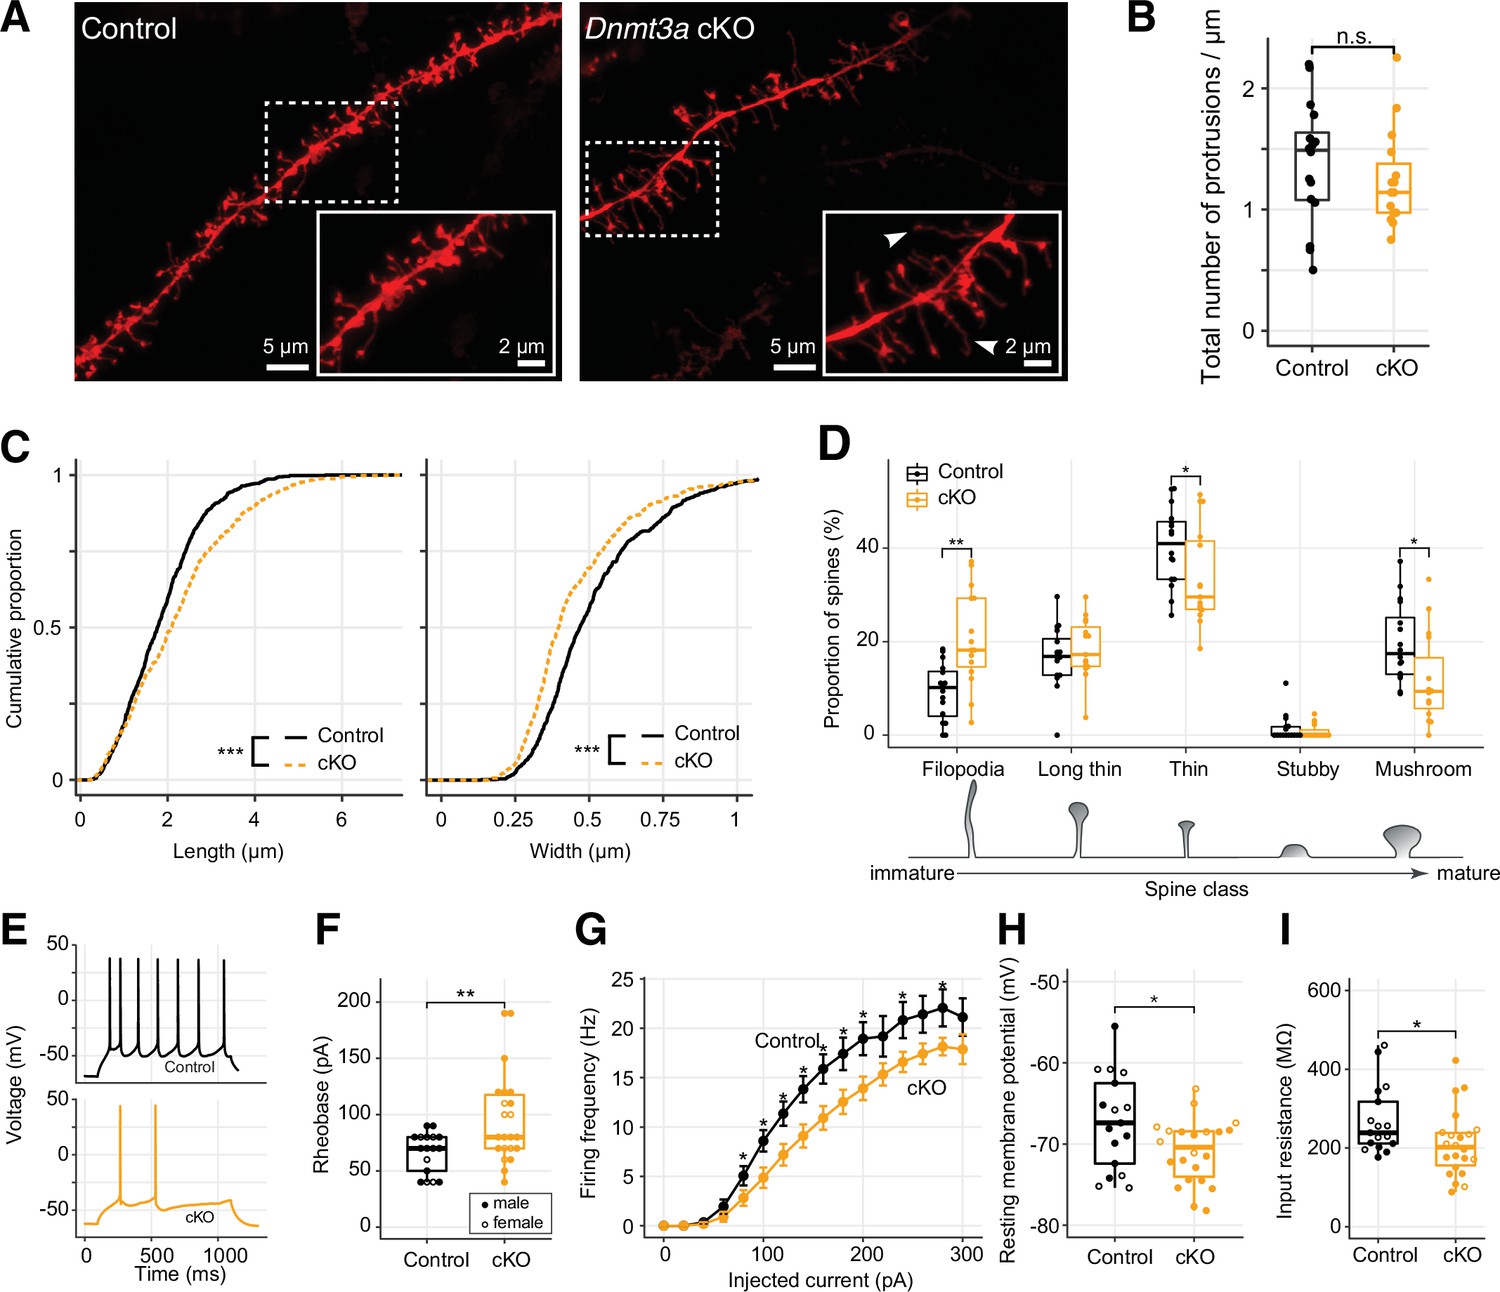
Immature spine morphology and reduced excitability of layer 2 excitatory neurons following Dnmt3a conditional knockout (cKO).
(A) Example dendritic segments of layer 2 pyramidal neurons in the prelimbic region labeled with DiI and visualized using a 63× objective coupled to an Airyscan confocal microscope. Arrowheads show filopodia, which were more abundant in Dnmt3a cKO mice. (B) The density of membrane protrusions was unchanged in the Dnmt3a cKO (Wilcoxon test, n.s., not significant). (C) Membrane protrusions were significantly longer and narrower in the Dnmt3a cKO (KS test, p<0.001). (D) More spines were classified as immature filopodia, and fewer as mature mushroom-shaped spines with large postsynaptic densities in the Dnmt3a cKO (Wilcoxon test, **, p=0.0015; *, p=0.046 and 0.011 for thin and mushroom, respectively). (E) Example whole-cell patch-clamp recordings from prelimbic layer 2 pyramidal neurons following 60 pA current injections. (F) The median rheobase (i.e. the minimal current necessary to elicit an action potential) was significantly higher in the Dnmt3a cKO (t-test, **, p=0.0042). (G) Action potential frequency vs. injected current (mean ± SEM) showed reduced excitability in Dnmt3a cKO (Wilcoxon test, *, p<0.05). (H) and (I) Dnmt3a cKO neurons were slightly hyperpolarized at Vrest when compared to control (Wilcoxon test, *, p=0.049) and had lower membrane resistance (Wilcoxon test, *, p=0.023).
Figure 2—figure supplement 1
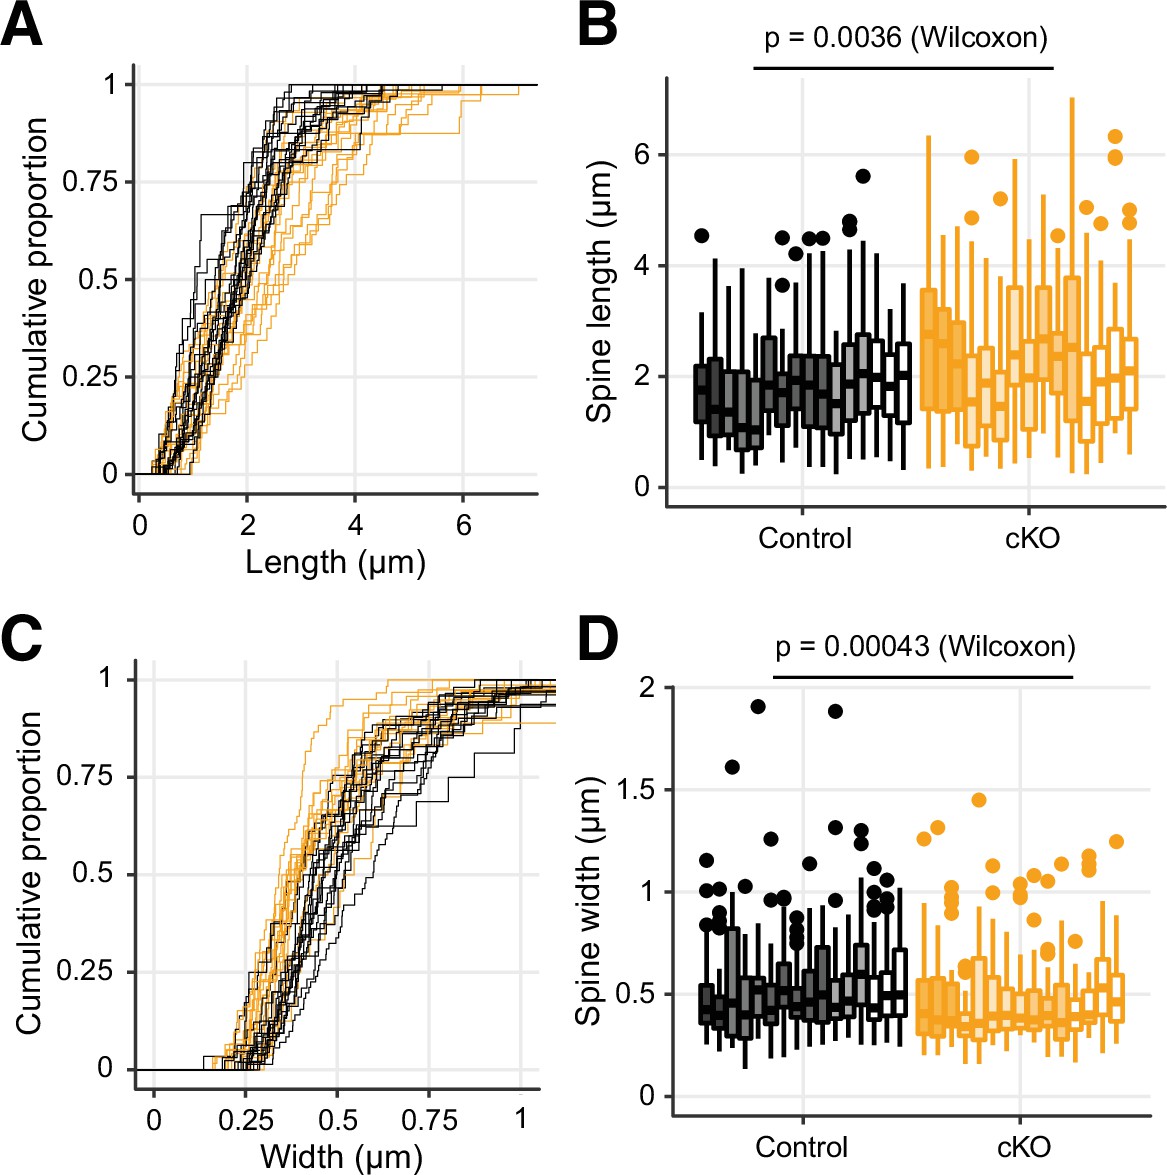
The membrane protrusions in the Dnmt3a conditional knockout (cKO) showed longer dendritic spines and narrower heads.
Related to Figure 2C. Here, each line/box represents data from one dendrite fragment. (A) and (C) The cumulative distribution of the length (A) and width (C) of membrane protrusions in the Dnmt3a cKO (orange), as compared to control mice (black). (B) and (D) Distribution of the length (B) and width (D) of the protrusions. The shaded colors in the box represent the individual animals from which the dendrite fragment originated (5 control mice and 4 cKO mice). The middle horizontal bar represents the median; the lower and upper hinges correspond to the first and third quartiles, and the whisker extends from the hinge to the value no further than 1.5 * IQR from the hinge, where IQR is the interquartile range. The Wilcoxon test was done with the medians of the boxes (16 control vs. 15 cKO).
Figure 2—figure supplement 2

The conditional ablation of Dnmt3a in pyramidal neurons did not significantly alter the membrane potential threshold for action potential generation, the mean amplitude, or frequency of miniature excitatory postsynaptic events.
(A) Action potentials were initiated at a similar membrane potential in both genotypes (Wilcoxon test, n.s., not significant). (B) While miniature excitatory postsynaptic currents (mEPSCs) amplitude was not significantly different between genotypes (Wilcoxon test, n.s., not significant), it was slightly, yet significantly, more variable in the Dnmt3a conditional knockout (cKO) (F-test, p=0.0032). (C) mEPSCs frequency was not significantly changed. In all boxplots, the middle horizontal bar represents the median; the lower and upper hinges correspond to the first and third quartiles, and the whisker extends from the hinge to the value no further than 1.5 * IQR from the hinge, where IQR is the interquartile range. The values of individual experiments are represented by dots superimposed on the boxplots.
Figure 3 with 5 supplements

Loss of Dnmt3a leaves thousands of genomic regions in a fetal-like demethylated state.
(A) 70 genes were differentially expressed (DE) (false discovery rate [FDR] < 0.05) in P39 pyramidal neurons in Dnmt3a conditional knockout (cKO) vs. control. Top, fold-change (FC) between cKO and control; bottom, heatmap showing normalized expression of the DE genes in each sample. Z-scores were computed using mRNA counts per million (CPM) for each DE gene. (B) Differential gene expression in control vs. Dnmt3a cKO excitatory neurons at P39. Significant up-regulated and down-regulated DE genes are shown in red and blue, respectively. Differentially expressed (DE) genes associated with dendrite morphogenesis (Elavl4, Hecw2, Ptprd), and regulation of Na+ (Hecw2, Scn3b) and Ca2+ levels (Cacnb3) are labeled. (C) Non-CG DNA methylation (mCH) is eliminated, and mCG is reduced, in P39 Dnmt3a cKO pyramidal cells, while mCG and mCH levels are not changed in P0 (t-test: *, p<0.05; n.s., not significant). P0 and P39, postnatal days 0 and 39, respectively. Each bar represents the methylation level in one replicate. (D) Non-CG DNA methylation (mCH) in P39 pyramidal cells in control samples, in 1 kb bins in the flanking region around the transcription start (TSS) and end site (TES) of DE genes and non-DE genes with matched expression levels. The lines denote the means across genes in each gene set, and the shared areas represent the 95% confidence intervals of the means. (E) The difference in gene body methylation vs. fold-change of gene expression between P39 Dnmt3a cKO and control. The plots show mean ± SEM gene expression fold-change for genes in 10 non-overlapping bins (deciles of mC difference). (F) The Nedd4 promoter locus contains five differentially methylated regions (DMRs, yellow horizontal rectangles and shaded in blue boxes) with naive, fetal-like mCG in P39 Dnmt3a cKO. Ticks show mCG at CG sites. Four out of the five P39 Dnmt3a cKO DMRs overlapping developmental gain-of-methylation DMRs (red horizontal rectangles) are marked with arrows. CGI, CpG island. R1 and R2, replicates 1 and 2. (G) Overlap of P39 Dnmt3a cKO DMRs and developmental DMRs. (H) P39 Dnmt3a cKO hypo-DMRs are significantly enriched (depleted) in DMRs that normally gain (lose) methylation during development (Fisher’s test, p<0.05).
Figure 3—figure supplement 1
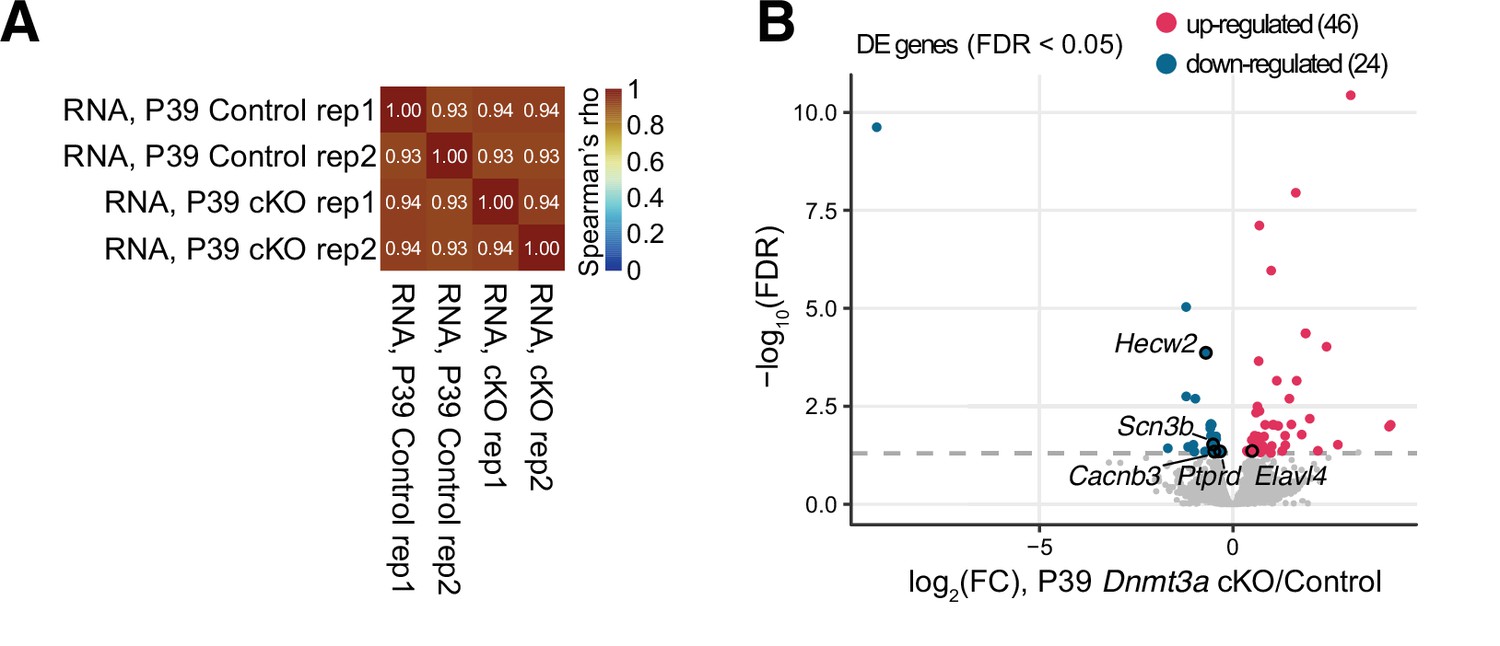
RNA-seq data showed transcriptomic disruption in P39 Dnmt3a conditional knockout (cKO) pyramidal neurons.
(A) Correlation matrix of gene expression (log10TPM) in the biological replicates of the control and Dnmt3a cKO mouse excitatory neurons. The color bar represents the Spearman correlation coefficients. (B) Volcano plot shows the gene expression fold-change of P39 Dnmt3a cKO vs. control samples and their significance. Significant up-regulated and down-regulated differentially expressed genes (DE genes, false discovery rate [FDR] < 0.05) are colored in red and blue, respectively. DE genes associated with dendrite morphogenesis (Elavl4, Hecw2, Ptprd), and regulation of Na+ (Hecw2, Scn3b) and Ca2+ levels (Cacnb3) are labeled.
Figure 3—figure supplement 2
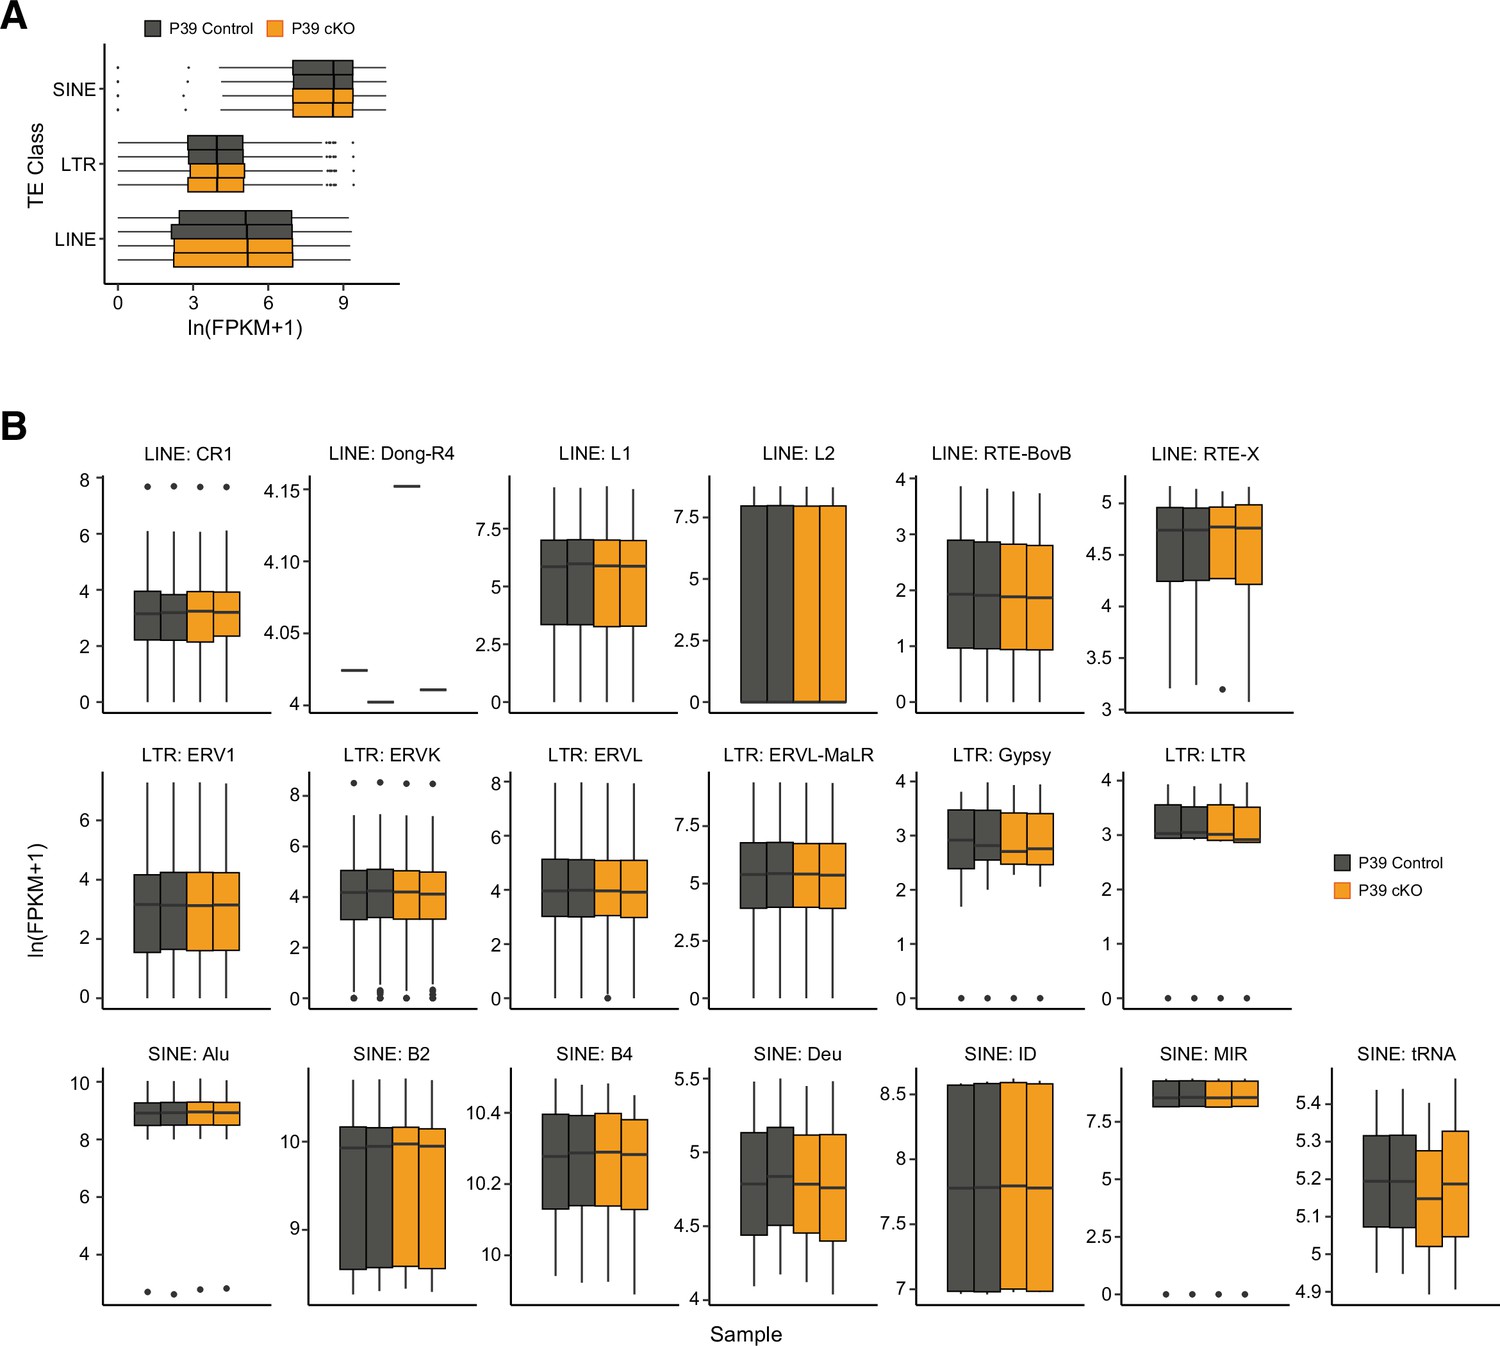
The expression of transposable elements (TEs) was not affected by Dnmt3a conditional knockout (cKO).
TE subfamily expression was estimated in fragments per kilobase per million (FPKM) from P39 control and Dnmt3a cKO samples grouped by TE class (A) and TE family (B).
Figure 3—figure supplement 3
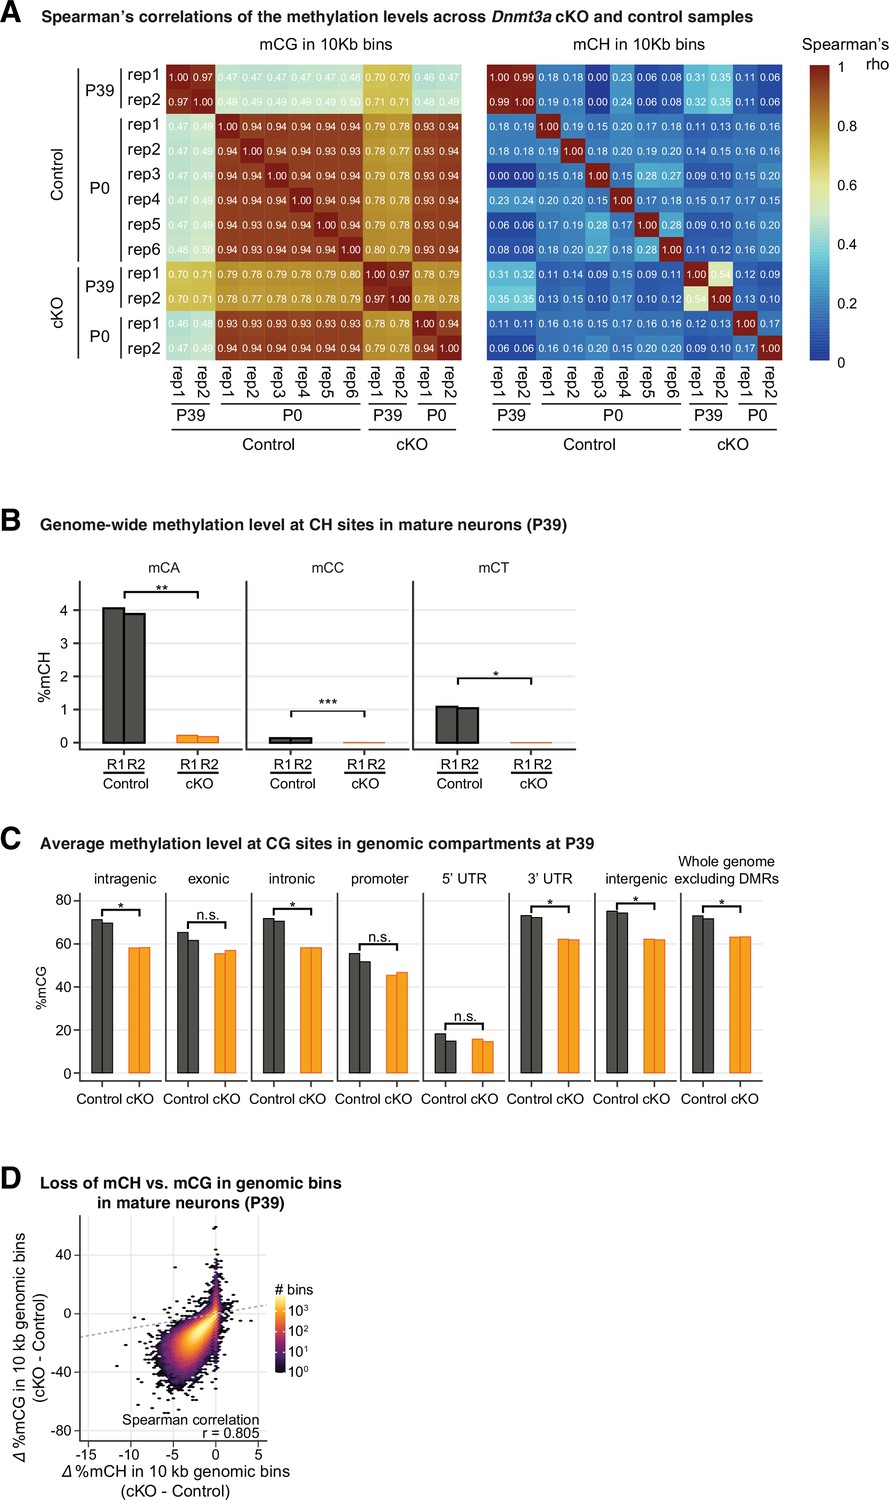
Genome-wide reduction of DNA methylation was observed in Dnmt3a conditional knockout (cKO).
(A) Heatmap to show the Spearman correlations across the control and Dnmt3a cKO samples from P39 and P0 animals. The correlations coefficients were computed using CG methylation levels in 10 kb genomic bins (left) and CH methylation levels in 10 kb genomic bins (right). (B) The reduction of genome-wide DNA methylation level in P39 is observed in all three non-CG contexts (CA, CC, and CT). t-test significance, **, CA, p=0.009745; ***, CC, p=0.0009546; *, CT, p=0.01323. (C) DNA methylation at CG sites is reduced across most functional genomic compartments in P39. UTR, untranslated region. t-test significance, *, p<0.05; n.s., not significant. (D) Reduced mCG is strongly correlated with the reduction in mCH in P39 in 10 kb tiling genomic bins (259,718 bins with at least 10 reads covered in each sample). r, Spearman correlation coefficient.
Figure 3—figure supplement 4

Reduction of DNA methylation cannot fully explain the disruption in the transcriptome after Dnmt3a conditional knockout (cKO).
(A) Correlation of gene expression and gene body mCH level for up-regulated genes (red), down-regulated genes (blue), and non-differentially expressed (DE) genes (black, false discovery rate [FDR] ≥ 0.05 and fold-change <1.1) in the P39 control samples. For each gene group, genes are stratified by their expression in the control sample by 15 bins, and the mean gene body mCH levels are plotted. The shaded ribbon areas indicate the standard error of the mean. TPM, transcripts per million. (B) Violin plots to show the expression levels of non-DE genes (gray) selected to match baseline expression as those in significantly (FDR < 0.05) up-regulated genes (left, red) and down-regulated genes (right, blue). (C) CG DNA methylation (mCG) in P39 pyramidal cells in 1 kb bins in the region around the transcription start (TSS) and end site (TES) of DE genes and non-DE genes with matched expression levels. The lines denote the means across genes in each gene set, and the shared areas represent the 95% confidence intervals of the means. (D) Density scatter plots show the relationship between changes of gene body methylation (delta mCG or mCH) and the gene expression fold-changes for expressed genes (14,754 genes) between P39 Dnmt3a cKO and control samples. The linear regression fits, p-values, and variances explained by ∆%mC (R2) are shown. (E) Gene length distribution of P39 DE genes (FDR < 0.1). As a comparison, non-DE genes were selected with FDR ≥ 0.1 and fold-change <1.1 (see Supplementary file 2). The down-regulated genes are generally shorter than the up-regulated genes or the non-DE genes. kb, kilobases. Wilcoxon test, ****, p<10–4; **, p<0.01; n.s. not significant.
Figure 3—figure supplement 5
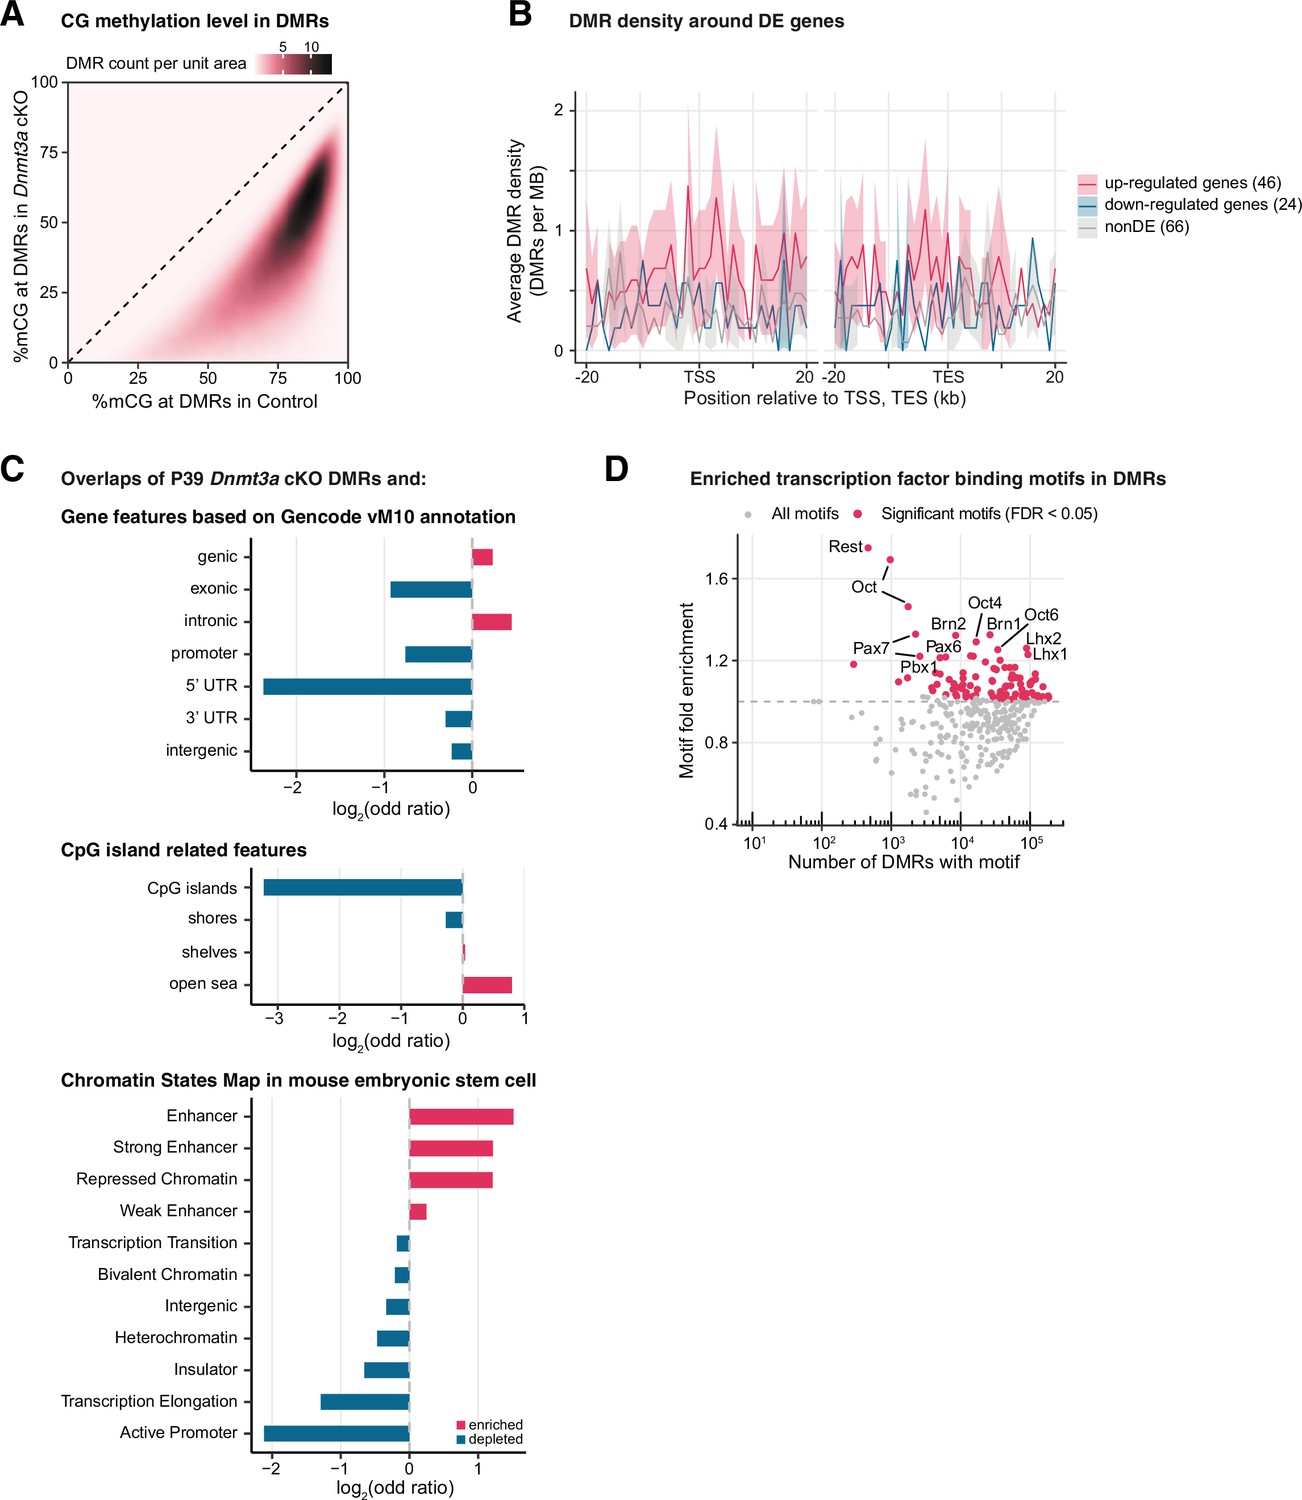
Differentially methylated regions (DMRs) in P39 Dnmt3a conditional knockout (cKO) were associated with regulatory regions in enhancers and repressed chromatin.
(A) 2D distribution of mCG levels in P39 control vs. Dnmt3a cKO samples at DMRs. DMR density is estimated through a Gaussian smoothed kernel. (B) The density of P39 Dnmt3a cKO hypo-DMRs around significant differentially expressed (DE) genes (false discovery rate [FDR] < 0.05) and non-DE genes with matched expression levels. The lines denote the means across genes in each gene set, and the shared areas represent the 95% confidence intervals of the means. TSS, transcription start site; TES, transcription end site. (C) Enrichment (red) or depletion (blue) of P39 cKO DMRs in GENCODE annotated gene features (top), in CpG island-related features (middle), and in the chromatin states map in mouse embryonic stem cell (bottom). All enrichments and depletions shown are significant (Fisher’s test p<0.05). (D) Number of known transcription factor binding motifs within P39 Dnmt3a cKO hypo-DMRs and their fold enrichment. Significant motifs (FDR < 0.05) are colored in red.
Figure 4 with 3 supplements

Polycomb repressive complex 2 (PRC2) associated histone modification H3K27me3 is up-regulated following the loss of DNA methylation.
(A) Transcription factors (TFs) predicted to regulate P39 Dnmt3a conditional knockout (cKO) differentially expressed genes include many proteins associated with PRC2. The functional TF rank score was assigned by Binding Analysis of Regulation of Transcription (BART; Wang et al., 2018). PRC2-associated TFs are labeled and highlighted in gold circles. (B) Browser view of the Mab21l2 locus, where increased H3K27me3 (differentially modified regions, bottom red bars and highlighted in blue shaded box) coincides with the loss of DNA methylation (Dnmt3a cKO DMRs, orange bars under the ‘P39 cKO’ track and highlighted in blue shaded box) in P39 Dnmt3a cKO. This region loses H3K27me3 during normal development in control pyramidal neurons (blue bars, P39 < E14). DMR, differentially methylated region; E14, embryonic day 14; P0 and P39, postnatal days 0 and 39. (C) Quantification of the increase in H3K27me3 chromatin immunoprecipitation sequencing (ChIP-seq) signal in each replicate at the H3K27me3 differentially modified region between P39 control and cKO at the Mab21l2 locus shown in (B). Each bar shows the DEseq2 normalized counts in each replicate, and the triple asterisks denote a significant increase (false discovery rate [FDR] = 1.33e-4, fold-change=2.41). (D) Histone modification ChIP-seq peaks for active marks (H3K4me3, H3K27ac) are largely preserved in the Dnmt3a cKO, while repressive H3K27me3 peaks expand. The Venn diagrams denote numbers of peaks that overlap between cKO (yellow) and control (black) (numbers in the center), and numbers of peaks that are unique to one of the conditions (numbers on the edges).
Figure 4—figure supplement 1
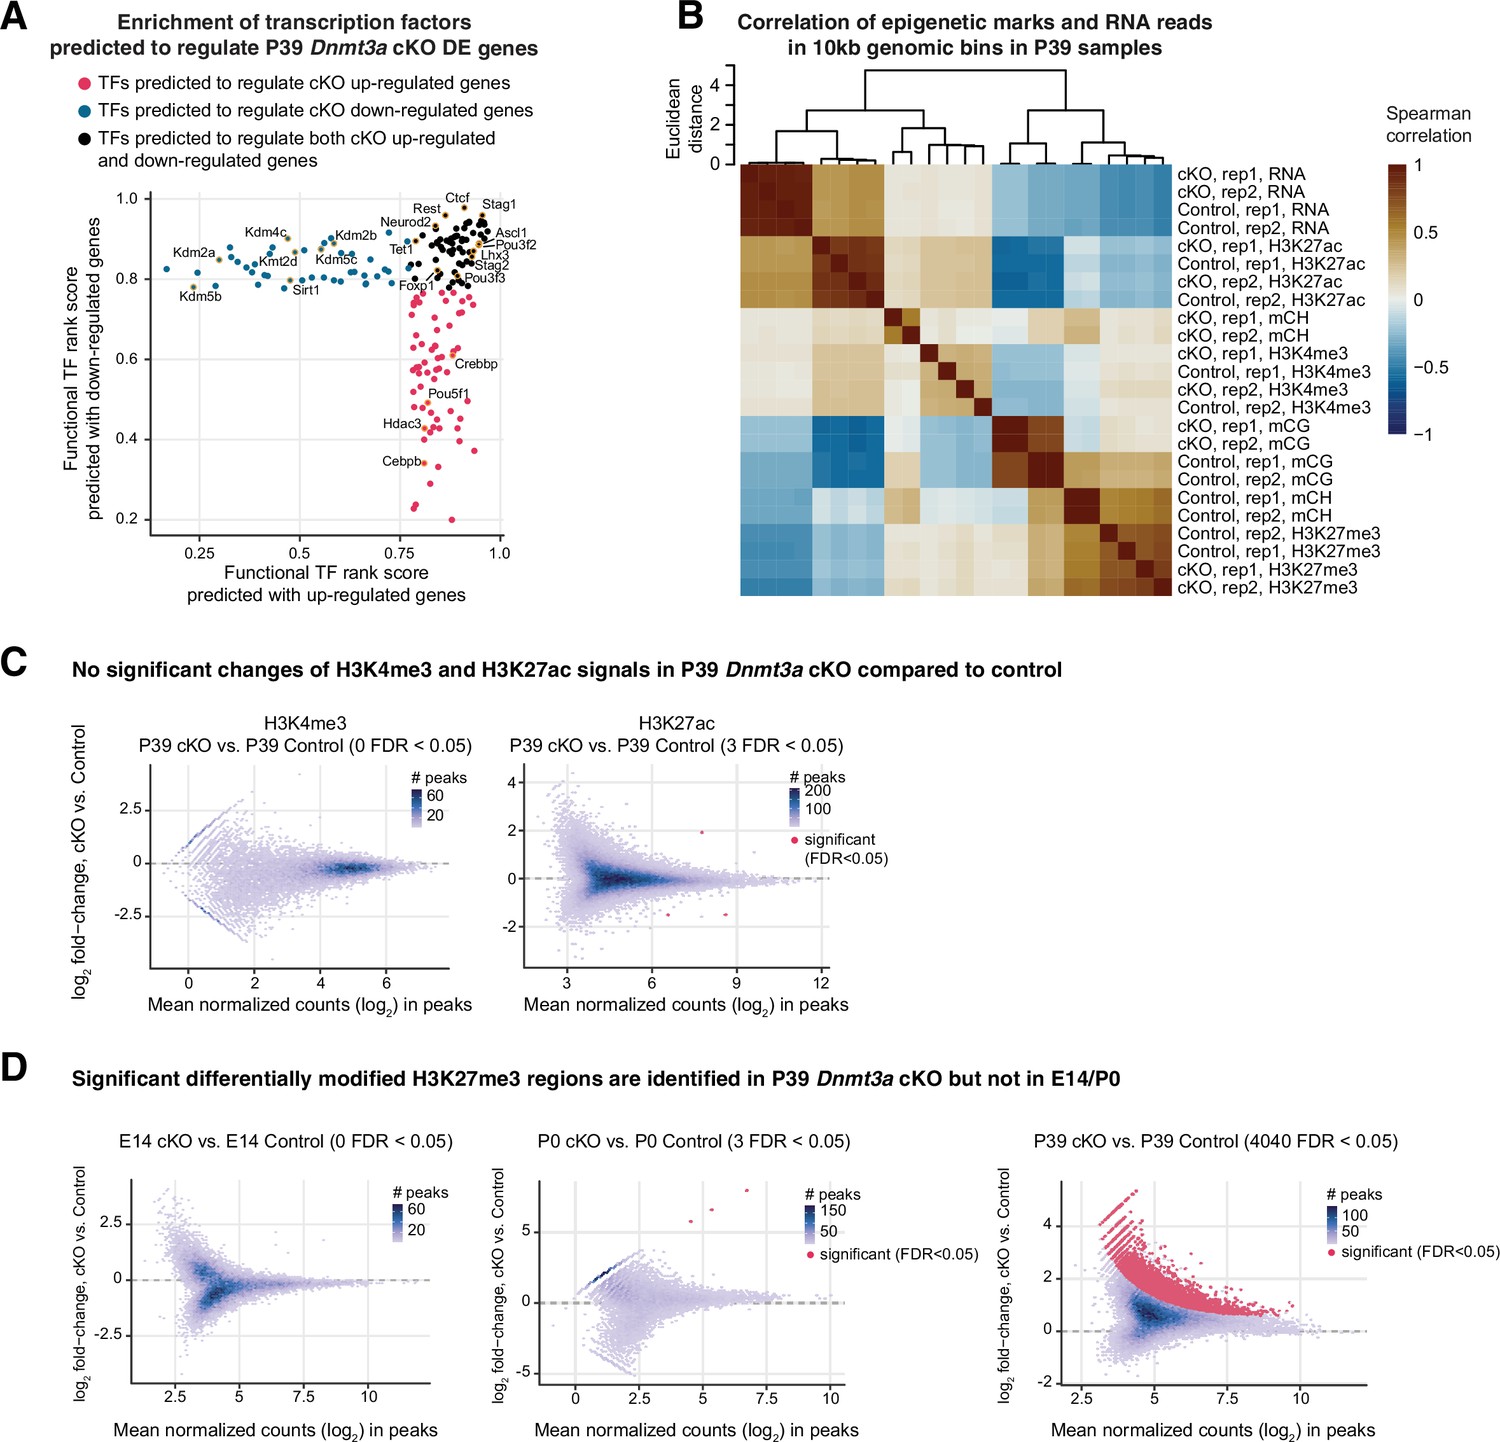
Increased signal of the repressive histone mark H3K27me3 after Dnmt3a conditional knockout (cKO).
(A) Transcription factors (TFs) associated with chromatin organization were predicted to regulate differentially expressed (DE) genes in the P39 Dnmt3a cKO. The functional TF rank score was given by Binding Analysis of Regulation of Transcription (BART; Wang et al., 2018). TFs predicted to regulate only up-regulated genes, to regulate only down-regulated genes and to regulate both the up-regulated and down-regulated genes are colored in red, blue, and black, respectively. TFs associated with chromatin organization and remodeling are labeled. (B) Correlation heatmap of epigenetic marks and RNA reads in 10 kb tiling genomic bins in P39 samples. For mCG and mCH, the mean methylation in each bin is used. For RNA-seq and histone modification chromatin immunoprecipitation sequencing (ChIP-seq), the RPKM (reads per kilobase per million) value in each bin is used. The dendrogram is calculated by hierarchical clustering with complete linkage using the Euclidean distances of the Spearman correlation across the samples. Rep1/2, replicate 1/2. (C) MA plots show no significant changes of H3K4me3 and H3K27ac signal in P39 Dnmt3a cKO compared to control. (D) MA plots show that significant differentially modified H3K27me3 regions are only found in P39 Dnmt3a cKO but not E14 or P0 when compared to control.
Figure 4—figure supplement 2
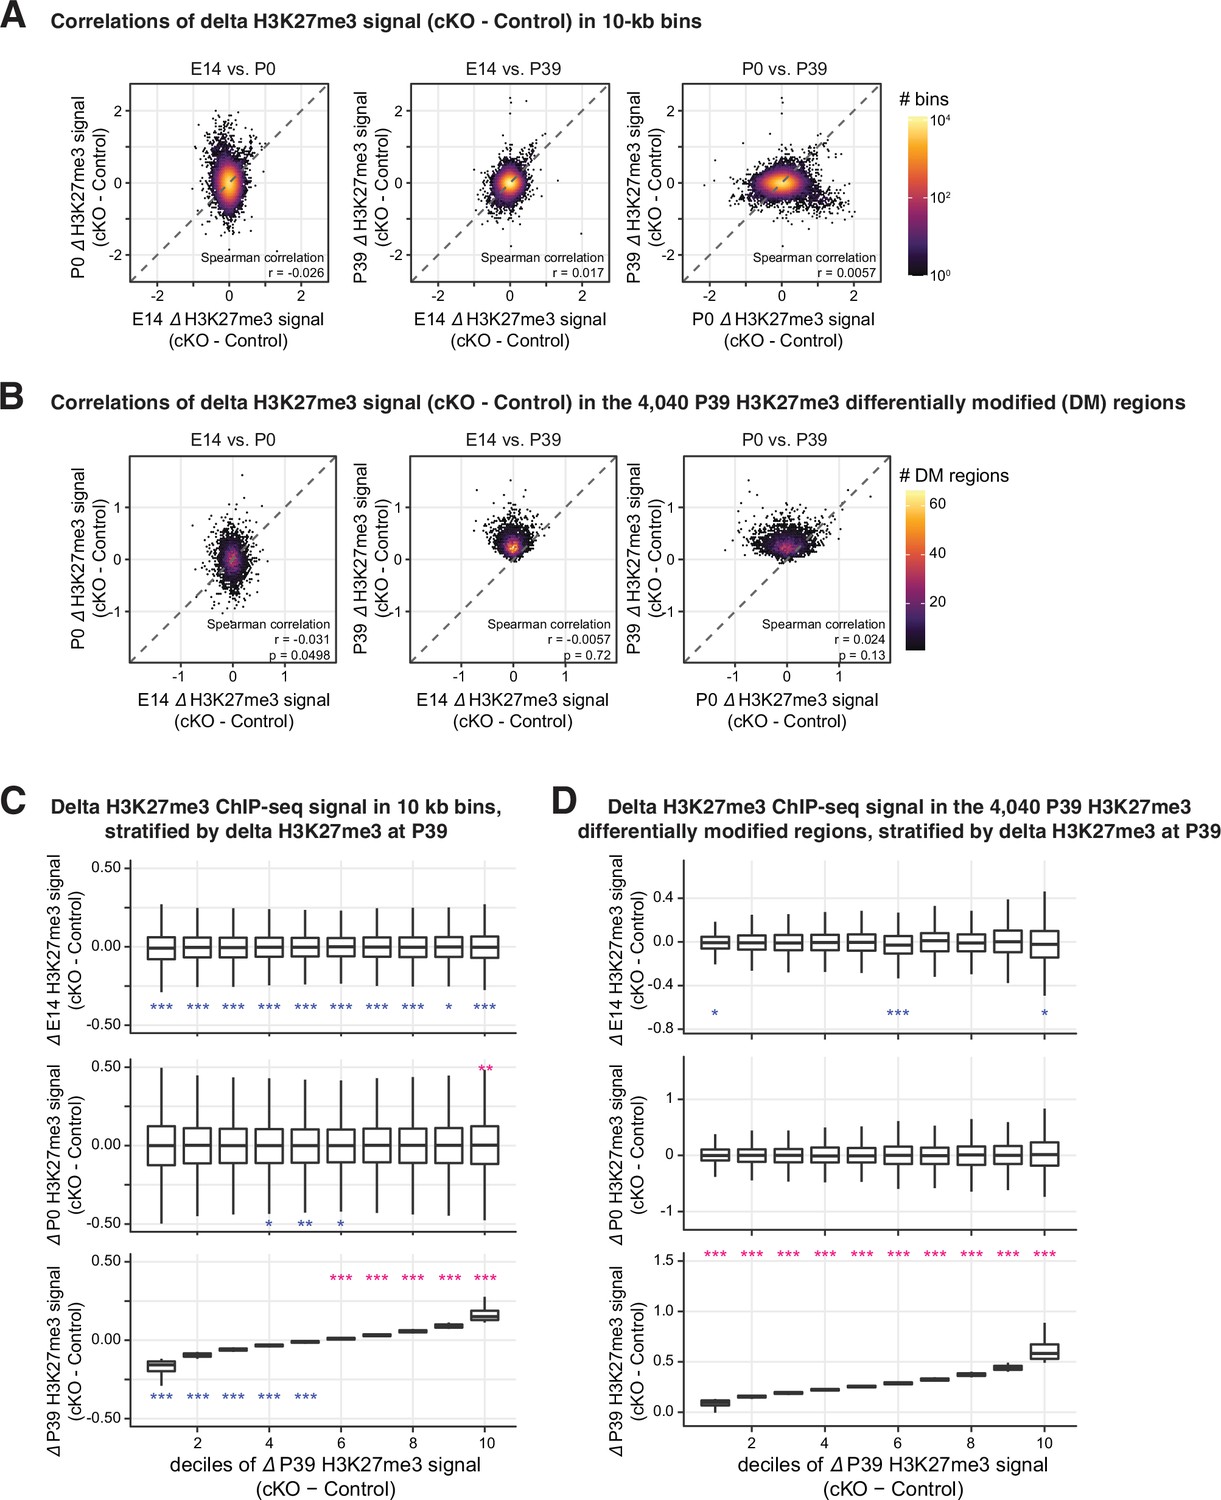
The increased H3K27me signal in P39 was generally not observed in E14 or P0.
(A–B) Correlations of the differences of H3K27me3 signal between Dnmt3a conditional knockout (cKO) and control across the three development time points in 10 kb genomic bins (A) and the P39 H3K27me differentially modified (DM) regions (B). (C–D) Boxplots to show the distribution of the differences of H3K27me3 signal between Dnmt3a cKO and control in E14, P0, and P39, stratified by ∆H3K27me3 signal at P39. Signals are counted in 10 kb genomic bins (C), as in (A) and the P39 H3K27me DM regions (D), as in (B). Asterisks show the significances from Wilcoxon rank-sum tests against zero (red, greater than zero; blue less than zero; *, p<0.05; **, p<0.01; ***, p<0.001).
Figure 4—figure supplement 3
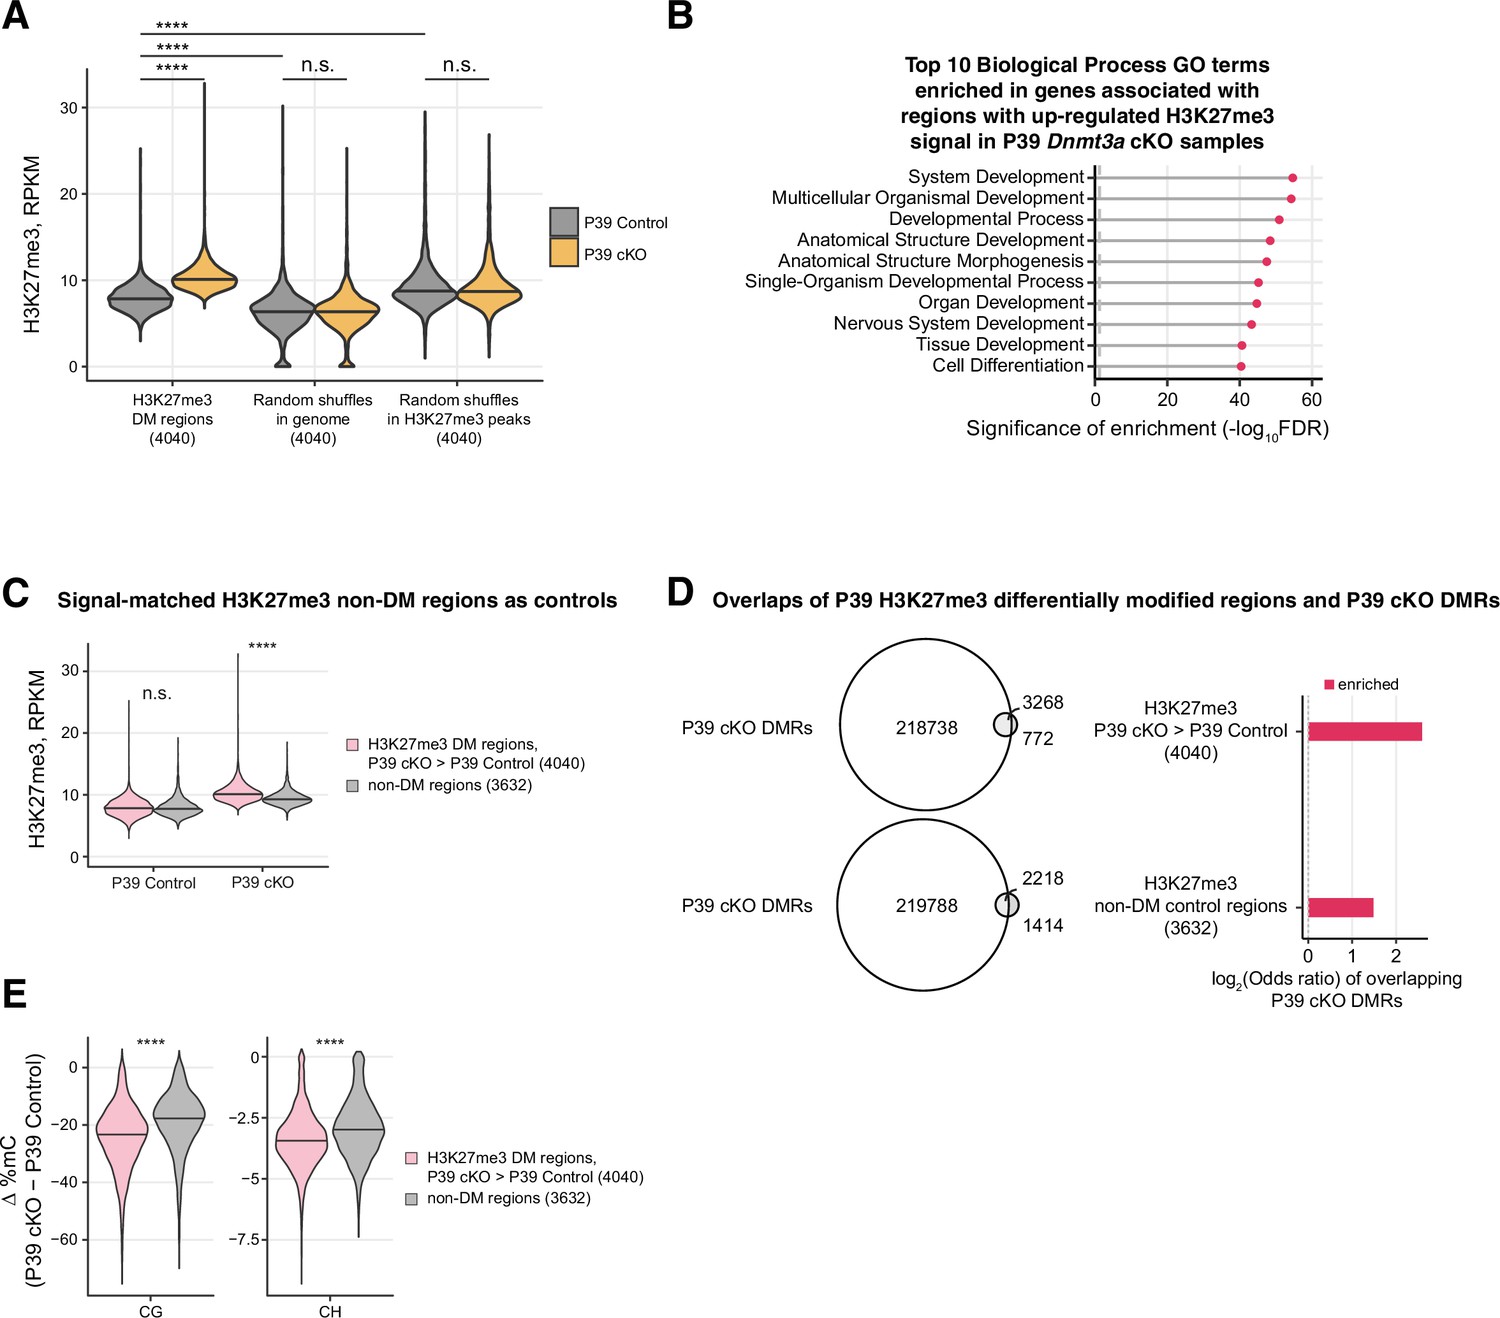
H3K27me3 differentially modified (DM) regions in P39 Dnmt3a conditional knockout (cKO) were highly overlapped with differentially methylated regions (DMRs).
(A) H3K27me3 signals in DM regions (left) compared to random shuffles across the genome (middle; keeping peak sizes and the chromosome same as DM regions) and random shuffles within H3K27me3 peaks (right; H3K27me3 peaks are the union set of cKO and control peaks; restrict shuffles within the said peaks and keeping peak sizes and the chromosome same as DM regions). ****, Wilcoxon rank-sum test p<0.0001; n.s., not significant. (B) Top 10 Gene Ontology terms of the Biological Process ontology enriched in the genes associated with regions with up-regulated H3K27me3 signal in the P39 Dnmt3a cKO samples. Gene-region association was estimated using GREAT (McLean et al., 2010). FDR, false discovery rate; the vertical dashed line shows the threshold of FDR = 0.05. (C) Violin plots to show the H3K27me3 signals in non-differentially modified regions (non-DM, gray) selected to match baseline H3K27me3 as those in significantly DM H3K27me regions (DM, red). ****, Wilcoxon rank-sum test p<0.0001; n.s., not significant. (D) Overlaps of P39 H3K27me3 DM regions with P39 Dnmt3a cKO DMRs. As a comparison, non-DM regions selected in (C) with matched H3K27me3 signal in the P39 control sample were used. Left panel, Venn diagrams to show the numbers of H3K27me3 DM and non-DM regions that overlap P39 cKO DMRs. Right panel, significant enrichments of the overlaps (Fisher’s test, p<0.05). (E) The differences of CG (left) or CH (right) methylation levels between Dnmt3a cKO and control samples in DM (red) and non-DM (gray) regions. ****, Wilcoxon rank-sum test p<0.0001.
Figure 5 with 2 supplements
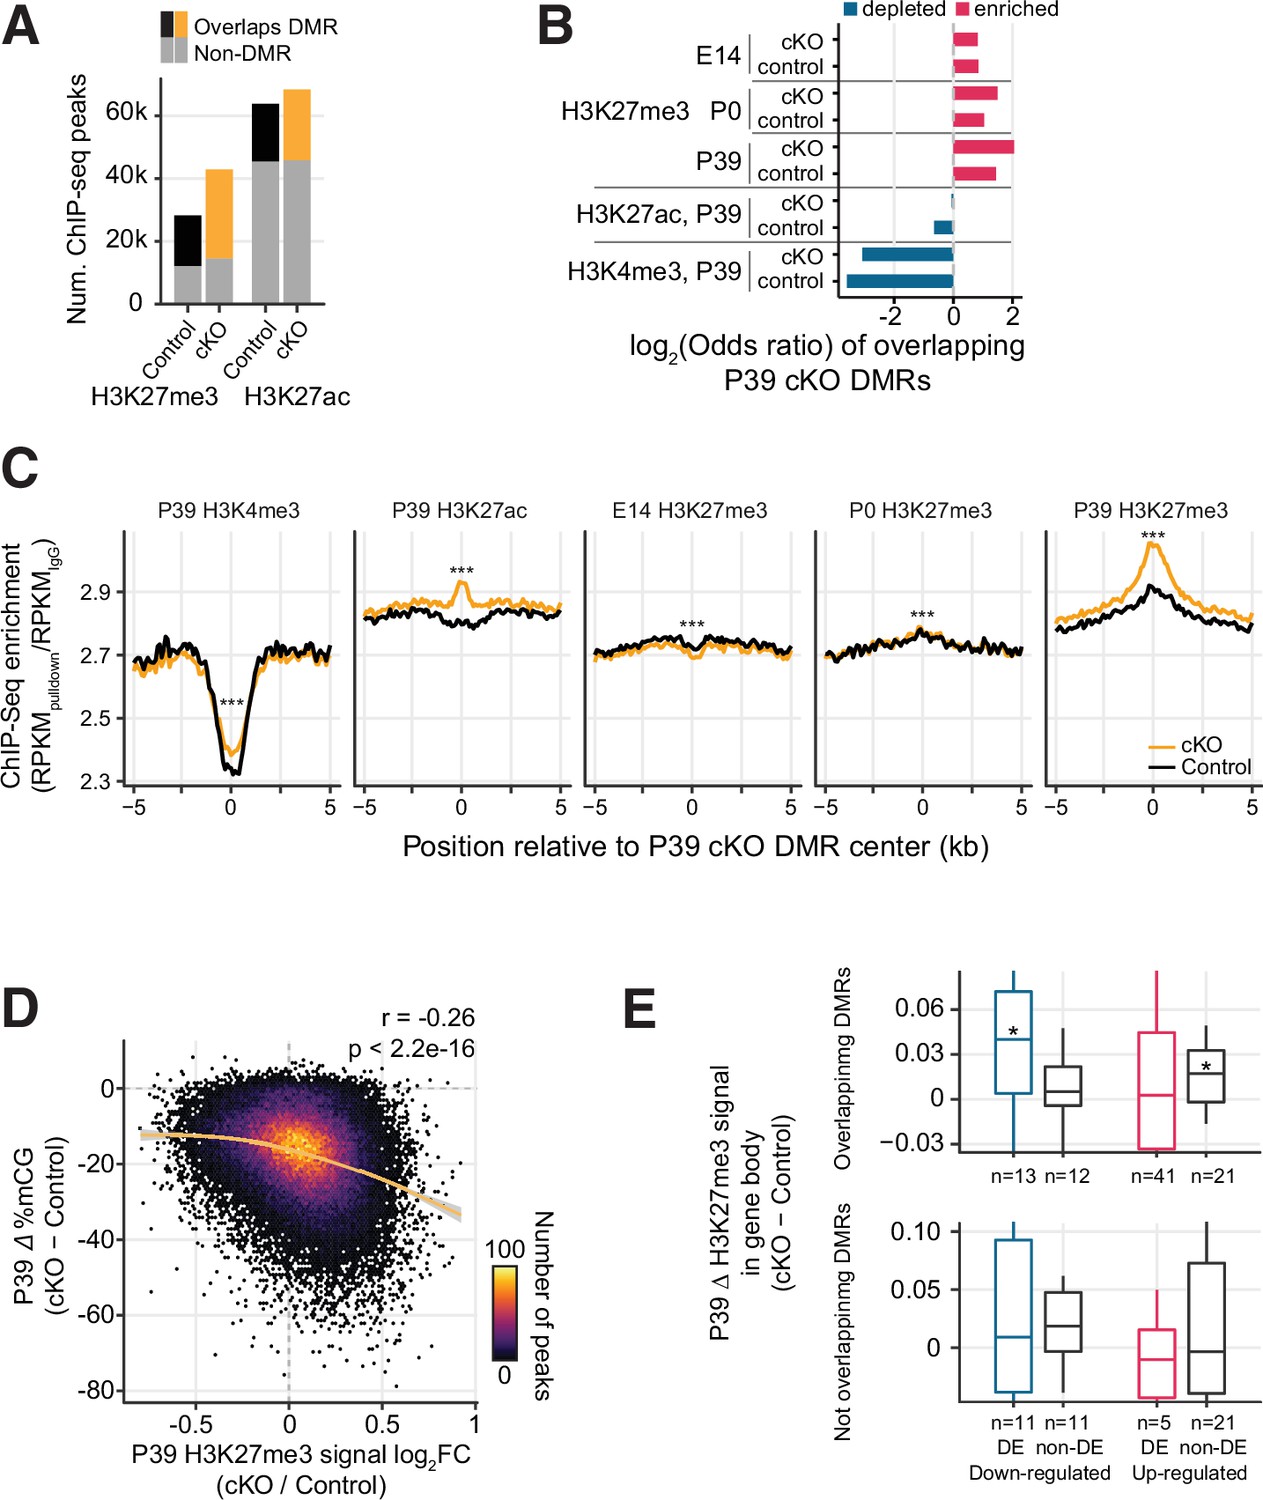
Increased H3K27me3 correlates with the loss of postnatal DNA methylation.
(A) Most of the P39 H3K27me3 peaks (57.1% and 66.2% of control and conditional knockout [cKO] peaks), but only some of the P39 H3K27ac peaks (28.9% and 33.1%), overlap with P39 Dnmt3a cKO differentially methylated regions (DMRs). (B) Significant enrichment (red) or depletion (blue) of P39 Dnmt3a cKO DMRs in the histone modification chromatin immunoprecipitation sequencing (ChIP-seq) peaks (Fisher’s test, p<0.05). E14, embryonic day 14; P0 and P39, postnatal days 0 and 39. (C) Histone modification ChIP-seq signal around the center of DMRs. RPKM, reads per kilobase per million. ***, Wilcoxon rank-sum test of the differences at the center, p<0.001. (D) Correlation of P39 H3K27me3 signal fold-changes and P39 CG methylation levels differences between Dnmt3a cKO and control in H3K27me ChIP-seq peaks. The smoothed line is fitted using a generalized additive model, and the shaded area shows the 95% confidence interval of the fit. r, Spearman correlation coefficient. (E) P39 Dnmt3a cKO down-regulated DE genes (false discovery rate [FDR] < 0.05) with overlapping P39 Dnmt3a cKO DMRs show small but significant increases of H3K27me3 in P39 cKO (upper panel). *, Wilcoxon rank-sum test against zero, p<0.05. No such differences were observed in differentially expressed (DE) genes that do not overlap with P39 cKO DMRs (bottom panel). H3K27me3 signal was calculated as the RPKM fold-change between H3K27me3 and IgG.
Figure 5—figure supplement 1
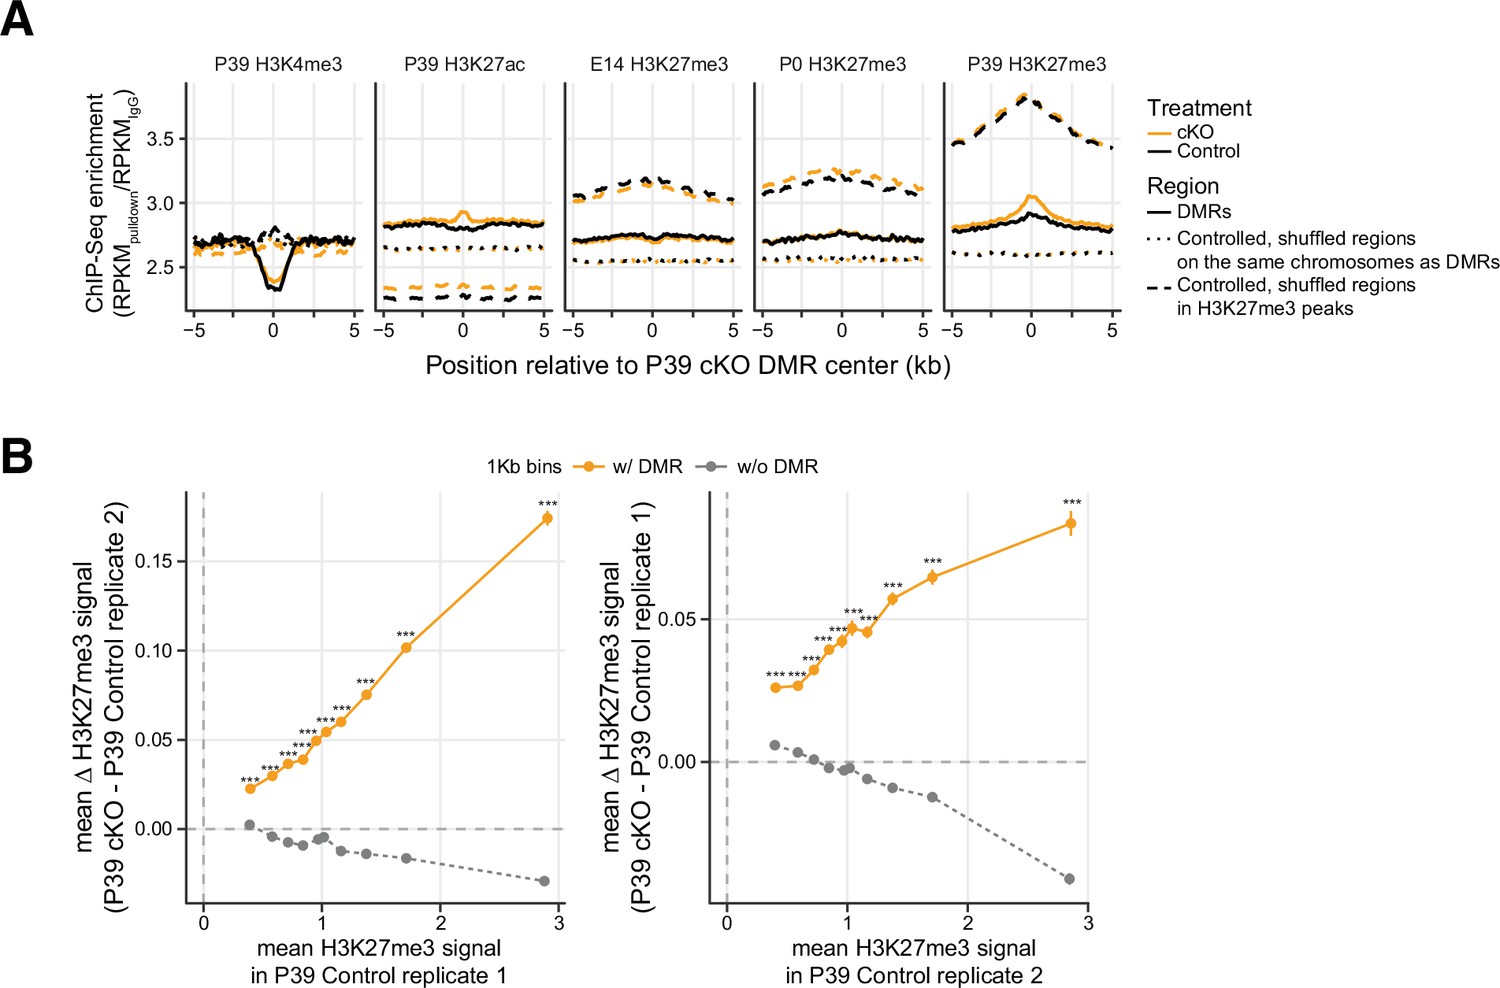
Differentially methylated regions (DMRs) are particularly unique in showing increased H3K27me3 signal.
(A) Histone modification chromatin immunoprecipitation sequencing (ChIP-seq) signal around the center of DMRs. Two sets of controlled regions were selected as comparisons: The first shuffled set (dotted lines) is regions generated by shuffling the DMRs randomly across the same chromosome (excluding blacklist regions) as the observed and keeping the same region size. The second shuffled set (dashed lines) is more stringent shuffles that meet the same criteria as the first set but with an additional restriction that the shuffles must reside within the P39 H3K27me3 peak regions (the union of P39 control and P39 cKO H3K27me3 peaks). RPKM, reads per kilobase per million. (B) The differences of H3K27me3 signal between Dnmt3a conditional knockout (cKO) and control as a function of the baseline level of H3K27me3 in control samples. 1 kb tiled genomic bins are grouped by whether or not they overlap any DMRs, and the dots represent the average signal of bins stratified by deciles of baseline H3K27me signal. Different replicates were used in computing values on the x-axis and y-axis to avoid double-dipping. Data are presented as mean ± SEM for each bin. ***, Wilcoxon rank-sum test, p<0.001.
Figure 5—figure supplement 2
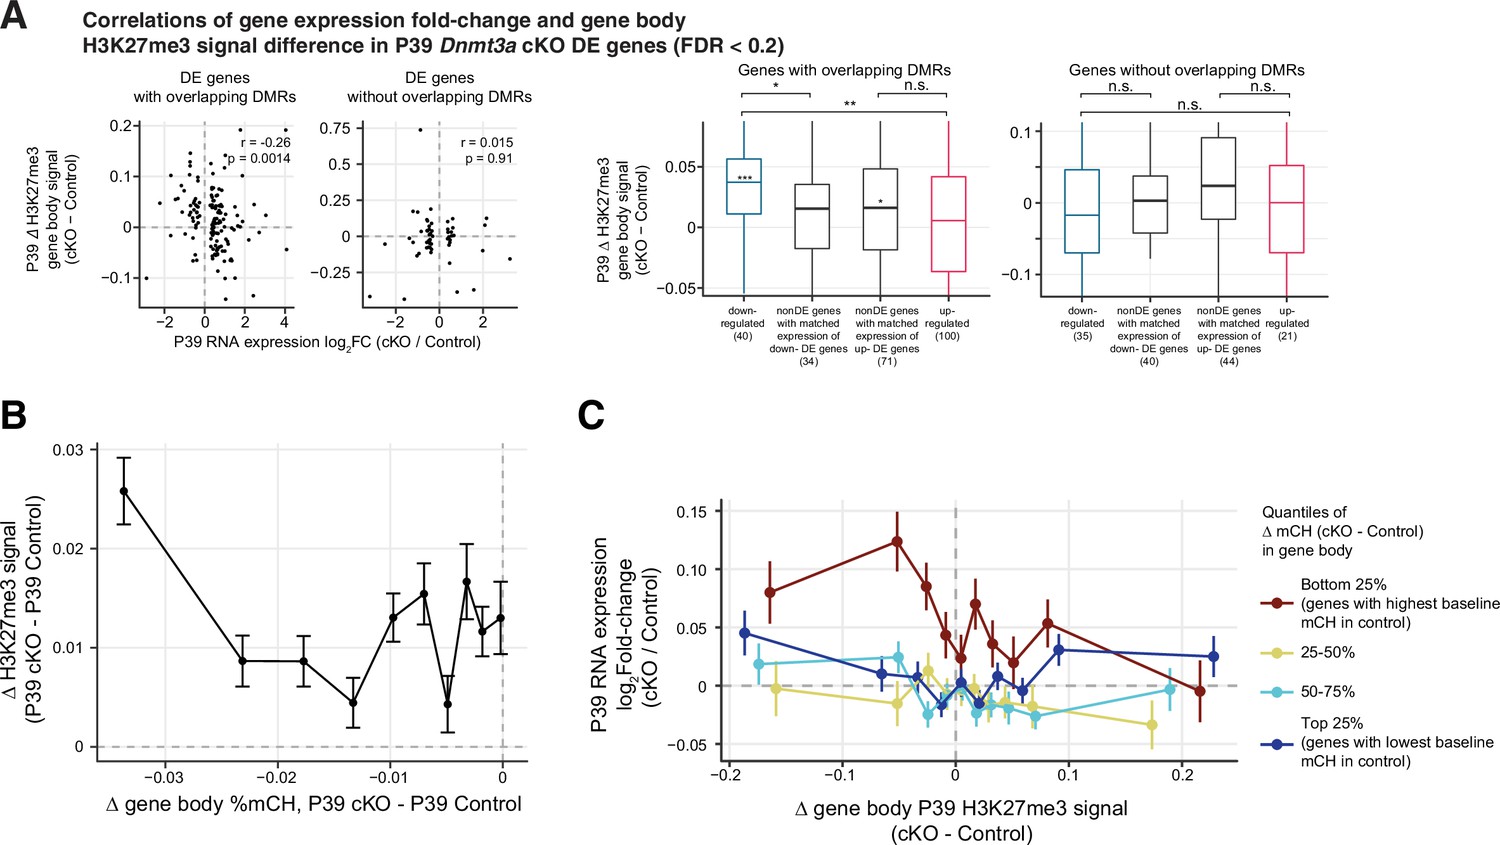
Relationships between gene expression, H3K27me3 signal and gene body mCH.
(A) Correlations of gene expression fold-change and gene body H3K27me3 signal difference in P39 Dnmt3a conditional knockout (cKO) differentially expressed (DE) genes (false discovery rate [FDR] < 0.2). Left panel, scatter plot to show the correlation. DE genes are grouped by whether or not they overlap with P39 Dnmt3a cKO differentially methylated regions (DMRs). r, Spearman correlation coefficient. Right panel, P39 Dnmt3a cKO down-regulated DE genes with overlapping P39 cKO DMRs, in general, show small but significant increases of H3K27me3 in P39 cKO. Asterisks in the middle of each box show the fold-change significance against zero using Wilcoxon rank-sum test for each gene set (*, p<0.05; ***, p<0.001). Comparing across gene sets, these down-regulated DE genes also show bigger increases of H3K27me3 signal after cKO, compared to non-DE genes of matched expression levels with overlapping DMRs (Wilcoxon rank-sum test, *, p<0.05) and up-regulated DE genes with overlapping DMRs (**, p<0.01). No such differences were observed in DE genes without overlapping P39 cKO DMRs (n.s, not significant). (B) Differences in gene body methylation vs. difference of gene H2K27me3 signal between P39 Dnmt3a cKO and control in all non-DE genes (14,591 genes with FDR ≥ 0.05). The plots show mean ± SEM differences of H3K27me signal for genes in 10 non-overlapping bins (deciles of mC difference). (C) Genes are grouped by the quantiles of loss of mCH in cKO, and the gene expression fold-changes (mean ± SEM) as a function of the changes of H3K27me3 in deciles in the gene body for each of these gene sets are shown.
Figure 6 with 2 supplements
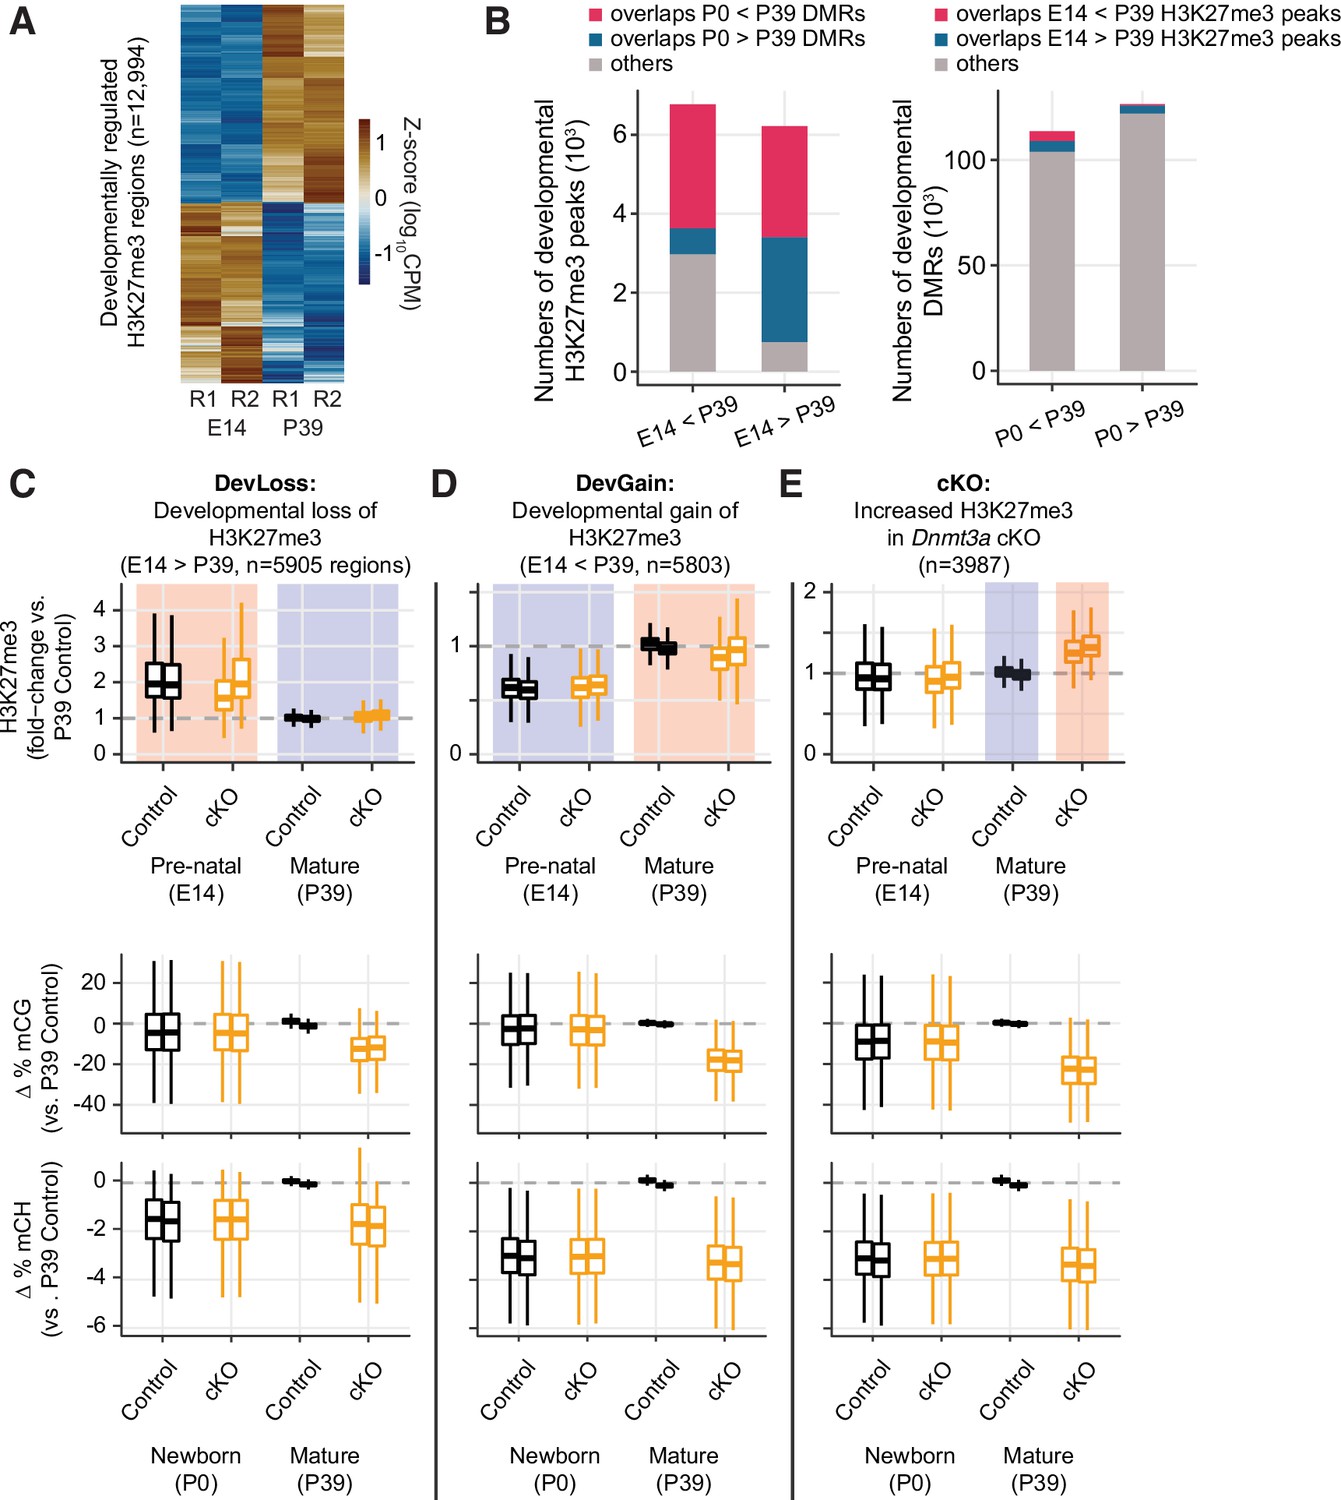
Developmental dynamics of H3K27me3.
(A) Heatmap of developmentally regulated H3K27me3 regions in E14 and P39 control samples. CPM – counts per million; R1/2 – replicates. (B) Bar plots show the numbers of developmental differentially modified H3K27me3 regions (E14 vs. P39) that overlap developmental differentially methylated regions (DMRs) (P0 vs. P39, left panel), and the numbers of developmental DMRs that overlap developmental differentially modified H3K27me3 regions (right panel). (C–E) Normalized H3K27me3 signal (fold-changes compared to P39 control), and mCG, mCH differences (compared to the average of the two replicates from P39 control) in peaks that overlap with E14 vs. P39 developmental loss-of-H3K27me3 regions (C), developmental gain-of-H3K27me3 regions (D), or increased H3K27me3 in P39 Dnmt3a cKO (E).
Figure 6—figure supplement 1
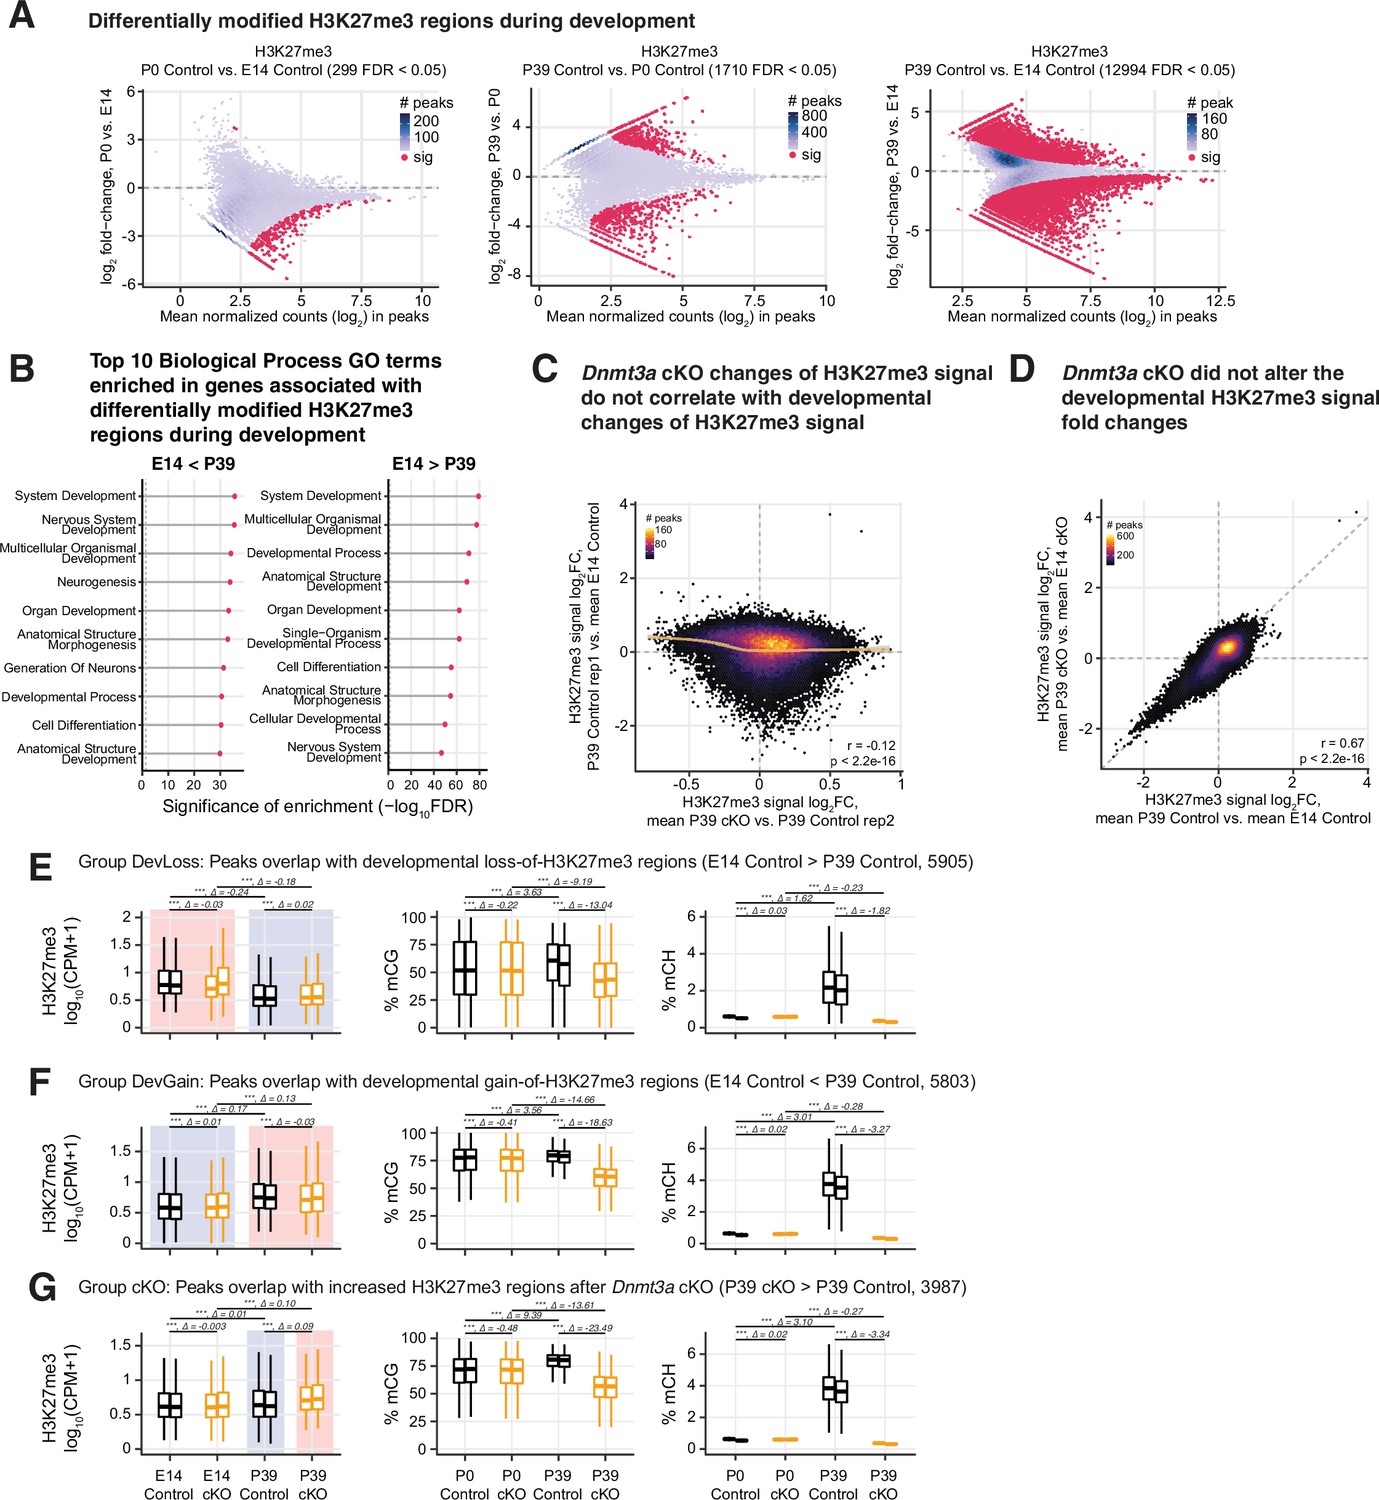
Regions prone to alteration of H3K27me3 by Dnmt3a conditional knockout (cKO) were distinct from the regions affected by developmentally dynamic H3K27me3.
(A) Differentially modified H3K27me3 regions during development in control samples. (B) Top 10 most enriched biological process terms from the Gene Ontology in the genes associated with differentially modified H3K27me3 regions during development in control samples. Gene-region association was predicted by GREAT (McLean et al., 2010). FDR, false discovery rate; the vertical dashed line shows the threshold of FDR = 0.05. (C) Correlations of P39 H3K27me3 signal fold-changes of Dnmt3a cKO vs. control and developmental H3K27me3 signal fold-changes of P39 vs. E14 in H3K27me3 chromatin immunoprecipitation sequencing (ChIP-seq) peaks. Note that peaks with big absolute fold-changes in P39 cKO vs. P39 control are generally not changed much in P39 control vs. E14 control, and vice versa. Replicates 1 and 2 of P39 control are used in the y and x axis, respectively, to avoid double-dipping. The smoothed line is fitted using a generalized additive model, and the shaded area shows the 95% confidence interval of the fit. r, Spearman correlation coefficient. (D) The developmental H3K27me3 signal fold-changes are not affected by Dnmt3a cKO. r, Spearman correlation coefficient. (E–G) Boxplots to show the distribution of H3K27me3 signal, mCG, and mCH levels in peaks that overlaps with E14 vs. P39 developmental loss-of-H3K27me3 regions (E), peaks that overlap with developmental gain-of-H3K27me3 regions (F), and peaks that overlap with increased H3K27me3 regions in P39 Dnmt3a cKO (G). Asterisks show the significances from paired t-tests (***, p<0.001). ∆ values are the mean of the differences for the two groups in comparison (group on the right vs. group on the left).
Figure 6—figure supplement 2
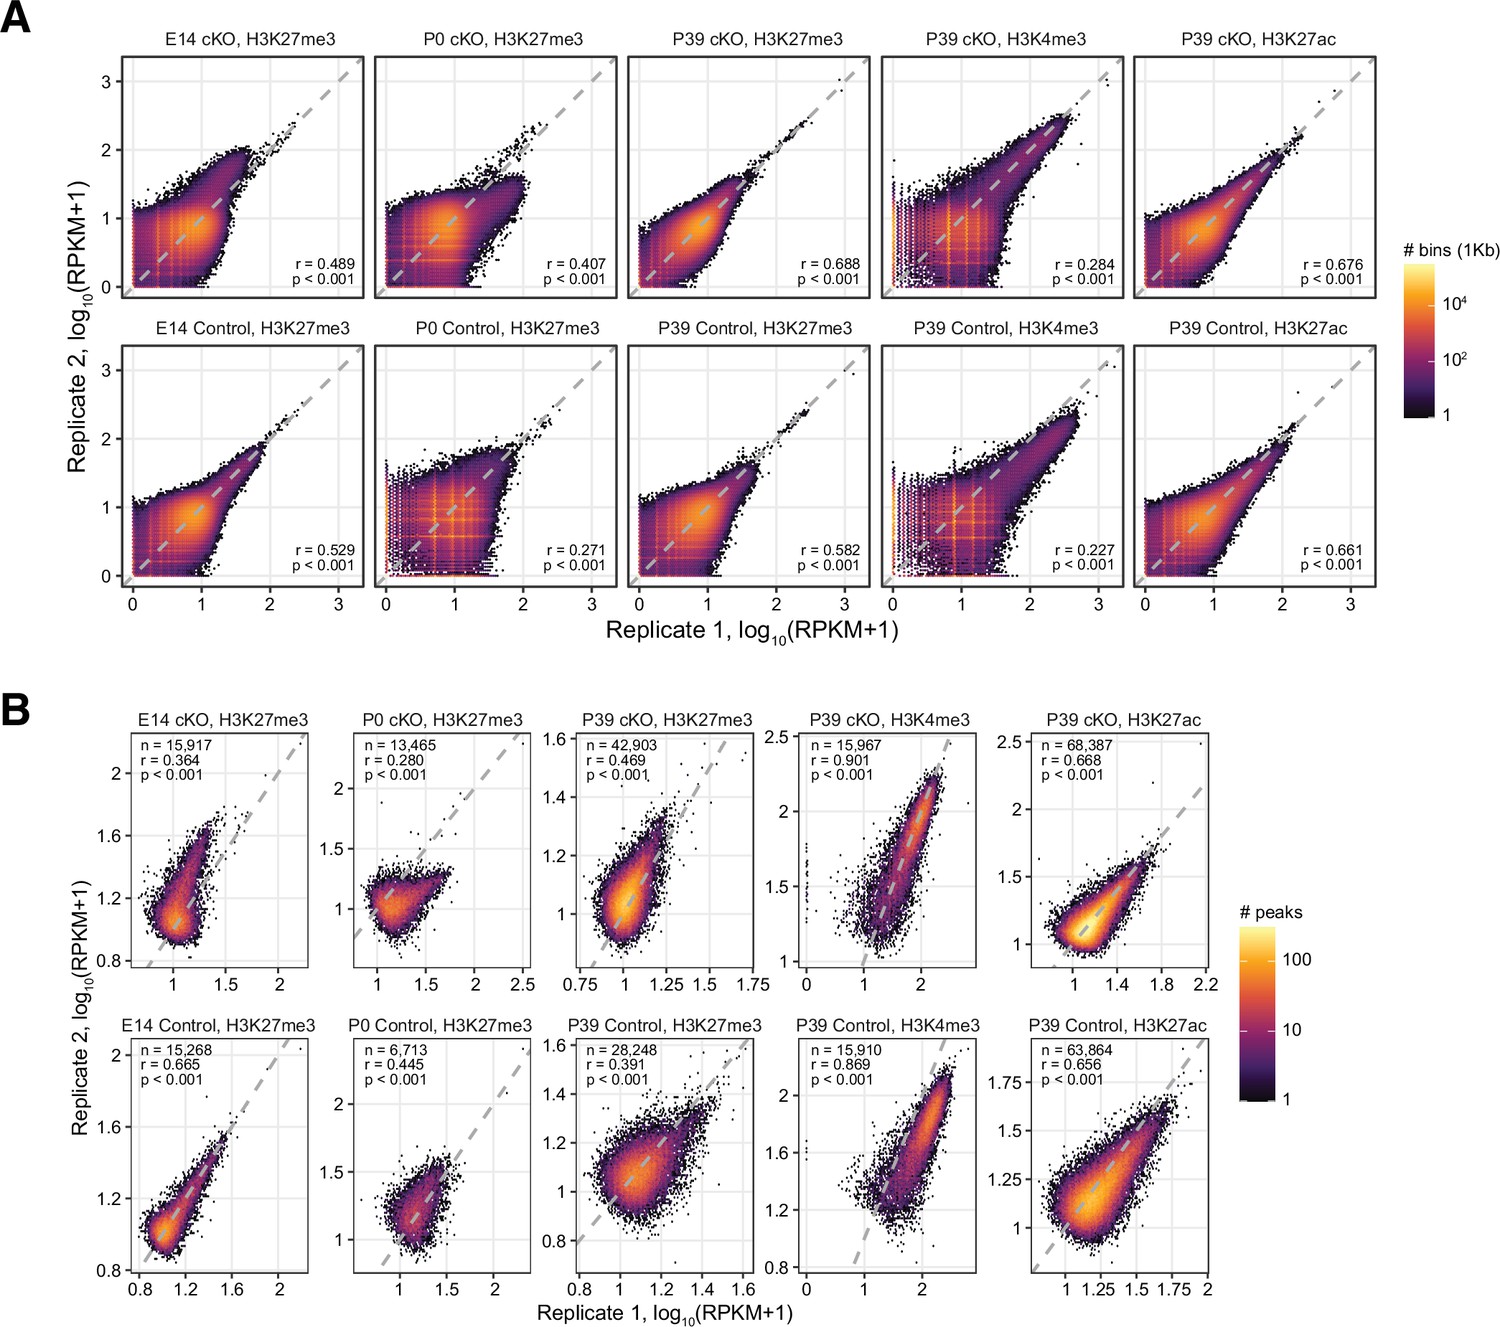
Correlations of chromatin immunoprecipitation sequencing (ChIP-seq) signals across replicates.
Correlations were computed with ChIP-seq counts in 1 kb genomic bins (A) and in peaks (B) across replicates. r, Spearman correlation coefficient. n, number of peaks. RPKM, reads per kilobase million.
Figure 7 with 1 supplement
Distinct clusters of DNA methylation valleys (DMVs) were associated with the increased H3K27me3 signal in the Dnmt3a conditional knockout (cKO).
(A) Number of DMVs identified in the P39 Dnmt3a cKO and the control samples, categorized by whether they appear in one or both groups or change size in the cKO. (B) Overlap of DMVs with the H3K4me4 and/or the H3K27me3 chromatin immunoprecipitation sequencing (ChIP-seq) peaks. (C) Heatmap of DMVs clustered by their methylation levels and histone modifications. The last two columns show the enrichments of differentially modified (DM) peaks of H3K27me3 and differentially expressed (DE) genes. R1/2, replicate 1/2; RPKM, reads per kilobase per million. (D) Browser tracks show examples of unique DMVs in the Dnmt3a cKO samples and the increased H3K27me3 signal in their flanking regions.
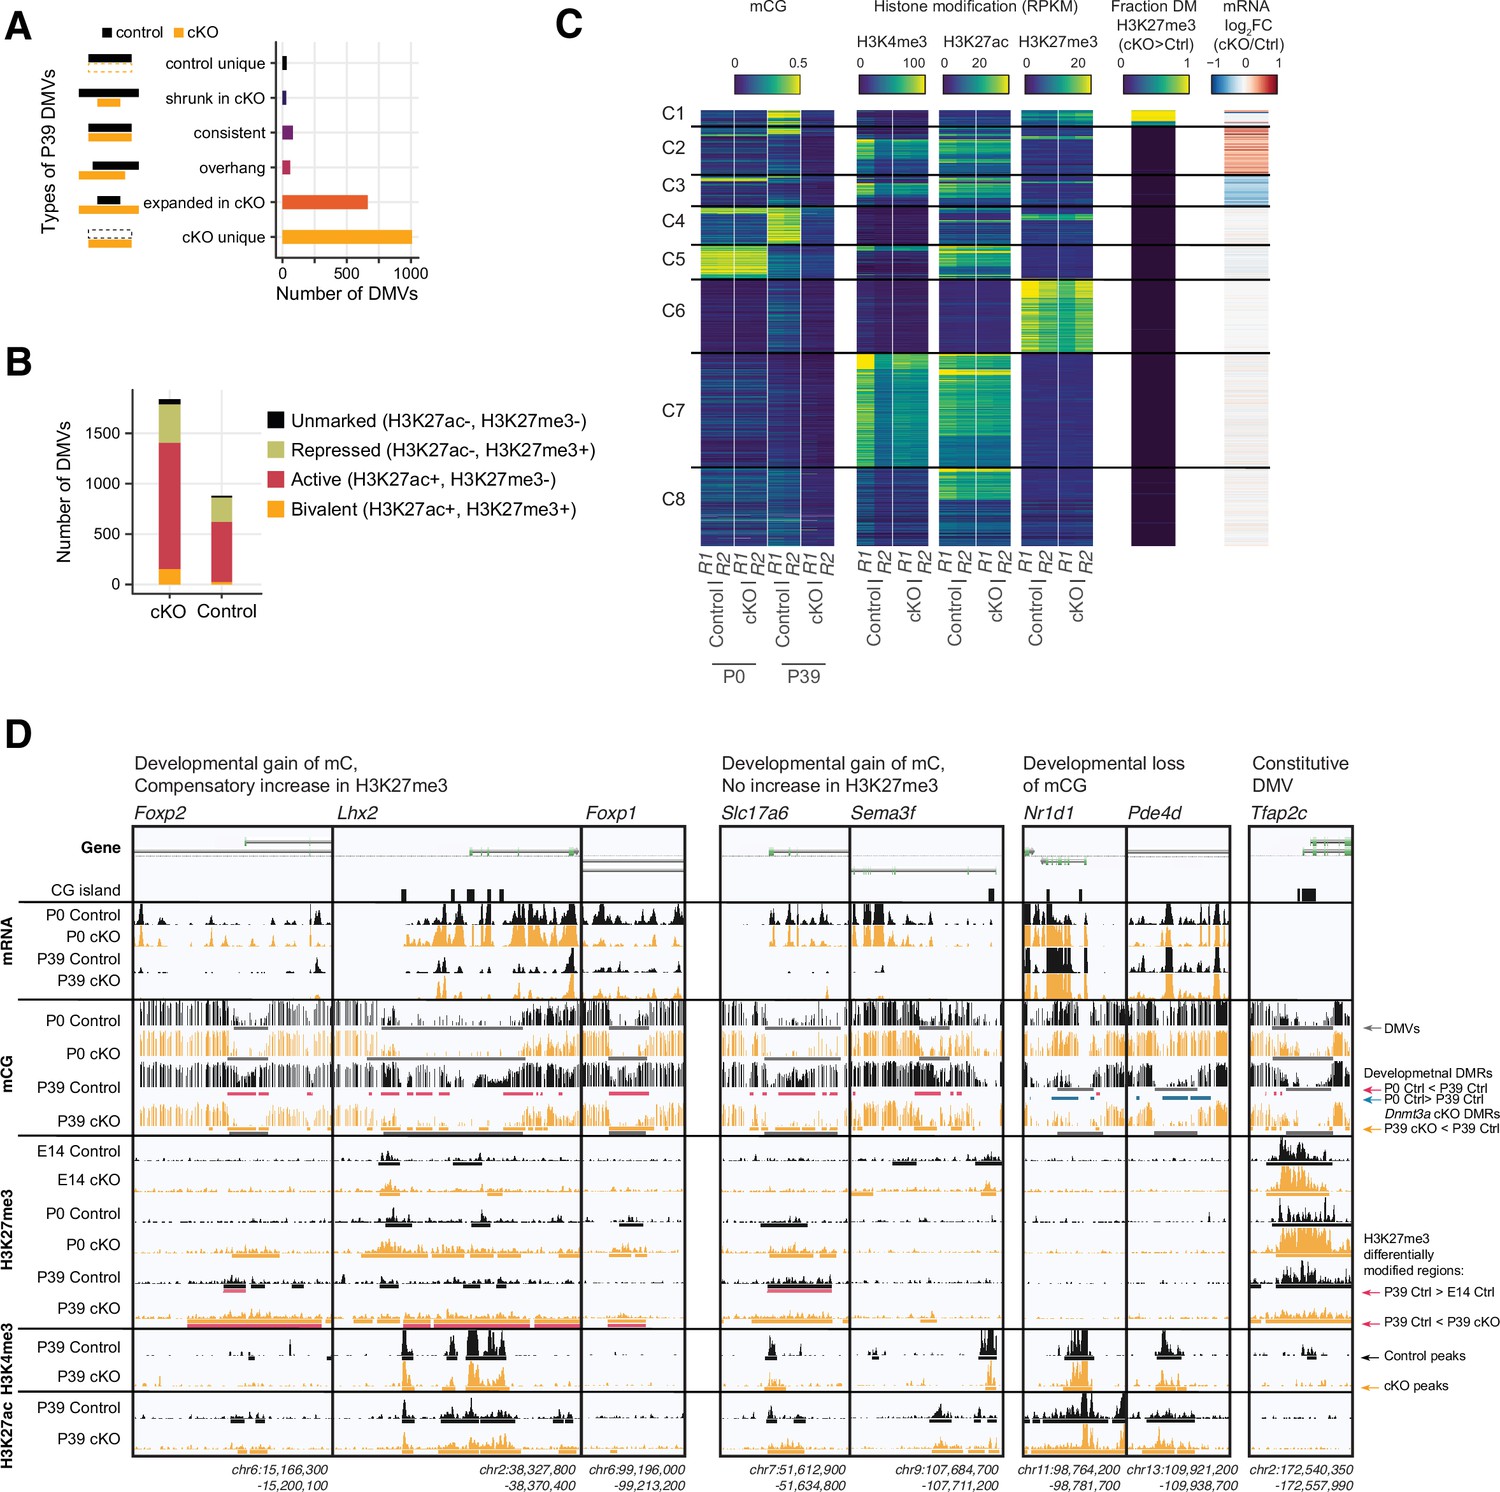
Figure 7—figure supplement 1
Number of DNA methylation valleys (DMVs) identified in the P0 Dnmt3a conditional knockout (cKO) and the control samples.
P0 DMVs were categorized by whether they appear in one or both groups or change size in the cKO, as in Figure 7A.
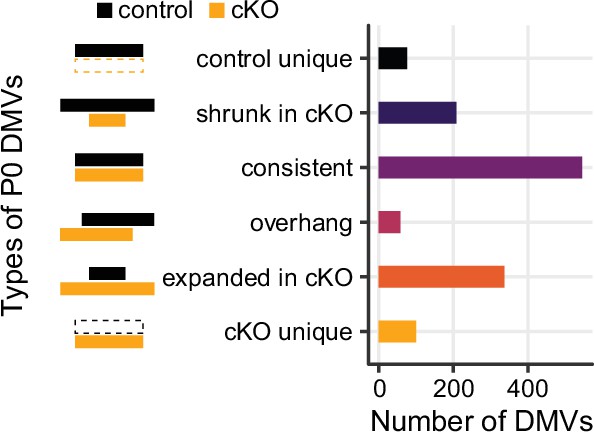
Author response image 1
Heatmap to show the Spearman correlations across the control and Dnmt3a cKO samples from the two batches of data (new vs old). The correlations coefficients were computed using CG methylation levels in 10Kb genomic bins (left), CH methylation levels in 10Kb genomic bins (middle), and gene expression (log10TPM, right).
Author response image 2
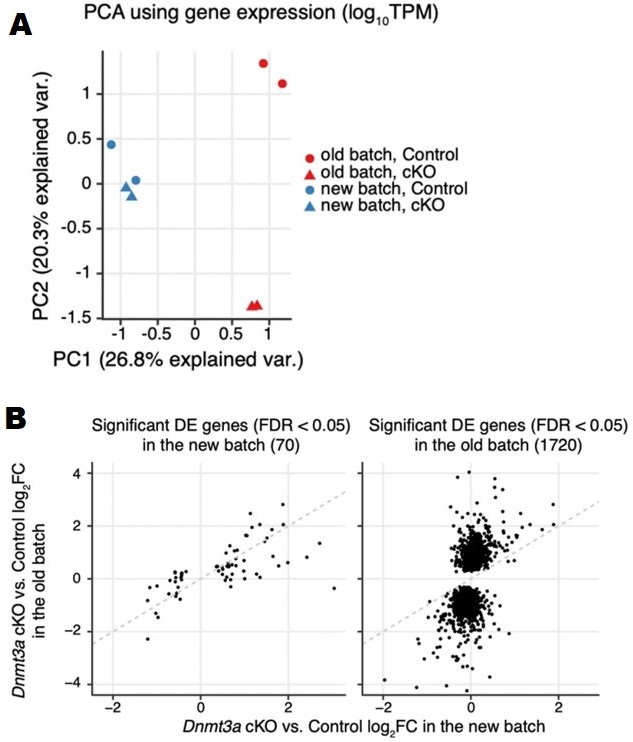
(A) PCA plot using log10TPM gene expression in the two batches of RNA-seq samples. (B) Scatter to show the consistency of gene expression fold-changes (Dnmt3a cKO vs. control) across the two batches of RNA-seq samples using significant DE genes detected in the new batch (left) and significant DE genes detected in the old batch (right).
Tables
Appendix 1—key resources table
| Reagent type (species) or resource | Designation | Source or reference | Identifiers | Additional information |
|---|---|---|---|---|
| Gene (Mus musculus) | Dnmt3a | GENCODE | GENCODE:ENSMUSG00000020661 | GENCODE vM10 |
| Genetic reagent (Mus musculus) | Dnmt3a-floxed | PMID:10555141 | Backcrossed to C57BL/6 for at least seven generations | |
| Genetic reagent (Mus musculus) | Nex-Cre; Neurod6-Cre | PMID:17146780 | Jackson Laboratories Backcrossed to C57BL/6J for 10 generations | |
| Genetic reagent (Mus musculus) | INTACT | PMID:26087164 | (B6.129- Gt(ROSA)26Sor tm5(CAG-Sun1/sfGFP)Nat/MmbeJ) | |
| Genetic reagent (Mus musculus) | Dnmt3a-KO; Dnmt3a cKO | This paper | See ‘Materials and Methods’, section ‘Generation of the Dnmt3a cKO mice line’ | |
| Antibody | Anti-NeuN (Mouse monoclonal, Clone A60) | Millipore | MAB377 | (1:1000) |
| Antibody | Anti-DNMT3A (Rabbit polyclonal) | Abcam | Ab2850 | (1:250) |
| Antibody | Anti-H3K27me3 (Rabbit polyclonal) | Active Motif | Cat:#39156; RRID:AB_2636821 | (5 µl) |
| Antibody | Anti-H3K27ac (Rabbit polyclonal) | Active Motif | Cat:#39133; RRID:AB_2561016 | (5 µl) |
| Antibody | Anti-H3K4me3 (Rabbit monoclonal) | Millipore Sigma | Cat:#04–745 | (5 µl) |
| Antibody | Anti-IgG (Mouse unknown clonality) | Jackson ImmunoResearch Labs | Cat#015-000-003; RRID:AB_2337188 | (2 µl) |
| Sequence-based reagent | Cytosine-methylated adapters | Illumina | AD001, AD005 | |
| Sequence-based reagent | TruSeq PCR Primer Mix | Illumina | 20015960, 20015961 | |
| Peptide, recombinant protein | T4 DNA ligase | New England Biolabs | M0202L | |
| Commercial assay or kit | Single-Cell RNA Purification Kit | Norgen | Cat:#51800 | |
| Commercial assay or kit | Ovation RNA-Seq System V2 | NuGEN | Cat:#7102–32 | |
| Commercial assay or kit | KAPA LTP Library Preparation Kit | Roche | Cat:#KK8232 | |
| Commercial assay or kit | Qiagen DNeasy Blood and Tissue kit | Qiagen | Cat:#69504 | |
| Commercial assay or kit | EZ methylation Direct kit | Zymo | Cat:#D5021 | |
| Commercial assay or kit | Accel-NGS 2S Plus DNA Library Kit | Swift Biosciences | Cat:#21024 | |
| Chemical compound, drug | Protease inhibitor | Sigma-Aldrich | Cat:#11836153001 | |
| Chemical compound, drug | Phosphatase inhibitor | Pierce | Cat:#A32957 | |
| Chemical compound, drug | Kapa HiFi Hotstart Readymix | Kapa Biosystems | 07958935001-KK2602 | |
| Software, algorithm | Minianalysis | Minianalysis (https://www.synaptosoft.com/MiniAnalysis/) | RRID:SCR_002184 | |
| Software, algorithm | pCLAMP | Molecular Devices (https://www.moleculardevices.com/products/software/pclamp.html) | RRID:SCR_011323 | |
| Software, algorithm | Reconstruct | Synapse Web (https://synapses.clm.utexas.edu/tools/reconstruct/reconstruct.stm) | RRID:SCR_002716 | |
| Software, algorithm | Activity Monitor | MED Associates (https://www.med-associates.com/product/activity-monitor/) | RRID:SCR_014296 | |
| Software, algorithm | ANY-maze | San Diego Instruments (https://sandiegoinstruments.com/product/any-maze/) | RRID:SCR_014289 | |
| Software, algorithm | FastQC | Babraham Bioinformatics (https://www.bioinformatics.babraham.ac.uk/projects/fastqc/) | RRID:SCR_014583 | v0.11.8 |
| Software, algorithm | Trim Galore | Babraham Bioinformatics (https://www.bioinformatics.babraham.ac.uk/projects/trim_galore/) | RRID:SCR_011847 | v0.5.0 |
| Software, algorithm | Cutadapt | DOI:10.14806/ej.17.1.200 | RRID:SCR_011841 | v1.16 |
| Software, algorithm | STAR | PMID:23104886 | RRID:SCR_004463 | v2.5.1b |
| Software, algorithm | RSEM | PMID:21816040 | RRID:SCR_013027 | v1.2.30 |
| Software, algorithm | edgeR | PMID:19910308 | RRID:SCR_012802 | v3.24.1 |
| Software, algorithm | SQuIRE | PMID:30624635 | ||
| Software, algorithm | clusterProfiler | PMID:22455463 | RRID:SCR_016884 | v3.10.0 |
| Software, algorithm | GATK | PMID:21478889 | RRID:SCR_001876 | v3.7 |
| Software, algorithm | BWA | PMID:19451168 | RRID:SCR_010910 | v0.7.13-r1126 |
| Software, algorithm | Picard | Broad (https://broadinstitute.github.io/picard/) | RRID:SCR_006525 | V2.10.6 |
| Software, algorithm | BEDTools | PMID:20110278 | RRID:SCR_006646 | v2.27.1 |
| Software, algorithm | methylpy | methylpy (https://github.com/yupenghe/methylpy) | v1.3.2 | |
| Software, algorithm | bowtie2 | PMID:22388286 | RRID:SCR_016368 | v2.3.0 |
| Software, algorithm | MatchIt | DOI:10.18637/jss.v042.i08 | v3.0.2 | |
| Software, algorithm | BART | PMID:29608647 | ||
| Software, algorithm | HOMER | PMID:20513432 | RRID:SCR_010881 | v4.8.3 |
| Software, algorithm | ENCODE Transcription Factor and Histone ChIP-Seq processing pipeline | PMID:22955991 | RRID:SCR_021323 | v1.1.6 |
| Software, algorithm | samtools | PMID:19505943 | RRID:SCR_002105 | v1.2 |
| Software, algorithm | SICER | PMID:19505939 | RRID:SCR_010843 | |
| Software, algorithm | DiffBind | PMID:22217937 | RRID:SCR_012918 | v2.10.0 |
| Software, algorithm | DESeq2 | PMID:25516281 | RRID:SCR_015687 | v1.22.1 |
| Software, algorithm | GREAT | PMID:20436461 | RRID:SCR_005807 | v3.0.0 |
| Software, algorithm | MethylSeekR | PMID:23828043 | RRID:SCR_006513 | v1.22.0 |
| Software, algorithm | regioneR | PMID:26424858 | V1.14.0 | |
| Software, algorithm | R | R Project for Statistical Computing (https://www.r-project.org/) | RRID:SCR_001905 | v3.5.0 |
| Software, algorithm | MATLAB | MathWorks (https://www.mathworks.com/products/matlab.html) | RRID:SCR_001622 | v2017a |
| Software, algorithm | Python | Python Programming Language (https://www.python.org/) | RRID:SCR_008394 | v3.x |
Additional files
-
Supplementary file 1
Sequencing metrics for RNA-seq, MethylC-seq, chromatin immunoprecipitation sequencing (ChIP-seq), and genomic DNA for the Dnmt3a conditional knockout (cKO) and control samples.
- https://cdn.elifesciences.org/articles/66909/elife-66909-supp1-v2.xlsx
-
Supplementary file 2
Gene expression and list of differentially expressed genes in P39 Dnmt3a conditional knockout (cKO) and P39 control.
- https://cdn.elifesciences.org/articles/66909/elife-66909-supp2-v2.xlsx
-
Supplementary file 3
List of differentially methylated regions (DMRs).
- https://cdn.elifesciences.org/articles/66909/elife-66909-supp3-v2.xlsx
-
Supplementary file 4
Known transcription factor motif enrichment in P39 Dnmt3a conditional knockout (cKO) differentially methylated regions (DMRs).
- https://cdn.elifesciences.org/articles/66909/elife-66909-supp4-v2.xlsx
-
Supplementary file 5
List of transcription factors and chromatin regulators that bind at cis-regulatory regions of the differentially expressed genes in P39 Dnmt3a conditional knockout (cKO).
- https://cdn.elifesciences.org/articles/66909/elife-66909-supp5-v2.xlsx
-
Supplementary file 6
List of chromatin immunoprecipitation sequencing (ChIP-seq) peaks.
- https://cdn.elifesciences.org/articles/66909/elife-66909-supp6-v2.xlsx
-
Supplementary file 7
List of up-regulated H3K27me3 signal regions in P39 Dnmt3a conditional knockout (cKO).
- https://cdn.elifesciences.org/articles/66909/elife-66909-supp7-v2.xlsx
-
Supplementary file 8
List of enriched Gene Ontology terms for biological process in genes associated with up-regulated H3K27me3 regions in P39 Dnmt3a conditional knockout (cKO).
- https://cdn.elifesciences.org/articles/66909/elife-66909-supp8-v2.xlsx
-
Supplementary file 9
List of developmental regulated H3K27me3 signal regions in control pyramidal neurons.
- https://cdn.elifesciences.org/articles/66909/elife-66909-supp9-v2.xlsx
-
Supplementary file 10
List of DNA methylation valleys (DMVs).
- https://cdn.elifesciences.org/articles/66909/elife-66909-supp10-v2.xlsx
-
MDAR checklist
- https://cdn.elifesciences.org/articles/66909/elife-66909-mdarchecklist1-v2.docx
Download links
A two-part list of links to download the article, or parts of the article, in various formats.
Downloads (link to download the article as PDF)
Open citations (links to open the citations from this article in various online reference manager services)
Cite this article (links to download the citations from this article in formats compatible with various reference manager tools)
Dnmt3a knockout in excitatory neurons impairs postnatal synapse maturation and increases the repressive histone modification H3K27me3
eLife 11:e66909.
https://doi.org/10.7554/eLife.66909


