Akt phosphorylates insulin receptor substrate to limit PI3K-mediated PIP3 synthesis
- Charles Perkins Centre, School of Life and Environmental Sciences, University of Sydney, Australia
- Metabolic Research Laboratories, Wellcome Trust-Medical Research Council Institute of Metabolic Science, University of Cambridge, United Kingdom
- Department of Biochemistry and Molecular Biology, School of Biomedical Sciences, Monash University, Australia
- Biomedicine Discovery Institute, Monash University, Australia
- Charles Perkins Centre, School of Mathematics and Statistics, University of Sydney, Australia
- Computational Systems Biology Group, Children's Medical Research Institute, University of Sydney, Australia
- School of Medical Sciences, University of Sydney, Australia
Figures
Figure 1 with 1 supplement
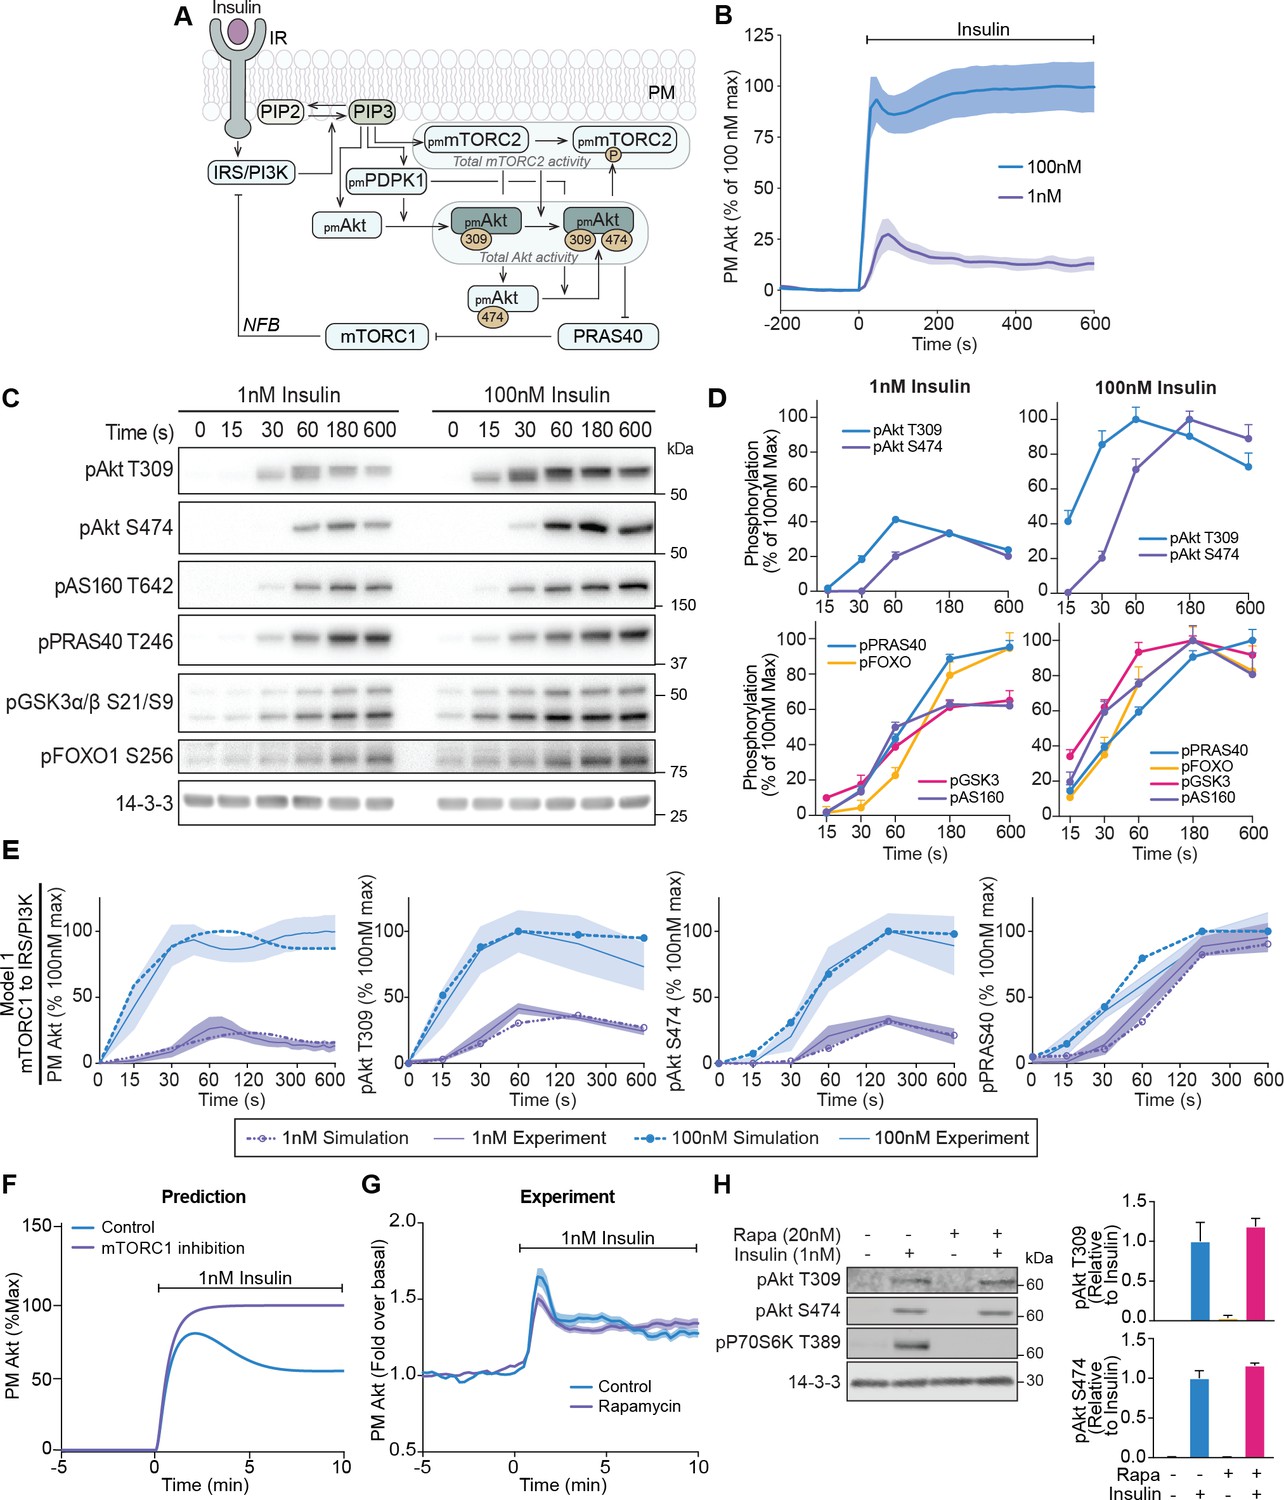
A mechanistic model of insulin signalling predicts a rapid negative feedback mechanism that is not dependent on mammalian target of rapamycin complex 1 (mTORC1).
(A) Schematic depicting model architecture with negative feedback via mTORC1 onto the insulin receptor substrate/phosphoinositide 3-kinase (IRS/PI3K) node (IR, insulin receptor; NFB, negative feedback). (B) 3T3-L1 adipocytes expressing TagRFP-T-Akt2 were treated with 1 or 100 nM insulin. Recruitment was assessed using live cell total internal reflection fluorescence microscopy (TIRFM) (n = 9 for 1 nM and n = 10 for 100 nM). (C) 3T3-L1 adipocytes were treated with 1 or 100 nM insulin for the times specified. Lysates were immunoblotted with antibodies as specified, with 14-3-3 as a loading control. A representative image for five to eight independent biological replicates is presented. (D) Quantification of panel C. Data is normalised to 14-3-3 and expressed as a percentage of the maximum phosphorylation observed for each phospho-site in response to 100 nM insulin (1 nM; n = 8, 100 nM; n = 5; p, phosphorylated). (E) Model 1 (mTORC1 to IRS/PI3K) was calibrated (fitted) using Akt recruitment, T309 and S474 phosphorylation, and PRAS40 phosphorylation in response to 1 and 100 nM insulin (purple and blue, respectively) and overlaid with the experimentally observed kinetics for each outcome. The time axes are presented as a log2 scale to highlight the early response kinetics, with 0 added for completeness. Model simulations are shown as dotted lines while experimental kinetics are shown as smooth lines as the mean ± SEM. (F) Model prediction of the effect of mTORC1 inhibition on Akt recruitment in response to 1 nM insulin. The value of parameter Ki2 was set to null to model complete inhibition of mTORC1 catalytic activity. (G) 3T3-L1 adipocytes expressing TagRFP-T-Akt2 were treated with 20 nM rapamycin for 5 min followed by 1 nM insulin. Recruitment was assessed using TIRFM (38 control cells [n = 2], 39 rapamycin treated cells [n = 3]). (H) 3T3-L1 adipocytes were treated with 20 nM rapamycin for 5 min followed by 1 nM insulin for 10 min. Lysates were immunoblotted with antibodies as specified, with 14-3-3 as a loading control. A representative western blot (left) and quantification (right) is presented (n = 3; p, phosphorylated). All data expressed as mean ± SEM; PM, plasma membrane; IR, insulin receptor; Rapa, rapamycin.
Figure 1—figure supplement 1

A mechanistic model of insulin signalling without negative feedback does not capture signalling kinetics.
(A) Box and whiskers plots (median; interquartile range and min/max) of the local minima from 200 independent calibration runs (repeats) of negative feedback models 1 (mammalian target of rapamycin complex 1/S6-kinase [mTORC1/S6K] to insulin receptor substrate/phosphoinositide 3-kinase [IRS/PI3K]), 2 (rapamcyin constrained), and 3 (no negative feedback), where for each run, we randomly resampled the starting parameter values as input for the genetic algorithm. The lowest of these were deemed the global optimum (dark border) and were used for the simulations and predictions. (B and C) Model simulations of Akt recruitment, T309 and S474 phosphorylation and PRAS40 phosphorylation in response to 1 and 100 nM insulin (simulation; dotted lines), overlaid with the experimentally observed kinetics for each outcome (experiment; solid lines, mean ± SEM) for the negative feedback models 2 (B) and 3 (C). Purple and blue indicate 1 and 100 nM insulin, respectively. NFB, negative feedback; PM, plasma membrane.
Figure 2 with 2 supplements
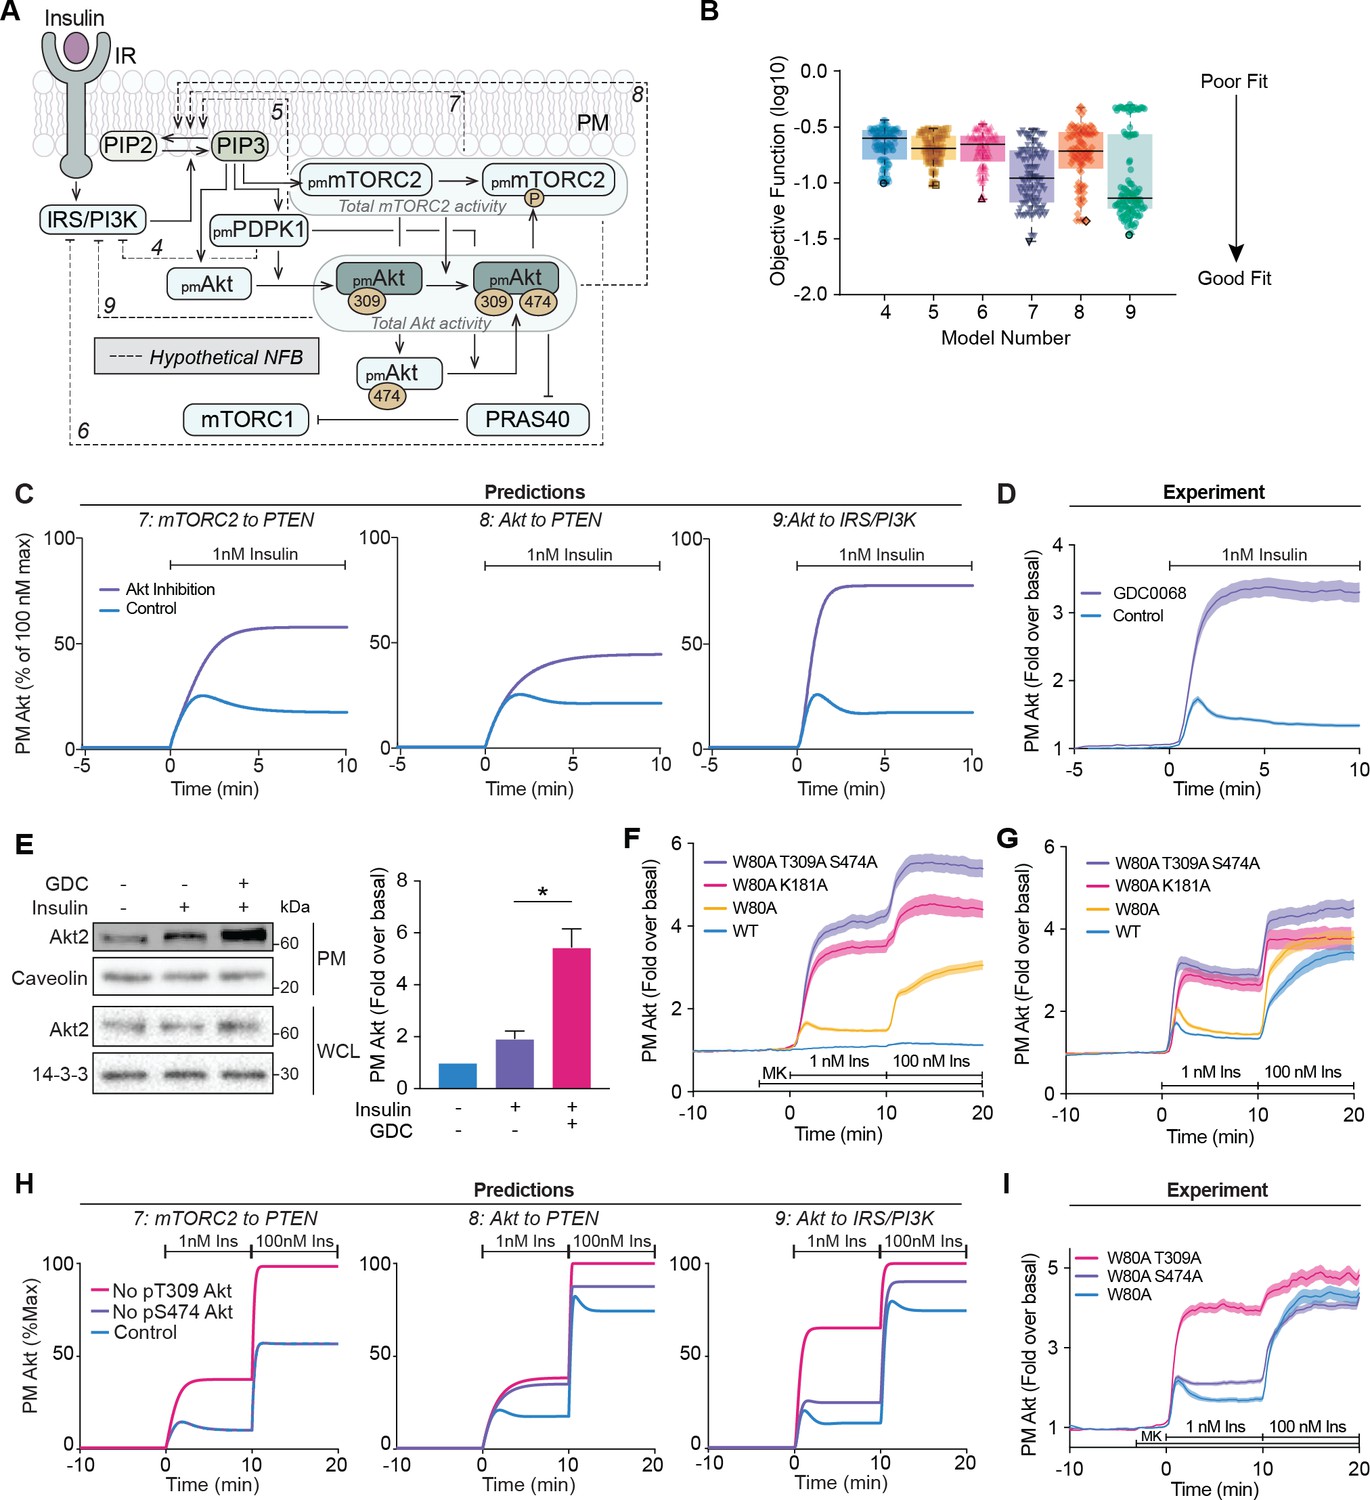
Negative feedback is dependent on Akt activity.
(A) Schematic depicting the model architecture including the hypothetical negative feedback loops from phosphoinositide-dependent protein kinase 1 (PDPK1), mammalian target of rapamycin complex 2 (mTORC2), or Akt, onto phosphatase and tensin homolog (PTEN) or the insulin receptor substrate/phosphoinositide 3-kinase (IRS/PI3K) node (IR, insulin receptor; NFB, negative feedback). (B) Box and whiskers plots (median; interquartile range and min/max) of the local minima from 200 independent calibration runs (repeats) of negative feedback models 4–9, where for each run, we randomly resampled the starting parameter values as input for the genetic algorithm. The lowest of these were deemed the global optimum (dark border) and these were used for simulations and predictions. (C) Predictions from models 7–9 for the effect of Akt inhibition on Akt recruitment in response to 1 nM insulin. The parameter values of Ki2a, Ki2b, Kf11a, and Kf11b were set to null in order to model Akt inhibition by GDC0068. (D) 3T3-L1 adipocytes expressing TagRFP-T-Akt2 were treated with 10 μM GDC0068 for 5 min followed by 1 nM insulin. Recruitment was assessed using total internal reflection fluorescence microscopy (TIRFM) (41 control cells [n = 3], 43 GDC0068-treated cells [n = 3]). (E) 3T3-L1 adipocytes were treated with 10 μM GDC0068 or vehicle control for 5 min followed by 1 nM insulin for 10 min. Subcellular fractionation was performed to obtain the plasma membrane. Lysates were immunoblotted with antibodies as specified, with caveolin and 14-3-3 as loading controls. A representative western blot (left) and quantitation of plasma membrane Akt2 (right) are presented (n = 6, unpaired two-tailed t-test; WCL, whole cell lysate). (F) 3T3-L1 adipocytes expressing WT, W80A, W80A-T309A-S474A, or W80A-K181A TagRFP-T-Akt2 were exposed to 20 μM MK2206 for 3 min, followed by 1 and 100 nM insulin. Recruitment was assessed using TIRFM (16 WT cells [n = 2], 93 W80A cells [n = 10], 53 W80A-K181A cells [n = 4], 35 W80A-T309A-S474A cells [n = 3]). (G) 3T3-L1 adipocytes expressing WT, W80A, W80A-T309A-S474A, or W80A-K181A TagRFP-T-Akt2 were treated with 1 and 100 nM insulin in the absence of MK2206. Recruitment was assessed using TIRFM (41 WT cells [n = 3], 60 W80A cells [n = 7], 21 W80A-K181A cells [n = 2], 22 W80A-T309A-S474A cells [n = 2]). (H) Model predictions of the effect of losing Akt T309 or Akt S474 phosphorylation on Akt recruitment in response to 1 and 100 nM insulin. The parameter values of Kf6 and Kf7 were set to null to represent loss of Akt T309 and Akt S474 phosphorylation, respectively. (I) 3T3-L1 adipocytes expressing W80A, W80A-T309A, or W80A-S474A TagRFP-T-Akt2 were exposed to 20 μM MK2206 for 3 min, followed by 1 and 100 nM insulin. Recruitment was assessed using TIRFM (55 W80A cells [n = 9], 57 W80A T309A cells [n = 6] 121 W80A S474A cells [n = 12]). All data expressed as mean ± SEM; PM, plasma membrane; *p<0.05.
Figure 2—figure supplement 1
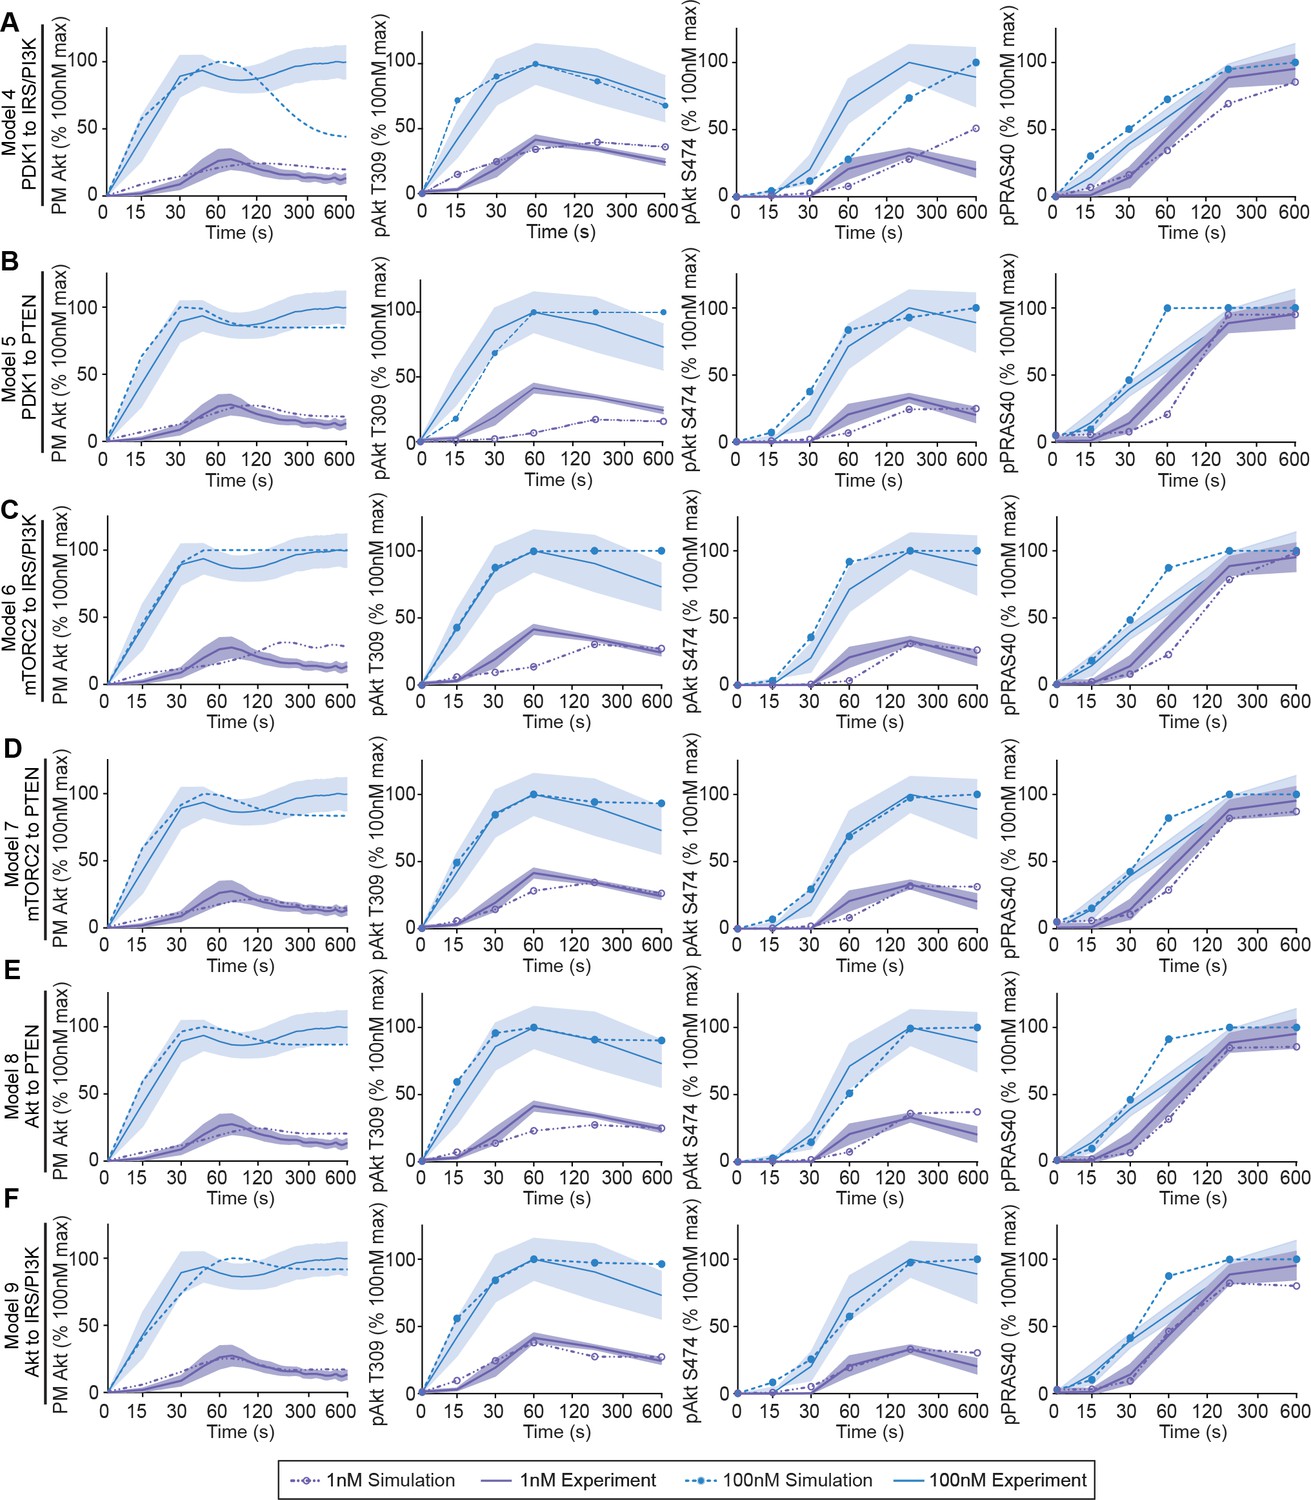
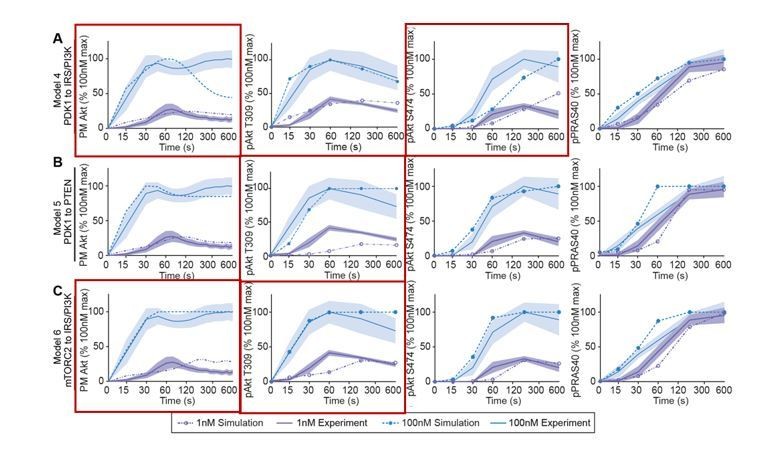
Six hypothetical mechanistic models of insulin signalling predict signalling outcomes.
The hypothetical negative feedback models 4 (A), 5 (B), 6 (C), 7 (D), 8 (E), and 9 (F) were used to predict Akt recruitment, T309 and S474 phosphorylation, and PRAS40 phosphorylation in response to 1 and 100 nM insulin (simulation; dotted lines). This was overlaid with the experimentally observed kinetics for each outcome (experiment; solid lines, mean ± SEM). Purple and blue indicate 1 and 100 nM insulin, respectively. PM, plasma membrane.
Figure 2—figure supplement 2
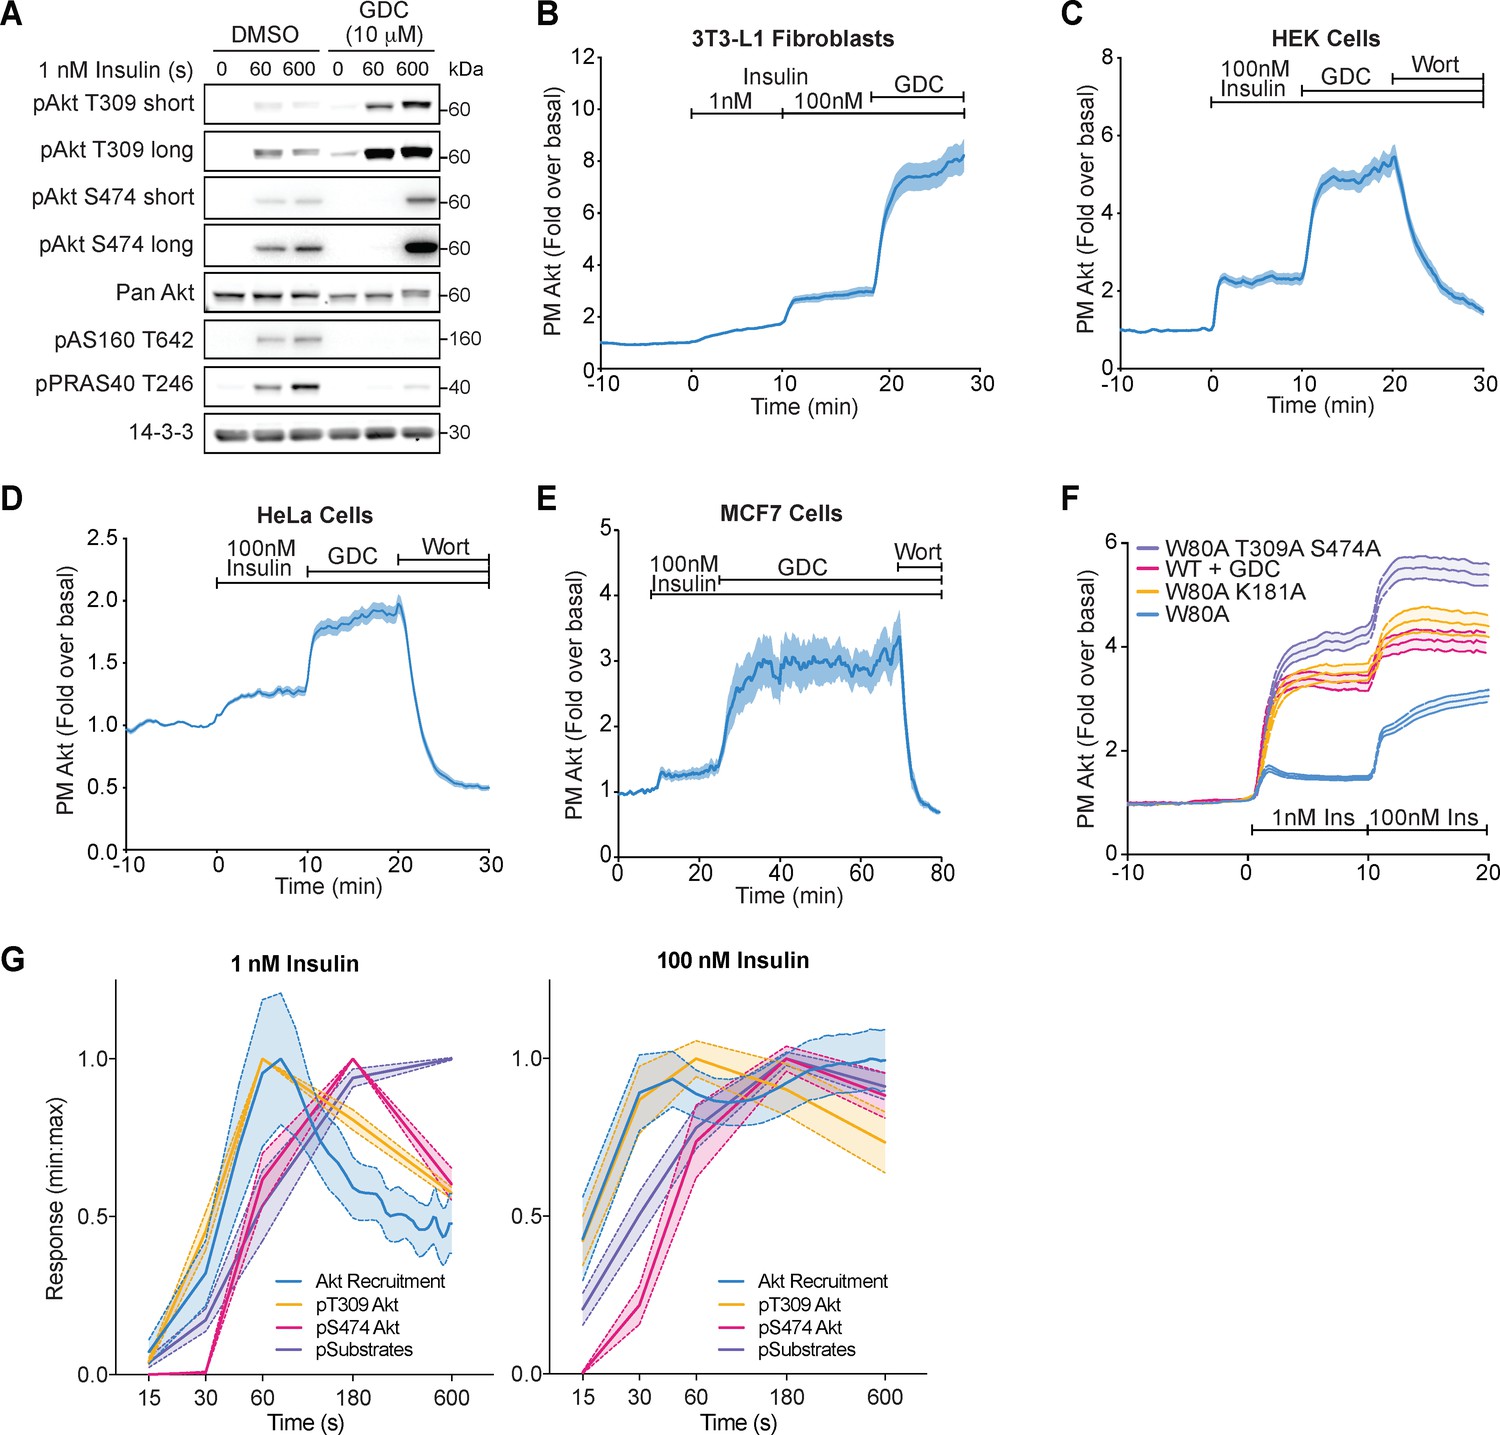
Akt inhibition increases its phosphorylation and membrane recruitment following insulin stimulation, in diverse cell types.
(A) 3T3-L1 adipocytes were preincubated with vehicle (DMSO) or 10 μM GDC0068 for 5 min, then stimulated with 1 nM insulin for times specified. Lysates were immunoblotted with antibodies as specified, with 14-3-3 as a loading control (n = 3; p, phosphorylated). (B) Total internal reflection fluorescence microscopy (TIRFM) was used to assess plasma membrane recruitment of TagRFP-T-Akt2 in 3T3-L1 fibroblasts in response to 1 nM insulin, 100 nM insulin, and 10 μM GDC0068 (51 cells). TIRFM was used to assess recruitment of TagRFP-T-Akt2 in (C) HEK294E (45 cells), (D) HeLa (48 cells), and (E) MCF7 (8 cells) cells in response to 100 nM insulin followed by the addition of 10 μM GDC0068, then 300 nM wortmannin. (F) Overlay of the TIRF recruitment profiles of 3T3-L1 adipocytes expressing TagRFP-T-Akt2 in response to 1 and 100 nM insulin, with varying types of Akt inhibition; in the presence of GDC0068 (WT+GDC), phospho-dead (W80A T309A S474A) and kinase-dead (W80A K181A) MK2206 resistant mutants in the presence of MK2206. (G) The kinetics of insulin-stimulated Akt recruitment (from Figure 1B) overlaid with Akt phosphorylation and substrate phosphorylation (from Figure 1C,D) in 3T3-L1 adipocytes. All data expressed as mean ± SEM; PM, plasma membrane.
Figure 3 with 1 supplement
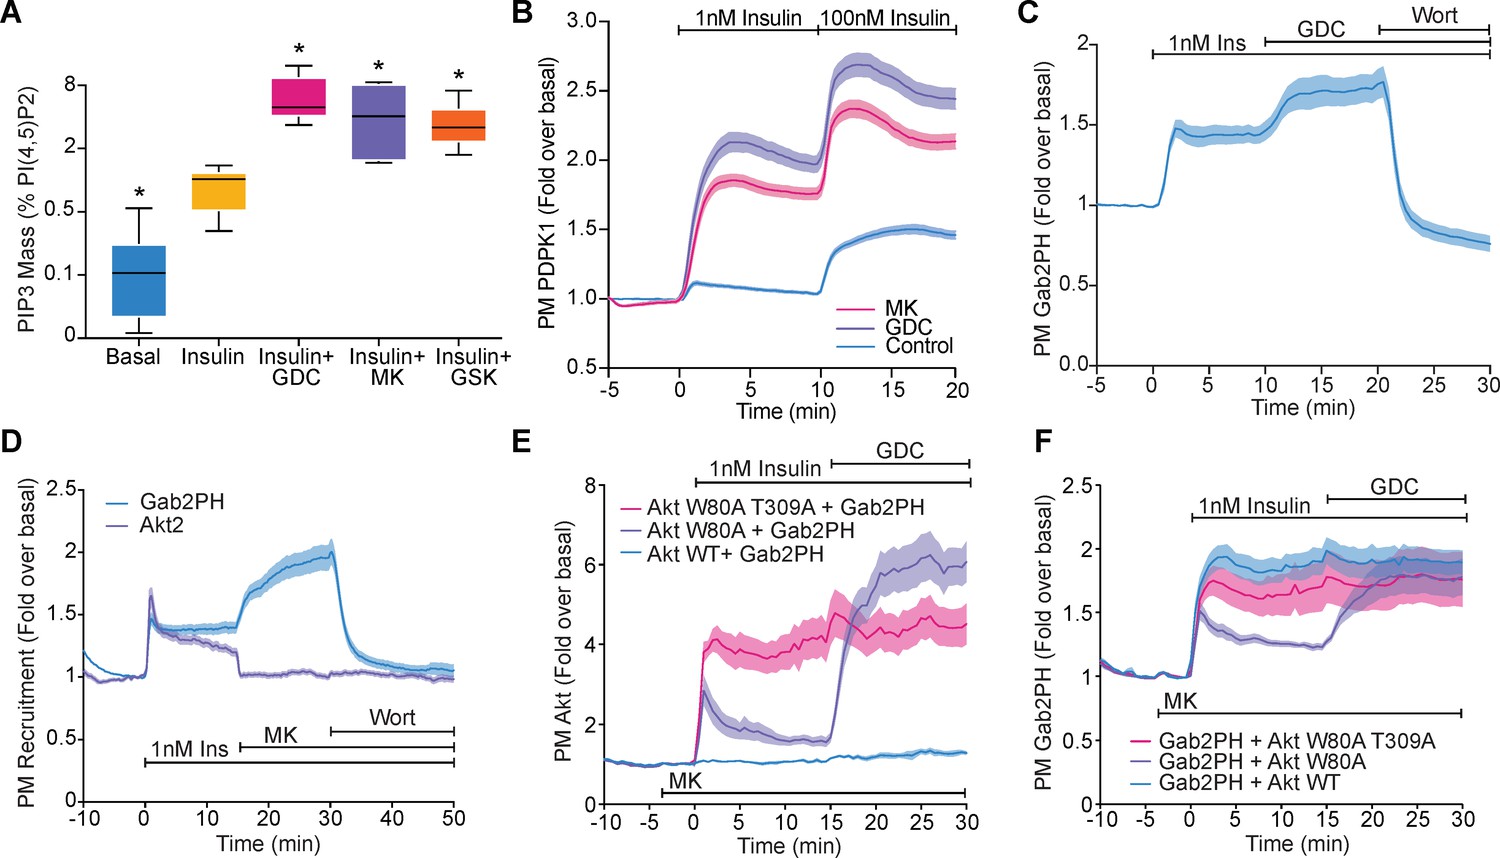
Akt regulates PI(3,4,5)P3 abundance.
(A) 3T3-L1 adipocytes were treated with 10 μM GDC0068, 10 μM MK2206, 10 μM GSK2334470, or vehicle control for 15 min, followed by 1 nM insulin for 10 min. Lipids were extracted from the cells and PI(3,4,5)P3 (PIP3) mass measured using a competitive ELISA. PIP3 is expressed relative to PI(4,5)P2 obtained from the same samples (n = 6–7). Boxes capture lower quartile and upper quartile with the median displayed as a horizontal line in the middle; whiskers are min and max. (B) 3T3-L1 adipocytes expressing phosphoinositide-dependent protein kinase 1 (PDPK1)-eGFP were stimulated with 1 and 100 nM insulin, in the presence of 10 μM GDC0068, 10 μM MK2206, or vehicle control. Recruitment was assessed by total internal reflection fluorescence microscopy (TIRFM) (123 control cells [n = 3], 121 GDC0068-treated cells [n = 3], 118 MK2206-treated cells [n = 3]). (C) 3T3-L1 adipocytes expressing Gab2PH-eGFP were stimulated with 1 nM insulin, followed by 10 μM GDC0068, and then 1 μM wortmannin. Recruitment was assessed by TIRFM (11 cells, n = 3). (D) 3T3-L1 adipocytes co-expressing TagRFP-T-Akt2 and Gab2PH-eGFP were stimulated with 1 nM insulin, 10 μM MK2206 and then 1 μM wortmannin. Recruitment was assessed by TIRFM (20 cells, n = 4). (E) TagRFP-T-Akt2 recruitment responses and (F) the corresponding Gab2PH-eGFP recruitment responses of 3T3-L1 adipocytes co-expressing Gab2PH-eGFP with either WT, W80A, or W80A-T309A TagRFP-T-Akt2. Cells were treated with 10 μM MK2206 3 min prior to 1 nM insulin and then 10 μM GDC0068 (7, 8, and 9 cells expressing WT, W80A, and W80A T309A Akt2-TagRFP-T, respectively; n = 3). All data expressed as mean ± SEM; PM, plasma membrane; *p<0.05 compared to insulin alone.
Figure 3—figure supplement 1
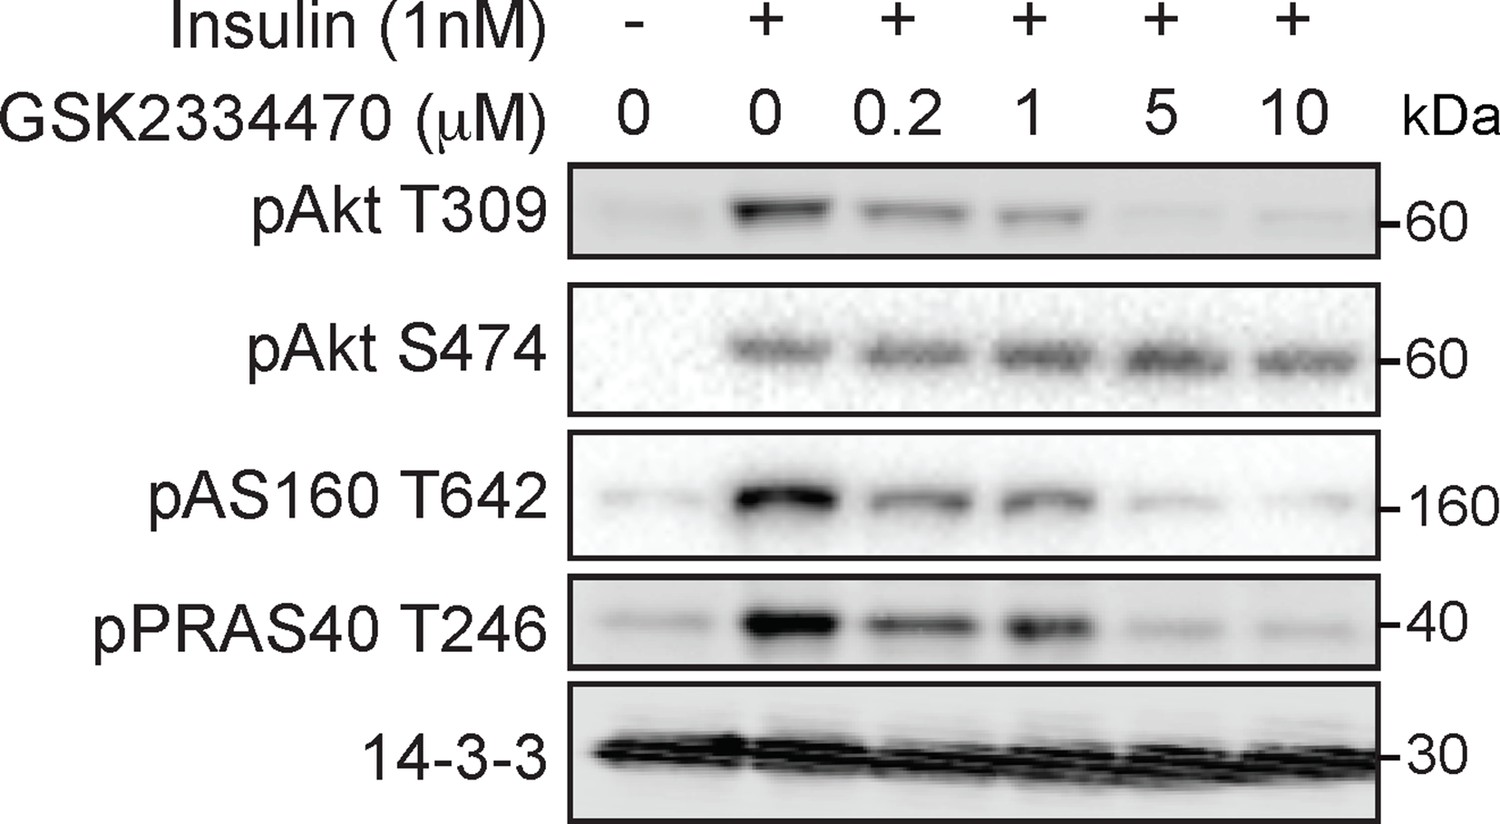
GSK2334470 inhibits phosphoinositide-dependent protein kinase 1 (PDPK1)-dependent signalling outcomes in 3T3-L1 adipocytes.
3T3-L1 adipocytes were incubated with GSK2334470 (PDPK1 inhibitor) at the indicated dose for 15 min followed by 1 nM insulin for 10 min. Lysates were immunoblotted with antibodies as specified, with 14-3-3 as a loading control (p, phosphorylated). A representative image is presented.
Figure 4
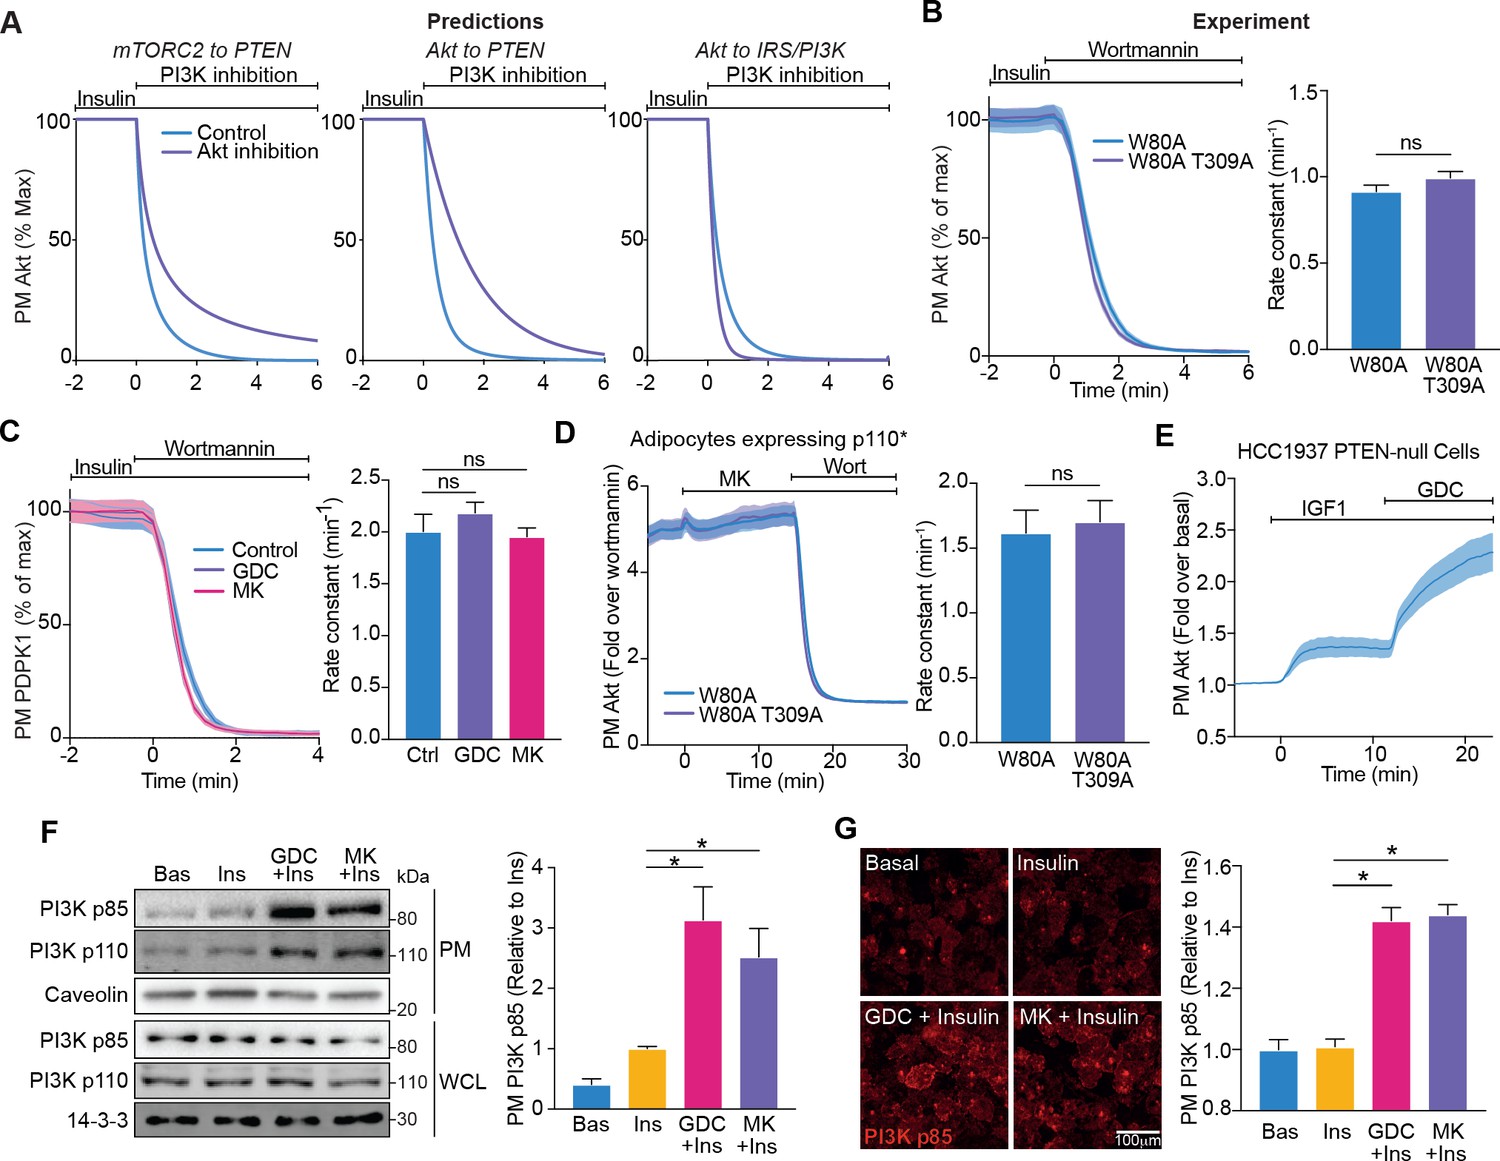
Akt regulates insulin-stimulated production of PI(3,4,5)P3 by phosphoinositide 3-kinase (PI3K).
(A) Model predictions detailing the effect of PI3K inhibition following insulin stimulation, on the plasma membrane dissociation of Akt with and without Akt inhibition. The parameter value of Kf3 was set to null to simulate PI3K inhibition by wortmannin. (B) In the presence of 10 μM MK2206, 3T3-L1 adipocytes expressing W80A or W80A-T309A TagRFP-T-Akt2 were treated with 100 nM insulin, followed by 1 μM wortmannin. Plasma membrane dissociation upon wortmannin treatment was assessed using total internal reflection fluorescence microscopy (TIRFM) (left). The rate constants per individual cell (right) were calculated (70 W80A cells [n = 3], 65 W80A-T309A cells [n = 3], unpaired two-tailed t-test). (C) In the presence of 10 μM MK2206, 10 μM GDC0068 or vehicle control, 3T3-L1 adipocytes expressing phosphoinositide-dependent protein kinase 1 (PDPK1)-eGFP were treated with 100 nM insulin, followed by 1 μM wortmannin. Plasma membrane dissociation upon wortmannin stimulation was assessed using TIRFM (left). The rate constants per individual cell (right) were calculated (123 control cells [n = 3], 121 GDC0068-treated cells [n = 3], 118 MK2206-treated cells [n = 3], unpaired two-tailed t-test corrected for multiple comparisons). (D) 3T3-L1 adipocytes expressing p110* (constitutively active PI3K) and W80A or W80A-T309A TagRFP-T-Akt2 were treated with 10 μM MK2206 followed by 1 μM wortmannin. Plasma membrane dissociation upon wortmannin stimulation was assessed using TIRFM (left). The rate constants per individual cell (right) were calculated (108 W80A cells [n = 3], 98 W80A-T309A cells [n = 3], unpaired two-tailed t-test). (E) HCC1937 phosphatase and tensin homolog (PTEN)-null, human breast cancer cells expressing TagRFP-T-Akt2 were treated with 50 ng/mL IGF1, followed by 10 μM GDC0068. Recruitment was assessed using TIRFM (64 cells [n = 2]). (F) 3T3-L1 adipocytes were treated with 10 μM MK2206, 10 μM GDC0068, or vehicle control for 5 min, followed by 1 nM insulin for 10 min. The plasma membrane was obtained by subcellular fractionation and immunoblotted with antibodies as specified, with caveolin and 14-3-3 as loading controls. A representative blot is presented (left). Quantification of PM PI3K p85 is presented (right; n = 6, unpaired two-tailed t-test corrected for multiple comparisons; WCL, whole cell lysate). (G) 3T3-L1 adipocytes were treated with 10 μM MK2206, 10 μM GDC0068, or a vehicle control for 5 min, followed by 1 nM insulin for 10 min. Cells were fixed, stained with an antibody against PI3K p85 (immunofluorescence), and imaged using TIRFM. A representative image is presented. Scale bar represents 100 μm. Relative p85 signal was quantified (129 basal cells [n = 2], 129 insulin-treated cells [n = 2], 129 GDC0068/insulin-treated cells [n = 2], 158 MK2206/insulin-treated cells [n = 2], unpaired two-tailed t-test corrected for multiple comparisons). All data expressed as mean ± SEM; PM, plasma membrane; ns, not significant; *p<0.05.
Figure 5
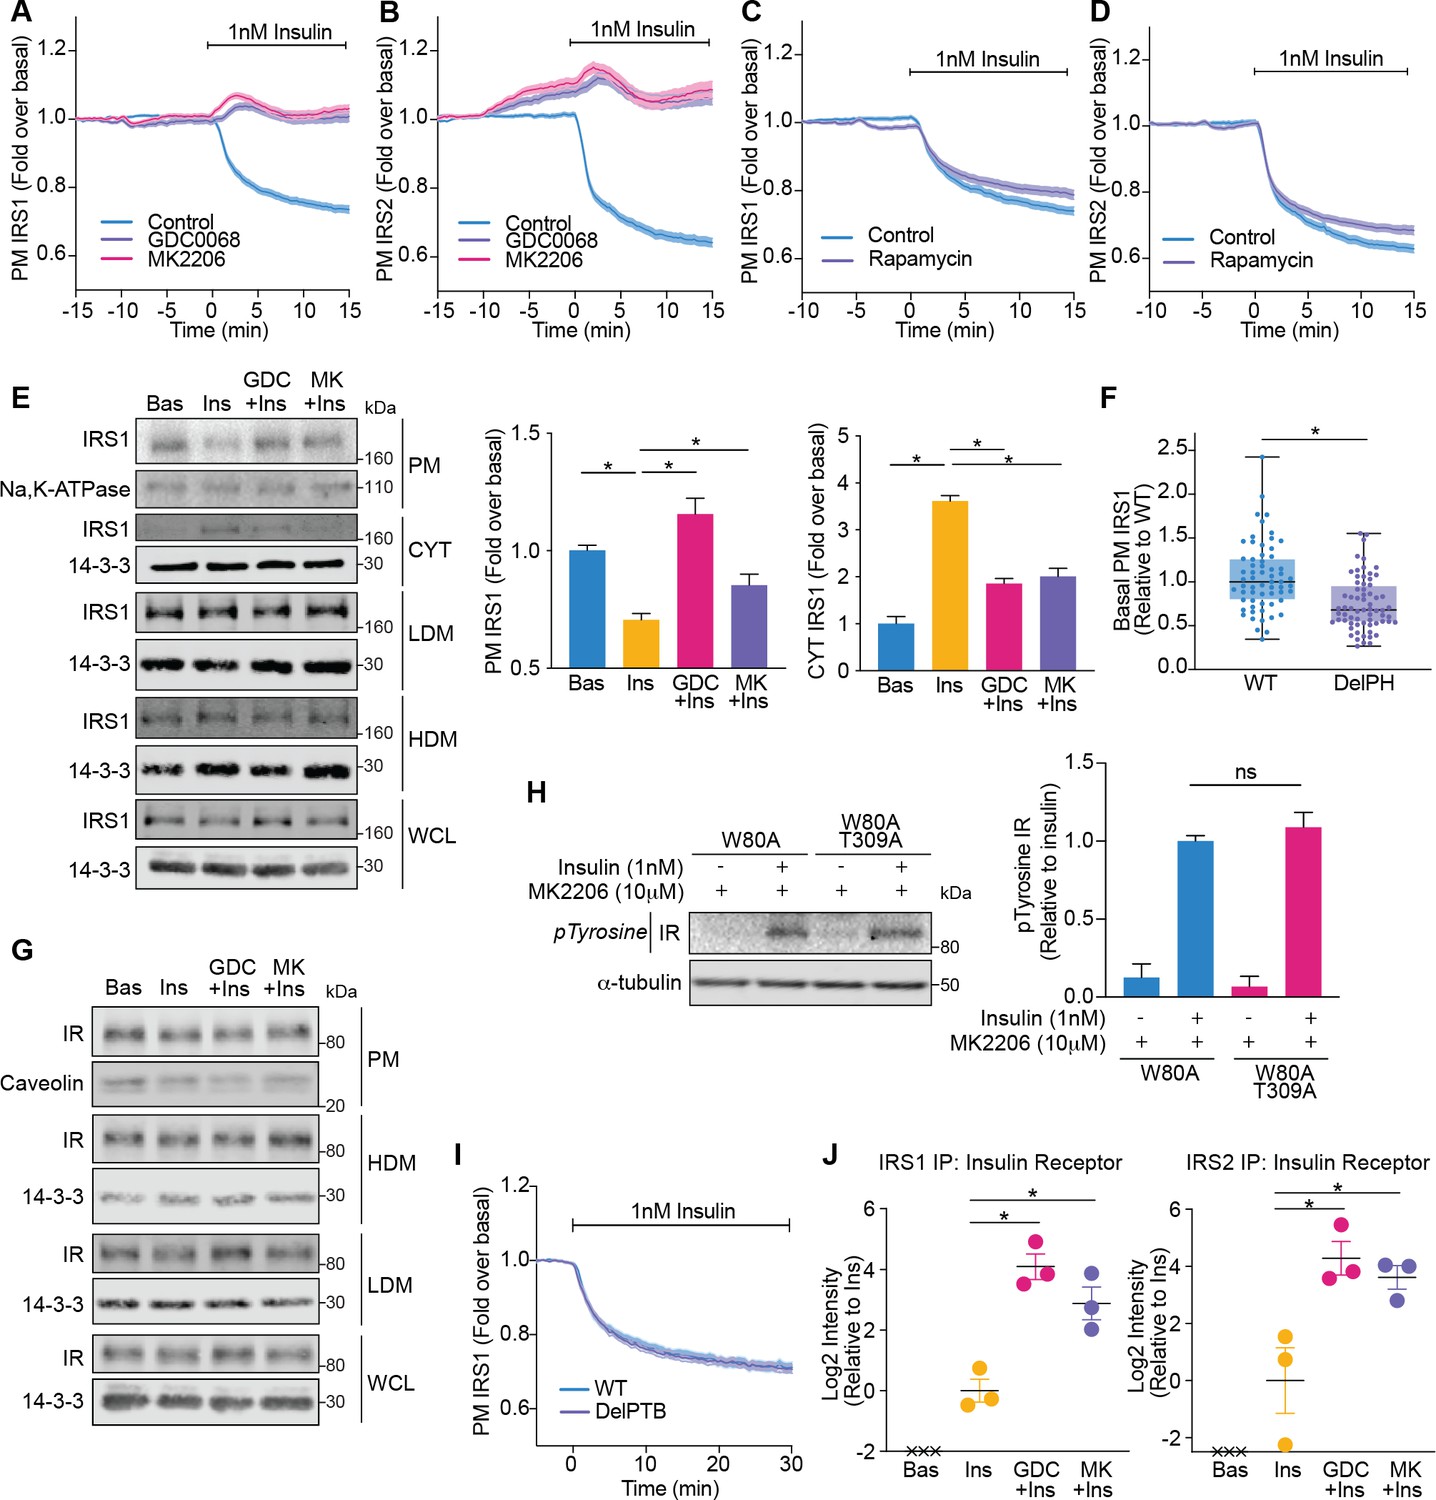
Akt releases insulin receptor substrate 1/2 (IRS1/2) from the plasma membrane to the cytosol.
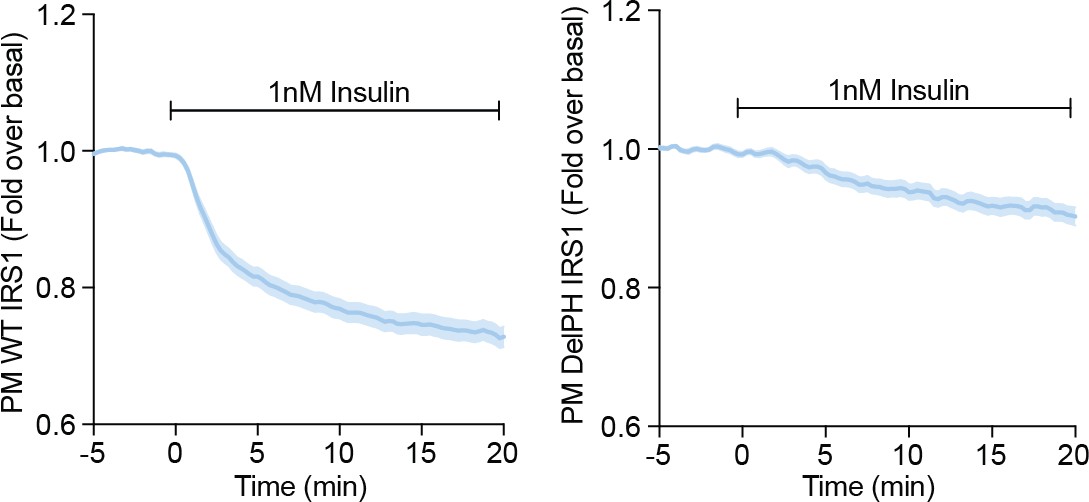
(A) 3T3-L1 adipocytes expressing IRS1-eGFP were stimulated with 10 μM GDC0068, 10 μM MK2206, or vehicle control for 10 min, followed by 1 nM insulin. Recruitment was assessed by total internal reflection fluorescence microscopy (TIRFM) (85 control cells [n = 3], 68 GDC0068-treated cells [n = 3], 79 MK2206-treated cells [n = 3]). (B) 3T3-L1 adipocytes expressing IRS2-eGFP were stimulated with 10 μM GDC0068, 10 μM MK2206, or vehicle control for 10 min, followed by 1 nM insulin. Recruitment was assessed by TIRFM (71 control cells [n = 3], 73 GDC0068-treated cells [n = 3], 69 MK2206-treated cells [n = 3]). (C) 3T3-L1 adipocytes expressing IRS1-eGFP were stimulated with 20 nM rapamycin or vehicle control for 5 min, followed by 1 nM insulin. Recruitment was assessed by TIRFM (70 control cells [n = 3], 75 rapamycin treated cells [n = 3]). (D) 3T3-L1 adipocytes expressing IRS2-eGFP were stimulated with 20 nM rapamycin or vehicle control for 5 min, followed by 1 nM insulin. Recruitment was assessed by TIRFM (66 control cells [n = 3], 77 rapamycin treated cells [n = 3]). (E) 3T3-L1 adipocytes were treated with 10 μM GDC0068, 10 μM MK2206, or vehicle control for 5 min followed by 1 nM insulin for 10 min. Subcellular fractionation was performed and lysates were immunoblotted with antibodies as specified, with Na,K-ATPase and 14-3-3 as loading controls. A representative western blot is presented (WCL, whole cell lysate; Cyt, cytosol; LDM, low density microsomes; HDM, high density microsomes). Quantification of PM IRS1 (n = 4, two-tailed t-test corrected for multiple comparisons) and Cyt IRS1 (n = 3, two-tailed t-test corrected for multiple comparisons) is presented. (F) Unstimulated 3T3-L1 adipocytes expressing WT or DelPH (deletion of pleckstrin homology [PH] domain, residues 2–115 removed) IRS1-eGFP were imaged by TIRF and epifluorescence microscopy. The median TIRF intensity of each cell was normalised to its median epifluorescence intensity (62 WT cells [n = 3], 67 DelPH cells [n = 3], unpaired two-tailed t-test, each circle represents 1 cell). (G) 3T3-L1 adipocytes were treated with 10 μM GDC0068, 10 μM MK2206, or vehicle control for 5 min followed by 1 nM insulin for 10 min. Subcellular fractionation was performed and lysates were immunoblotted with antibodies as specified, with caveolin and 14-3-3 as loading controls. A representative western blot for two independent experiments is presented (WCL, whole cell lysate; LDM, low density microsomes; HDM, high density microsomes). (H) 3T3-L1 adipocytes stably expressing FLAG-W80A or FLAG-W80A-T309A Akt2 were incubated with 10 μM MK2206 for 5 min followed by 1 nM insulin for 10 min. Lysates were immunoblotted with total phosphorylated tyrosine antibody (Cell Signaling Technology CST8954) and ɑ-tubulin as a loading control (p, phosphorylated; IR, insulin receptor). A representative western blot is presented above. Quantification of phosphorylated tyrosine (pY) IR is presented below (n = 3, unpaired two-tailed t-test). (I) 3T3-L1 adipocytes expressing WT or DelPTB (deletion of phosphotyrosine-binding (PTB) domain, residues 161–265 removed) IRS1-eGFP were stimulated with 1 nM Insulin. Recruitment was assessed by TIRFM (63 WT cells [n = 3], 68 DelPTB cells [n = 3]). (J) 3T3-L1 adipocytes were stimulated with 10 μM GDC0068, 10 μM MK2206, or vehicle control for 5 min, followed by 1 nM insulin for 10 min. Endogenous IRS1 or IRS2 was immunoprecipitated and insulin receptor quantified by mass spectrometry (n = 3, crosses represent missing values, two-tailed t-test corrected for multiple comparisons). All data expressed as mean ± SEM; PM, plasma membrane; ns, not significant; *p<0.05.
Figure 6 with 4 supplements
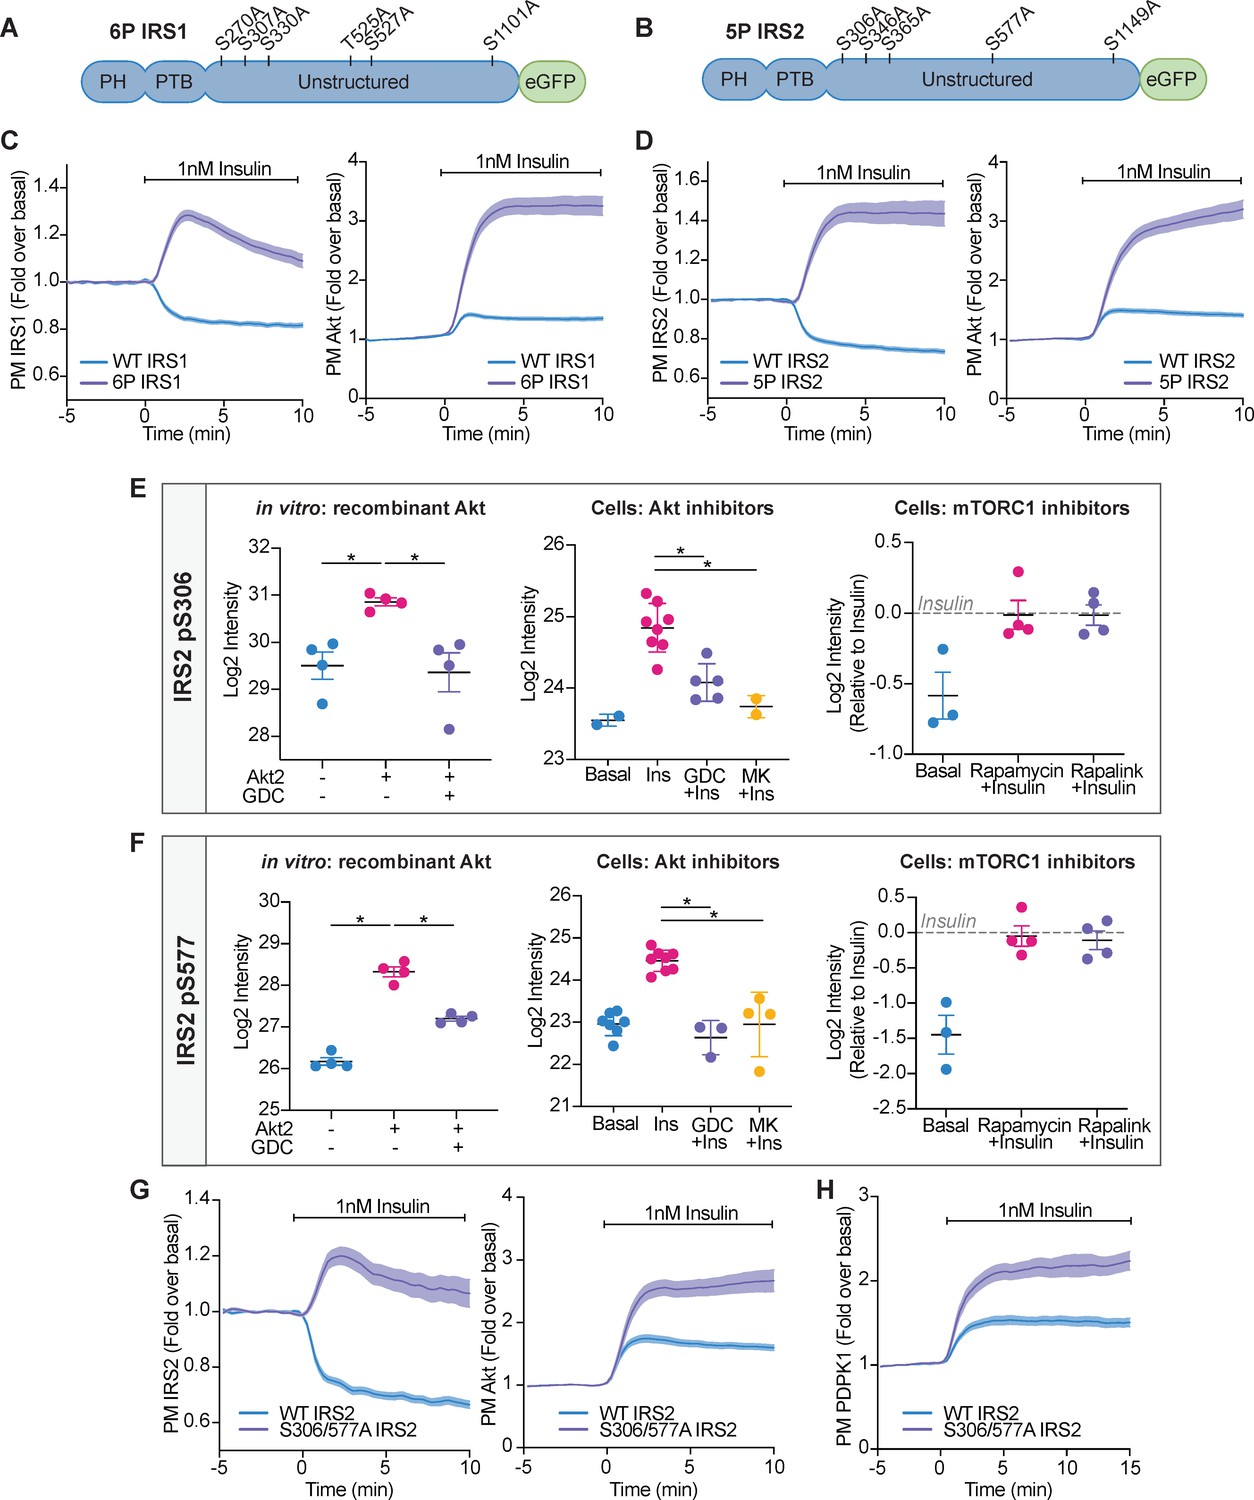
Akt-mediated phosphorylation of insulin receptor substrate (IRS) removes it from the plasma membrane to engage negative feedback.
(A) IRS1-eGFP was concurrently mutated at six phosphorylation sites to make up ‘6P IRS1’ – S270A, S307A, S330A, T525A, S527A, and S1101A (human). (B) IRS2-eGFP was concurrently mutated at five phosphorylation sites to make up ‘5P IRS2’ – S306A, S346A, S365A, S577A, S1149A (human). Each of these Ser/Thr residues resided within an Akt substrate motif (R-X-R-X-X-S/T). Each of these residues was located outside the PH (pleckstrin homology) and PTB (phosphotyrosine-binding) domains of IRS1/2. (C) 3T3-L1 adipocytes were co-electroporated with IRS1-eGFP (WT or 6P) and TagRFP-T-Akt2. Cells were stimulated with 1 nM insulin and recruitment assessed by total internal reflection fluorescence microscopy (TIRFM) (95 WT cells [n = 3], 96 6 P cells [n = 3]). (D) 3T3-L1 adipocytes were co-electroporated with IRS2-eGFP (WT or 5P) and TagRFP-T-Akt2. Cells were stimulated with 1 nM insulin and recruitment assessed by TIRFM (139 WT cells [n = 5], 103 5P cells [n = 5]). (E) Quantification of phosphorylated IRS2 S306 (S303 in mouse) peptides across three mass spectrometry experiments. (F) Quantification of phosphorylated IRS2 S577 (S573 in mouse) peptides across three mass spectrometry experiments. (E–F) In vitro: recombinant Akt; mass spectrometry was used to quantify IRS2 phosphorylation following an in vitro assay using immunoprecipitated IRS2-FLAG and recombinant active Akt2 (n = 4, two-tailed t-test corrected for multiple comparisons). Cells: Akt inhibitors; 3T3-L1 adipocytes were treated with 10 μM GDC0068, 10 μM MK2206, or vehicle control for 5 min followed by 1 nM insulin for 10 min. Mass spectrometry-based phosphoproteomics was used to quantify IRS2 phosphorylation (n = 8, two-tailed t-test corrected for multiple comparisons). Cells: mTORC1 inhibitors; Triple-SILAC labelled HEK-293E cells were treated with 100 nM rapamycin, 3 nM rapalink, or vehicle control for 4 hr followed by 100 nM insulin for 10 min. Mass spectrometry-based phosphoproteomics was used to quantify IRS2 phosphorylation (n = 4). (G) 3T3-L1 adipocytes were co-electroporated with IRS2-eGFP (WT or S306/577A) and TagRFP-T-Akt2. Cells were stimulated with 1 nM insulin and recruitment assessed by TIRFM (79 WT cells [n = 3], 74 S306/577A cells [n = 3]). (H) 3T3-L1 adipocytes were co-electroporated with IRS2-eGFP (WT or S306/577A) and phosphoinositide-dependent protein kinase 1 (PDPK1)-TagRFP-T. Cells were stimulated with 1 nM insulin and recruitment assessed by TIRFM (49 WT cells [n = 3], 76 S306/577A cells [n = 3]). All data expressed as mean ± SEM; PM, plasma membrane; *p<0.05.
Figure 6—figure supplement 1
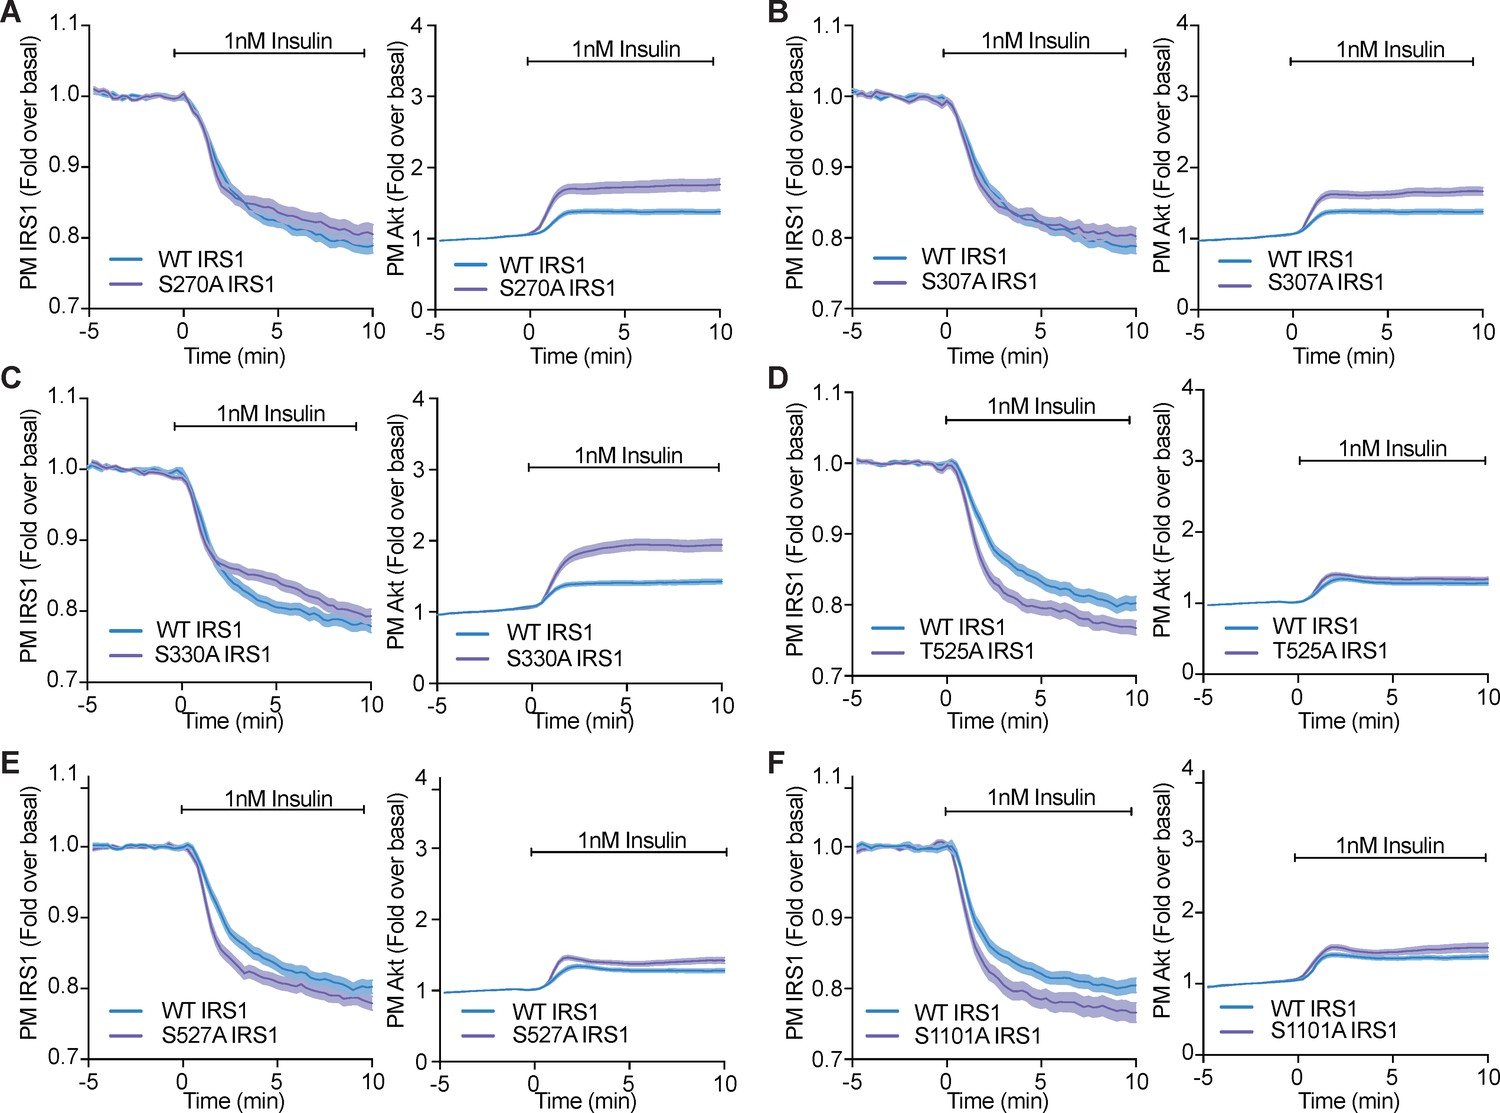
Phosphorylation of a variety of IRS1 residues alter IRS1 and Akt localisation at the plasma membrane.
(A–F) 3T3-L1 adipocytes were co-electroporated with insulin receptor substrate 1 (IRS1)-eGFP (WT or mutant) and TagRFP-T-Akt2. Cells were stimulated with 1 nM insulin and recruitment assessed by total internal reflection fluorescence microscopy (TIRFM) (n = 3). All data expressed as mean ± SEM; PM, plasma membrane.
Figure 6—figure supplement 2
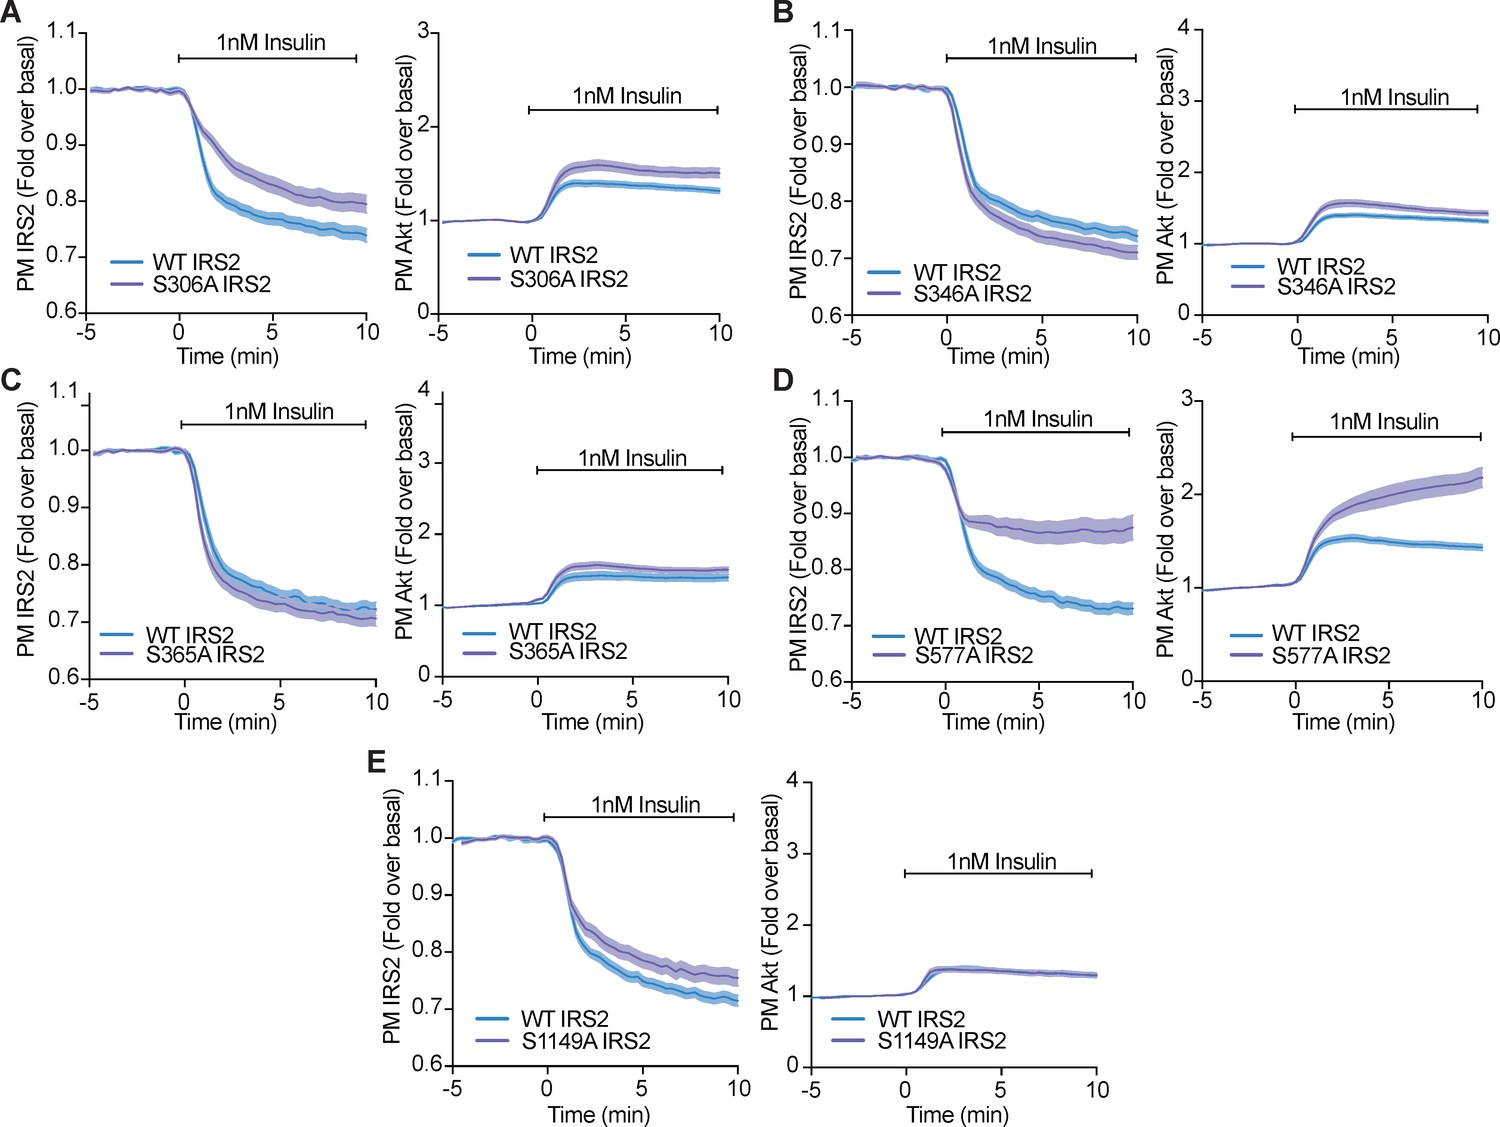
Phosphorylation of a variety of IRS2 residues alter IRS2 and Akt localisation at the plasma membrane.
(A–E) 3T3-L1 adipocytes were co-electroporated with insulin receptor substrate 2 (IRS2)-eGFP (WT or mutant) and TagRFP-T-Akt2. Cells were stimulated with 1 nM insulin and recruitment assessed by total internal reflection fluorescence microscopy (TIRFM) (n = 3). All data expressed as mean ± SEM; PM, plasma membrane.
Figure 6—figure supplement 3
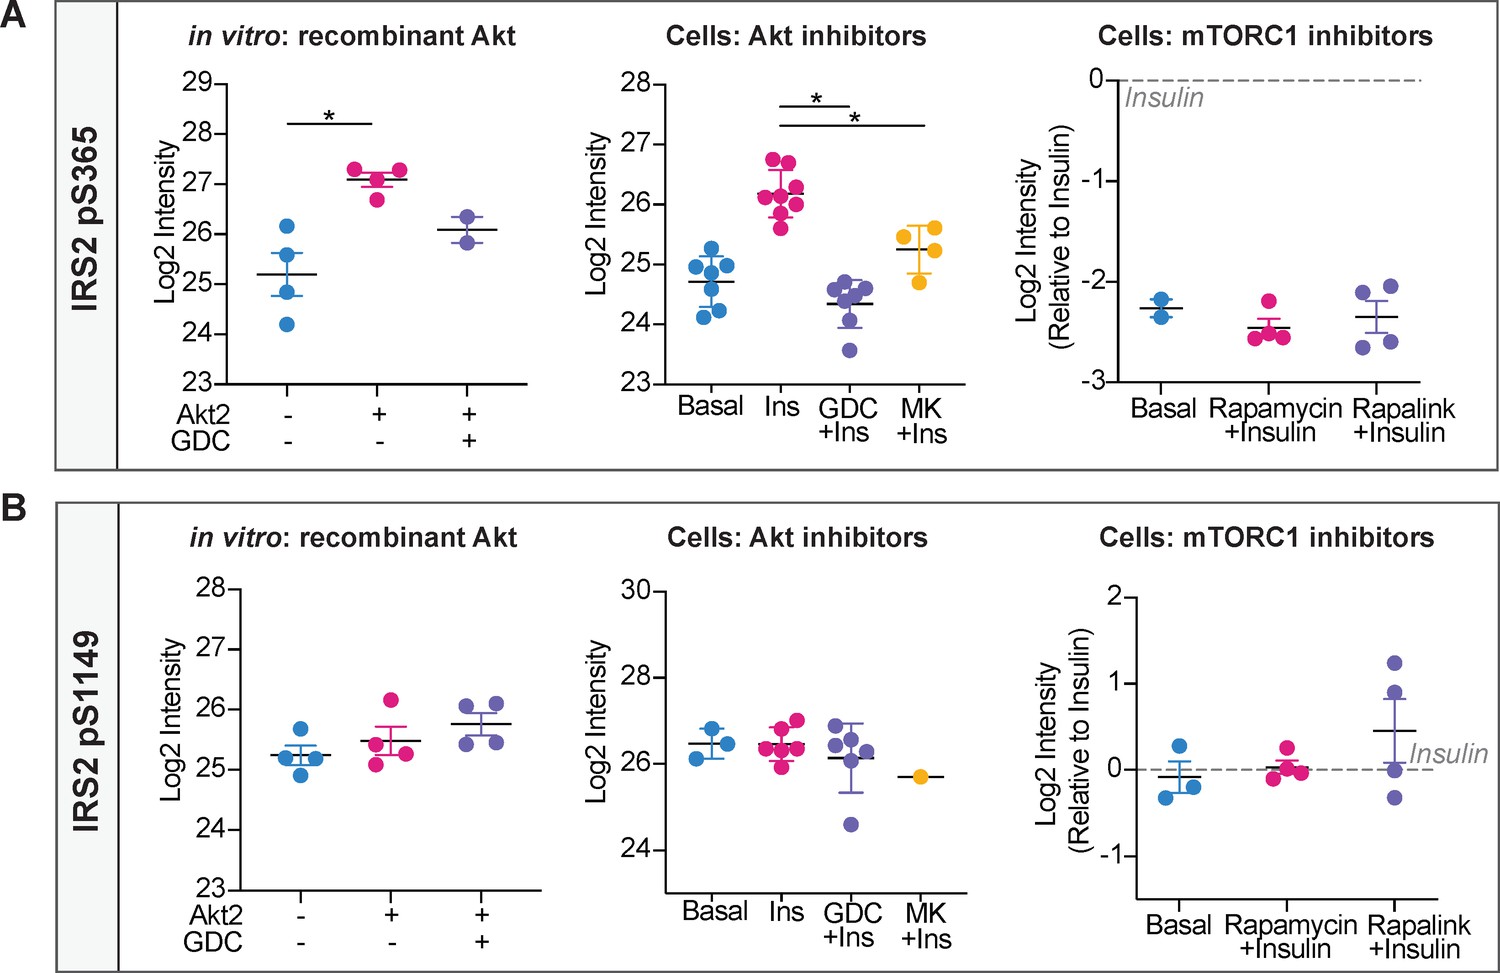
Phosphorylation of IRS2 at S365 and S1149 in vitro and in cells.
(A) Quantification of phosphorylated insulin receptor substrate 2 (IRS2) S365 (S362 in mouse) peptides across three mass spectrometry experiments. (B) Quantification of phosphorylated IRS2 S1149 (S1138 in mouse) peptides across three mass spectrometry experiments. (A–B) In vitro: recombinant Akt; mass spectrometry was used to quantify IRS2 phosphorylation following an in vitro assay using immunoprecipitated IRS2-FLAG and recombinant active Akt2 (n = 4, two-tailed t-test corrected for multiple comparisons). Cells: Akt inhibitors; 3T3-L1 adipocytes were treated with 10 μM GDC0068, 10 μM MK2206, or vehicle control for 5 min followed by 1 nM insulin for 10 min. Mass spectrometry-based phosphoproteomics was used to quantify IRS2 phosphorylation (n = 8, two-tailed t-test corrected for multiple comparisons). Cells: mTORC1 inhibitors; Triple-SILAC labelled HEK-293E cells were treated with 100 nM rapamycin, 3 nM rapalink, or vehicle control for 4 hr followed by 100 nM insulin for 10 min. Mass spectrometry-based phosphoproteomics was used to quantify IRS2 phosphorylation (n = 4). All data expressed as mean ± SEM; PM, plasma membrane; *p<0.05.
Figure 6—figure supplement 4
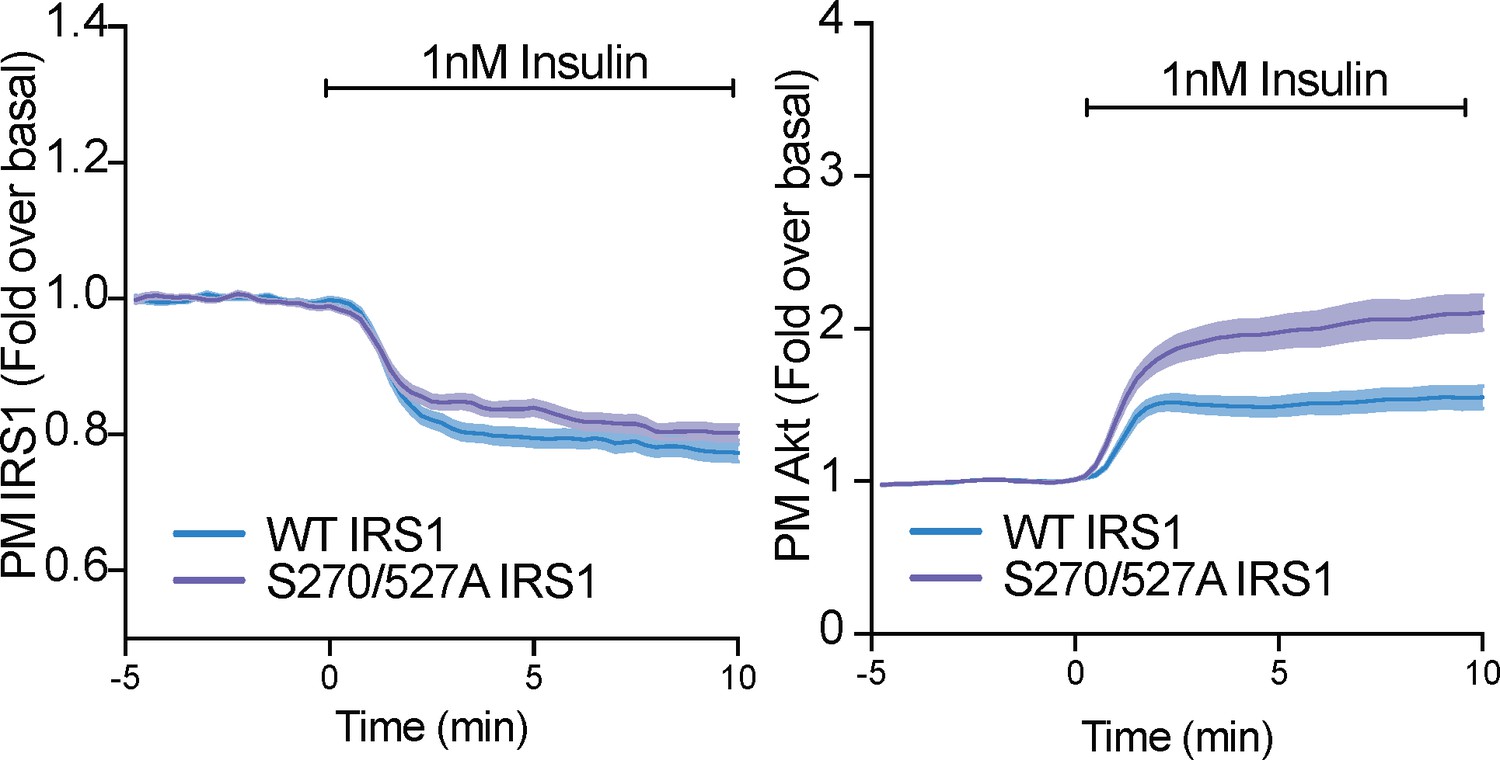
Phosphorylation of IRS1 at S270 and S527 only subtly alter IRS1 and Akt localisation at the plamsa membrane.
3T3-L1 adipocytes were co-electroporated with human insulin receptor substrate 1 (IRS1)-eGFP (WT or S270/527A) and TagRFP-T-Akt2. Cells were stimulated with 1 nM insulin and recruitment assessed by total internal reflection fluorescence microscopy (TIRFM) (n = 3). All data expressed as mean ± SEM; PM, plasma membrane.
Figure 7
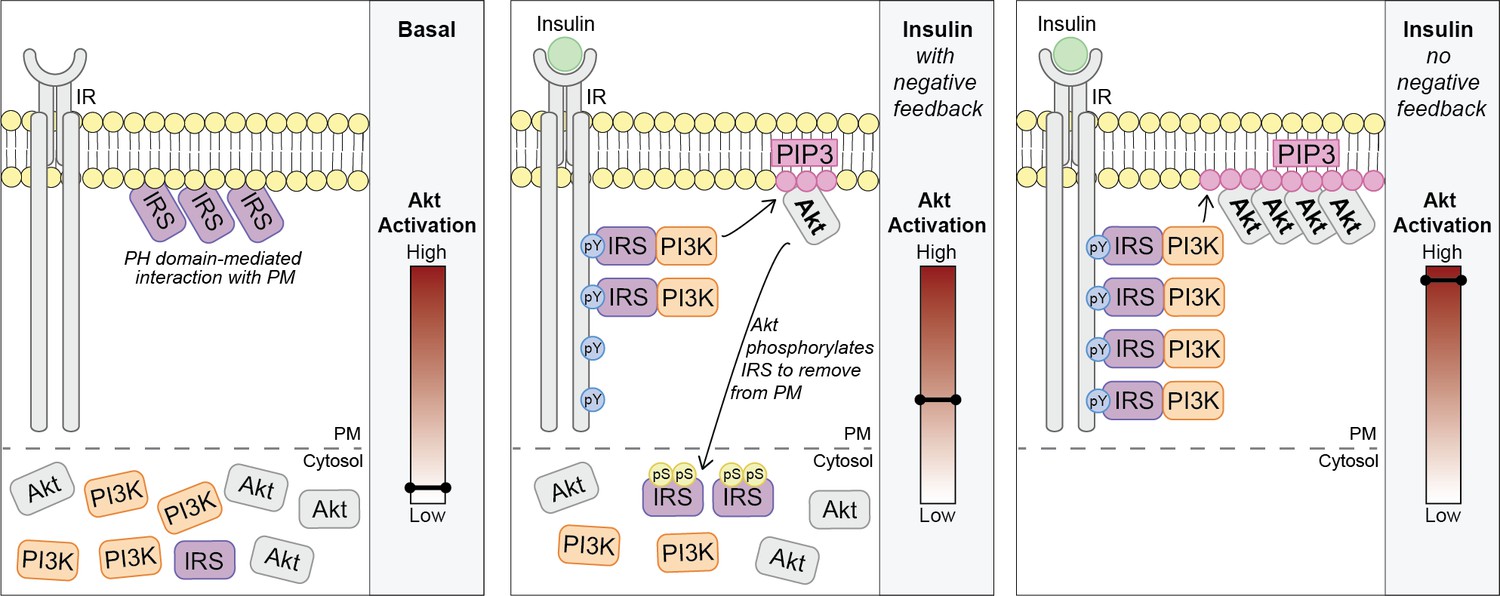
Akt phosphorylates insulin receptor substrate 1/2 (IRS1/2) to limit phosphoinositide 3-kinase (PI3K)-mediated phosphatidylinositol (3,4,5)-trisphosphate (PIP3) synthesis.
Schematic for a model of Akt-mediated negative feedback. Basal; IRS is plasma membrane (PM) localised due to a pleckstrin homology (PH) domain-mediated interaction with the PM. Insulin (with negative feedback); following insulin binding the insulin receptor (IR), it is autophosphorylated at tyrosine residues (pY) and recruits IRS, which binds PI3K. Plasma membrane-associated PI3K produces PIP3, and Akt is activated. Akt phosphorylates IRS at a number of residues including IRS2 S306 and S577 (pS), which moves IRS to the cytosol and limits the pool available to interact with the IR. This restricts the ability of PI3K to move to the PM and synthesise PIP3. Insulin (no negative feedback); IRS and PI3K are not released from the plasma membrane into the cytosol and consequently there is increased PI3K-mediated PIP3 production and increased Akt activation.
Author response image 1
Models’ simulations of Akt recruitment, T309 and S474 phosphorylation, and PRAS40 phosphorylation in response to 1 and 100 nM insulin (simulation; dotted lines).
This was overlaid with the experimentally observed kinetics for each outcome (experiment; solid lines, mean ± S.E.M). Red boxes highlight inconsistencies between model’s simulations and experimental data.
Author response image 2
3T3-L1 adipocytes were electroporated with WT (left) or DelPH (right) IRS1-eGFP and stimulated with 1 nM Insulin.
Recruitment was assessed by TIRFM (three independent experiments, data expressed as mean ± S.E.M, PM; plasma membrane).
Author response image 3
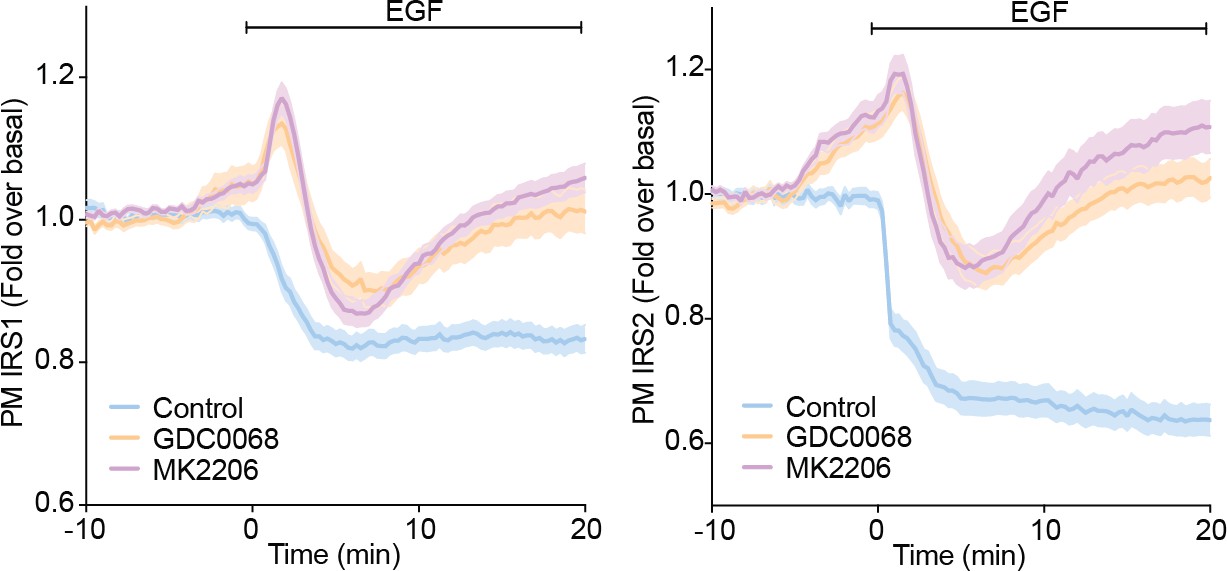
3T3-L1 adipocytes were electroporated with IRS1-eGFP or IRS2-eGFP.
Cells were stimulated with DMSO, 10 µM MK2206 or 10 µM GDC0068 5 min prior to 100 ng/mL EGF (epidermal growth factor) and recruitment assessed by TIRFM (two independent experiments, data expressed as mean ± S.E.M, PM; plasma membrane).
Author response image 4
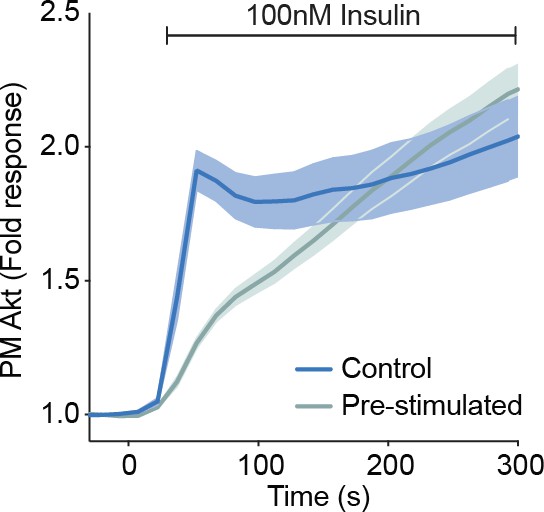
3T3-L1 adipocytes were electroporated with TagRFP-T-Akt2.
Cells were stimulated with 100 nM insulin with or without a 1 nM insulin pre-stimulation. Recruitment was assessed by TIRFM (data expressed as mean ± S.E.M, PM; plasma membrane).
Tables
Key resources table
| Reagent type (species) or resource | Designation | Source or reference | Identifiers | Additional information |
|---|---|---|---|---|
| Cell line (mouse) | 3T3-L1 | Dr Howard Green, Harvard Medical School | RRID:CVCL_0A20 | |
| Cell line (human) | HEK293E | American Type Culture Collection | RRID:CVCL_6974 | |
| Cell line (human) | HeLa | American Type Culture Collection | RRID:CVCL_0030 | |
| Cell line (human) | HCC1937 | American Type Culture Collection | RRID:CVCL_0290 | |
| Cell line (human) | MCF7 | Associate Prof. Jeff Holst, Centenary Institute | RRID:CVCL_0031 | |
| Antibody | pAkt T309 (rabbit polyclonal) | Cell Signalling Technology | Cat#9275 | WB (1:1000) |
| Antibody | pAkt T309 (rabbit monoclonal) | Cell Signalling Technology | Cat#13038 | WB (1:1000) |
| Antibody | pAkt S474 (mouse monoclonal) | Cell Signalling Technology | Cat#4051 | WB (1:1000) |
| Antibody | pAS160 T642 (rabbit polyclonal) | Cell Signalling Technology | Cat#4288 | WB (1:1000) |
| Antibody | pPRAS40 T246 (rabbit monoclonal) | Cell Signalling Technology | Cat#2997 | WB (1:1000) |
| Antibody | pGSK3ɑ/β S21/29 (rabbit monoclonal) | Cell Signalling Technology | Cat#9327 | WB (1:1000) |
| Antibody | pFOXO1 S256 (rabbit polyclonal) | Cell Signalling Technology | Cat#9461 | WB (1:1000) |
| Antibody | 14-3-3 (rabbit polyclonal) | Santa Cruz | Cat#sc-629 | WB (1:1000) |
| Antibody | pP70S6K T389 (rabbit polyclonal) | Cell Signalling Technology | Cat#9205 | WB (1:1000) |
| Antibody | Akt2 (rabbit monoclonal) | Cell Signalling Technology | Cat#3063 | WB (1:1000) |
| Antibody | Caveolin (mouse monoclonal) | Abcam | Cat#ab17052 | WB (1:1000) |
| Antibody | Pan Akt (rabbit monoclonal) | Cell Signalling Technology | Cat#4685 | WB (1:1000) |
| Antibody | PI3K p85 (rabbit monoclonal) | Cell Signalling Technology | Cat#4257 | WB (1:1000) IF (1:100) |
| Antibody | PI3K p110 (rabbit monoclonal) | Cell Signalling Technology | Cat#4249 | WB (1:1000) |
| Antibody | IRS1 (rabbit polyclonal) | Cell Signalling Technology | Cat#2382 | WB (1:1000) |
| Antibody | Na,K-ATPase (rabbit polyclonal) | Prof. Gus Lienhard | ||
| Antibody | IR (rabbit monoclonal) | Cell Signalling Technology | Cat#3025 | WB (1:1000) |
| Antibody | pTyrosine (rabbit monoclonal mix) | Cell Signalling Technology | Cat#8954 | WB (1:1000) |
| Antibody | ɑ-Tubulin (mouse monoclonal) | Sigma-Aldrich | Cat#T9026 | WB (1:1000) |
| Antibody | IRS1 (rabbit monoclonal) | Cell Signalling Technology | Cat#3407 | IP (2 µL per sample) |
| Antibody | IRS2 (rabbit polyclonal) | Cell Signalling Technology | Cat#3089 | IP (2 µL per sample) |
| Antibody | FLAG (mouse monoclonal) | Sigma-Aldrich | Cat#F1804 | IP (5 µg per sample) |
| Antibody | IgG control (rabbit) | Santa Cruz | Cat#sc-2027 | IP (control) |
| Antibody | Alexa Fluor 555 (goat polyclonal) | Thermo Fisher Scientific | Cat#A21428 | IF(1:200) |
| Peptide, recombinant protein | 3X FLAG Peptide | Sigma-Aldrich | Cat#F4799 | |
| Chemical compound, drug | Insulin | Sigma-Aldrich | Cat# I5500; CAS 11070-73-8 | |
| Chemical compound, drug | Insulin-like growth factor 1 (IGF1) | Miltenyi Biotec | Cat#130-093-886 | |
| Chemical compound, drug | Epidermal growth factor (EGF) | Miltenyi Biotec | Cat#130-097-749 | |
| Chemical compound, drug | GDC0068 | Selleck Chemicals | Cat#S2808; CAS 1001264-89-6 | |
| Chemical compound, drug | MK2206 | MedChemExpress | Cat#HY-10358; CAS 1032350-13-2 | |
| Chemical compound, drug | Wortmannin | Sigma-Aldrich | Cat#W1628; CAS 19545-26-7 | |
| Chemical compound, drug | Rapamycin | LC Laboratories | Cat#R-5000; CAS 53123-88-9 | |
| Chemical compound, drug | Rapalink | Prof. Kevan Shokat (Rodrik-Outmezguine et al., 2016) | ||
| Chemical compound, drug | GSK2334470 | Tocris | Cat# 4143; CAS 1227911-45-6 | |
| Commercial assay or kit | PIP3 ELISA | Echelon Biosciences | Cat#K-2500S | |
| Commercial assay or kit | PI(3,4)P2 ELISA | Echelon Biosciences | Cat#K-4500 | |
| Recombinant DNA reagent | TagRFP-T-Akt2 (plasmid) | Norris et al., 2017 | ||
| Recombinant DNA reagent | TagRFP-T-Akt2 W80A; W80A-T309A; W80A-S474A; W80A-T309A-S474A; W80A-K181A (plasmids) | This paper | See Materials and methods and Supplementary file 3 for DNA sequences | |
| Recombinant DNA reagent | PDPK1-eGFP (plasmid) | This paper | See Materials and methods and Supplementary file 3 for DNA sequences | |
| Recombinant DNA reagent | PDPK1-TagRFP-T (plasmid) | This paper | See Materials and methods and Supplementary file 3 for DNA sequences | |
| Recombinant DNA reagent | PH-Gab2-GFP (plasmid) | Sergio Grinstein – Addgene | Plasmid #35147 | |
| Recombinant DNA reagent | PI3K p110* (plasmid) | Morris Birnbaum | ||
| Recombinant DNA reagent | pMIG FLAG-Akt2 W80A; W80A-T309A (plasmids) | Kearney et al., 2019 | ||
| Recombinant DNA reagent | IRS1-eGFP (plasmid) | This paper | See Materials and methods and Supplementary file 3 for DNA sequences | |
| Recombinant DNA reagent | IRS1-eGFP S270A; S307A; S330A; T525A; S527A; S1101A; S270A-S307A-S330A-T525A-S527A-S1101A (6P); S270A-S527A; DelPH; DelPTB (plasmids) | This paper | See Materials and methods and Supplementary file 3 for DNA sequences | |
| Recombinant DNA reagent | IRS2-eGFP (plasmid) | This paper | See Materials and methods and Supplementary file 3 for DNA sequences | |
| Recombinant DNA reagent | IRS2-eGFP S306A; S346A; S365A; S577A; S1149A; S306A-S346A-S365A-S577A-S1149A (5P); S306A-S577A (plasmids) | This paper | See Materials and methods and Supplementary file 3 for DNA sequences | |
| Recombinant DNA reagent | IRS2-FLAG (plasmid) | This paper | See Materials and methods and Supplementary file 3 for DNA sequences | |
| Sequence-based reagent | DNA Primers | Sigma-Aldrich | See Materials and methods and Supplementary file 3 for DNA sequences | |
| Software, algorithm | MaxQuant | Cox and Mann, 2008; Tyanova et al., 2016 | RRID:SCR_014485 | |
| Software, algorithm | Image Studio | LI-COR Biosciences | RRID:SCR_013715 | |
| Software, algorithm | Graphpad Prism | GraphPad Software Inc. | RRID:SCR_002798 | |
| Software, algorithm | Fiji ImageJ | Schindelin et al., 2012 | RRID:SCR_003070 | |
| Software, algorithm | Tableau Prep | Tableau Software | ||
| Software, algorithm | R | https://www.R-project.org/ | RRID:SCR_001905 | |
| Software, algorithm | MATLAB | MathWorks | RRID:SCR_001622 | |
| Software, algorithm | IQM | IntiQuan |
Additional files
-
Supplementary file 1
Reactions and rate equations for the PI3K/Akt pathway models.
- https://cdn.elifesciences.org/articles/66942/elife-66942-supp1-v1.docx
-
Supplementary file 2
Parameter identifiability analysis of models 4 to 9.
- https://cdn.elifesciences.org/articles/66942/elife-66942-supp2-v1.pdf
-
Supplementary file 3
DNA sequence of plasmids and primers generated in this study.
- https://cdn.elifesciences.org/articles/66942/elife-66942-supp3-v1.docx
-
Transparent reporting form
- https://cdn.elifesciences.org/articles/66942/elife-66942-transrepform-v1.docx
Download links
A two-part list of links to download the article, or parts of the article, in various formats.
Downloads (link to download the article as PDF)
Open citations (links to open the citations from this article in various online reference manager services)
Cite this article (links to download the citations from this article in formats compatible with various reference manager tools)
Akt phosphorylates insulin receptor substrate to limit PI3K-mediated PIP3 synthesis
eLife 10:e66942.
https://doi.org/10.7554/eLife.66942


