Mechanism of life-long maintenance of neuron identity despite molecular fluctuations
- Department of Living Matter, AMOLF, Netherlands
- Department of Cell Biology, Erasmus University Medical Centre, Netherlands
Figures
Figure 1 with 2 supplements
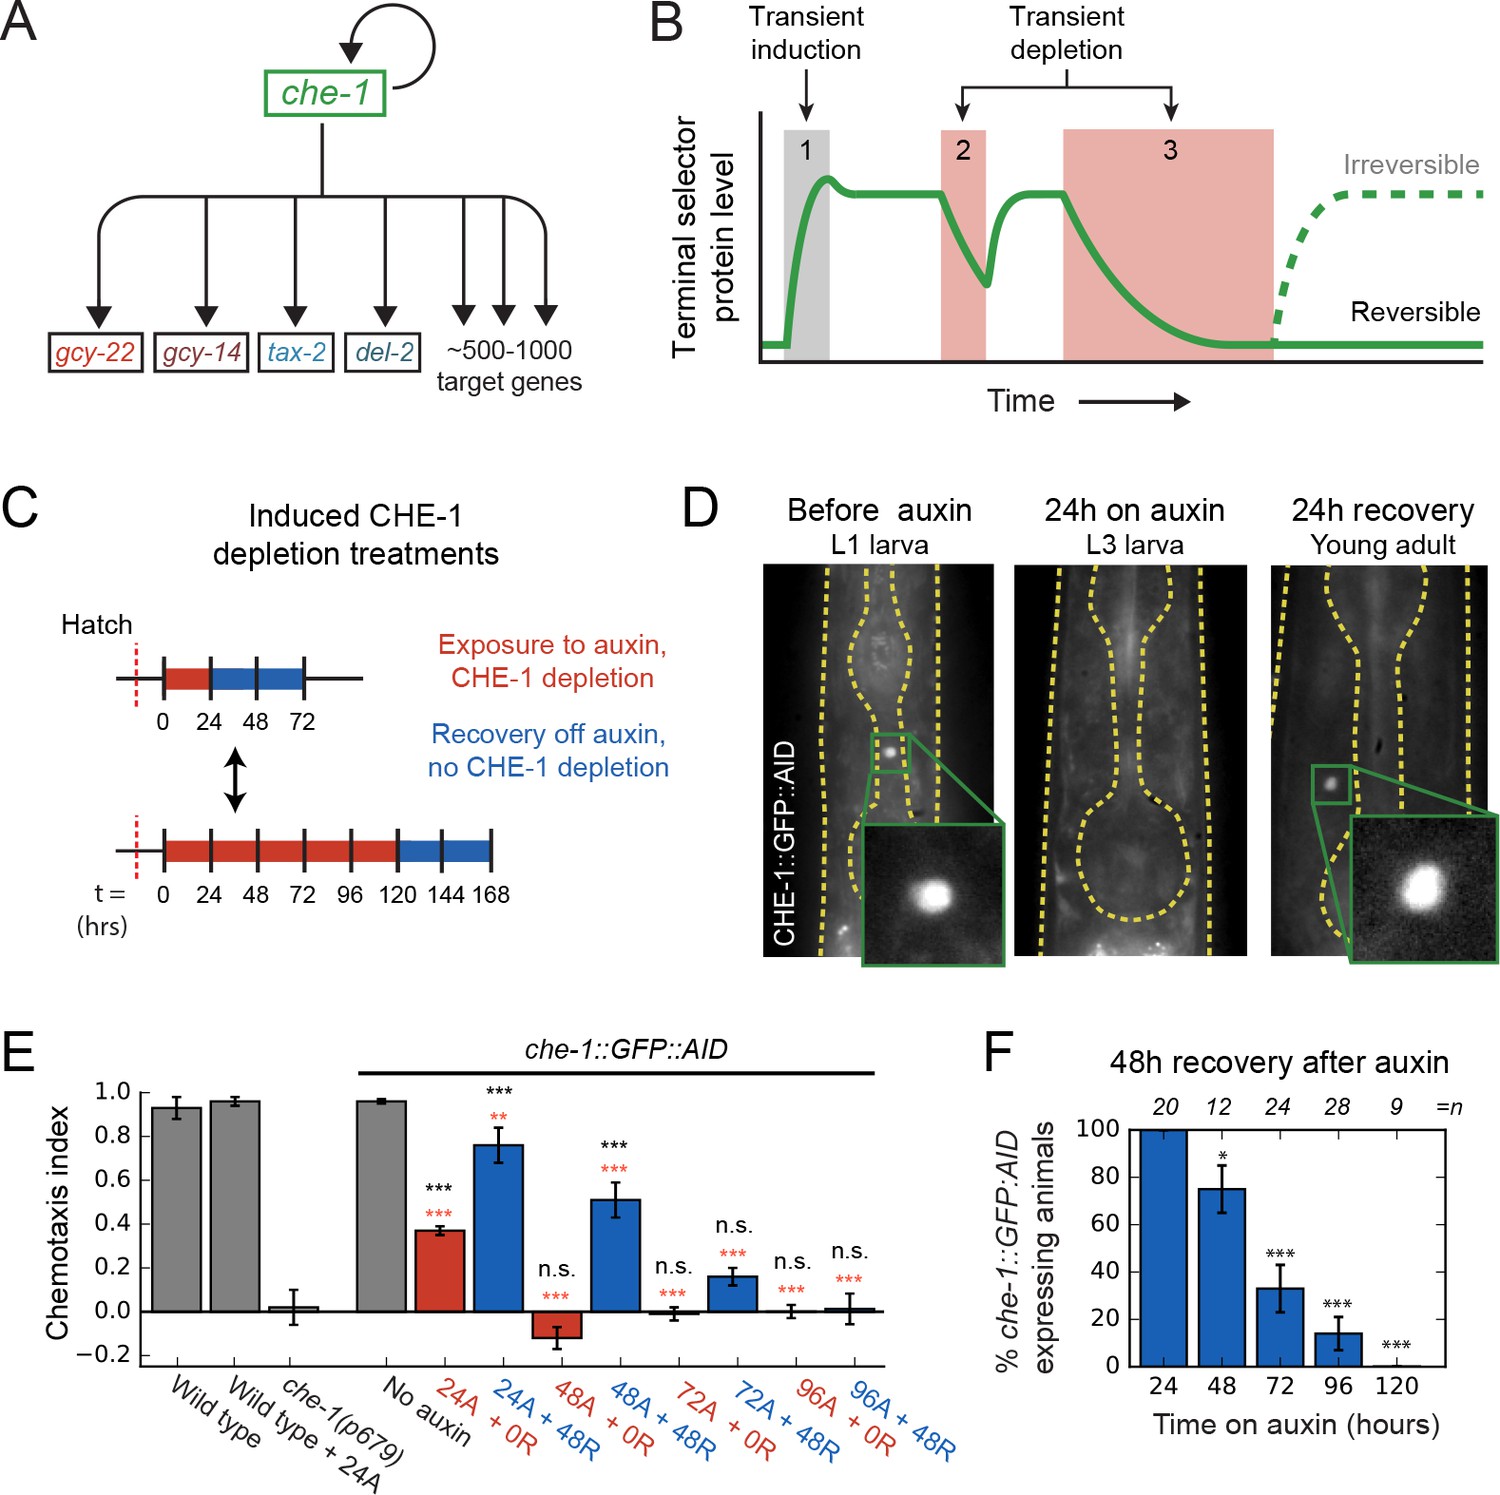
Loss of ASE neuron fate upon transient CHE-1 depletion.
(A) The terminal selector gene che-1 induces its own expression and that of 500–1000 target genes that together determine ASE neuron fate. Positive autoregulation of che-1 expression could result in bistable, switch-like behavior. (B) Bistability generates sustained terminal selector expression upon transient induction (1), that is resilient to short periods of terminal selector depletion (2). However, bistable switches remain reversible and will lose terminal selector expression upon sufficiently long depletion (3), while irreversible switches will always recover. (C) Transient CHE-1 depletion using Auxin-Induced Degradation (AID). che-1::GFP::AID L1 larvae (CHE-1::GFP::AID) or young adults (chemotaxis) were exposed for different time periods to 1 mM auxin to induce CHE-1::GFP:AID degradation, and were subsequently characterized after a 24- or 48-hr recovery period. (D) CHE-1::GFP::AID fluorescence in che-1::GFP::AID animals before (left) and after 24 hr auxin treatment (middle), and after a subsequent 24 hr recovery off auxin (right). Even though CHE-1::GFP::AID is lost from ASE neurons after auxin treatment, it reappears after recovery off auxin. (E) Response to 10 mM NaCl for wild-type animals, che-1(p679) mutants defective in NaCl chemotaxis, and che-1::GFP::AID animals exposed to auxin for 24–96 hr (24A – 96A) tested directly (0 R) or after 48 hr recovery (48 R). che-1::GFP::AID animals on auxin showed a chemotaxis defect similar to che-1(p679) mutants. che-1::GFP::AID animals recovered chemotaxis to NaCl after 24 or 48 hr on auxin, but exhibited a persistent chemotaxis defect after sufficiently long, transient CHE-1::GFP::AID depletion. (F) Fraction of animals that recovered CHE-1::GFP::AID expression 48 hr after auxin treatment of increasing length. No animals recovered CHE-1::GFP::AID expression after 120 hr depletion. Error bars in (E) and (F) represent mean of four assays ± S.E.M. *p < 0.05, **p < 0.01, ***p < 0.001, n.s. indicates not significant. In (E) significance is compared to che-1(p679) mutants (black) or che-1::GFP::AID animals without auxin (red).
-
Figure 1—source data 1
Data and scripts for Figure 1 and related figure supplements.
- https://cdn.elifesciences.org/articles/66955/elife-66955-fig1-data1-v2.zip
Figure 1—figure supplement 1
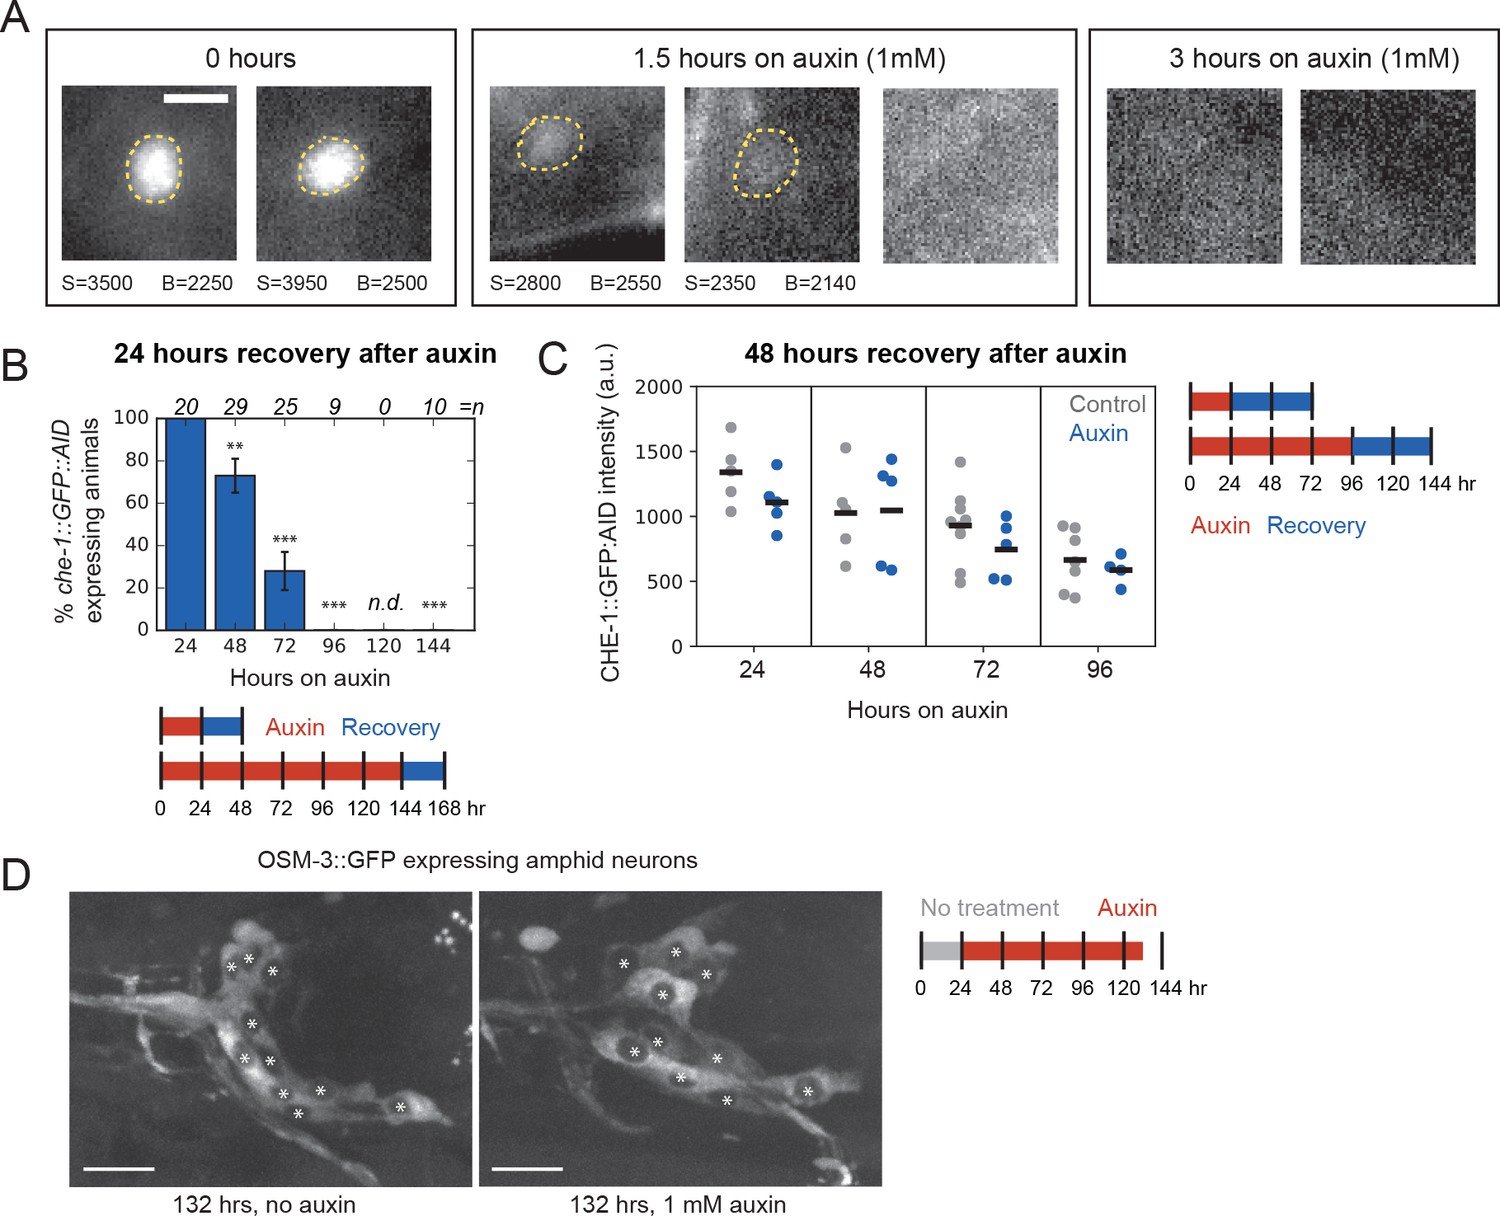
CHE-1 recovery after depletion.
(A). Representative images of CHE-1::GFP::AID in animals after different durations of auxin-induced CHE-1::GFP::AID depletion. Dashed circles highlight visible CHE-1::GFP::AID fluorescence. For ASE neurons with visible CHE-1::GFP::AID fluorescence, S and B denote the fluorescence signal within the dashed circles and the background outside, respectively (arbitrary units). For animals after 1.5 hr on auxin, CHE-1::GFP::AID fluorescence was much reduced, when visible, while for animals 3 hr on auxin no CHE-1::GFP::AID was visible and the fluorescence signal at the expected location of the ASE neuron is shown instead. Overall, 15/15 control animals showed visible CHE-1::GFP::AID, compared to 2/10 and 0/7 animals after 1.5 and 3 hr exposure to auxin, respectively, indicating that auxin-mediated CHE-1::GFP::AID depletion was rapid. Scalebar: 3 μm. (B) Percentage of animals that recovered CHE-1::GFP::AID expression after auxin treatment of increasing length with a recovery period of 24 hr. Schematics indicate the range of times and durations of auxin treatment. **p < 0.01, ***p < 0.001, and n.d. indicates not determined. (C) CHE-1::GFP::AID fluorescence intensity in animals that recovered CHE-1::GFP::AID after 24–96 hr of auxin-induced degradation, compared to control animals of the same age that were not exposed to auxin. In animals that recovered CHE-1::GFP::AID after transient depletion, fluorescence levels returned to similar values as control animals, indicating that CHE-1::GFP::AID recovery was complete. (D) Representative images of OSM-3::GFP expression in che-1::GFP::AID animals after 132 hr or no auxin exposure. Asterisks indicate the amphid neurons on one side of the animal expressing OSM-3::GFP. Animals in which CHE-1::GFP::AID was depleted showed the same number of OSM-3::GFP expressing amphid neurons, indicating that CHE-1::GFP::AID depletion did not cause apoptosis of the ASE neurons. Scalebar: 10 μm.
Figure 1—figure supplement 2
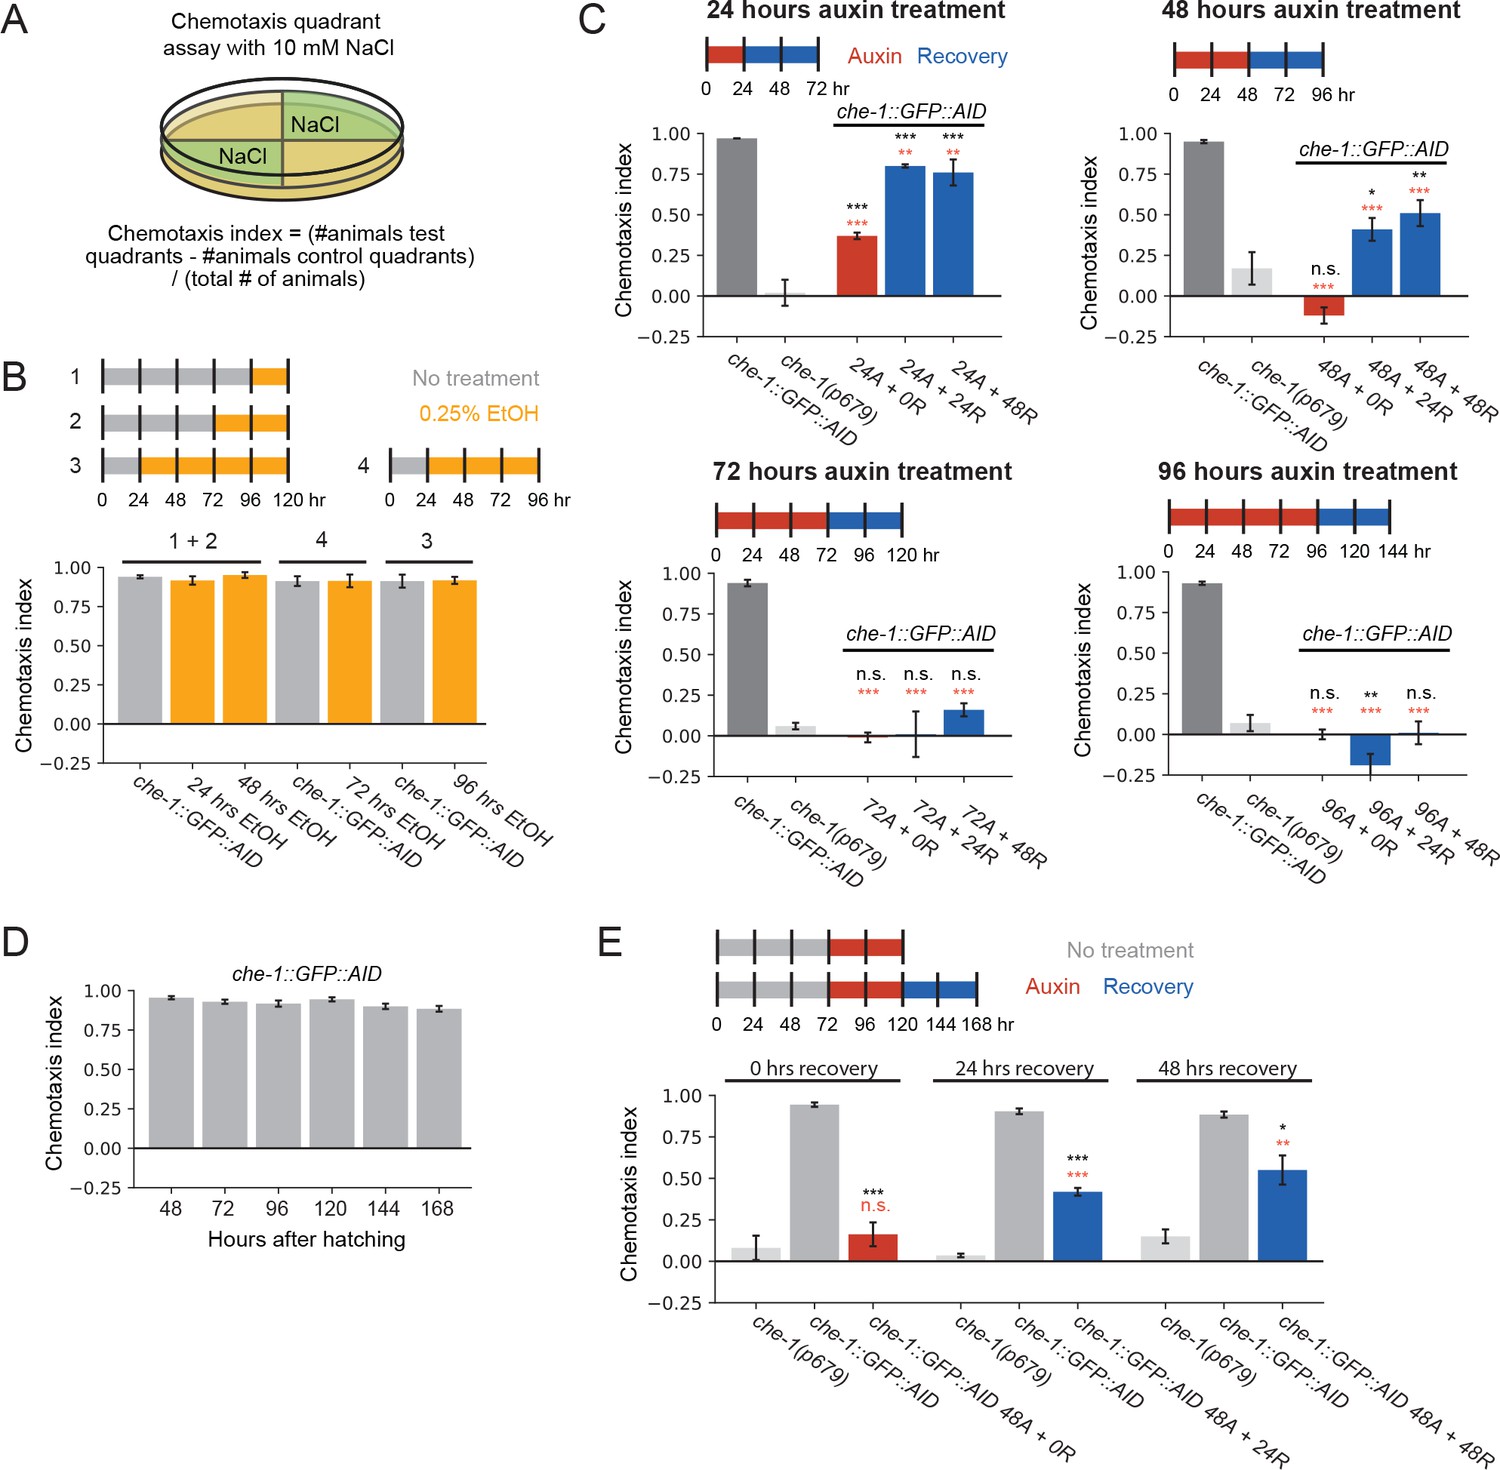
CHE-1 depletion and NaCl chemotaxis.
(A) Schematic of quadrant chemotaxis assay and chemotaxis index (CI) calculation for chemotaxis to NaCl. (B) Chemotaxis index of che-1::GFP::AID animals exposed to 0.25% EtOH for different durations. As auxin is dissolved in 100% EtOH, auxin treatments occurred at ~0.25% EtOH. These controls show that exposure to 0.25% EtOH does not impact NaCl chemotaxis. Schematics indicate timing and duration of exposure to EtOH. (C) Chemotaxis index of che-1::GFP::AID animals without auxin, che-1(p679) and che-1::GFP::AID animals exposed to auxin for 24–96 hr followed by a recovery period of 0, 24 or 48 hr. Auxin treatment was started in early L1 larvae. Schematics indicate the duration of auxin treatment. Control experiments followed the same protocol but were not exposed to auxin. (D) Chemotaxis index for response to 10 mM NaCl of che-1::GFP::AID animals without auxin, for different times after hatching. Quality of NaCl chemotaxis does not deteriorate with age at least until 168 hr after hatching. (E) Same as (C) but for animals that were 72 hr old at the start of auxin treatment. Older animals showed similar ability to recover from transient CHE-1::GFP::AID depletion as young animals. In (C) and (E), *p < 0.05, **p < 0.01, ***p < 0.001 compared to che-1(p679) mutants (black) or che-1::GFP::AID animals without auxin (red), while n.s. indicates not significant.
Figure 2 with 1 supplement
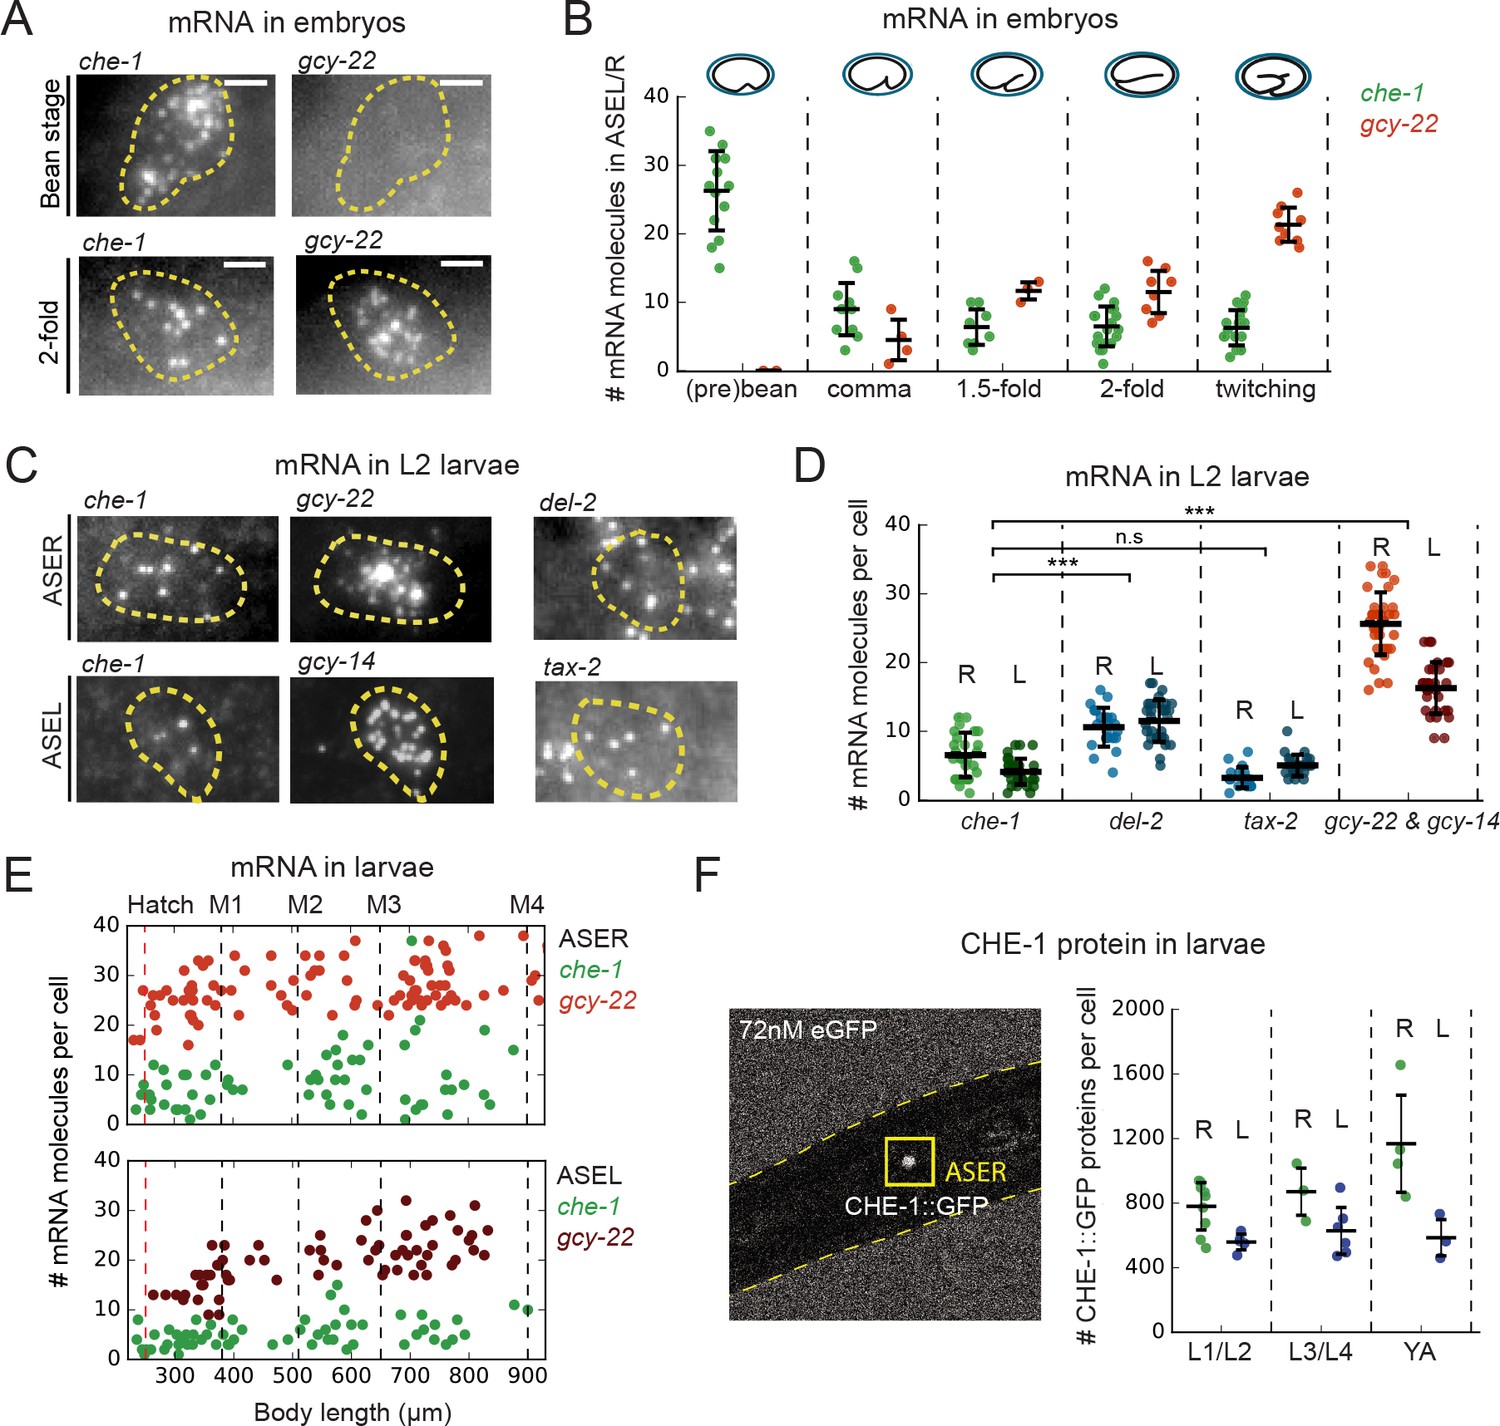
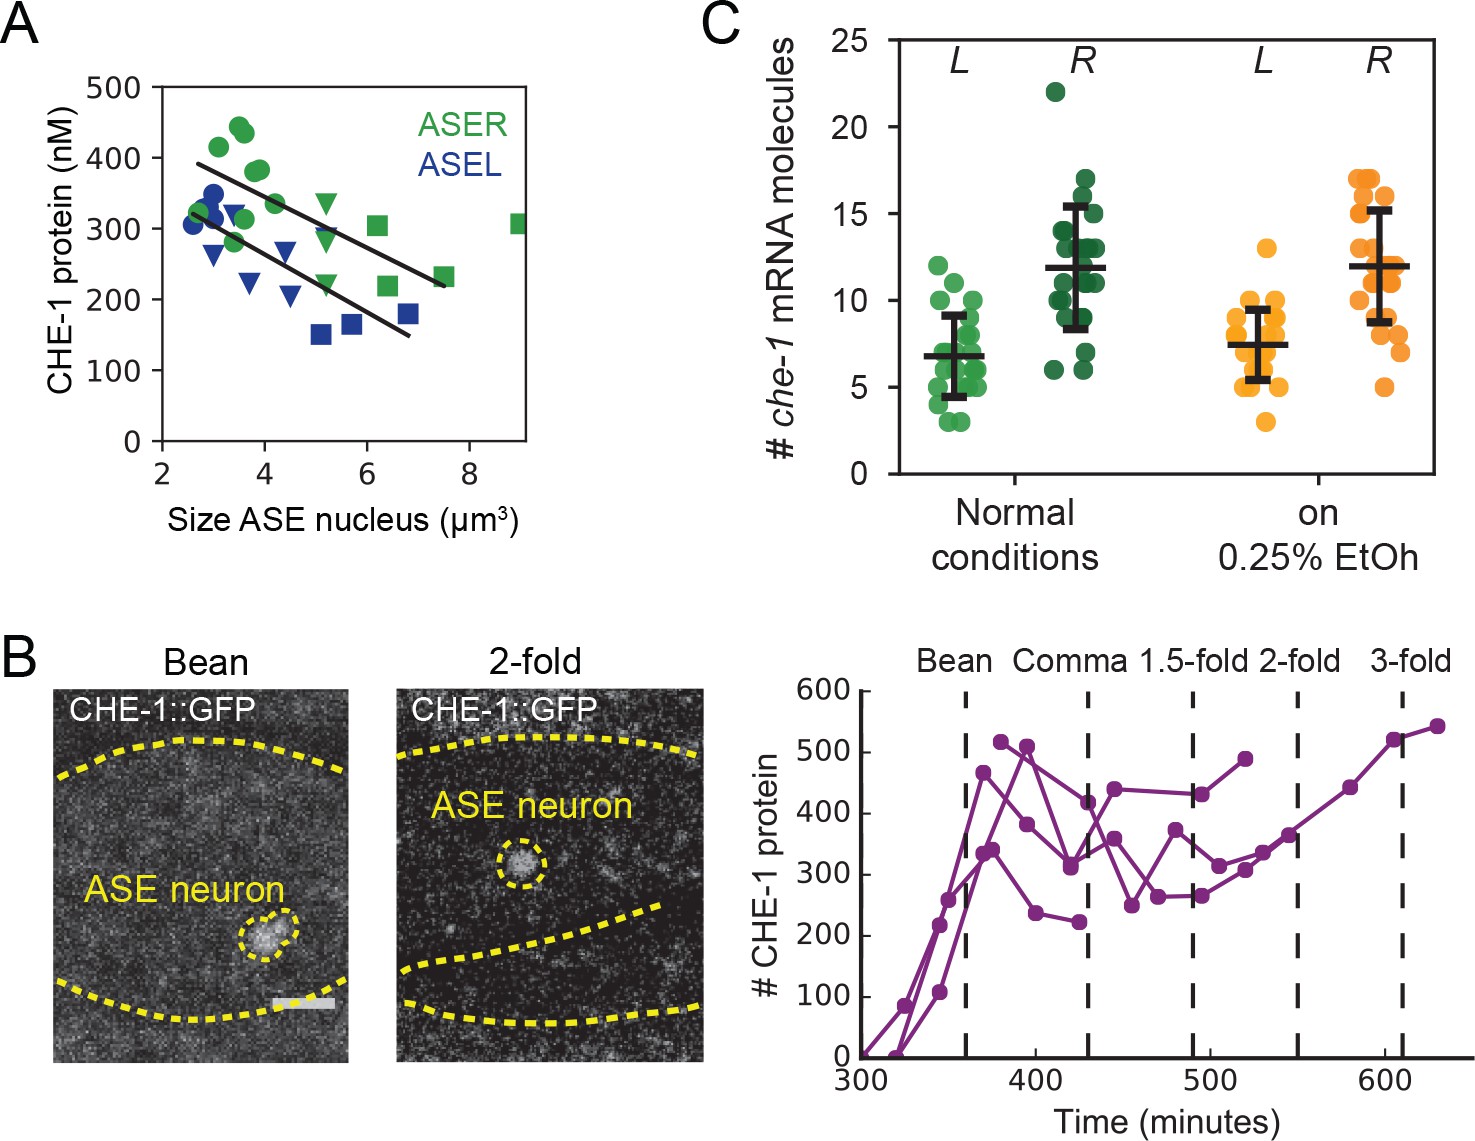
che-1 mRNA and protein copy numbers in ASE neurons.
(A) Expression of che-1 and the CHE-1 target gcy-22 in embryos at the bean (top) and 2-fold stage (bottom). Each spot is a single mRNA molecule visualized by single molecule FISH (smFISH). Dashed lines outline ASE neuron cell bodies. Scale bar: 2 μm. (B) che-1 (green) and gcy-22 (red) mRNA levels during embryonic development. che-1 expression peaks during specification, but falls as expression of CHE-1 target genes rise. (C) Expression of che-1 and CHE-1 targets gcy-22, gcy-14, tax-2 and del-2 visualized by smFISH in L2 larvae. Dashed lines outline left and right ASE neurons (ASEL/R). Scalebar: 2 μm. (D) Quantification of expression of che-1 and CHE-1 targets in ASEL (L) and ASER (R) in L2 larvae. che-1 mRNA levels are low compared to other CHE-1 target genes. (E) Low che-1 expression (green, ASER/L) compared to expression of CHE-1 targets gcy-22 (red, ASER) and gcy-14 (red, ASEL) throughout larval development. Body length corresponds to developmental time, with approximate timing of hatching and molts between larval stages L1-L4 indicated by vertical lines. (F) Left panel: two-photon microscopy image of L2 larva expressing endogenously-tagged CHE-1::GFP, immersed in 72 nM eGFP for calibration. Right panel: CHE-1::GFP protein molecules in ASER (green), (R) and ASEL (blue), (L) at different stages of post-embryonic development. The number of CHE-1 proteins is comparable to the predicted number of CHE-1-binding sites. Error bars in B, D, and F represent mean ± SD. ***p < 0.001.
-
Figure 2—source data 1
Data and scripts for Figure 2 and related figure supplements.
- https://cdn.elifesciences.org/articles/66955/elife-66955-fig2-data1-v2.zip
Figure 2—figure supplement 1
CHE-1 copy numbers in larvae and embryos.
(A) CHE-1::GFP protein concentration in ASER (green) and ASEL (blue) at different stages of post-embryonic development (L1/L2: circles, L3/L4: triangle, young adult: squares). CHE-1::GFP protein concentration decreases with the age of the animals. (B) Images of che-1::GFP embryos for quantification of CHE-1::GFP in ASE neurons with confocal microscopy (left). Number of CHE-1::GFP protein molecules over time in embryos, starting at the bean stage until twitching started (at 22 °C) (right). Embryos showed similar levels of CHE-1::GFP protein as the L1 larvae. (C) che-1::GFP::AID mRNA copy number under normal conditions (wild-type animals, no EtOH) and in presence of EtOH (che-1::GFP::AID animals without auxin but with 0.25% EtOH). As auxin is dissolved in 100% EtOH, auxin treatments occurred at ~0.25% EtOH. This control indicates that mRNA levels are not changed due to the presence of EtOH during auxin treatment. L/R indicates ASEL/R.
Figure 3
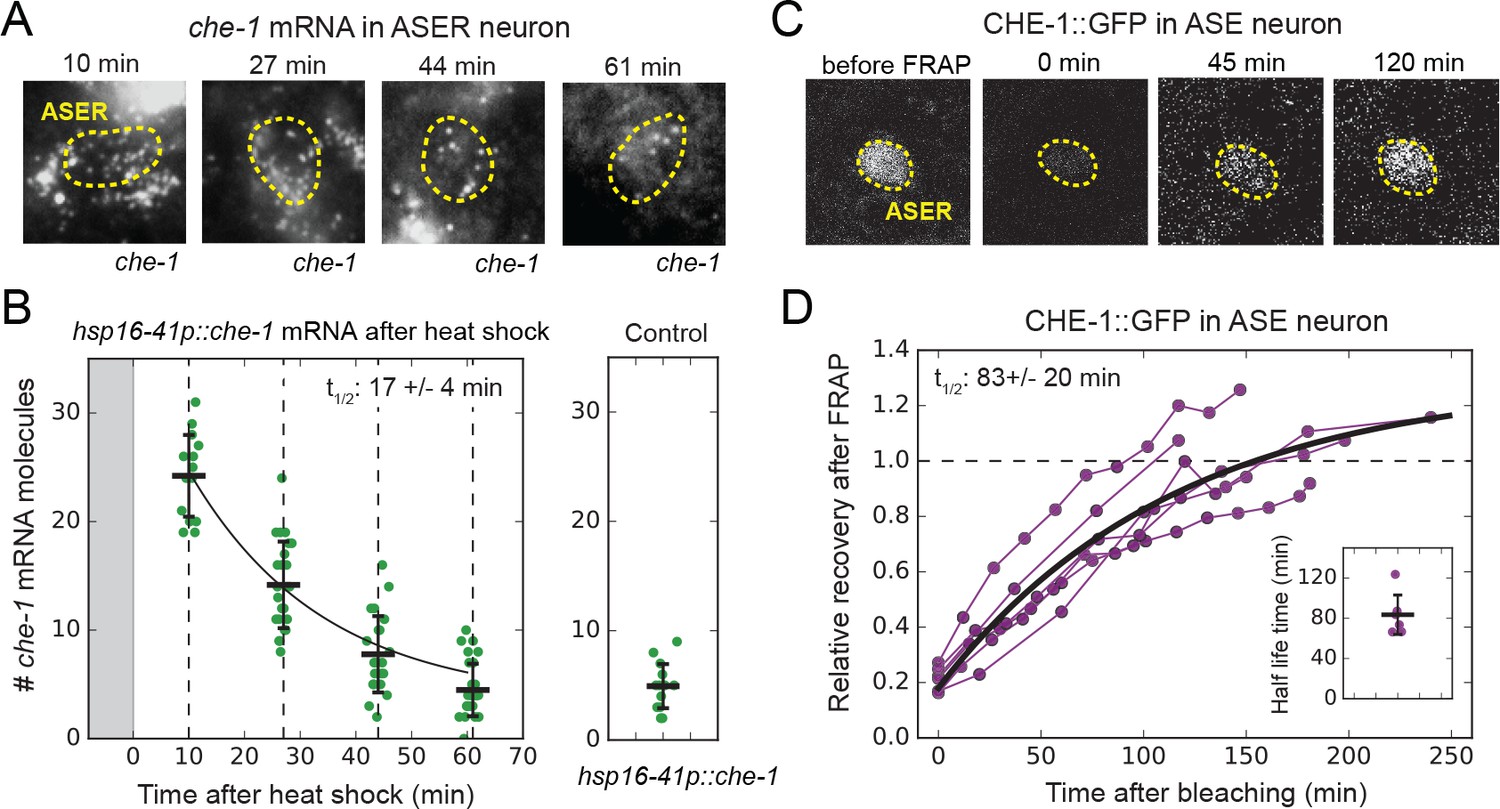
che-1 mRNA and protein lifetimes.
(A) che-1 mRNAs in L2 larvae at different times after induction of che-1 by a 37 °C heat shock in hsp16-41p::che-1 animals, visualized by smFISH. Dashed lines outline ASER neuron. (B) che-1 mRNA level in ASE neurons of individual L2 animals (green) as function of time after a 10 min heat shock (gray area). Black line is the fitted decay curve. Control L2 larvae did not receive a heat shock. The measured che-1 mRNA half-life was 17 ± 4 mins. (C) CHE-1::GFP fluorescence recovery after photobleaching (FRAP) in the ASER neuron of a single L4 animal. Time is indicated relative to bleaching of CHE-1::GFP. (D) Fluorescence recovery of CHE-1::GFP in ASE neurons of L4 or young adult animals (n = 6). An exponential recovery curve model was fitted to data of each individual animal (black line indicates the average recovery curve). The inset shows the fitted half-life for each individual animal. The average measured CHE-1::GFP protein half-life was 83 ± 20 min. Error bars in B represent mean ± SD. n ≥ 10 in B and n = 6 in D.
-
Figure 3—source data 1
Data and scripts for Figure 3 and related figure supplements.
- https://cdn.elifesciences.org/articles/66955/elife-66955-fig3-data1-v2.zip
Figure 4 with 1 supplement
Stable ON state by preferential binding of CHE-1 to its own promoter.
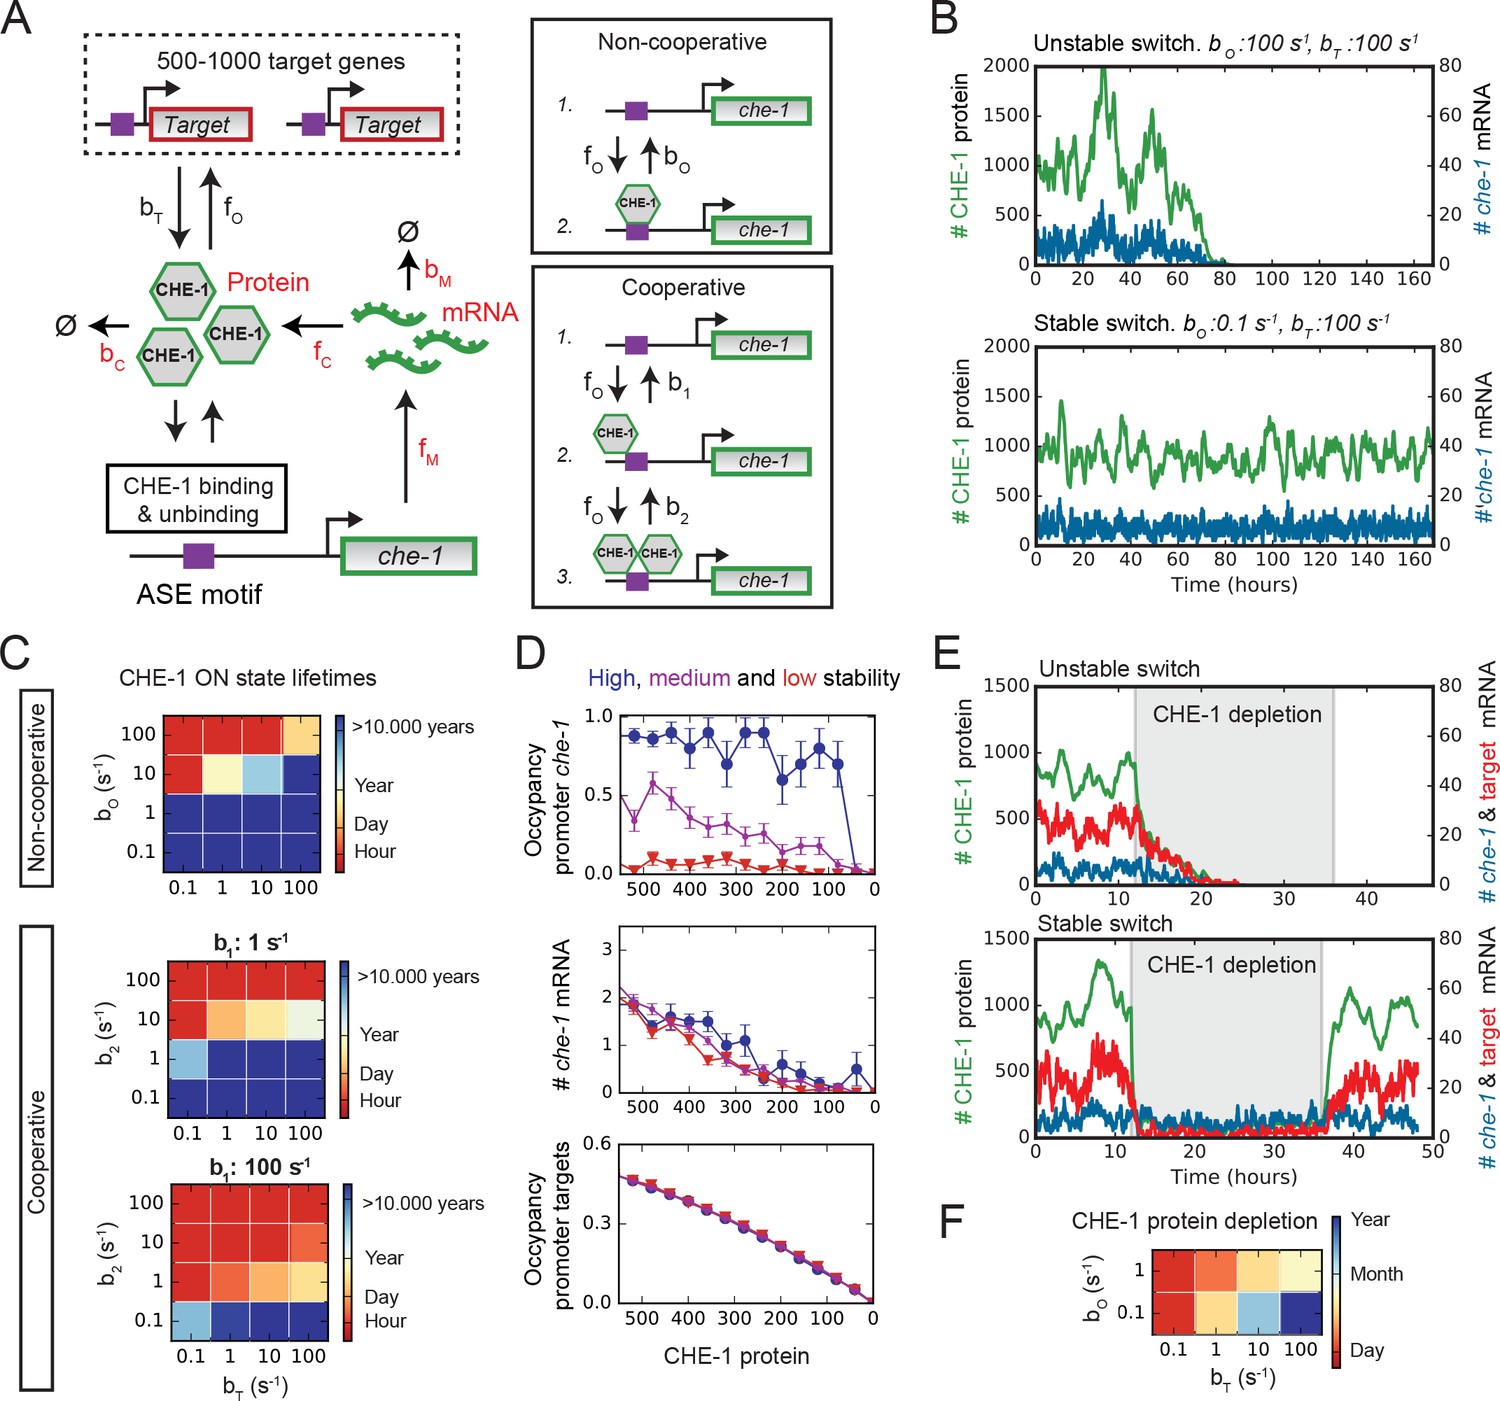
(A) Overview of the bistable, stochastic CHE-1 switch model, including production and degradation of che-1 mRNA and protein, and binding of CHE-1 protein to its own promoter and other target genes. Parameters constrained by experiments are red. Inset: CHE-1 binding is modelled as monomers (non-cooperative) or dimers (cooperative). (B) Stochastic simulations of the non-cooperative model for parameters with an unstable (top) or stable (bottom) ON state (che-1 expression), showing levels of che-1 mRNA (blue) and protein (green). For parameters resulting in an unstable switch, stochastic fluctuations induce a spontaneous transition to the OFF state (no che-1 expression). (C) Average ON state lifetimes calculated using Forward Flux Sampling (FFS) as function of CHE-1 dissociation rates from its own promoter ( or ) and its target genes () for the non-cooperative and cooperative model. Stable ON state occurs for high che-1 promoter occupancy by CHE-1 ( <1 or <1) and preferential affinity of CHE-1 for its own promoter compared to that of its target genes ( or ). (D) Average CHE-1 occupancy of the promoter of che-1 (top) and other target genes (bottom), and average che-1 mRNA level (middle) during spontaneous transitions from the ON to the OFF state, as sampled by FFS. Shown are transition paths for parameters with low (red, ), medium (magenta, ), and high (blue, ) stability of the ON state, with . For simulations with a stable ON state, the che-1 promoter remained fully occupied by CHE-1, even as CHE-1 protein levels approached zero, in contrast to the occupancy of promoters of other CHE-1 target genes. (E) Simulations showing the impact of transient depletion of CHE-1 protein (green) on mRNA levels of che-1 (blue) and a target gene (red). CHE-1 is depleted to 100 molecules/cell by a transient increase in degradation ( ; grey region). For parameters with an unstable ON state (top), both che-1 and target gene mRNA levels fall rapidly, and do not recover when CHE-1 depletion ceases. For a stable ON state (bottom), expression of che-1 is unaffected by CHE-1 depletion, leading to full recovery once CHE-1 depletion ends. (F) Average ON state lifetimes, calculated by FFS, during CHE-1 depletion to 100 molecules/cell. Parameter combinations with a stable ON state under normal conditions maintain che-1 expression for hours or days under induced CHE-1 depletion.
-
Figure 4—source data 1
Data and scripts for Figure 4 and related figure supplements.
- https://cdn.elifesciences.org/articles/66955/elife-66955-fig4-data1-v2.zip
Figure 4—figure supplement 1
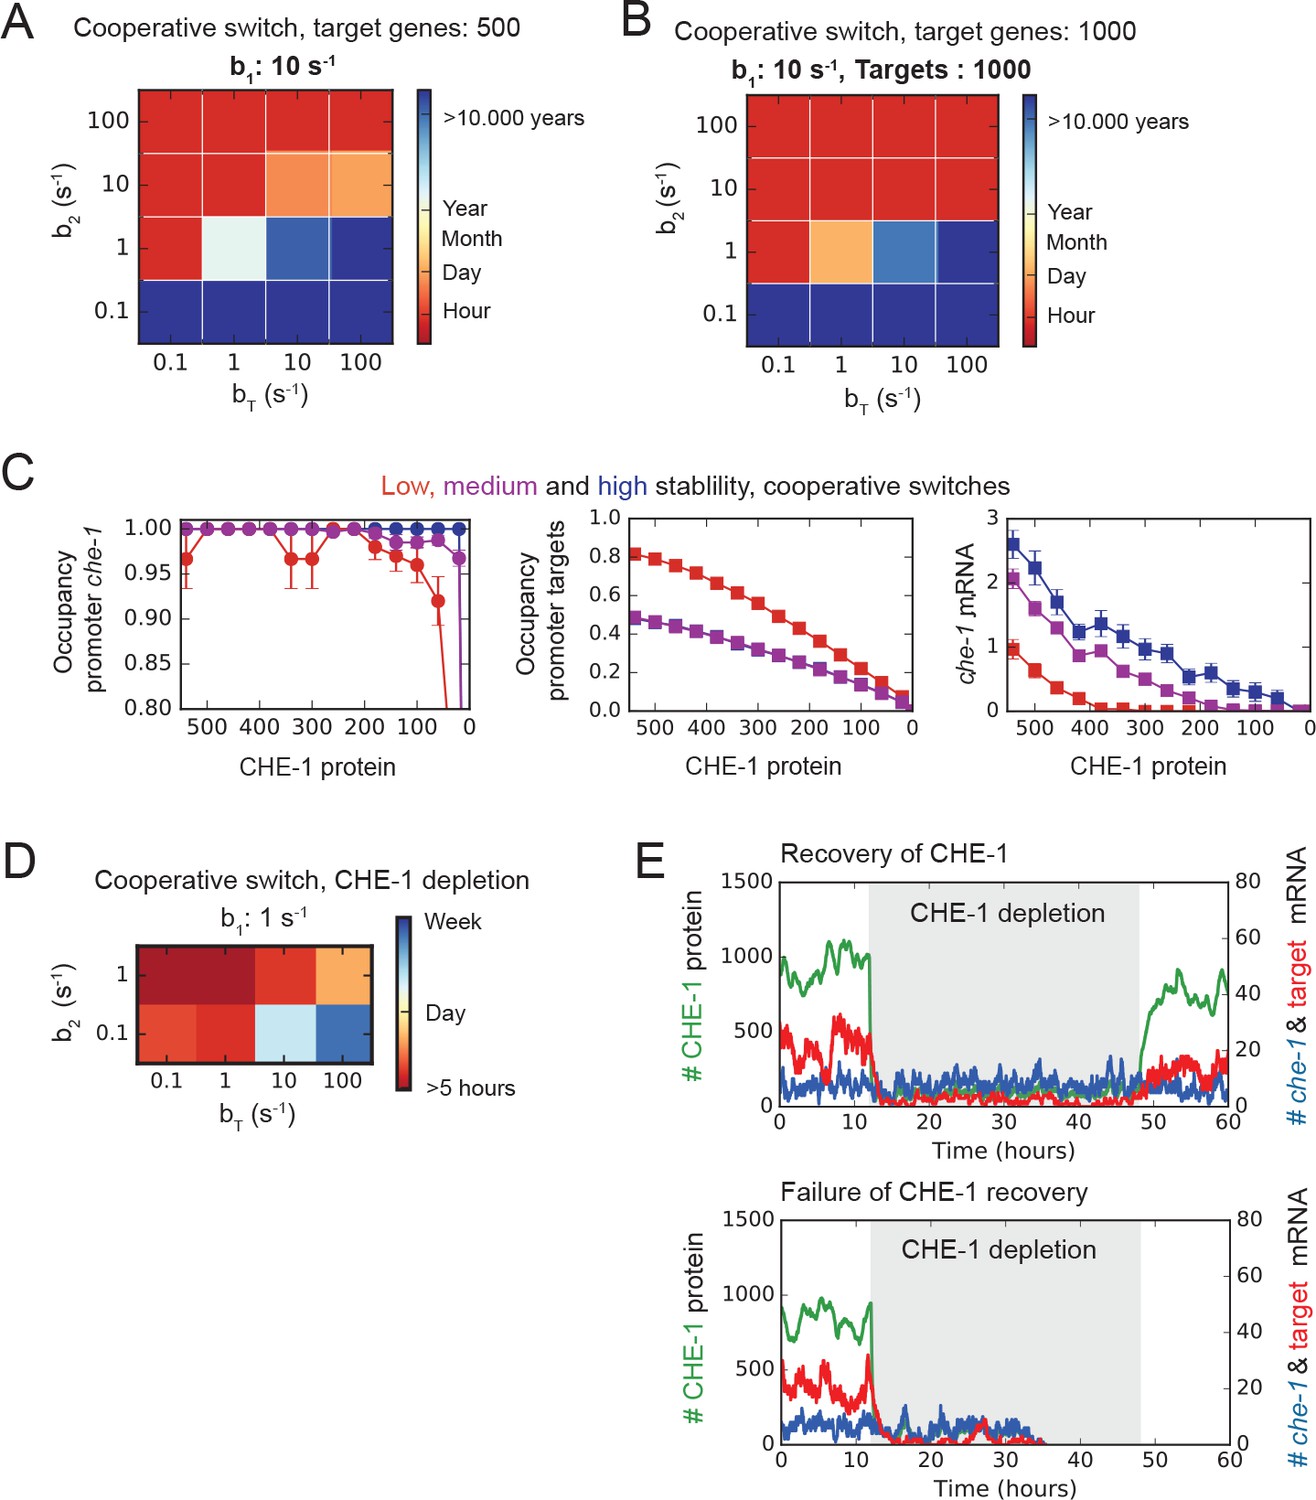
Dependence of ON state stability on number of targets and cooperativity.
(A,B) Average ON state lifetimes calculated using Forward Flux Sampling (FFS) as function of the dissociation rates of CHE-1 from its own promoter and target genes promoters, for the cooperative model with 500 (A) or 1000 (B) CHE-1 targets. ON state lifetimes are lower for 1000 targets, but long lifetimes of many years are still found. s–1 and varied between 0.1–100 s–1. (C) Average CHE-1 occupancy of the promoter of che-1 (left) and other target genes (middle), and average che-1 mRNA level (right) during spontaneous transitions from the ON to the OFF state, as sampled by FFS, for the cooperative model. Shown are transition paths for parameters with low (red, ), medium (magenta, ), and high (blue, ) stability of the ON state, with . (D) Average ON state lifetimes calculated using Forward Flux Sampling (FFS) of the cooperative model during depletion of CHE-1 protein, as function of the dissociation rates of CHE-1 from its own promoter and its target genes , where = 10 s–1. (E) Examples highlighting that upon transient CHE-1 depletion (gray) some simulations recover CHE-1 levels (upper panel), while others lose CHE-1 permanently (lower panel). Parameter simulations and strength of CHE-1 depletion conditions are the same as in Figure 4E in the main text, but duration of depletion is increased here from 24 to 48 hr.
Figure 5
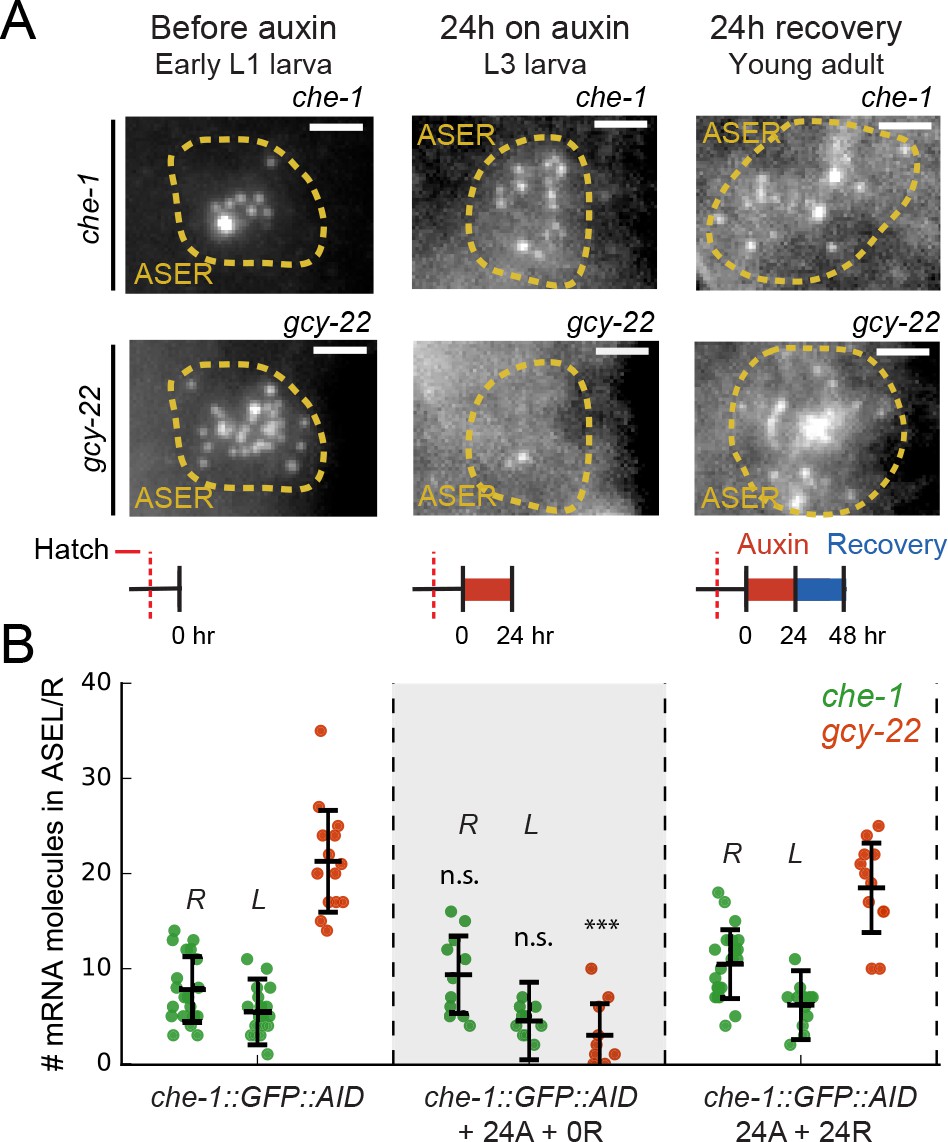
Maintenance of che-1 expression during transient CHE-1 depletion.
(A) che-1 and gcy-22 mRNA levels in ASER neurons, visualized by smFISH in che-1::GFP::AID animals, at different moments in a 24 hr auxin and 24 hr recovery treatment. Schematics indicate the time and duration of auxin treatment and recovery. Scale bar: 2 μm. (B) che-1::GFP::AID (green, ASEL/R) and gcy-22 (red, ASER) mRNA levels quantified in che-1::GFP::AID animals at different times in a 24 hr auxin and 24 hr recovery treatment. Upon depletion of CHE-1::GFP::AID protein, che-1 expression was not impacted, while gcy-22 levels strongly decreased. gcy-22 expression rose to wild-type levels after 24 hr recovery off auxin. Error bars in B represent mean ± SD. n ≥ 10. ***p < 0.001.
-
Figure 5—source data 1
Data and scripts for Figure 5 and related figure supplements.
- https://cdn.elifesciences.org/articles/66955/elife-66955-fig5-data1-v2.zip
Figure 6 with 1 supplement
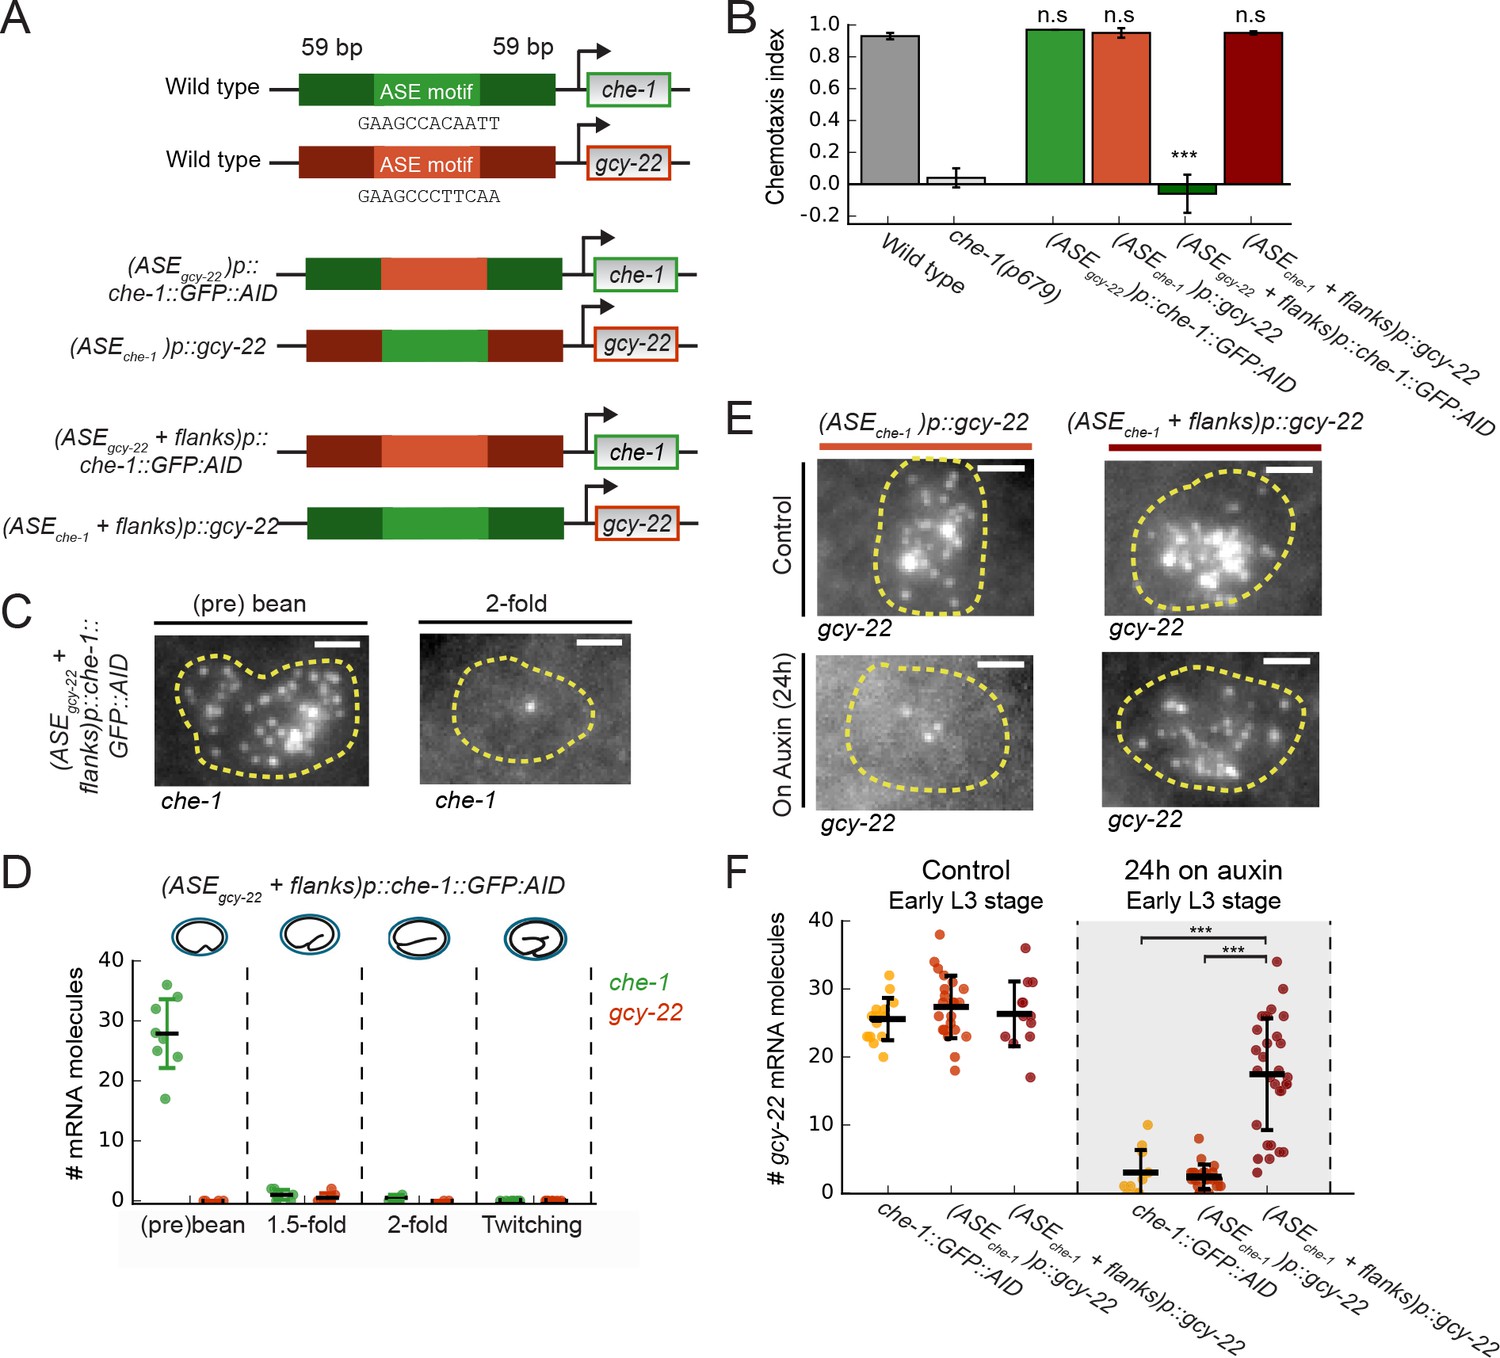
Region flanking CHE-1-binding site ensures resilience to CHE-1 depletion.
(A) Overview of che-1 promoter mutants generated in the che-1::GFP:AID background. We exchanged either the che-1 (green) or gcy-22 (red) ASE motif, which binds CHE-1, or a larger region that includes 59 bp flanks on either side. (B) Average chemotaxis index for response to 10 mM NaCl, of wild-type and che-1(p679) animals, and che-1 promoter mutants. Exchange of ASE motifs between che-1 and gcy-22 promoters did not affect chemotaxis. Replacing the che-1 ASE motif with flanks for that of gcy-22 abolished chemotaxis to NaCl; the reverse had no effect. (C) che-1 expression visualized by smFISH in ASE neurons of (ASEgcy-22+ flanks)p::che-1::GFP::AID embryos. In twofold embryos, che-1::GFP::AID mRNA levels were low. Scale bar: 1.5 μm. (D) che-1::GFP::AID and gcy-22 mRNA levels quantified in the ASE neurons of (ASEgcy-22+ flanks)p::che-1::GFP::AID embryos. After initial high che-1::GFP::AID expression at the time of ASE specification, che-1::GFP::AID and gcy-22 expression was almost absent, indicating a failure of ASE fate maintenance. (E) gcy-22 expression under normal conditions or upon CHE-1::GFP::AID depletion by auxin, in L3 larvae of che-1 promoter mutants. Scale bar: 1.5 μm. (F) Quantification of gcy-22 mRNA levels upon auxin-induced CHE-1::GFP::AID depletion, in gcy-22 promoter mutants. In (ASEgcy-22)p::che-1::GFP::AID animals, gcy-22 mRNA levels fell on auxin, as observed before. However, in (ASEche-1+ flanks)p::gcy-22 animals treated with auxin gcy-22 levels remained high. Thus, the region flanking the che-1 ASE motif drives the maintenance of che-1 expression during CHE-1 protein depletion. Error bars in B represent mean ± S.E.M, D and F represent mean ± SD. n ≥ 10. ***p < 0.001.
-
Figure 6—source data 1
Data and scripts for Figure 6 and related figure supplements.
- https://cdn.elifesciences.org/articles/66955/elife-66955-fig6-data1-v2.zip
Figure 6—figure supplement 1
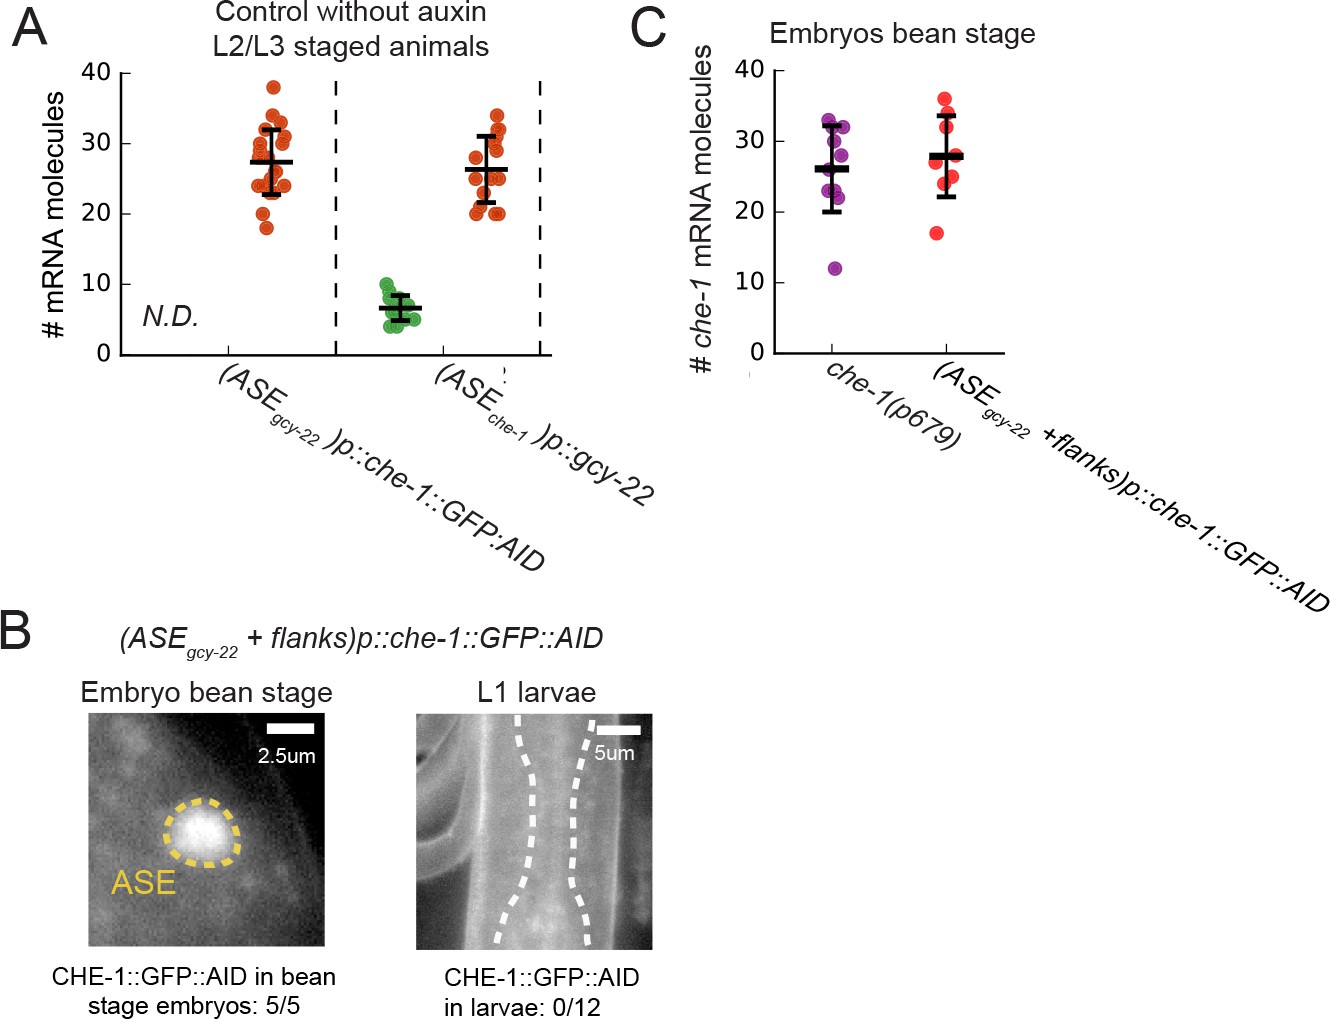
Controls for promoter region mutants.
(A) Quantification of gcy-22 (red) and che-1::GFP::AID (green) mRNA levels in (ASEgcy-22)p::che-1::GFP::AID and (ASEche-1)p::gcy-22 L2/L3 animals without auxin revealed wild type mRNA levels for both genes. (B) CHE-1::GFP::AID expression in (ASEgcy-22+ flanks)p::che-1::GFP::AID bean stage embryos and L1 larvae. Embryos showed CHE-1::GFP::AID expression (5/5 animals), whereas L1 larvae no longer expressed CHE-1::GFP::AID (0/12 animals). (C) (ASEgcy-22+ flanks)p::che-1::AID embryos showed similar levels of che-1::GFP::AID mRNA during the bean stage as the che-1(p679) mutant.
Figure 7 with 2 supplements
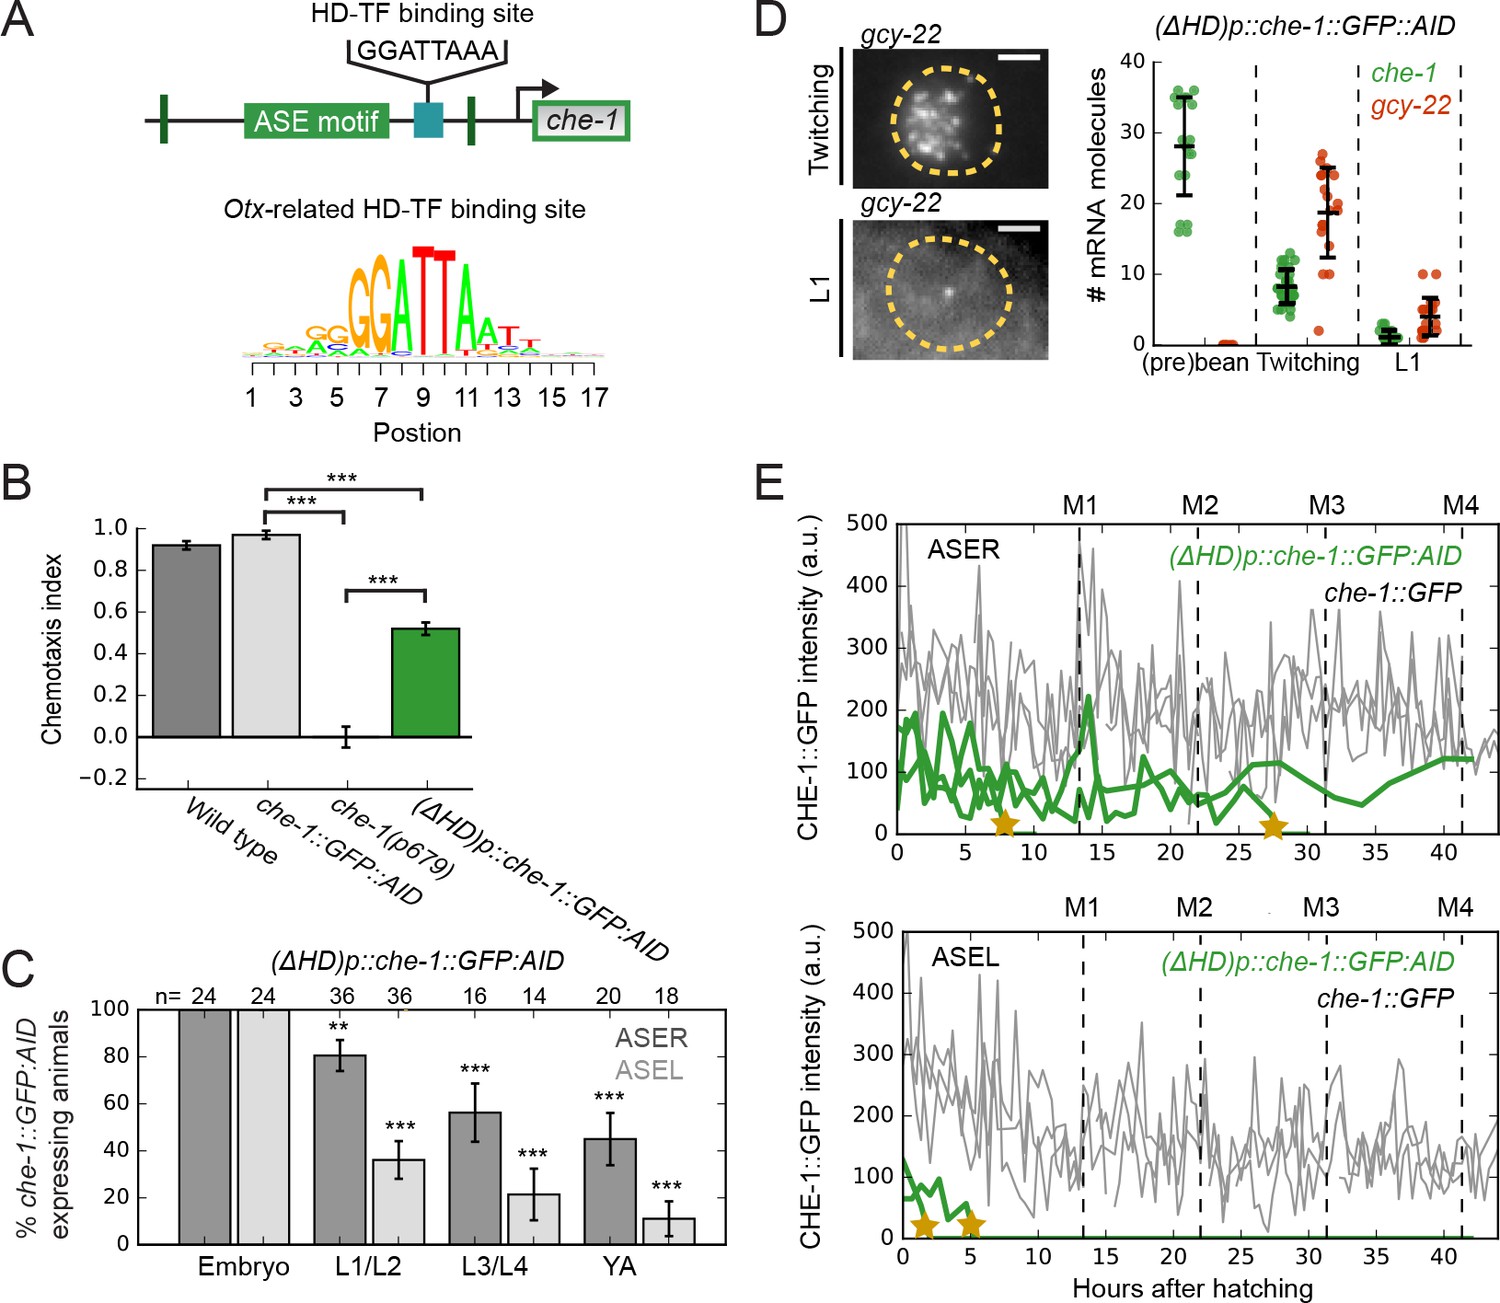
An Otx-related homeodomain transcription factor binding site involved in long-term maintenance of ASE cell fate.
(A) Position of an Otx-related homeodomain transcription factor (HD-TF) binding site in the che-1 promoter. Green lines indicate the positions of the 59 bp flanks surrounding the ASE motif. HD-TF binding site depicted as a sequence logo. In (ΔHD)p::che-1::GFP::AID animals, the HD-TF-binding site is deleted in the che-1::GFP::AID background. (B) Average chemotaxis index for response to 10 mM NaCl, of wild-type, che-1::GFP::AID and che-1(p679) animals, and (ΔHD)p::che-1::GFP::AID mutant. Deleting the HD-TF-binding site caused a decreased response to NaCl. (C) Fraction of (ΔHD)p::che-1::GFP::AID animals expressing CHE-1::GFP::AID in ASER (dark gray) and ASEL (light gray) at different developmental stages. CHE-1::GFP::AID is progressively lost during development. (D) che-1::GFP::AID and gcy-22 mRNA levels in (ΔHD)p::che-1::GFP::AID animals quantified by smFISH. Expression was similar to wild-type until late-stage, twitching embryos, but fell rapidly in newly-hatched L1 larvae. Scale bar: 2 μm. (E) CHE-1::GFP expression dynamics in single che-1::GFP (grey) and (ΔHD)p::che-1::GFP::AID (green) animals during larval development. Approximate timing of molts is indicated M1-M4. CHE-1::GFP::AID expression in (ΔHD)p::che-1::GFP::AID animals was lost in a rapid and stochastic manner, at different times during development. Error bars represent S.E.M (B,D) or S.D. (C). n ≥ 10. **p < 0.01, ***p < 0.001.
-
Figure 7—source data 1
Data and scripts for Figure 7 and related figure supplements.
- https://cdn.elifesciences.org/articles/66955/elife-66955-fig7-data1-v2.zip
Figure 7—figure supplement 1
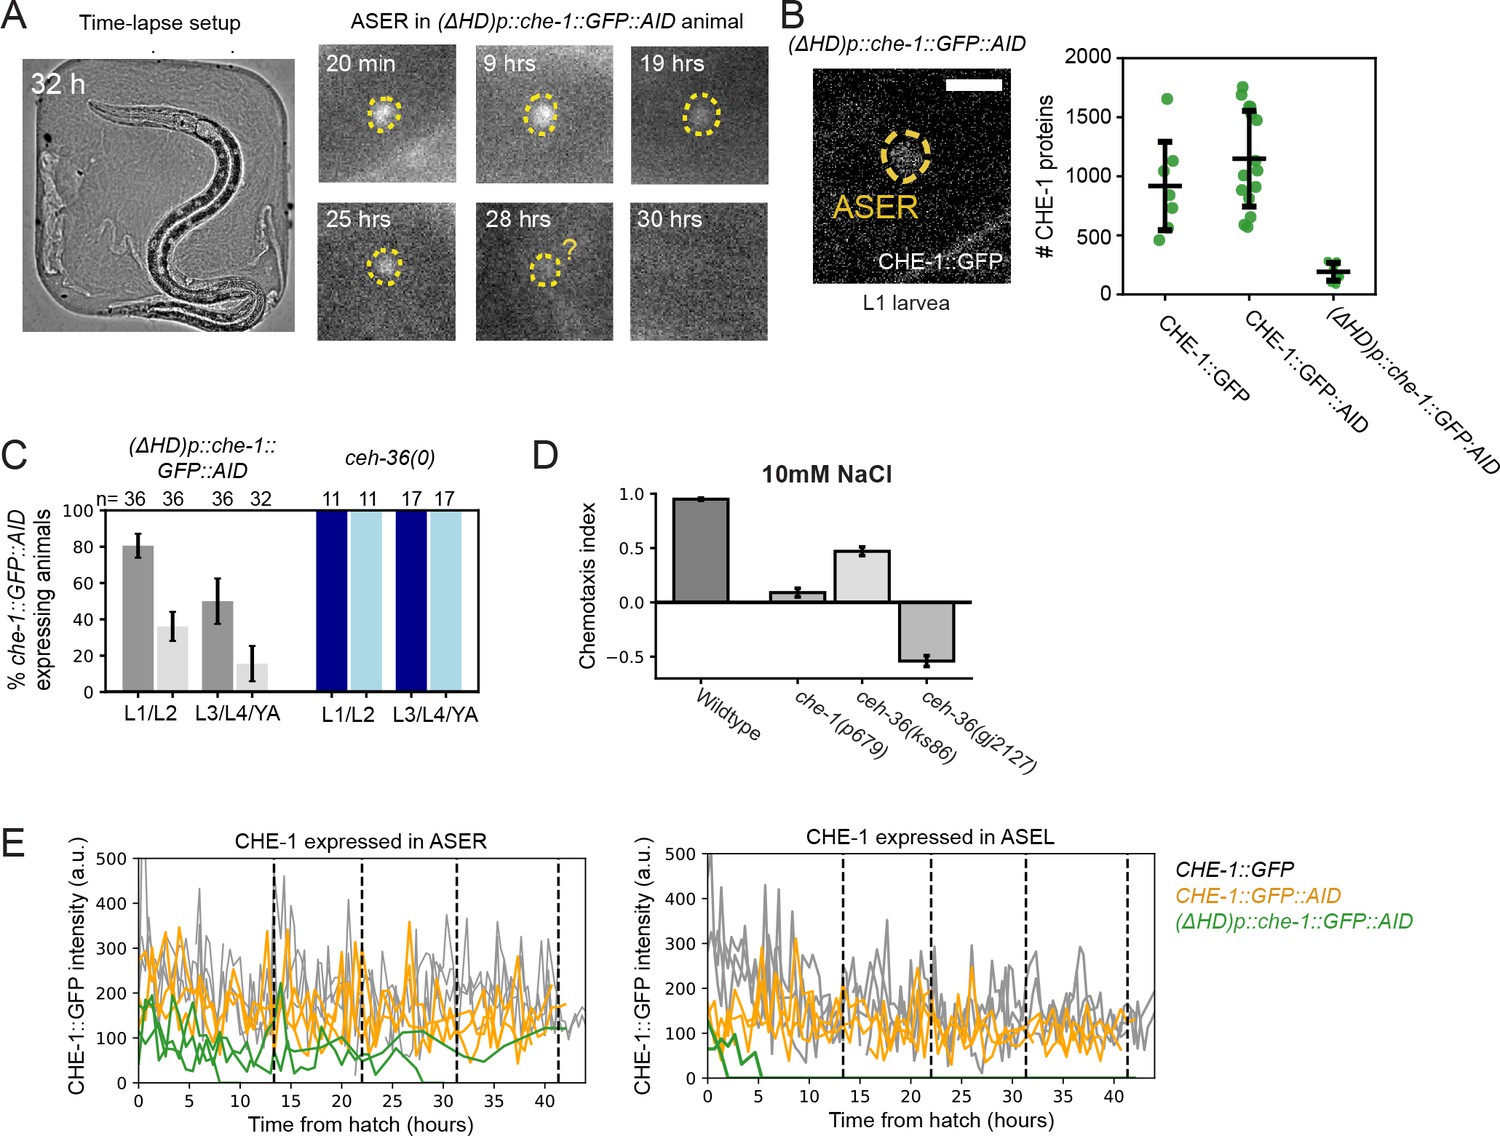
Role of HD-TF-binding site in maintaining CHE-1::GFP expression.
(A) Long-term time-lapse microscopy of a single (ΔHD)p::che-1::GFP::AID animal, using microchambers to constrain larvae to the field of view (left). CHE-1::GFP::AID signal in ASER disappeared rapidly in the L3 larval stage, 30 hr after hatching (right). (B) Image of CHE-1::GFP::AID in (ΔHD)p::che-1::GFP::AID L1 larva (left). Comparison of protein copy number in che-1::GFP, che-1::GFP::AID, and (ΔHD)p::che-1::GFP::AID animals (right). While for che-1::GFP and che-1::GFP::AID data was collected in L4-YA animals, data for (ΔHD)p::che-1::GFP::AID was collected in L1-L2 larvae, as older animals often failed to show CHE-1::GFP::AID signal. (C) Fraction of (ΔHD)p::che-1::GFP::AID animals expressing CHE-1::GFP::AID in ASER (dark gray) and ASEL (light gray) versus fraction of ceh-36(gj2127) deletion mutant animals expressing CHE-1::GFP::AID in ASER (dark blue) and ASEL (light blue). (D) Chemotaxis index for response to 10 mM NaCl, of wild-type, che-1(p679), ceh-36(ks86) and ceh-36(gj2127) animals. (E) Expression dynamics in single che-1::GFP (gray), che-1::GFP::AID (orange) and (ΔHD)p::che-1::GFP::AID (green) animals during larval development.
Figure 7—figure supplement 2
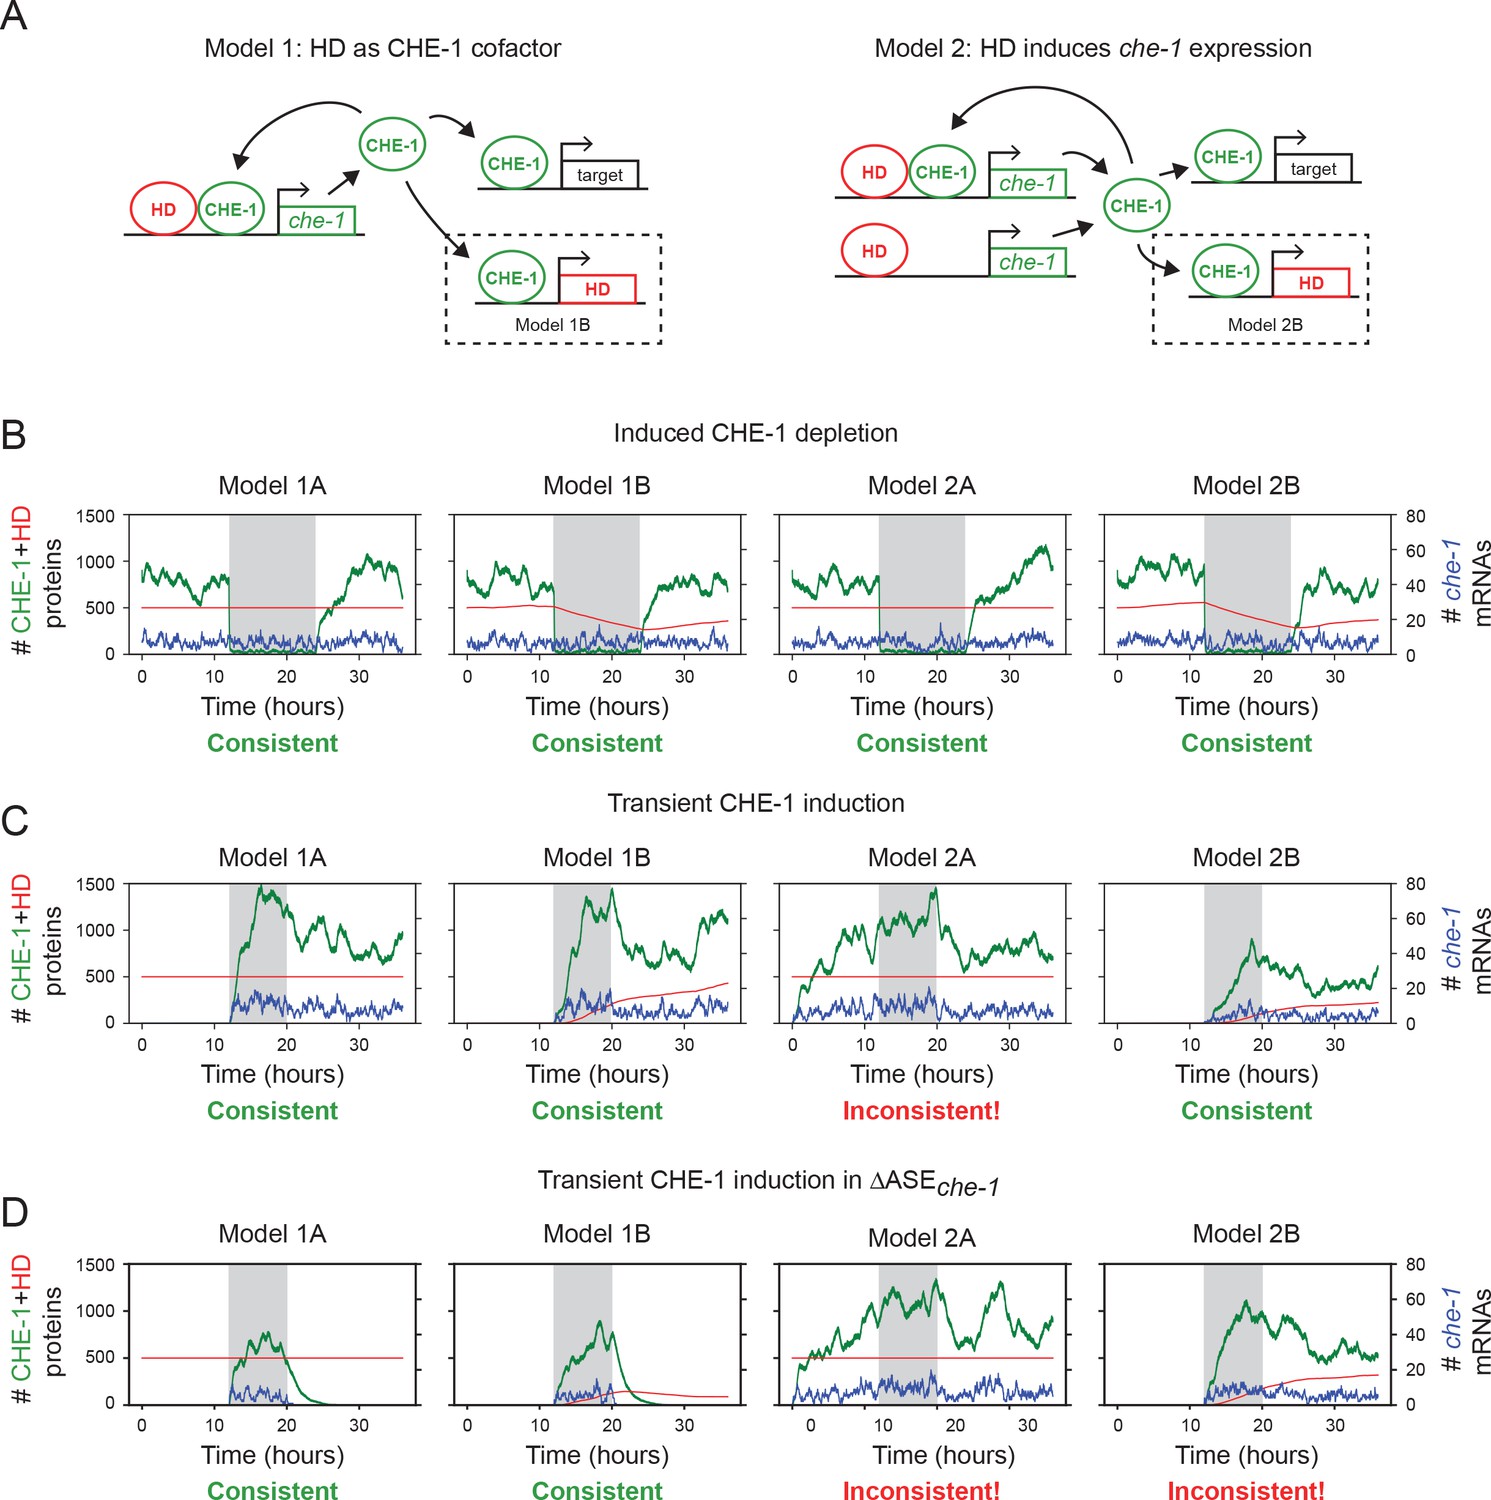
Models of HD-TF action.
(A) Two qualitatively different models for Homeodomain transcription factor (HD-TF) action. Model 1: HD-TF acts as a co-factor that only impacts the affinity of CHE-1 for the che-1 promoter. Specifically, interaction between HD-TF and CHE-1 is cooperative, with the unbinding rate of both HD-TF and CHE-1 lowered from 100 s–1 to 0.1 s–1 when both are bound together. Transcription of che-1 is only initiated when CHE-1 is bound. Model 2: HD-TF induces che-1 expression independent of CHE-1. Both HD-TF and CHE-1 bind independently, with unbinding rate of 100 s–1, and che-1 transcription is initiated when CHE-1 and/or HD-TF is bound. For both models, we compared two variants: one where HD-TF expression is constitutive (Models 1 A, 2 A) and one where HD-TF expression is controlled by CHE-1 binding (Models 1B, 2B). All four models exhibit bistability in their mass action rate equations. For full parameters, see Materials and methods. (B) Time dynamics of CHE-1 (green) and HD-TF protein level (red), and che-1 mRNA (blue). All models can reproduce the observed resilience of che-1 expression under induced CHE-1 depletion (gray interval). For models 1B and 2B, where HD-TF is a target of CHE-1, this required that the half-life of HD-TF is long compared to the interval of induced CHE-1 depletion. (C) Models 1 A, 1B, and 2B reproduce the persistent che-1 expression induced by a transient inductive signal. Transient CHE-1 induction was modelled by basal che-1 expression, that is independent of CHE-1 level, at rate during the interval indicated in grey. For Model 2 A, constitutive expression of HD-TF induced che-1 expression already prior to the presence of the inductive signal. (D) Models 1 A and 1B reproduced the failure to maintain che-1 expression following a transient external inductive signal (gray interval) in mutants of the ASE motif of the che-1 promoter, as was observed experimentally (Leyva-Díaz and Hobert, 2019). In these experiments, mutations of the ASE motif were predicted to abolish binding of CHE-1 to its own promoter and were therefore modelled by setting the CHE-1 binding rate for its own promoter to zero. For Models 2 A and 2B, transient induction of CHE-1 led to expression of HD-TF, which subsequently maintained expression of both HD-TF and CHE-1, contrary to the experimental observations.
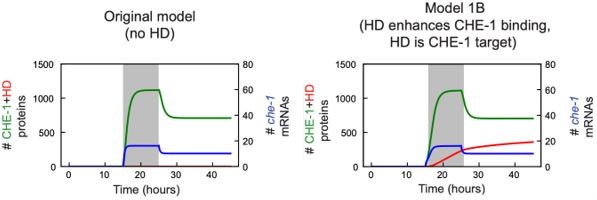
Author response image 1
Additional files
-
Source code 1
Source code for Gillespie simulations underlying Figure 4, Figure 4—figure supplement 1, Figure 7—figure supplement 2.
- https://cdn.elifesciences.org/articles/66955/elife-66955-supp1-v2.zip
-
Supplementary file 1
Table showing recovery of CHE-1::GFP fluorescence and chemotaxis response on 10 mM NaCl in che-1::GFP::AID animals after auxin treatment.
- https://cdn.elifesciences.org/articles/66955/elife-66955-supp2-v2.xlsx
-
Supplementary file 2
CHE1 ASER/L: Genes containing CHE-1 binding sites (ASE motif) in genes expressed in the ASEL or ASER neuron.
Genes expressed genes in ASER/L neurons were recovered based on single cell data from Cao et al., 2017. Each gene was tested on the presence of an ASE motif in the promoter (1000 bp upstream from the start site), with a binding site score of at least 98%. (OTX ASER/L) Genes containing homeodomain (HD) binding sites (OTX2 motif) in the same set of genes expressed in ASER/L neurons, with the same 98% cut-off for the binding site score. (OTX close to ASER/L) Genes that have an HD binding sites in close proximity (100 bp up- and/or down-stream) of any of the recovered CHE-1 binding sites.
- https://cdn.elifesciences.org/articles/66955/elife-66955-supp3-v2.xlsx
-
Supplementary file 3
Overview of single molecule FISH (smFISH) probes used for che-1 and CHE-1 targets gcy-22, tax-2 and del-2.
- https://cdn.elifesciences.org/articles/66955/elife-66955-supp4-v2.xlsx
-
Supplementary file 4
Overview of ssODNs and guides used in this research.
- https://cdn.elifesciences.org/articles/66955/elife-66955-supp5-v2.docx
-
Transparent reporting form
- https://cdn.elifesciences.org/articles/66955/elife-66955-transrepform1-v2.docx
Download links
A two-part list of links to download the article, or parts of the article, in various formats.
Downloads (link to download the article as PDF)
Open citations (links to open the citations from this article in various online reference manager services)
Cite this article (links to download the citations from this article in formats compatible with various reference manager tools)
Mechanism of life-long maintenance of neuron identity despite molecular fluctuations
eLife 10:e66955.
https://doi.org/10.7554/eLife.66955


