Two NLR immune receptors acquired high-affinity binding to a fungal effector through convergent evolution of their integrated domain
- The Sainsbury Laboratory, University of East Anglia, Norwich Research Park, United Kingdom
- Department of Biological Chemistry, John Innes Centre, Norwich Research Park, United Kingdom
- Division of Genomics and Breeding, Iwate Biotechnology Research Centre, Japan
- Laboratory of Crop Evolution, Graduate School of Agriculture, Kyoto University, Japan
Figures
Figure 1 with 6 supplements
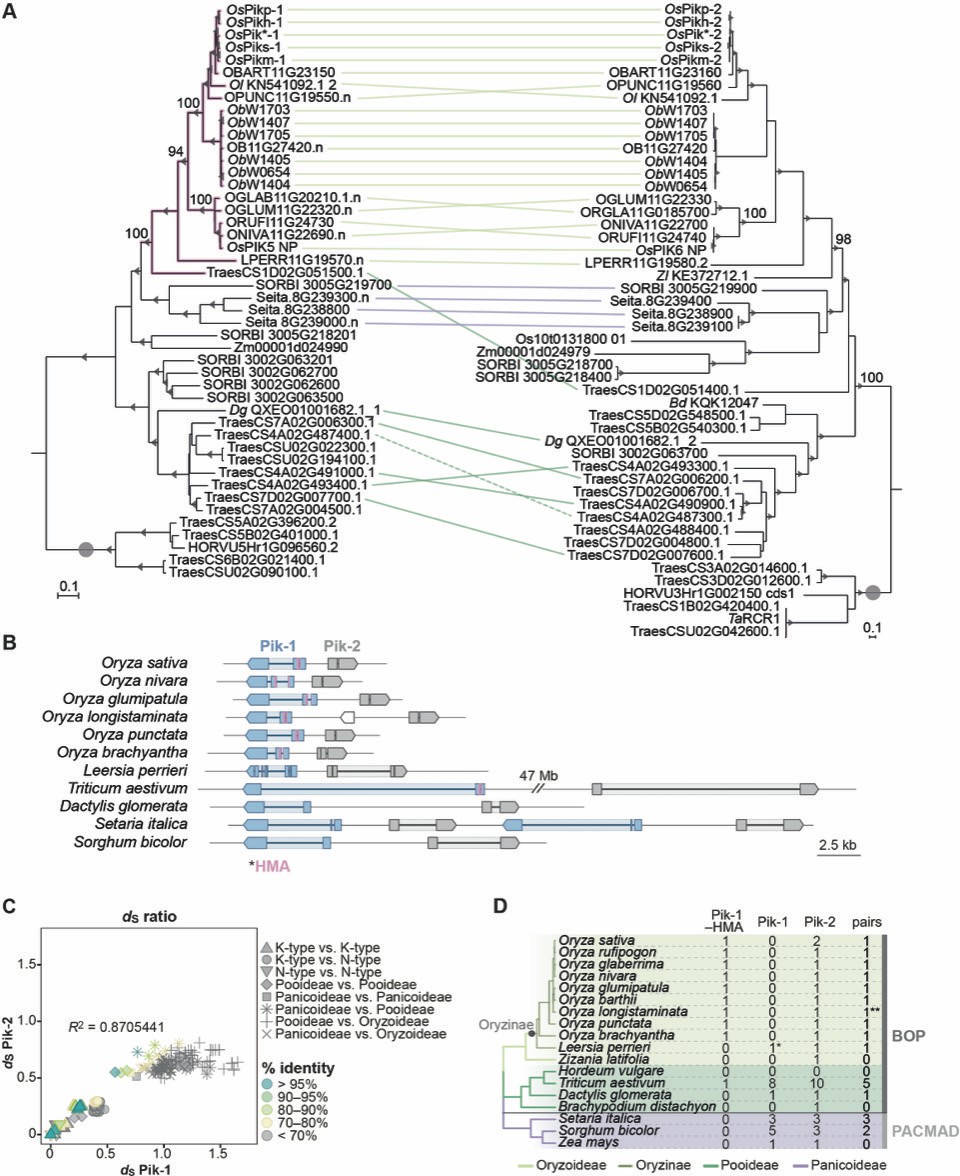
The Pik-1/Pik-2 orthologues are distributed across diverse species of grasses.
(A) The maximum likelihood (ML) phylogenetic trees of Pik-1 (left) and Pik-2 (right) orthologues. The trees were calculated from 927- and 1239-nucleotide-long codon-based alignments of the NB-ARC domain, respectively, using RAxML v8.2.11 (Stamatakis, 2014), 1000 bootstrap method (Felsenstein, 1985), and GTRGAMMA substitution model (Tavaré, 1986). Best ML trees were manually rooted using the selected clades (marked with grey circles) as outgroups. The bootstrap values above 70% are indicated with grey triangles at the base of respective clades; the support values for the relevant nodes are depicted with numbers. The scale bars indicate the evolutionary distance based on nucleotide substitution rate. The Pik-1 integration clade is shown in pink. Genetically linked genes are linked with lines, with colours indicating plant subfamily: Oryzoideae (purple), Pooideae (dark green), or Panicoideae (light green); the continuous lines represent linkage in a head-to-head orientation, the dashed line indicates linkage in a tail-to-tail orientation. The interactive trees are publicly available at: https://itol.embl.de/tree/14915519290329341598279392 and https://itol.embl.de/tree/14915519290161451596745134. (B) Schematic illustration of the Pik locus in selected species. The schematic gene models of Pik-1 (blue) and Pik-2 (grey) are shown. The integrated heavy metal-associated (HMA) domain is marked with pink. The coordinates of the regions presented in this figure are summarised in Supplementary file 1E. (C) Comparisons of pairwise dS rates calculated for the Pik-1 and Pik-2 receptors. The rates were calculated using Yang and Nielsen, 2000 based on 972- and 1269-nucleotide-long codon-based alignments of the NB-ARC domains of Pik-1 and Pik-2, respectively; only positions that showed over 70% coverage across the alignment were used for the analysis. The comparisons were categorised to reflect species divergence (shapes) and colour-coded to illustrate percentage identity of dS values (% identity). The coefficient of determination (R2) was calculated for each dataset using R v3.6.3 package. (D) Summary of identified Pik-1 and Pik-2 homologues in plant species included in this study. The phylogenetic tree was generated using TimeTree tool (Kumar et al., 2017). The number of pairs correspond to the number of Pik-1/Pik-2 genes in a head-to-head orientation separated by intergenic region of various length. **The species harbours a truncated gene between Pik-1 and Pik-2; *the species has likely lost the HMA domain; Pik-1–HMA: Pik-1 with the HMA domain; Pik-1: Pik-1 without the HMA integration; BOP: Bambusoideae, Oryzoideae, Pooideae; PACMAD: Panicoideae, Arundinoideae, Chloridoideae, Micrairoideae, Aristidoideae, Danthonioideae.
-
Figure 1—source data 1
Selection test for Pik-1 vs. Pik-2 orthologues.
- https://cdn.elifesciences.org/articles/66961/elife-66961-fig1-data1-v1.xlsx
Figure 1—figure supplement 1
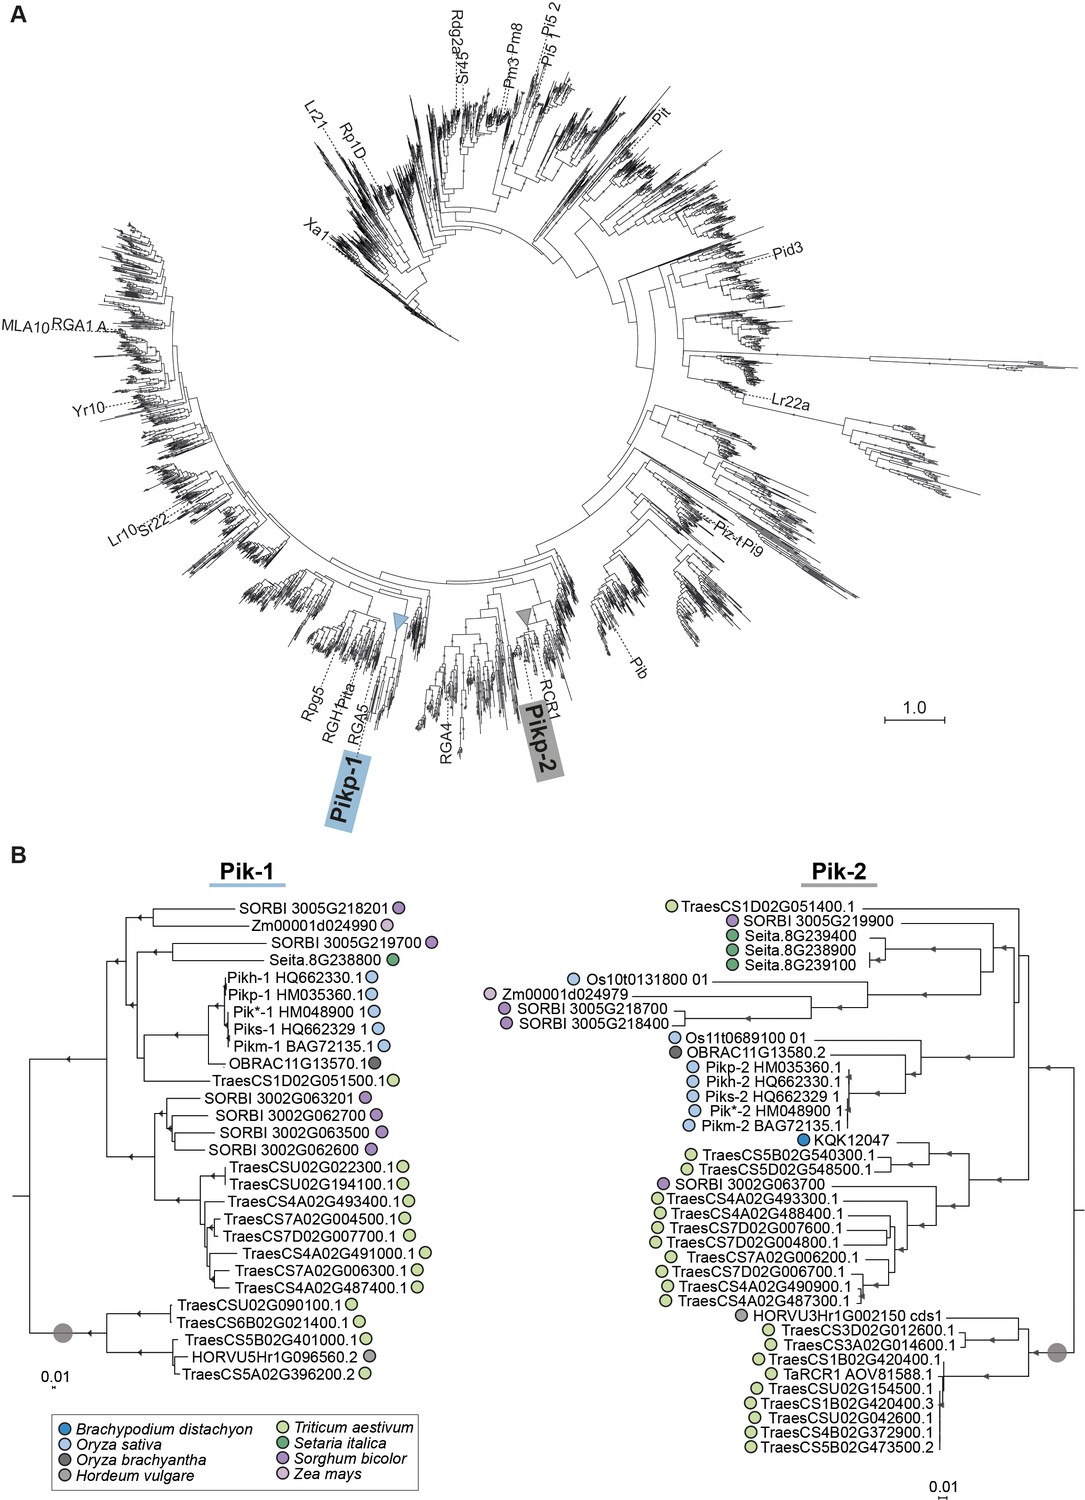
Pik-1 and Pik-2 orthologues fall into two well-supported clades.
(A) Phylogenetic tree of CC-type NLRs of Zea mays, Sorghum bicolor, Setaria italica, Triticum aestivum, Hordeum vulgare, Brachypodium distachyon, Oryza brachyantha, and Oryza sativa. The maximum likelihood (ML) tree was calculated based on 241-amino-acid-long alignment of the NB-ARC domains of 3062 of CC-NLRs amended with 35 known and functionally characterised NLRs from grasses using RAxML v8.2.11 (Stamatakis, 2014) with bootstrap values (Felsenstein, 1985) based on 1000 iterations and the best-scoring JTT likelihood model (Jones et al., 1992). The best ML tree is shown. The scale bar indicates the evolutionary distance based on site substitution rate. The clades constituting Pik-1 and Pik-2 orthologues are marked with blue and grey triangles, respectively. Branches corresponding to the reference NLRs are labelled. The interactive tree is publicly available at: https://itol.embl.de/tree/8229133147365371602863457. (B) The ML phylogenetic trees of Pik-1- (left) and Pik-2-related sequences (right) constructed based on 957- and 1218-nucleotide-long codon-based alignments of the sequences of the NB-ARC domain, respectively, using RAxML v8.2.11 (Stamatakis, 2014), 1000 bootstrap method (Stamatakis, 2014), and GTRGAMMA substitution model (Tavaré, 1986). Best ML trees were manually rooted using the selected clades (marked with grey circle) as outgroups. Bootstrap values above 70% are marked with grey triangles at the base of respective clades. The scale bars indicate the evolutionary distance based on nucleotide substitution rate. The interactive trees are publicly available at: https://itol.embl.de/tree/8229133147449491602864812 and https://itol.embl.de/tree/8229133147449511602864812.
Figure 1—figure supplement 2
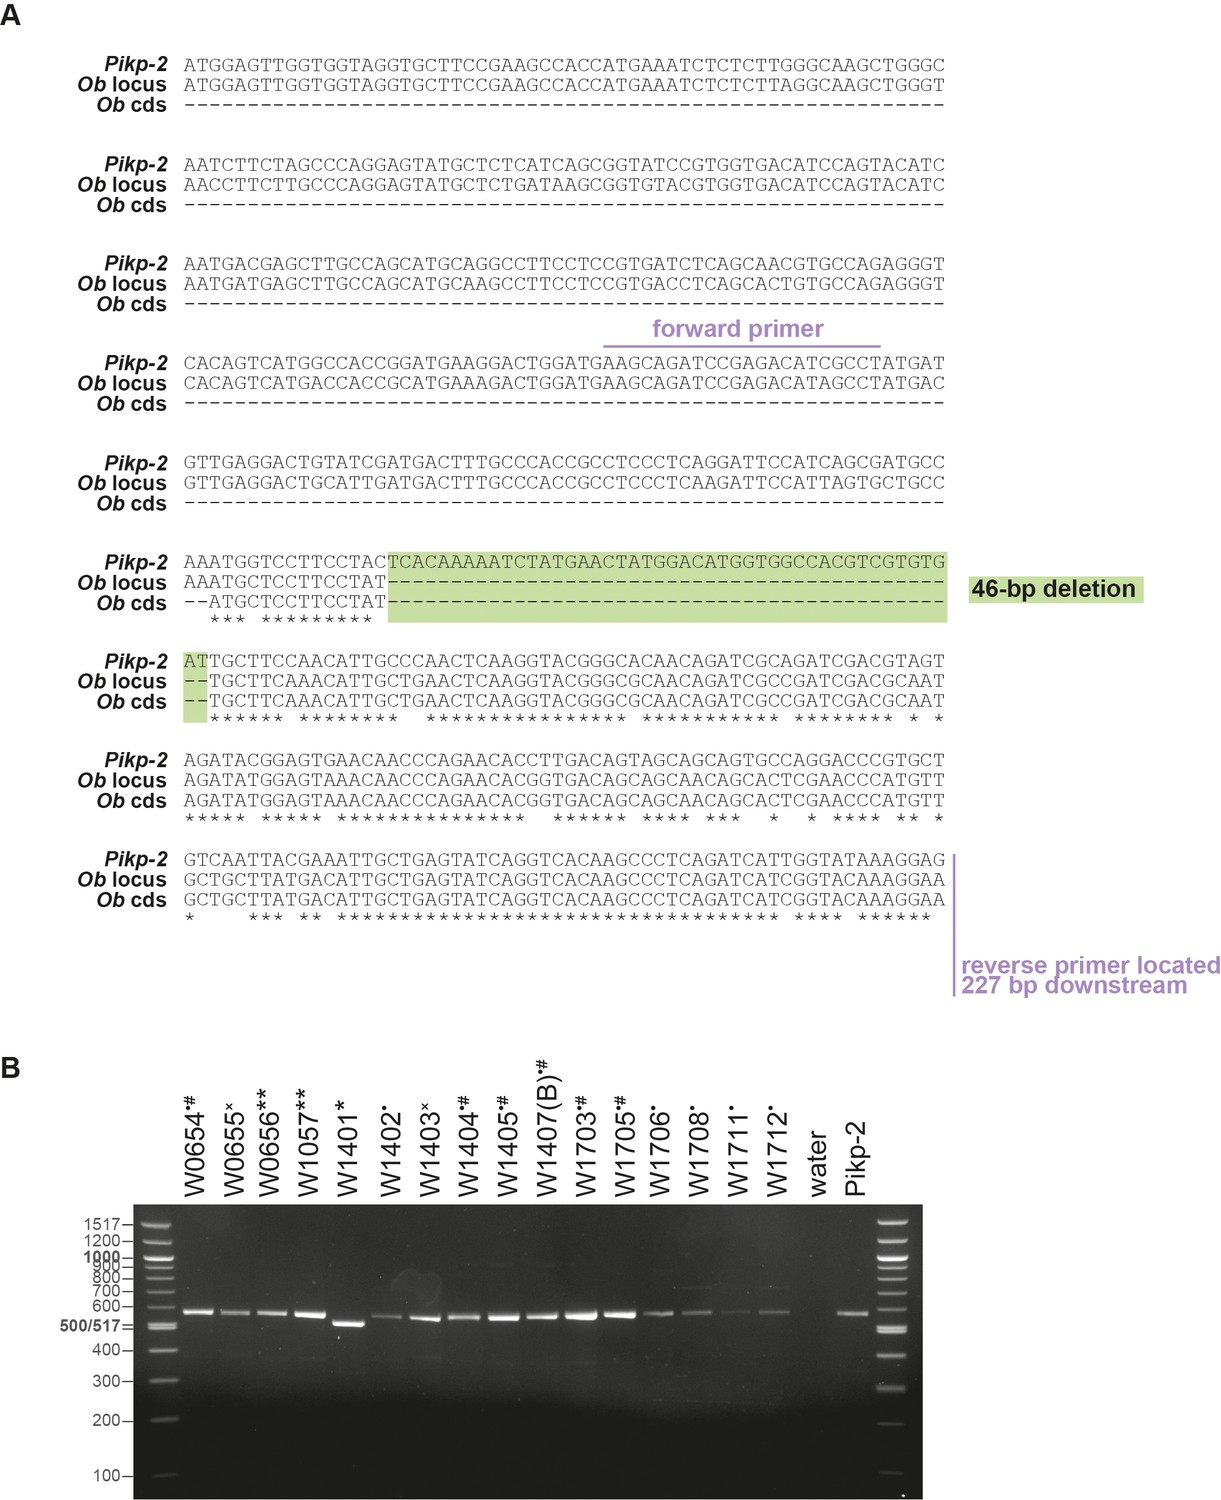
Genotyping of Oryza brachyantha accession.
(A) Nucleotide alignment of Pikp-2, the ObPik-2 (Ob locus) gene, and the ObPik-2 coding sequence (Ob cds) from the reference genome (Chen et al., 2013), illustrating 46-bp-long deletion and the primers used for the genotyping. (B) Gel electrophoresis of ObPik-2 fragments amplified from different O. brachyantha accessions (labelled above). The symbols next to the accession numbers mark sequences that carry the 46 bp deletion (*), harbour 4 bp deletion (**), carry 1 bp deletion (×), and do not carry any deletions (•) were used for amplification of the full-length gene (#). Water and Pikp-2 were used as a negative and positive control, respectively. The left and the right lanes show molecular size markers, labelled on the left.
Figure 1—figure supplement 3
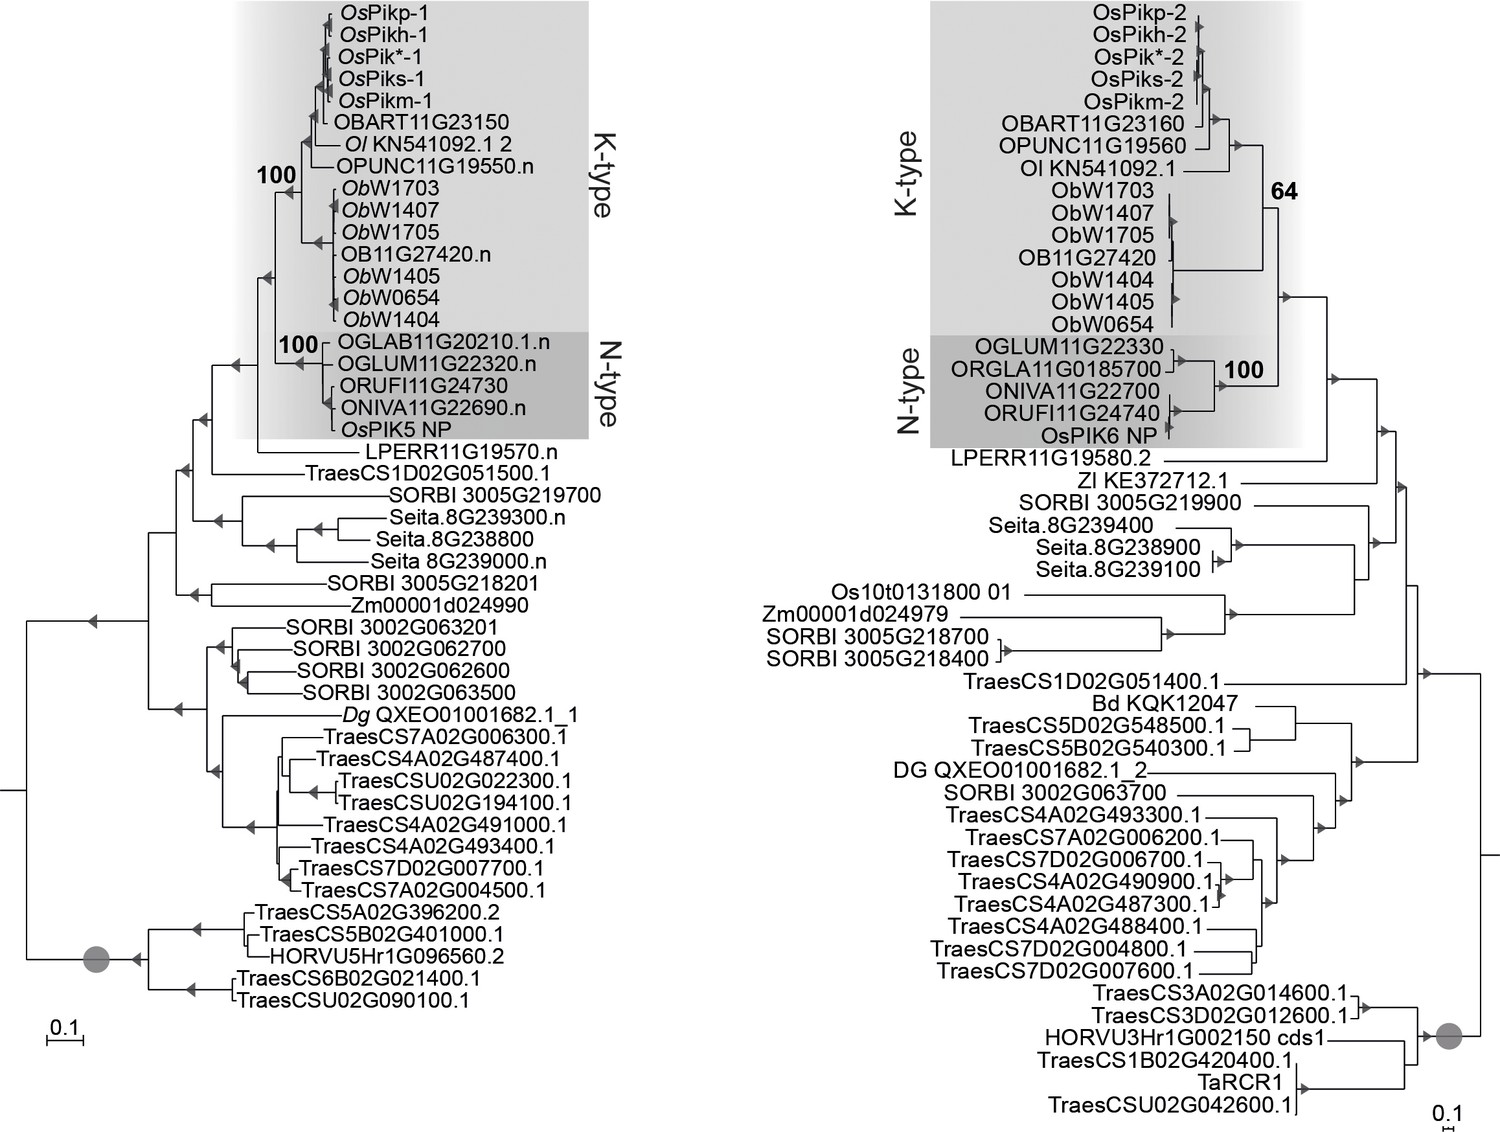
Pik-1 and Pik-2 orthologues from Oryza spp. fall into K- and N-type clades.
The phylogenetic tree shown in Figure 1A, illustrating the divide between the N- (dark grey) and K-type (light grey) Pik genes. The trees were manually rooted using the selected clades (marked with grey circle) as outgroups. The bootstrap values above 70 are indicated with grey triangles at the base of the respective clades; the support values for the relevant nodes are depicted with numbers. The scale bars indicate the evolutionary distance based on nucleotide substitution rate.
Figure 1—figure supplement 4
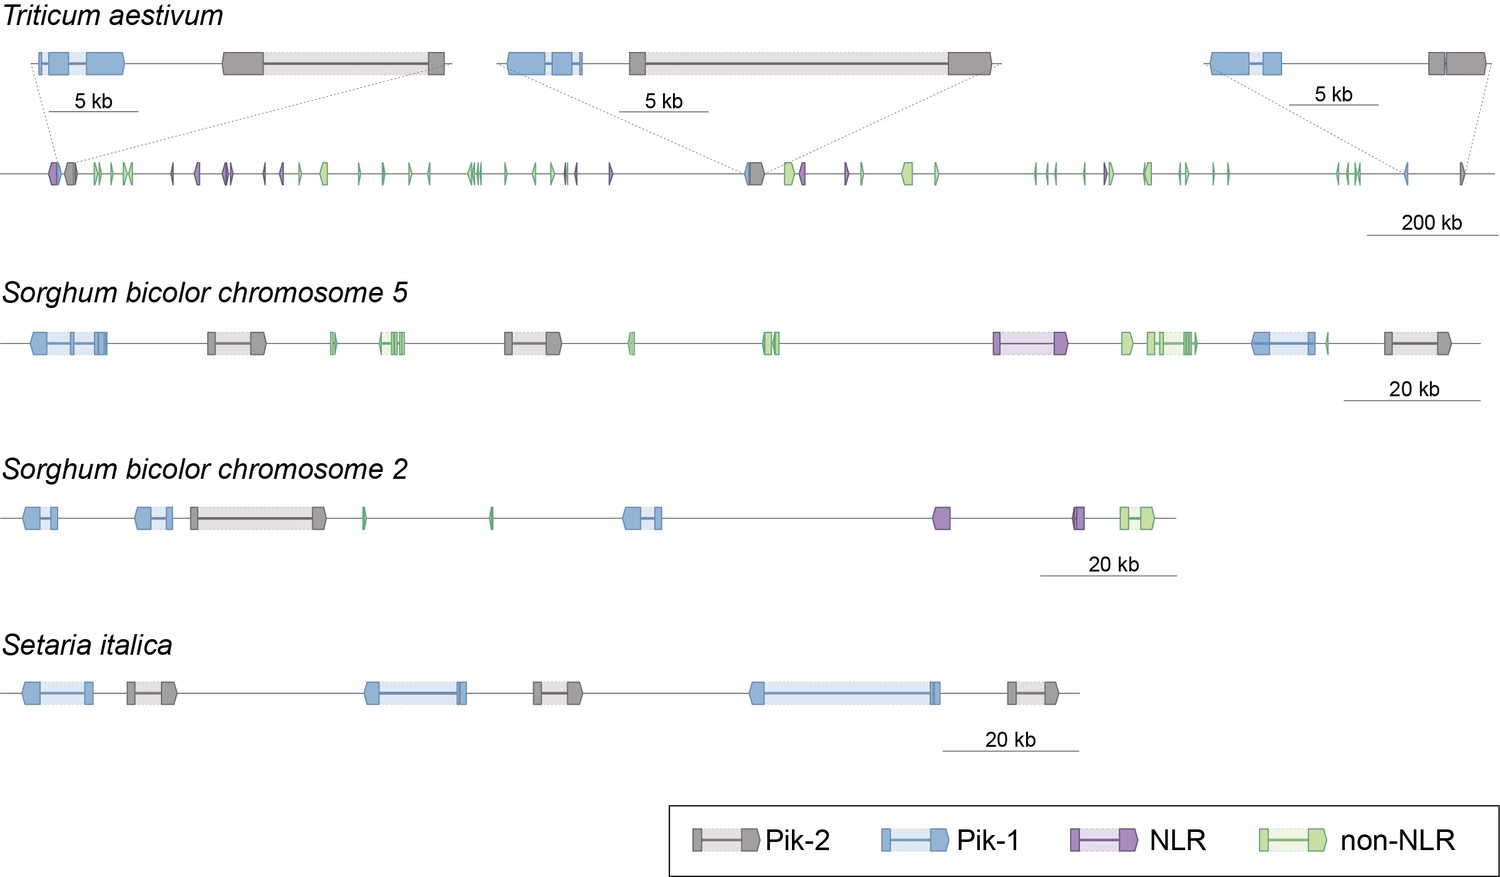
Schematic representation of selected Pik clusters in wheat (T. aestivum), sorghum (S. bicolor), and foxtail millet (S. italica).
The schematic presents gene models and genetic locations of Pik-1 (blue), Pik-2 (grey), and other NLR genes (purple). Non-NLR genes are shown in light green. The coordinates of the regions presented in this figure are summarised in Supplementary file 1F.
Figure 1—figure supplement 5
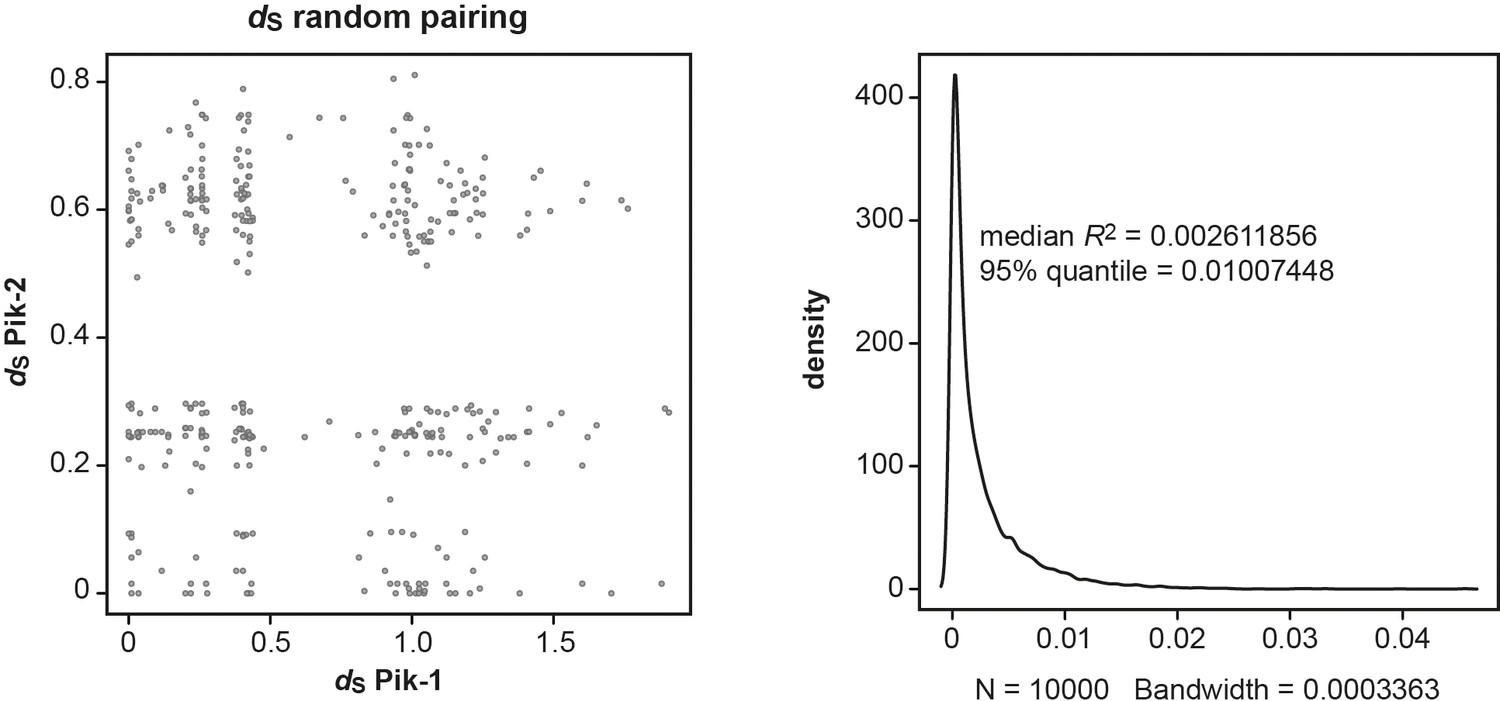
Random pairwise comparisons of dS rates calculated for the Pik-1 and Pik-2 receptors.
The synonymous (dS) rates were calculated using Yang and Nielsen, 2000 and presented in Figure 1C. The random datasets for dS values were generated by name shuffling in the existing dataset and random sampling from it 1000 times (left panel). The coefficient of determination (R2) was calculated for every random pairing and the R2 distribution was plotted (right panel), as implemented in R v3.6.3 package. If less than 5% of the R2 for the random dataset is bigger than the R2 for the real dataset, then, according to the null model, the observed difference is very rare and can be accepted as significant with p<0.05.
Figure 1—figure supplement 6
Genetically linked Pik-1 and Pik-2 have similar molecular age.
Comparisons of pairwise dS rates calculated for the Pik-1 and Pik-2 receptors. The rates were calculated using Yang and Nielsen, 2000 based on 972- and 1269-nucleotide-long codon-based alignments of the NB-ARC domains of Pik-1 and Pik-2, respectively; only positions that showed over 70% coverage across the alignment were used for the analysis. The pairwise comparisons of dS rates are presented as a heatmap. The comparisons were ordered based on the Pik-1 phylogenetic relationship, shown on the left. The list of genes used for the pairwise comparisons is summarised in Supplementary file 1G.
Figure 2 with 4 supplements
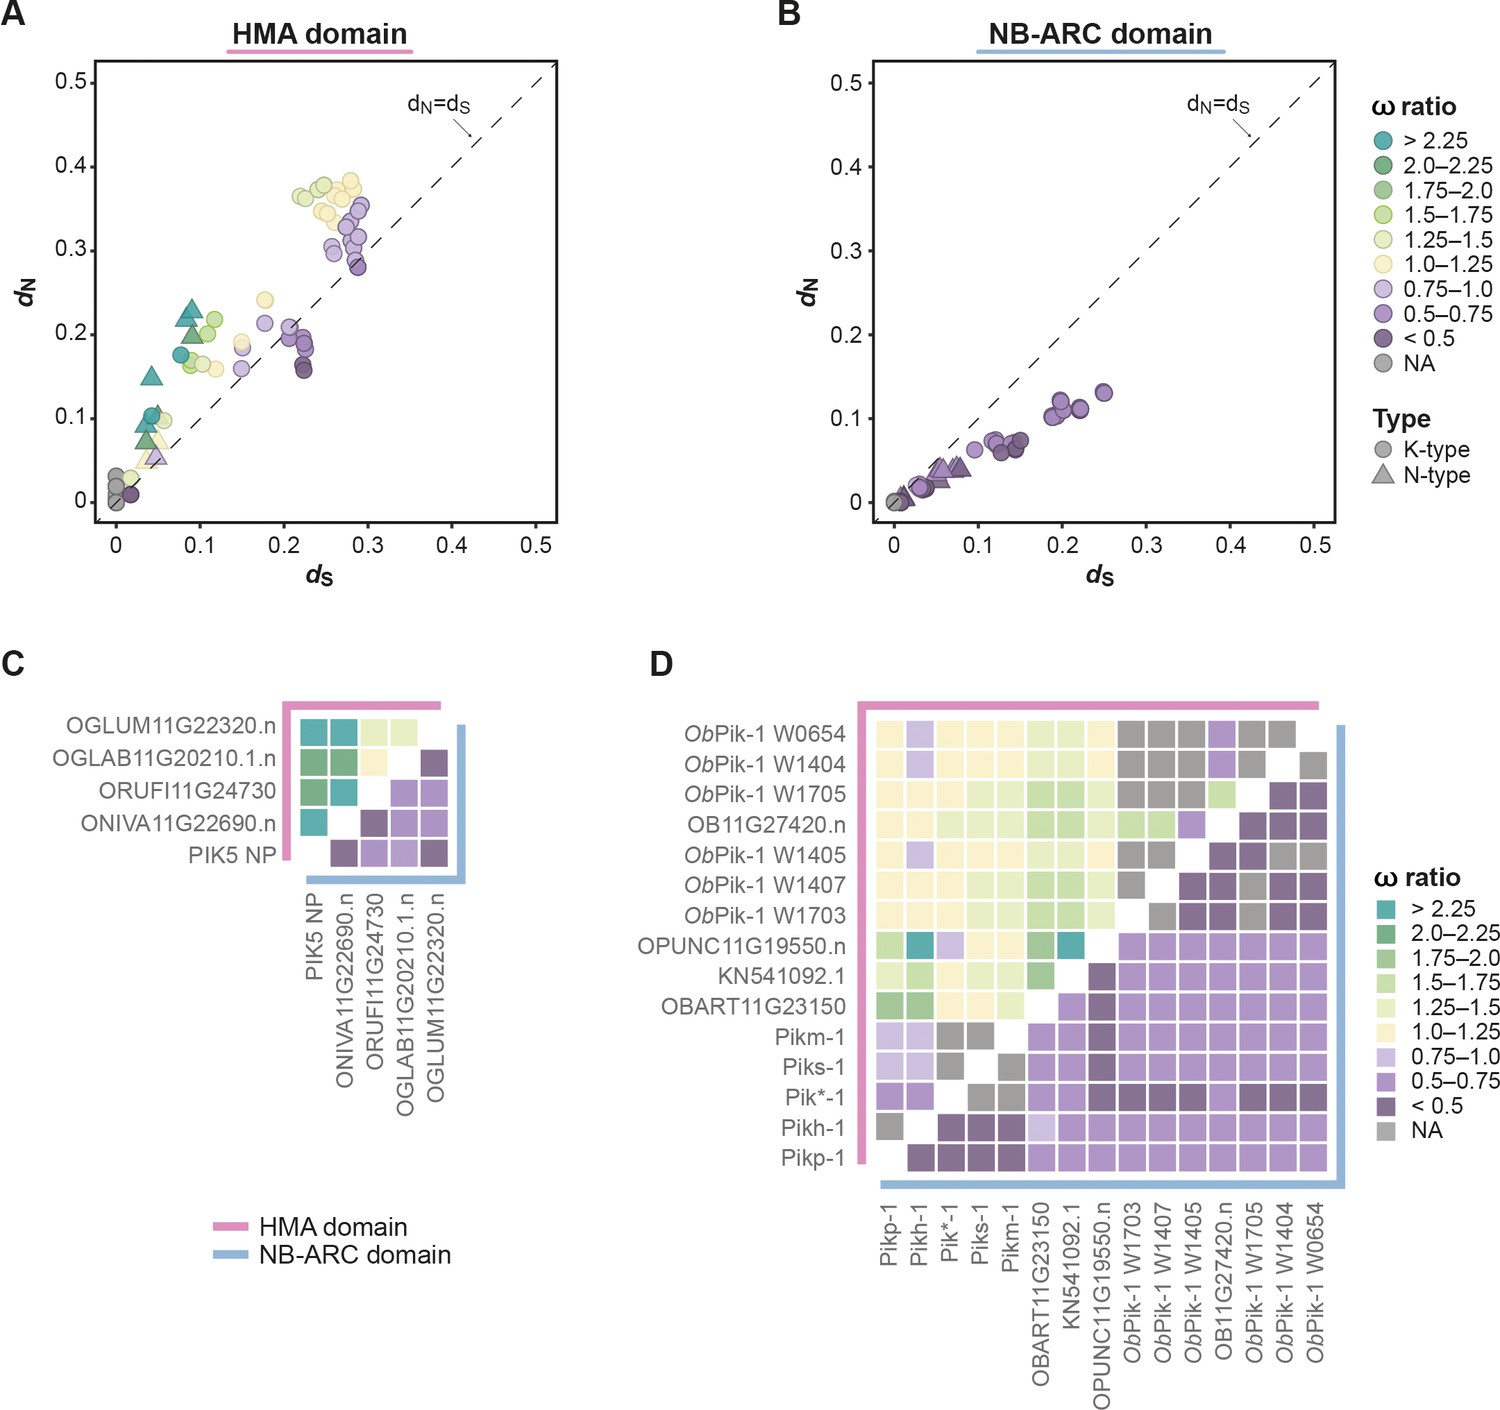
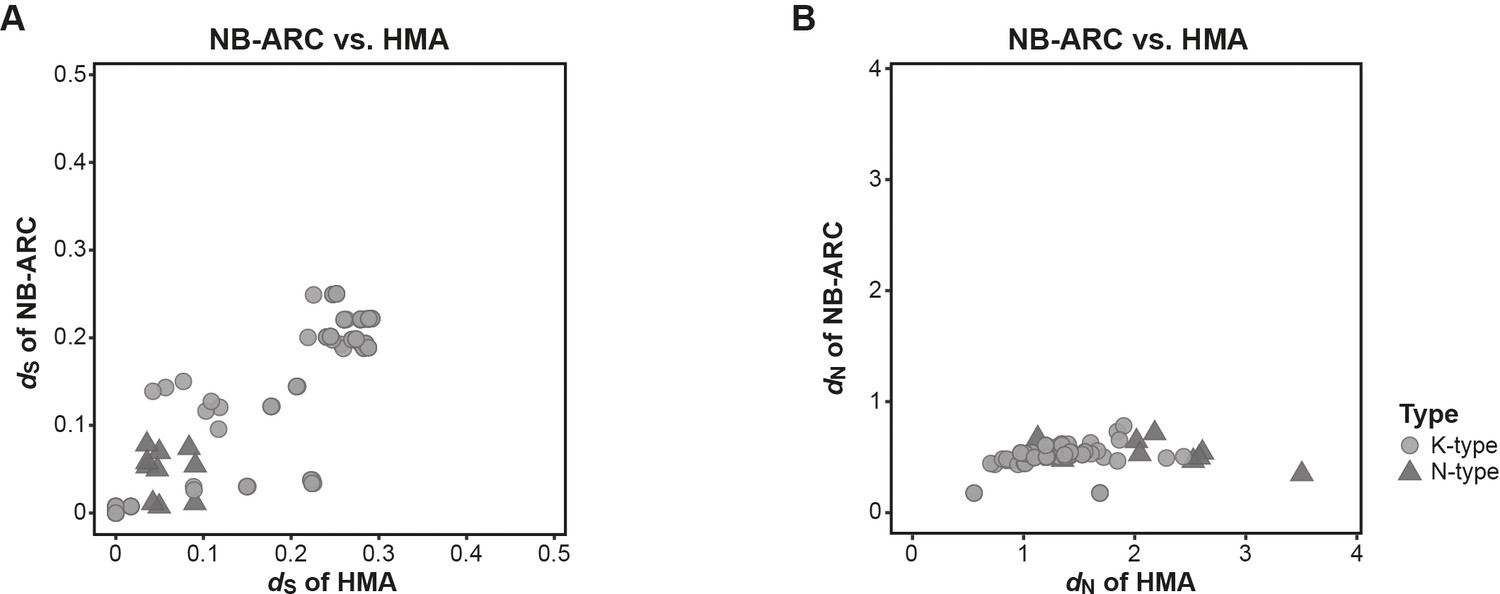
The integrated heavy metal-associated (HMA) domain exhibits elevated rates of ω (dN/dS) compared with the NB-ARC domain of Pik-1.
(A, B) Pairwise comparison of nucleotide substitution rates within the Pik-1 integration clade for the (A) HMA and (B) NB-ARC domains, calculated using Yang and Nielsen, 2000. The diagonal line (dashed) indicates dN = dS. The points are colour-coded to indicate ω ratio; NA: the ratio was not calculated because dS = 0. The pairwise comparisons were separately performed for the K-type (circles) and N-type (triangles) Pik-1 sequences. (C, D) To highlight the differences between the ω rates for the HMA (pink line) and NB-ARC (blue line) domains, the rates were plotted as heatmaps corresponding to the (C) N- and (D) K-type Pik-1 sequences.
-
Figure 2—source data 1
Selection test for Pik-1-HMA vs. NB-ARC.
- https://cdn.elifesciences.org/articles/66961/elife-66961-fig2-data1-v1.xlsx
Figure 2—figure supplement 1

Multiple sequence alignment illustrating the conservation around the HMA integration site.
The codon-based sequence alignment of the region surrounding the HMA integration site was generated using MUSCLE (Edgar, 2004). The residues are coloured based on percentage sequence identity from dark (high similarity) to light blue (low similarity).
Figure 2—figure supplement 2
The integrated heavy metal-associated (HMA) domain displays elevated rates of dN compared with the NB-ARC domain of Pik-1.
Pairwise comparison of (A) dS and (B) dN rates between the HMA and NB-ARC domains of Pik-1. Pairwise comparison were calculated using Yang and Nielsen, 2000.
Figure 2—figure supplement 3
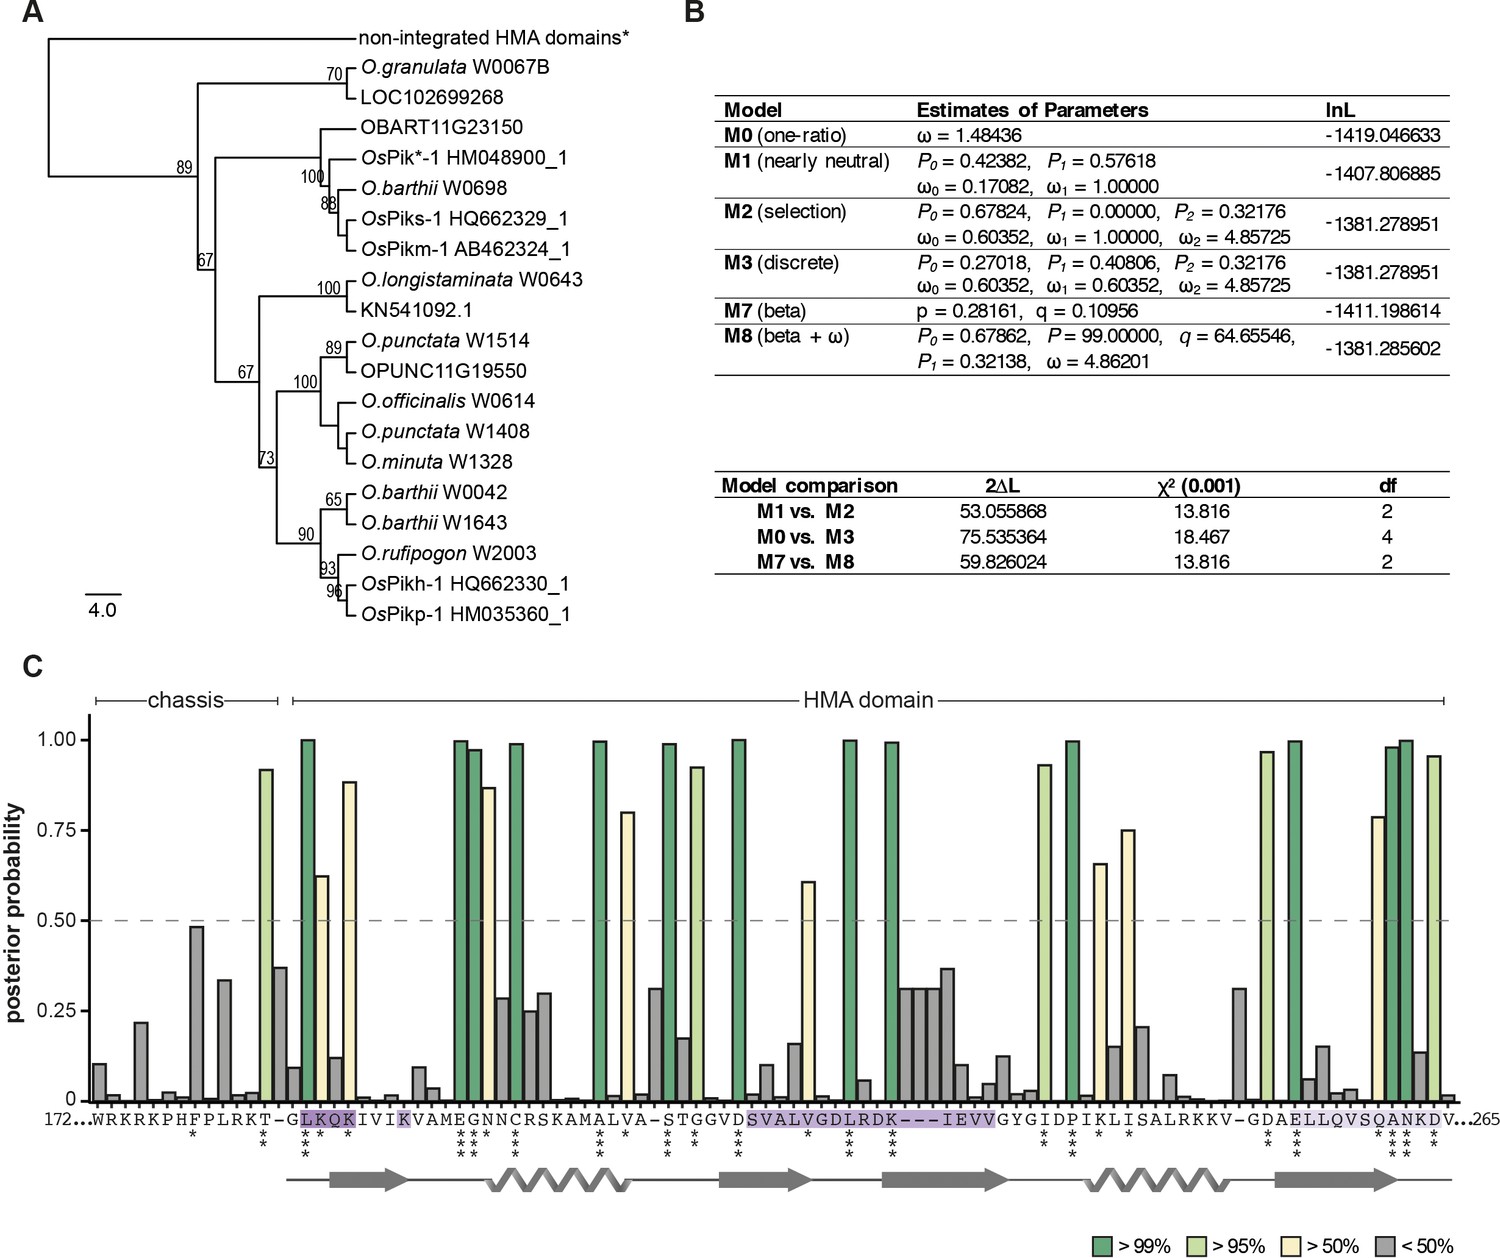
Residues within the integrated heavy metal-associated (HMA) domain are likely to have experienced positive selection.
(A) The neighbour joining (NJ) tree of the HMA domain calculated using the JTT substitution model (Jones et al., 1992) and bootstrap method with 100 iterations test (Felsenstein, 1985). Alignment of 98 amino acids of integrated HMAs was generated with MUSCLE (Edgar, 2004). Bootstrap values above 65% are shown at the base of respective clades. The scale bar marks the evolutionary distance based on number of base substitutions per site. *A branch corresponding to non-integrated HMAs was manually added to the tree to indicate an outgroup, which was used for tree calculation but not for calculating the selection probabilities; the entire tree is presented in Figure 3—figure supplement 2. (B) Results from codon substitution models for heterogeneous selection at amino acid sites (upper panel) and likelihood ratio tests (bottom panel). (C) Posterior probabilities for site classes estimated under the beta and ω (M8) model inferred using Bayes empirical Bayes (BEB) (Yang et al., 2005). The amino acids with higher values of posterior probability are more likely to be under positive selection. The stars indicate potentially positively selected sites: *p>50%, **p>95%, ***p>99%. The amino acid sequence and the protein model shown below the plot correspond to Pikp-HMA. The effector-interaction interfaces are marked in shades of purple.
Figure 2—figure supplement 4
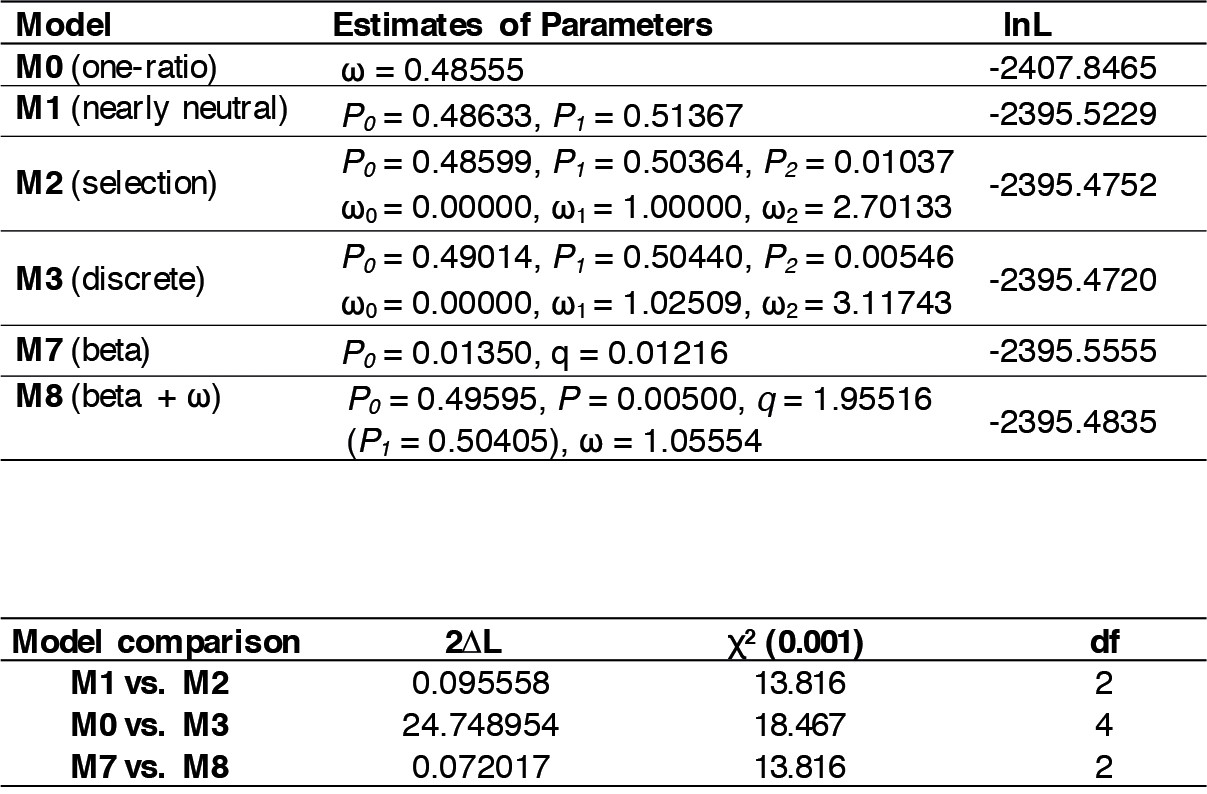
Selection test at the amino acid sites within the NB-ARC domain of the K-type Pik-1 genes.
Results from the codon substitution models for heterogeneous selection at amino acid sites (upper panel) and the likelihood ratio test (bottom panel).
Figure 3 with 3 supplements
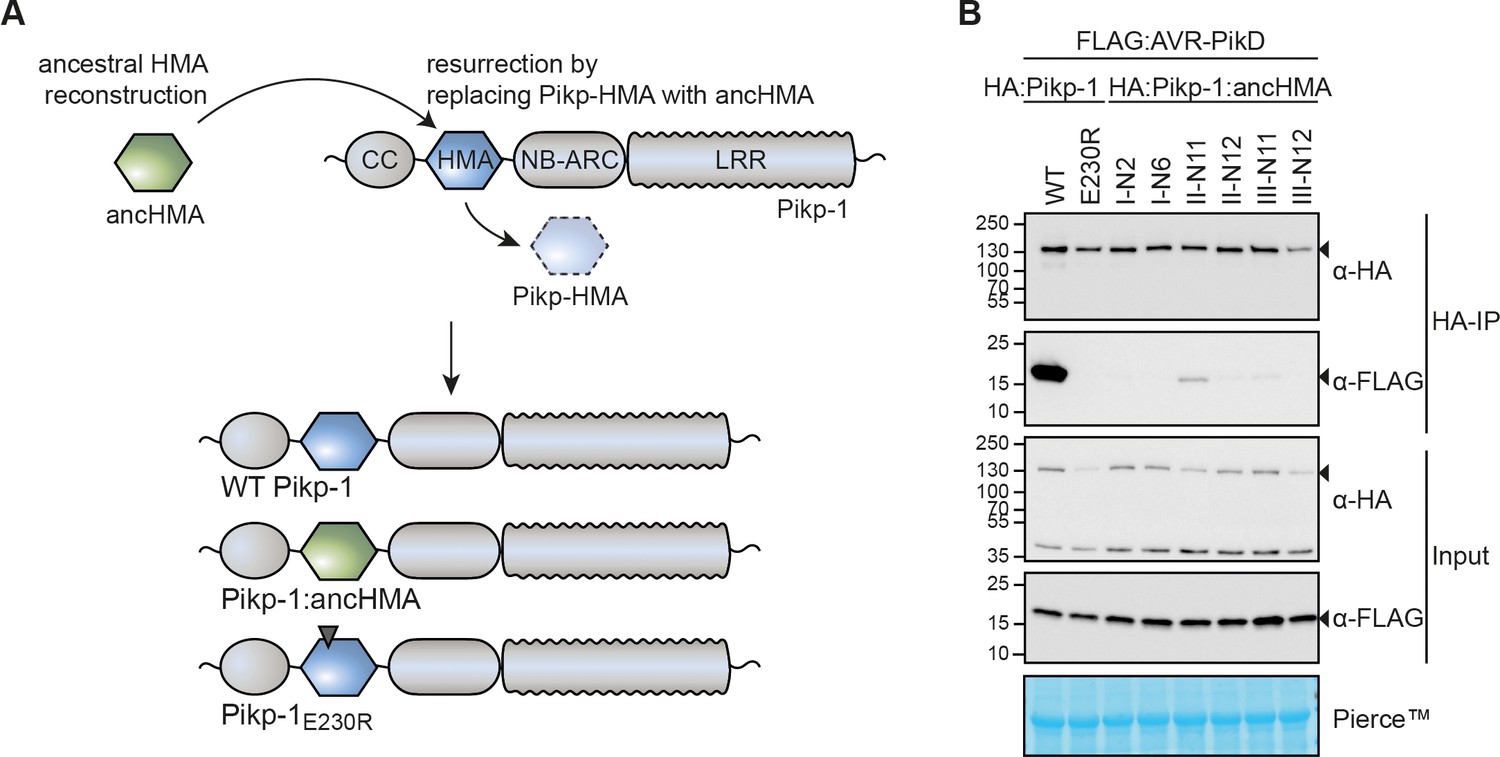
The integrated heavy metal-associated (HMA) domain of Pikp-1 exhibits stronger association with the AVR-PikD effector than its predicted ancestral state.
(A) Overview of the strategy for resurrection of the ancestral HMA (ancHMA) domain. Following ancestral sequence reconstruction, the gene sequences were synthesised and incorporated into Pikp-1 by replacing the present-day Pikp-HMA domain (blue) with the ancHMA equivalent (green). (B) Co-immunoprecipitation experiment between AVR-PikD (N-terminally tagged with FLAG) and Pikp-1 (N-terminally tagged with HA) carrying ancestral sequences of the HMA. Wild-type (WT) HA:Pikp-1 and HA:Pikp-1E230R were used as a positive and negative control, respectively. Immunoprecipitates (HA-IP) obtained with anti-HA probe and total protein extracts (Input) were immunoblotted with appropriate antisera (listed on the right). Rubisco loading control was performed using Pierce staining solution. Arrowheads indicate expected band sizes. Results from three independent replicates of this experiment are shown in Figure 3—figure supplement 3.
Figure 3—figure supplement 1

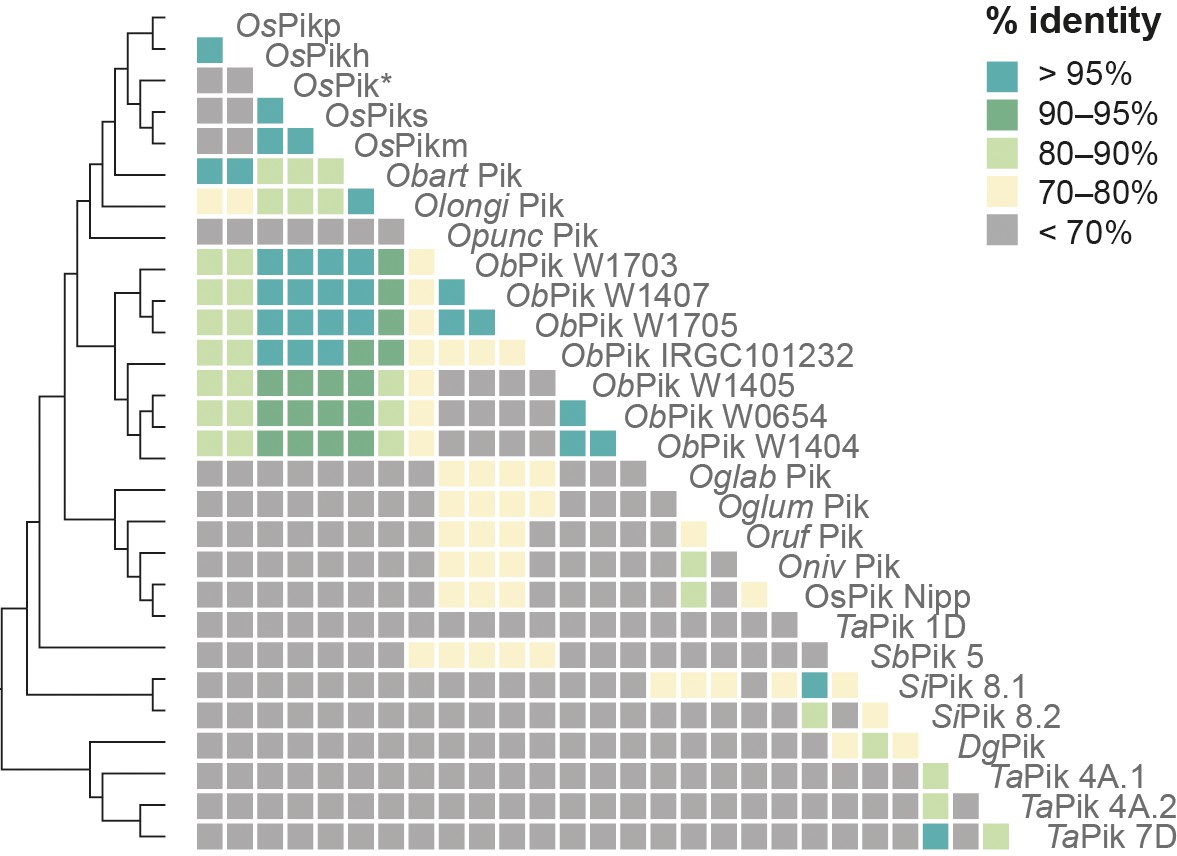
Phylogenetic analyses of the heavy metal-associated (HMA) domain of K-type Pik-1 NLRs.
The phylogenetic trees were built using MEGA X software (Kumar et al., 2018) and bootstrap method based on 1000 iterations (Felsenstein, 1985). Codon-based 249-nucleotide-long alignment was generated using MUSCLE Edgar, 2004; positions with less than 50% site coverage were removed prior to the analysis, resulting in 234 positions in the final dataset. The relevant bootstrap values with support over 60% are shown with triangles at the base of representative clades; the size of the triangle is proportional to the bootstrap value. The scale bars indicate the evolutionary distance based on nucleotide substitution rate. Each tree was manually rooted using a clade of non-integrated HMA as an outgroup. The nodes selected for the ancestral sequence reconstruction are marked with red triangles. (A) Maximum likelihood (ML) and neighbour joining (NJ) trees calculated based on all codon positions in the alignment. (B) ML and NJ trees calculated based on third codon position in the alignment.
Figure 3—figure supplement 2
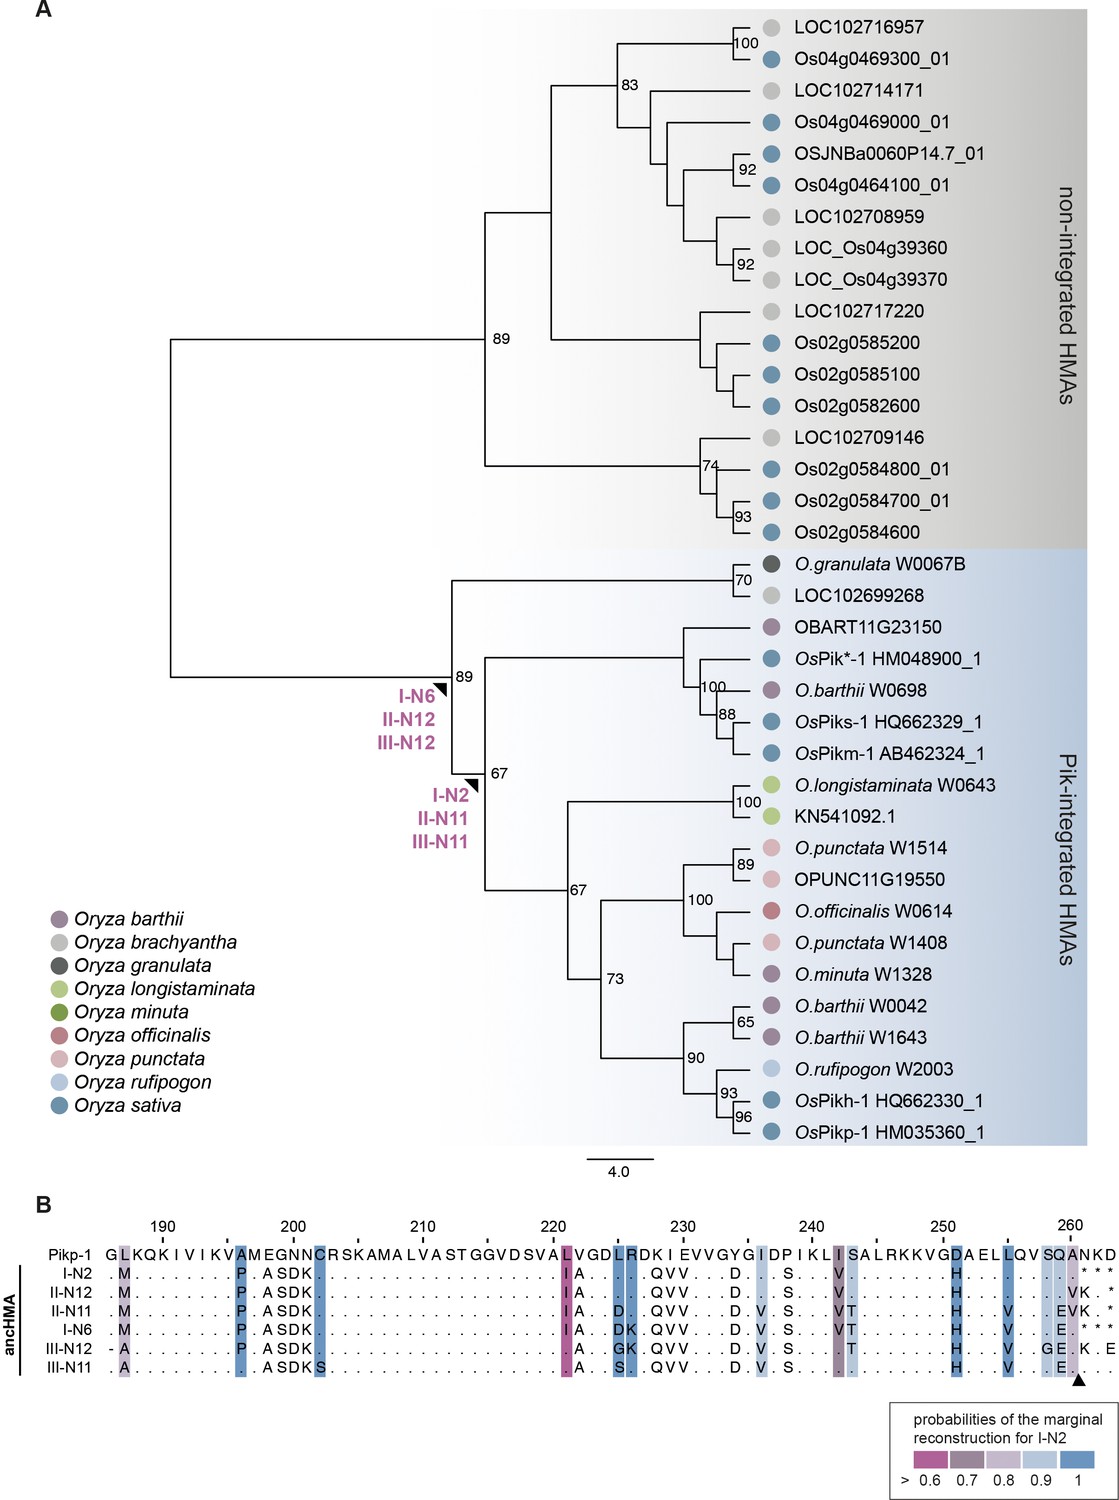
Ancestral sequence reconstruction yielded multiple plausible ancestral HMA (ancHMA) sequences.
(A) Representative neighbour joining (NJ) phylogenetic tree of the heavy metal-associated (HMA) domain. The tree was built using JTT substitution model (Jones et al., 1992) and bootstrap method with 100 iterations test (Felsenstein, 1985). Alignment of 98 amino acids of integrated (blue) and non-integrated (grey) HMAs was generated with MUSCLE (Edgar, 2004). Bootstrap values above 65% are shown at the base of respective clades. Nodes for which the ancestral sequence reconstruction was performed are marked with arrowheads. The scale bar indicates the evolutionary distance based on the number of base substitutions per site. (B) Protein sequence alignment of representative ancHMA predictions. Amino acids for which sequence prediction was not performed are replaced with asterisk (*). The probabilities of the marginal reconstruction for I-N2 sequence are marked with coloured boxes. An arrowhead indicates the length of the construct used in further studies concerning Pikp-1.
Figure 3—figure supplement 3
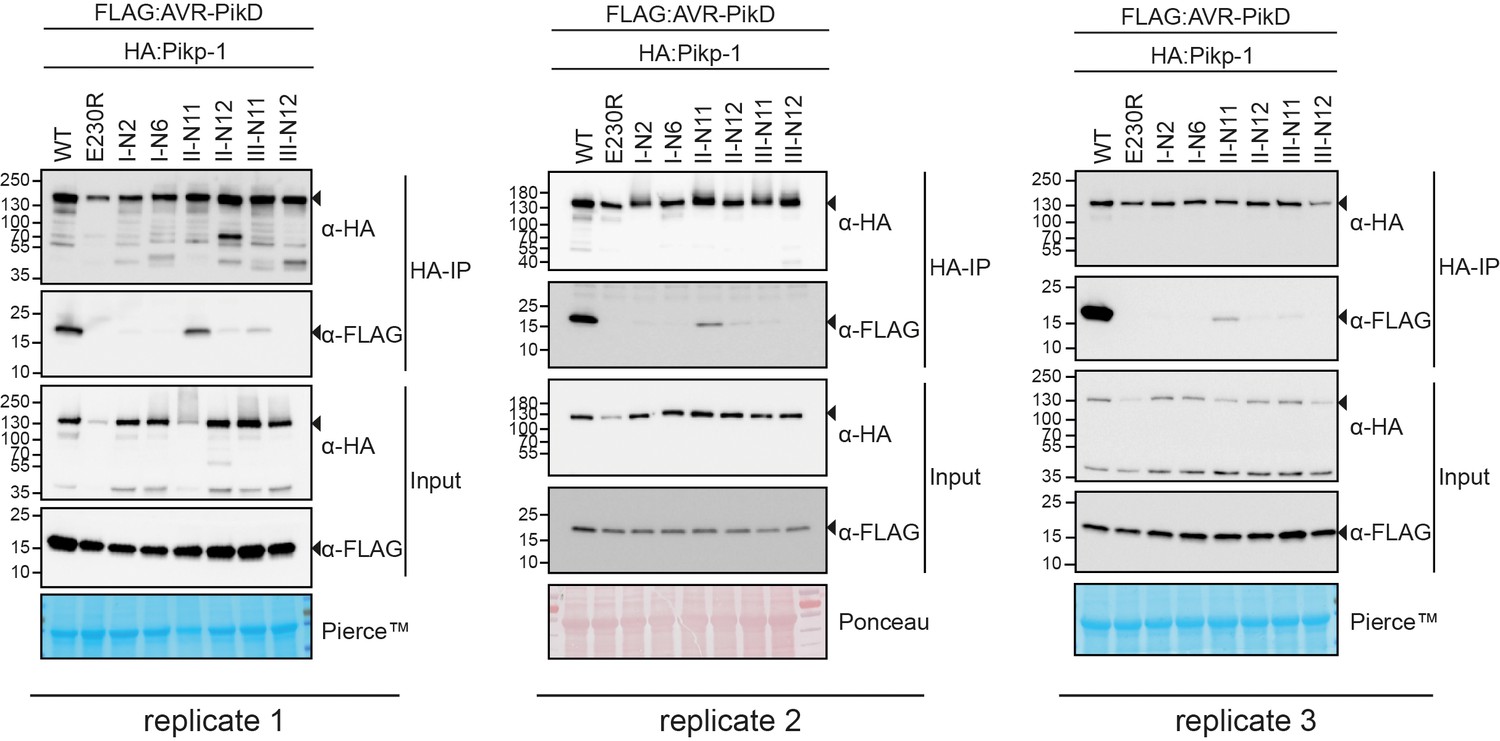
Replicates of the co-immunoprecipitation (co-IP) experiment between AVR-PikD and the reconstructed ancestral HMA (ancHMA) sequences.
Co-IP experiment between AVR-PikD (N-terminally tagged with FLAG) with Pikp-1 with ancestral sequences of HMA (N-terminally tagged with HA). Wild-type (WT) HA:Pikp-1 and HA:Pikp-1E230R were used as positive and negative controls, respectively. Immunoprecipitates (HA-IP) obtained using anti-HA probes and total protein extracts (Input) were immunoblotted with appropriate antisera (listed on the right). Rubisco loading control was performed using Pierce or Ponceau staining solutions. Arrowheads indicate expected band sizes. The figure shows the results from three independent experiments.
Figure 4 with 1 supplement
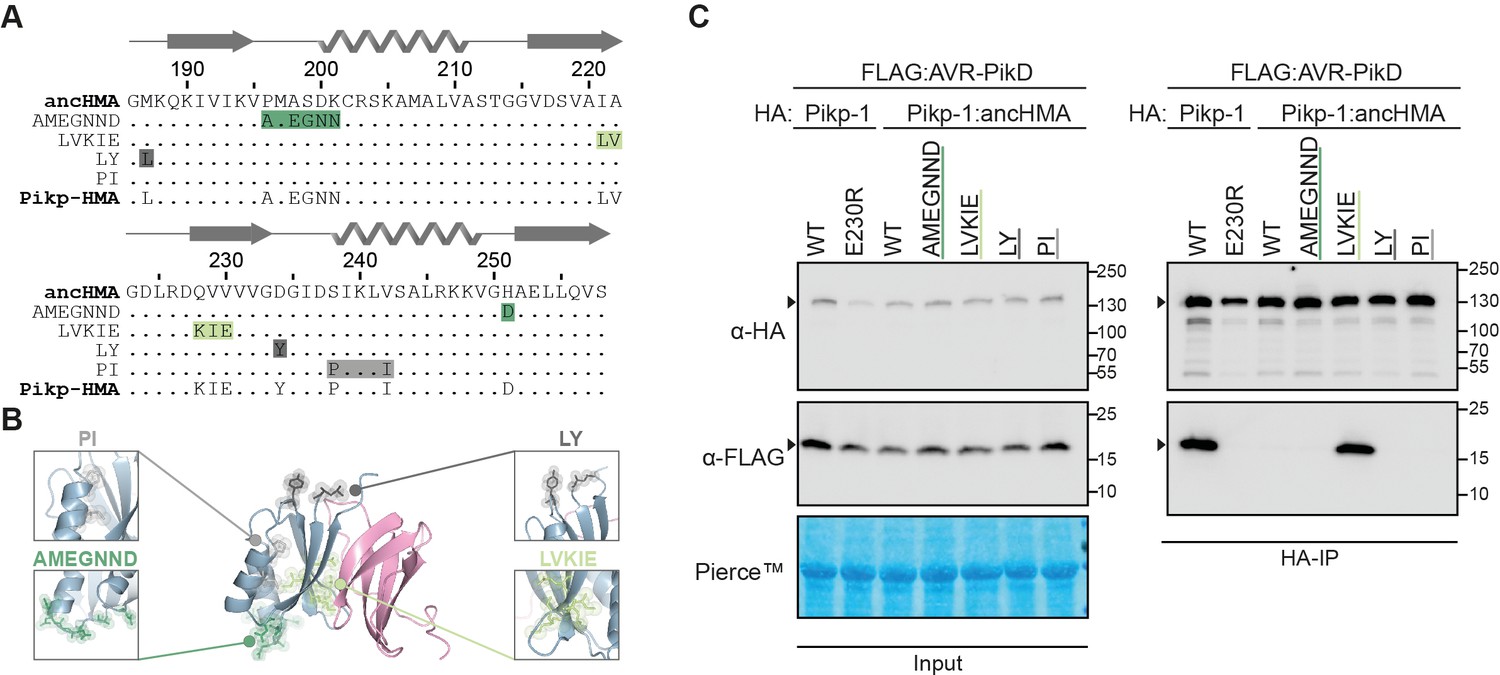
The IAQVV/LVKIE region of the Pikp-HMA domain determines high-affinity binding to AVR-PikD.
(A) Protein sequence alignment showing the Pikp–ancHMA swap chimeras. The amino acid sequences of ancestral HMA (ancHMA), Pikp-HMA, and chimeras are aligned, with the protein model above corresponding to the Pikp-HMA structure. The colour-coded rectangles correspond to polymorphic regions used for chimeric swaps. (B) Schematic representation of Pikp-HMA (blue) in complex with AVR-PikD (pink) (De la Concepcion et al., 2018), with polymorphic regions between the Pikp-HMA and the ancHMA colour-coded as in (A). The molecular surfaces of the polymorphic residues are also shown. (C) Association between AVR-PikD (N-terminally tagged with FLAG) and Pikp-1, Pikp-1E230R, Pikp-1:ancHMA, and Pikp-1:ancHMA chimeras (N-terminally tagged with HA), labelled above, was tested in planta in co-IP experiment. Wild-type (WT) Pikp-1 and Pikp-1E230R were used as a positive and negative control, respectively. Immunoprecipitates (HA-IP) obtained with anti-HA probe and total protein extracts (input) were immunoblotted with the appropriate antisera, labelled on the left. Rubisco loading control was performed using Pierce staining solution. Arrowheads indicate expected band sizes. Results from three independent replicates of this experiment are shown in Figure 4—figure supplement 1.
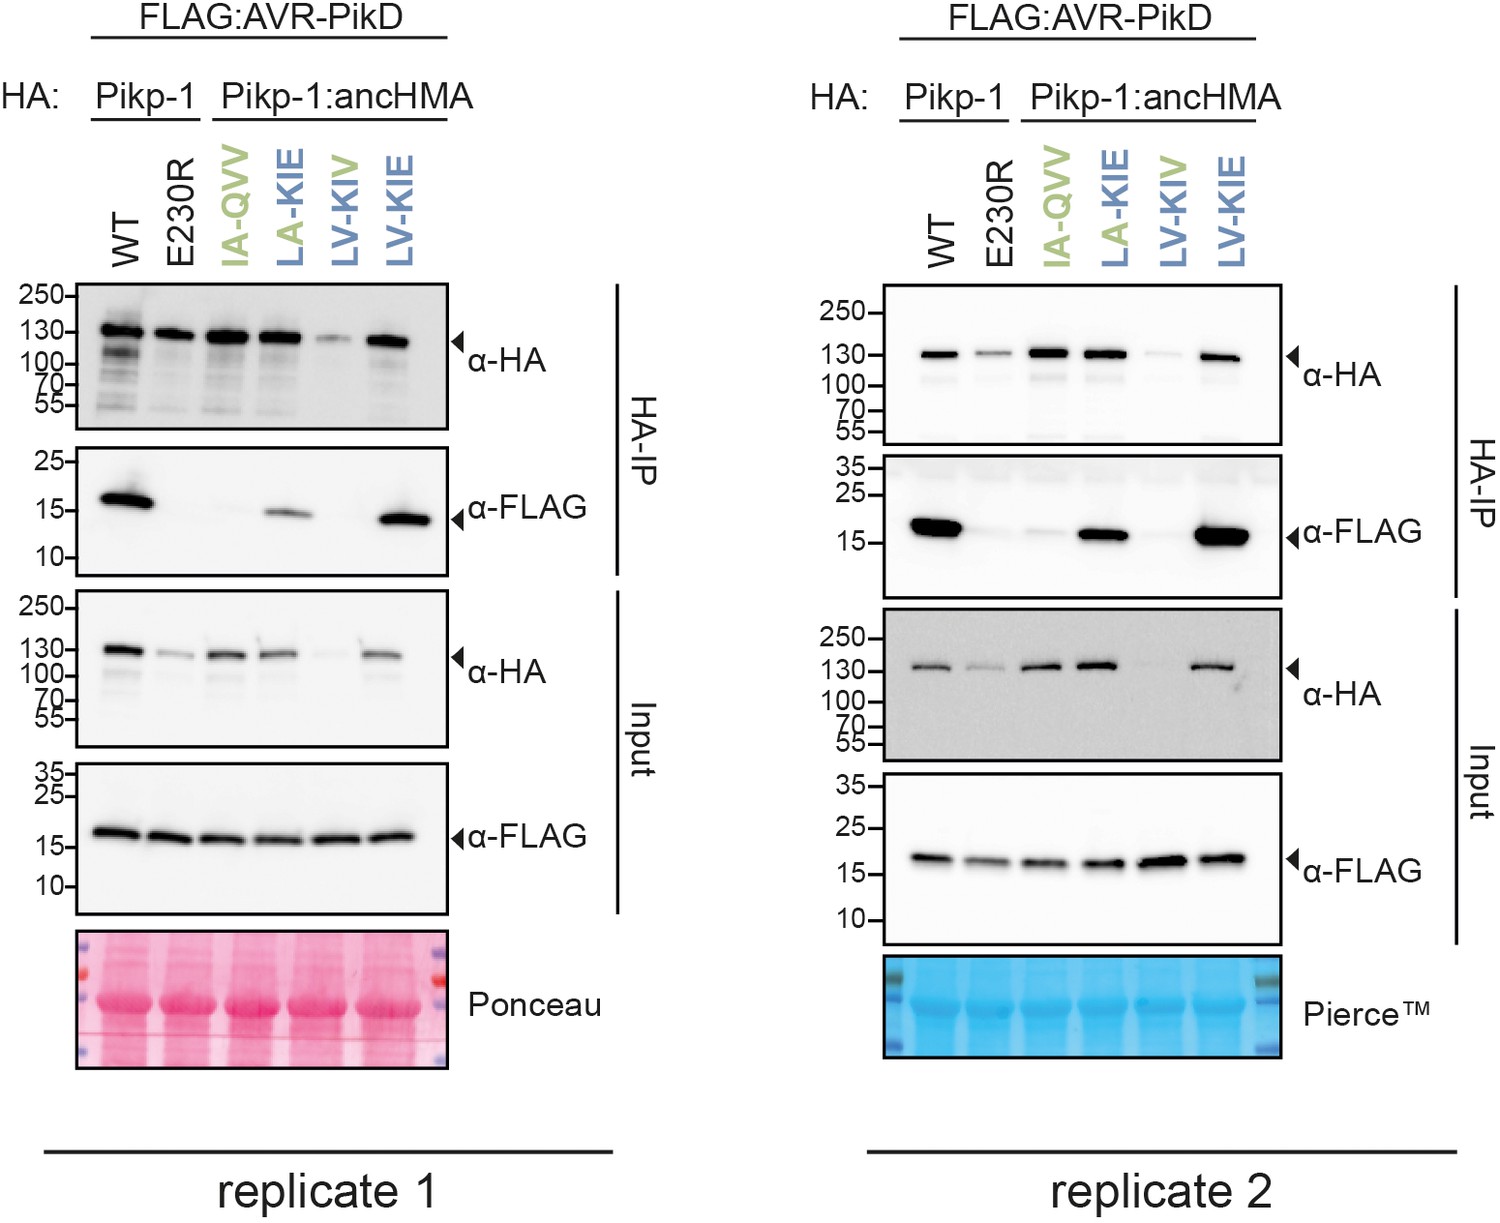
Figure 4—figure supplement 1
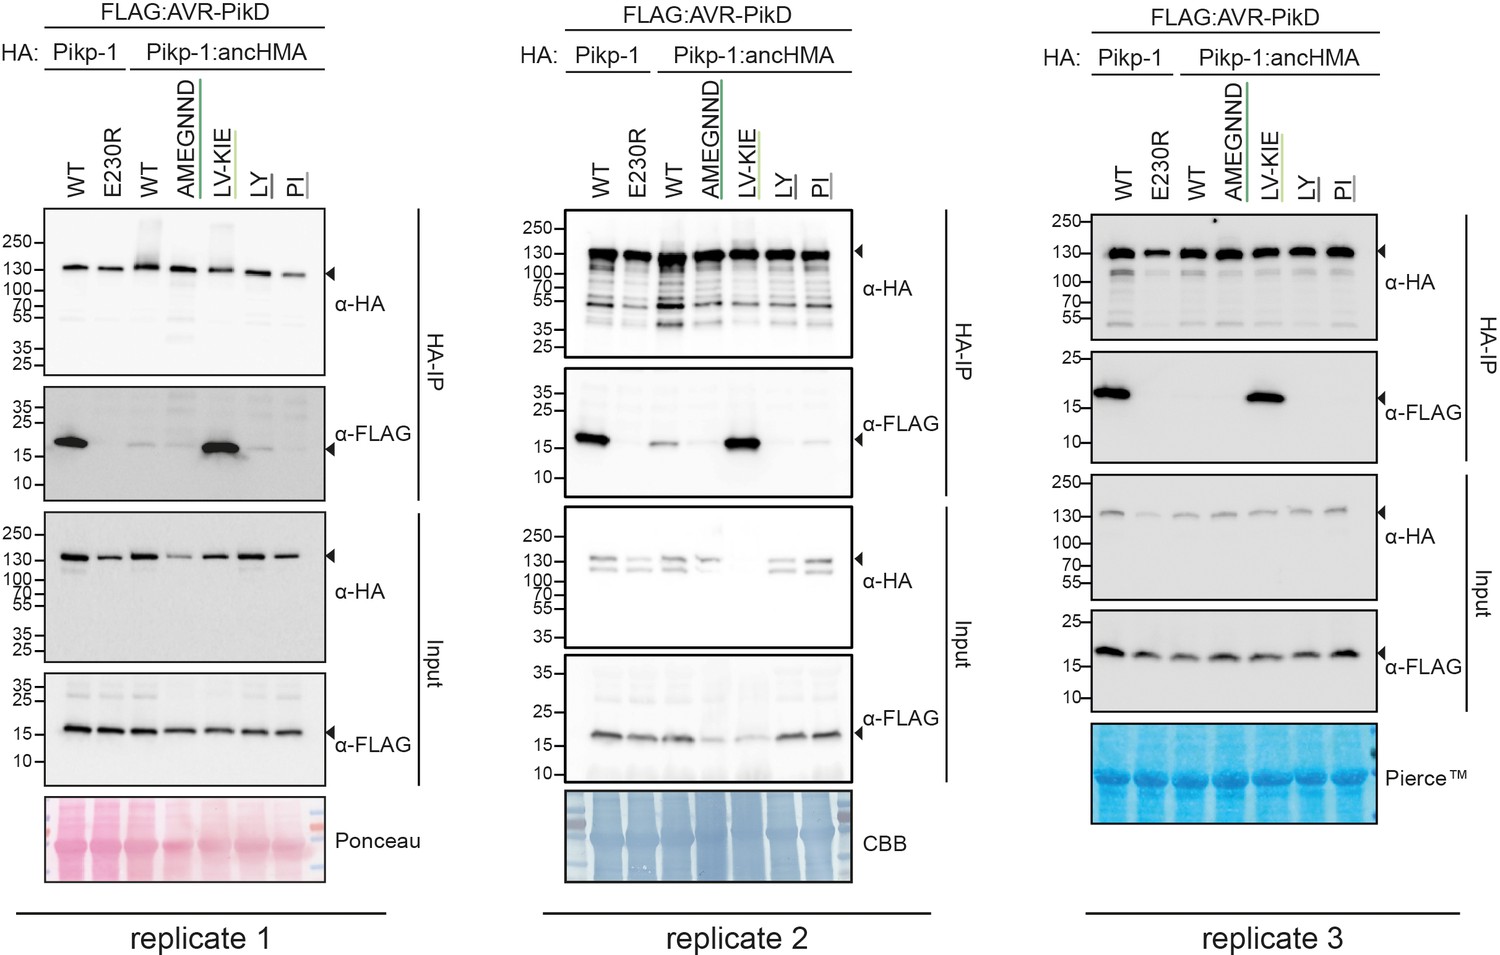
Replicates of the co-immunoprecipitation (co-IP) experiment between AVR-PikD and the Pikp-1:ancHMA chimeras.
Association of AVR-PikD (N-terminally tagged with FLAG) with Pikp-1, Pikp-1E230R, Pikp-1:ancHMA, and Pikp-1:ancHMA chimeras (N-terminally tagged with HA), labelled above, was tested in planta by co-IP. Wild-type (WT) HA:Pikp-1 and HA:Pikp-1E230R were used as a positive and negative control, respectively. Immunoprecipitates (HA-IP) obtained using anti-HA probes and total protein extracts (input) were immunoblotted with appropriate antisera, labelled on the right. Arrowheads show expected band sizes. Rubisco loading controls were performed using Pierce, Coomassie Brilliant Blue (CBB), or Ponceau staining solutions. The figure shows the results from three independent experiments.
Figure 5 with 5 supplements
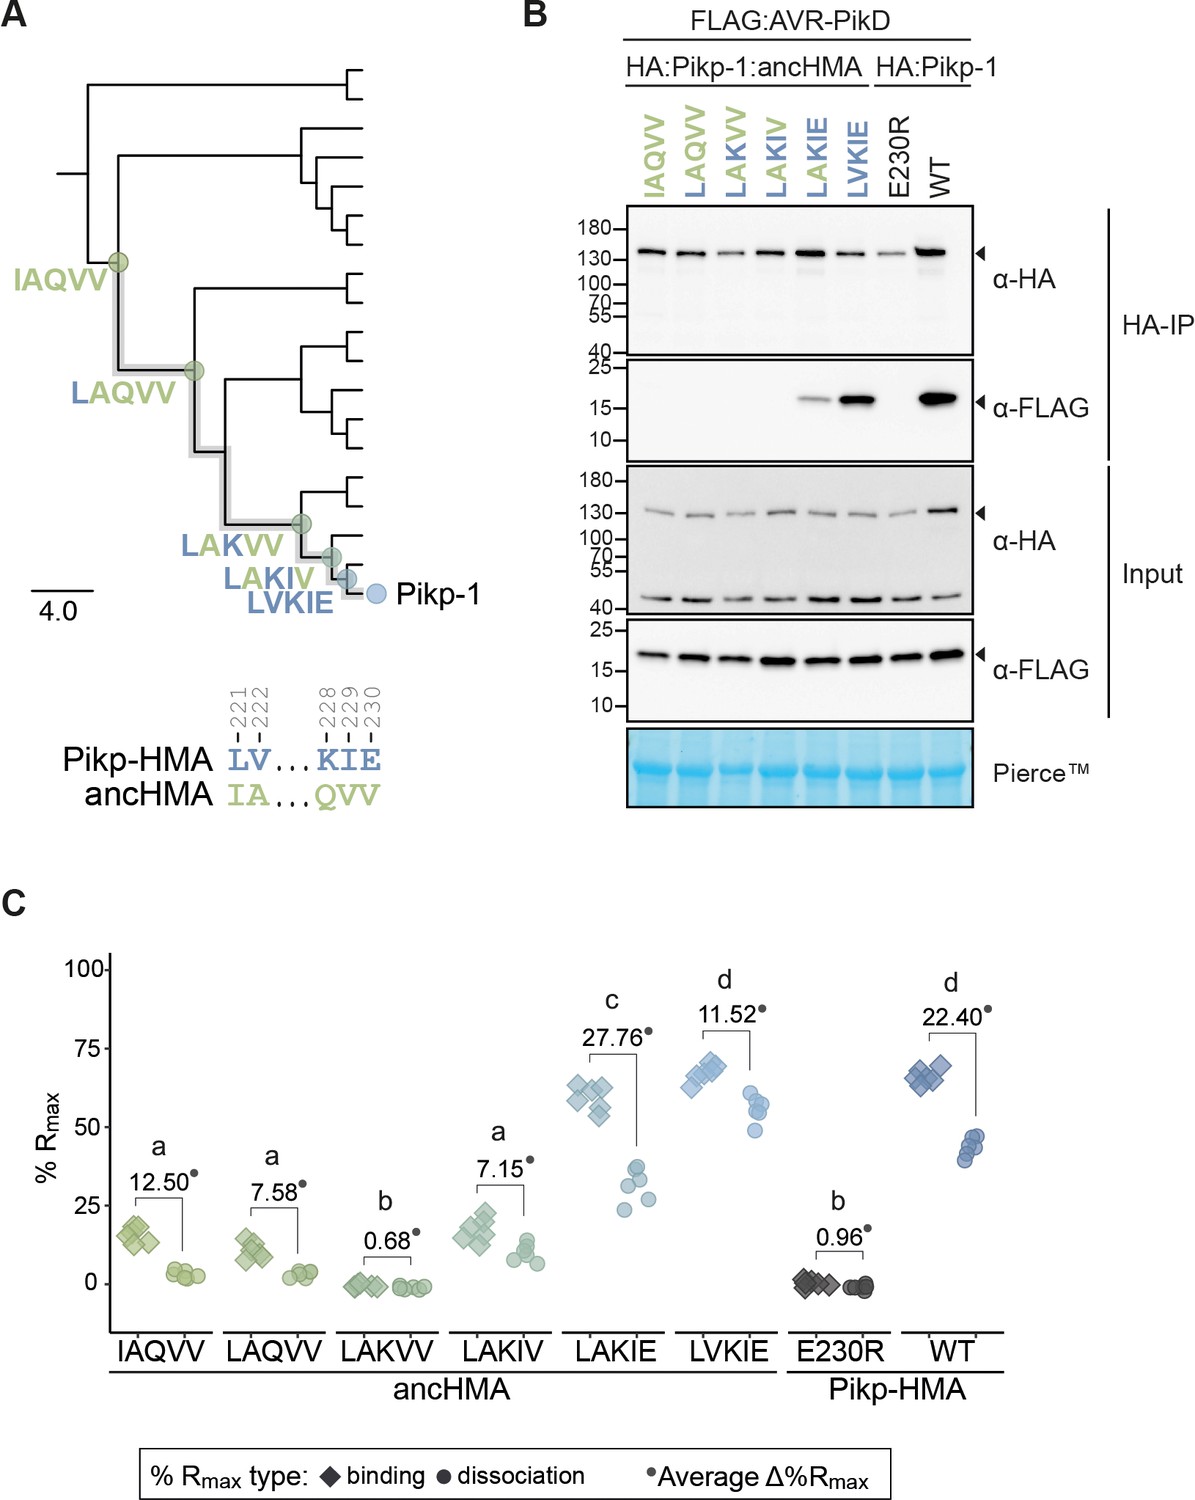
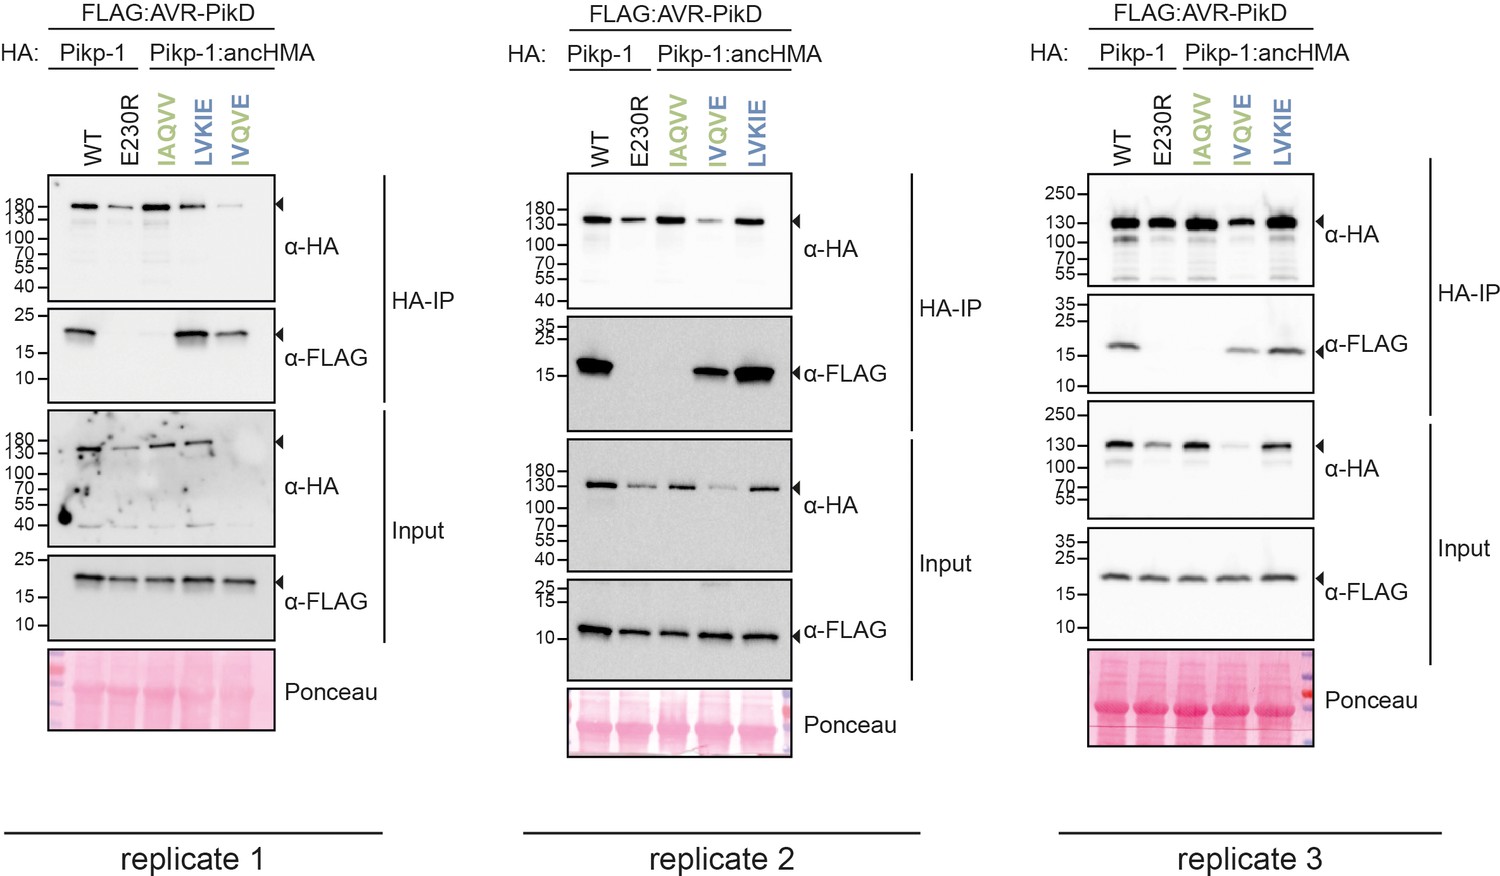
The AV-VE substitutions within the IAQVV/LVKIE region of ancestral HMA (ancHMA) increase binding to AVR-PikD.
(A) Schematic representation of a neighbour joining (NJ) phylogenetic tree of the heavy metal-associated (HMA) domain from Oryza spp. (shown in Figure 3—figure supplement 2). The scale bar indicates the evolutionary distance based on the number of base substitutions per site. Historical mutations in the IAQVV/LVKIE region acquired over the course of Pikp-HMA evolution are shown next to the appropriate nodes. The mutations are colour-coded to match the ancestral (green) and present-day (blue) states. (B) Co-immunoprecipitation (Co-IP) experiment illustrating in planta association of AVR-PikD (N-terminally tagged with FLAG) with Pikp-1 and Pikp-1:ancHMA (N-terminally tagged with HA), labelled above. Wild-type (WT) HA:Pikp-1 and HA:Pikp-1E230R proteins were used as a positive and negative control, respectively. Immunoprecipitates (HA-IP) obtained with anti-HA probe and total protein extracts (input) were immunoblotted with appropriate antibodies (listed on the right). Loading control, featuring Rubisco, was performed using Pierce staining. The arrowheads indicate expected band sizes. Three independent replicates of this experiment are shown in Figure 5—figure supplement 2. (C) Plot illustrating calculated percentage of the theoretical maximum response (%Rmax) values for interaction of HMA analytes, labelled below, with AVR-PikD ligand (featuring C-terminal HIS tag) determined using surface plasmon resonance. %Rmax was normalised for the amount of ligand immobilised on the NTA-sensor chip. The chart summarises the results obtained for HMA analytes at 400 nM concentration from three independent experiments with two internal repeats. Three different concentrations of the analytes (400 nM, 200 nM, 50 nM) were tested; results for the 200 nM and 50 nM concentrations are shown in Figure 5—figure supplement 4. Average Δ%Rmax (•) values represent absolute differences between values for ‘binding’ and ‘dissociation’, calculated from the average values for each sample, and serve as an off-rate approximate. Statistical differences among the samples were analysed with Tukey’s honest significant difference (HSD) test (p<0.01); p-values for all pairwise comparisons are presented in Supplementary file 1I.
-
Figure 5—source data 1
Raw data of Pikp-ancHMA Rmax SPR.
- https://cdn.elifesciences.org/articles/66961/elife-66961-fig5-data1-v1.xlsx
Figure 5—figure supplement 1
Co-immunoprecipitation experiment between AVR-PikD and the two plausible historical states of the IAQVV/LVKIE region within Pikp-HMA.
In planta association of AVR-PikD (N-terminally tagged with FLAG) Pikp-1, Pikp-1E230R, Pikp-1:ancHMA, and Pikp-1:ancHMA mutants (N-terminally tagged with HA), labelled above. Wild-type (WT) HA:Pikp-1 and HA:Pikp-1E230R, with HA tag, were used as a positive and negative control, respectively. Immunoprecipitates (HA-IP) obtained using anti-HA probe and total protein extracts (input) were immunoblotted with the appropriate antisera labelled on the right. Arrowheads indicate expected band sizes. Loading controls, featuring Rubisco, were performed using Pierce or Ponceau staining solutions. The figure shows the results from two independent experiments.
Figure 5—figure supplement 2
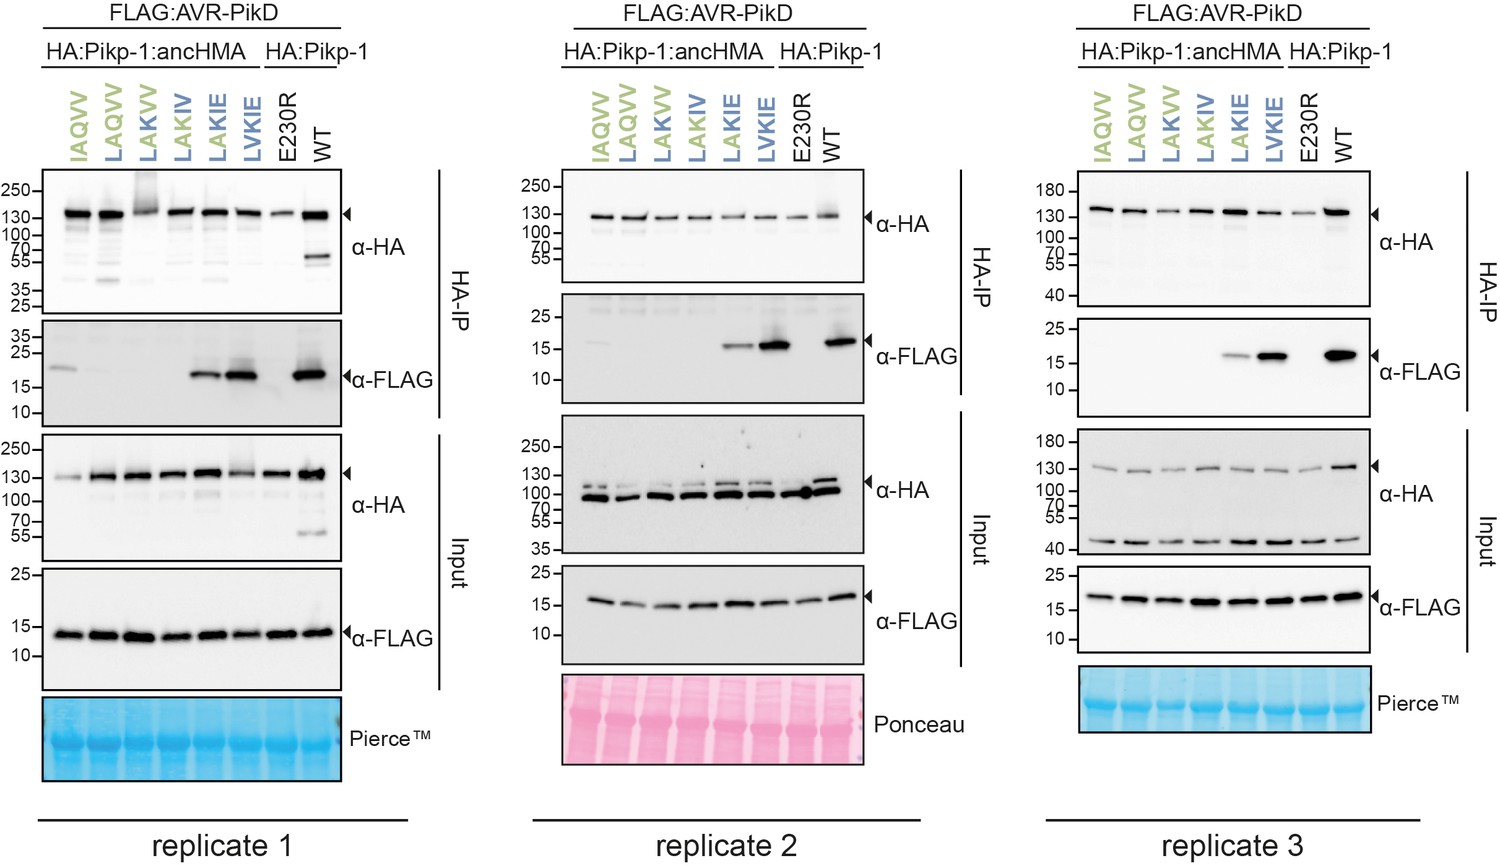
Replicates of the co-immunoprecipitation (co-IP) experiments between the Pikp-1:ancHMA IAQVV/LVKIE mutants and AVR-PikD.
In planta association of AVR-PikD (N-terminally tagged with FLAG) with Pikp-1, Pikp-1E230R, Pikp-1:ancHMA, and Pikp-1:ancHMA mutants (N-terminally tagged with HA), labelled above. Wild-type (WT) Pikp-1 and Pikp-1E230R were used as a positive and negative control, respectively. Proteins obtained by co-IP with HA-probe (HA-IP) and total protein extracts (input) were immunoblotted with the appropriate antisera labelled on the right. Rubisco loading controls were conducted using Pierce or Ponceau staining solutions. Arrowheads demonstrate expected band sizes. The figure shows the results from three independent experiments.
Figure 5—figure supplement 3
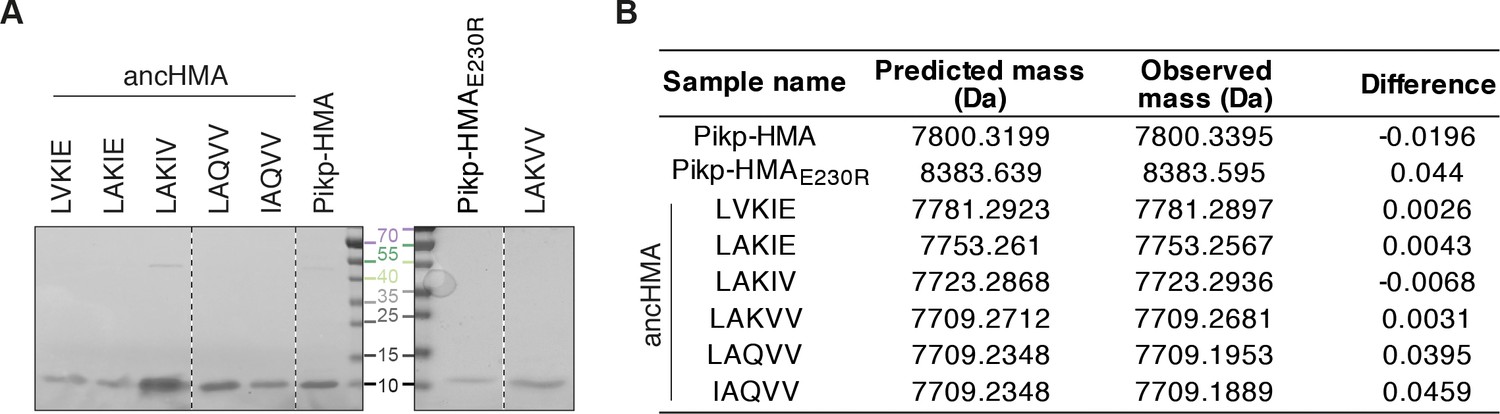
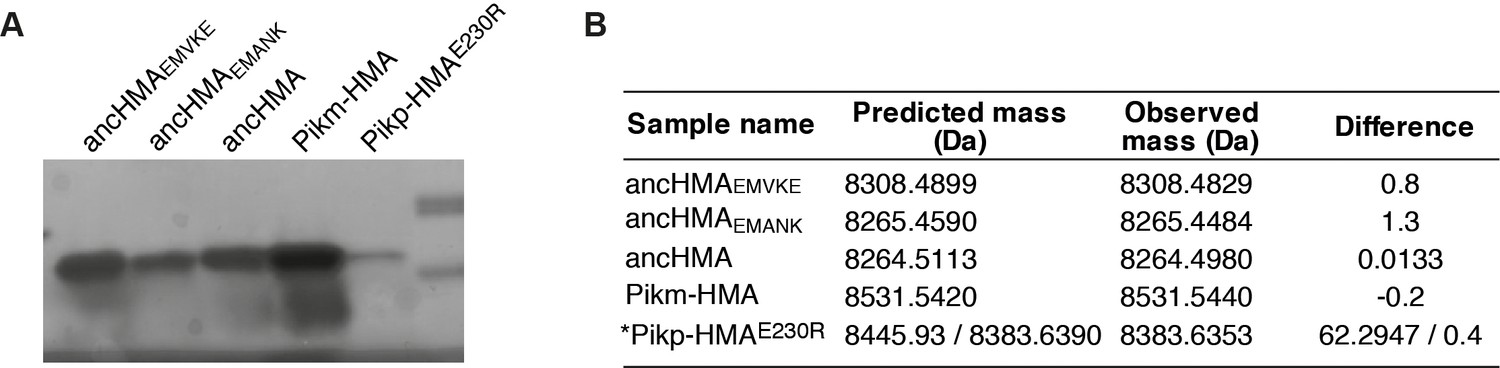
Purified proteins used in surface plasmon resonance studies.
(A) Coomassie Brilliant Blue-stained SDS-PAGE gel showing purified heavy metal-associated (HMA) proteins used in in vitro experiments. Dashed lines signify different components of the same gel. (B) Table summarising intact masses (monoisotopic) of proteins from (A).
Figure 5—figure supplement 4

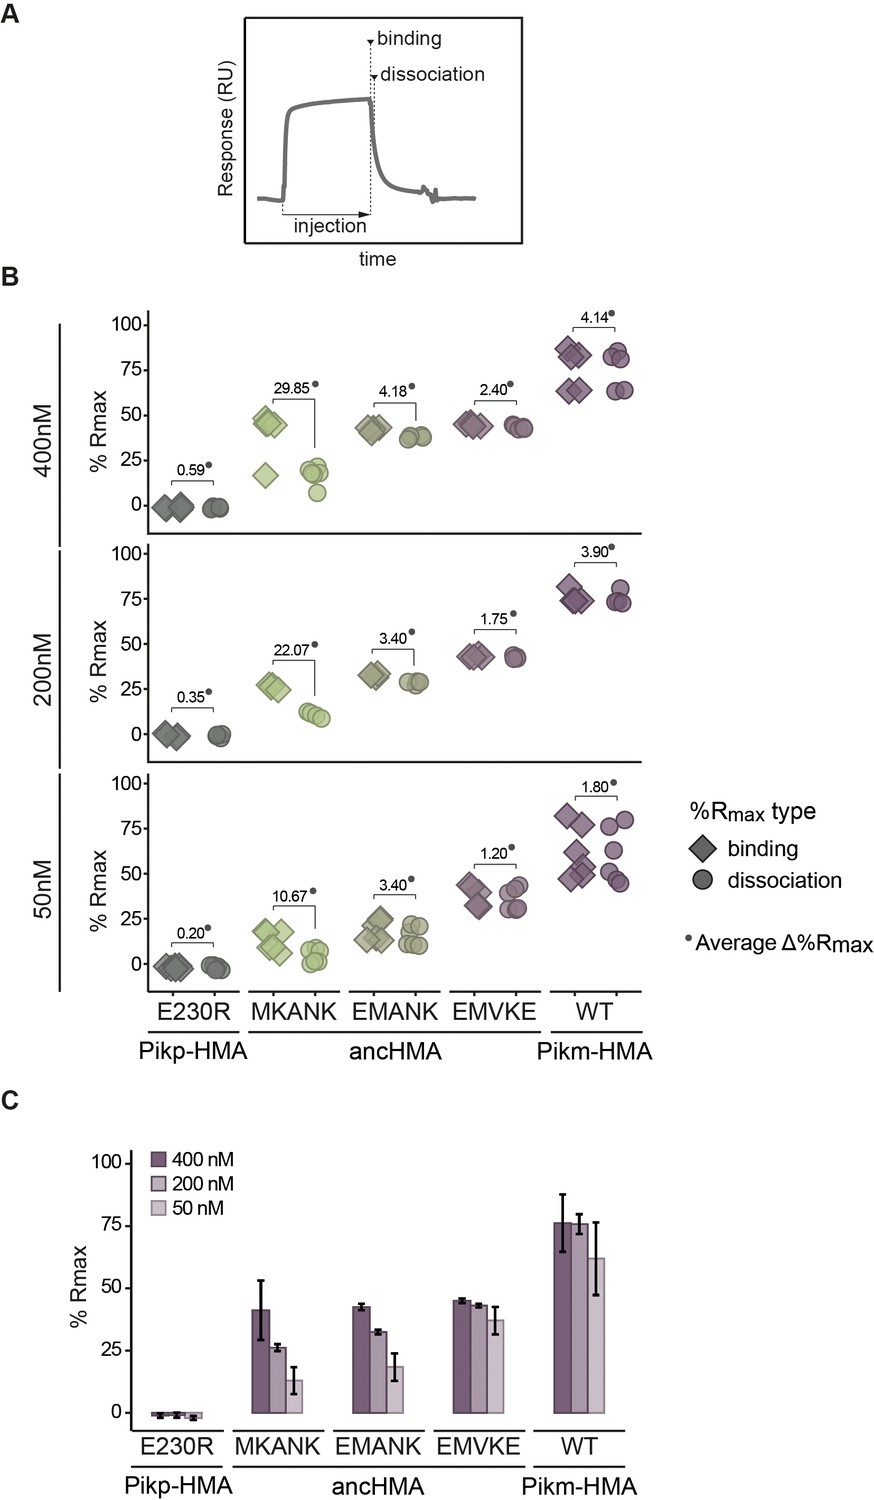
Surface plasmon resonance (SPR) results show the effect of the IAQVV-LVKIE mutations on the AVR-PikD binding, as indicated by %Rmax.
(A) Schematic representation of the SPR sensorgrams showcasing the measurements taken to monitor binding dynamics: ‘binding’ and ‘dissociation’. (B) Plots illustrating calculated percentage of the theoretical maximum response values (%Rmax) for interaction of the heavy metal-associated (HMA) analytes, labelled below, with AVR-PikD ligand (C-terminally tagged with HIS). %Rmax was normalised for the amount of ligand immobilised on the NTA-sensor chip. The HMA analytes were tested at three different concentrations, indicated on the left, in three independent experiments with two internal replicates. All data points are represented as diamonds or circles. Average Δ%Rmax (•) values represent absolute differences between values for ‘binding’ and ‘dissociation’, calculated from the average values for each sample, and serve as an off-rate approximate. Statistical differences among the samples were analysed with ANOVA and Tukey’s honest significant difference (HSD) test (p<0.01); p-values for all pairwise comparisons are presented in Supplementary file 1I.
Figure 5—figure supplement 5
The AV-VE (Ala-222-Val and Val-230-Glu) substitutions are sufficient to increase binding affinity towards the AVR-PikD effector in co-immunoprecipitation (co-IP).
Co-IP experiments between AVR-PikD (N-terminally tagged with FLAG) and Pikp-1 and Pikp-1:ancHMA constructs (N-terminally tagged with HA), labelled above. Wild-type (WT) HA:Pikp-1 and HA:Pikp-1E230R mutant were used as a positive and negative control, respectively. Immunoprecipitates (HA-IP) obtained using anti-HA resin and total protein extracts (input) were immunoblotted with the appropriate antisera labelled on the right. Loading control, featuring Rubisco, was performed using Ponceau staining. The black arrowheads point to expected band sizes. The figure shows the results from three independent experiments.
Figure 6 with 6 supplements
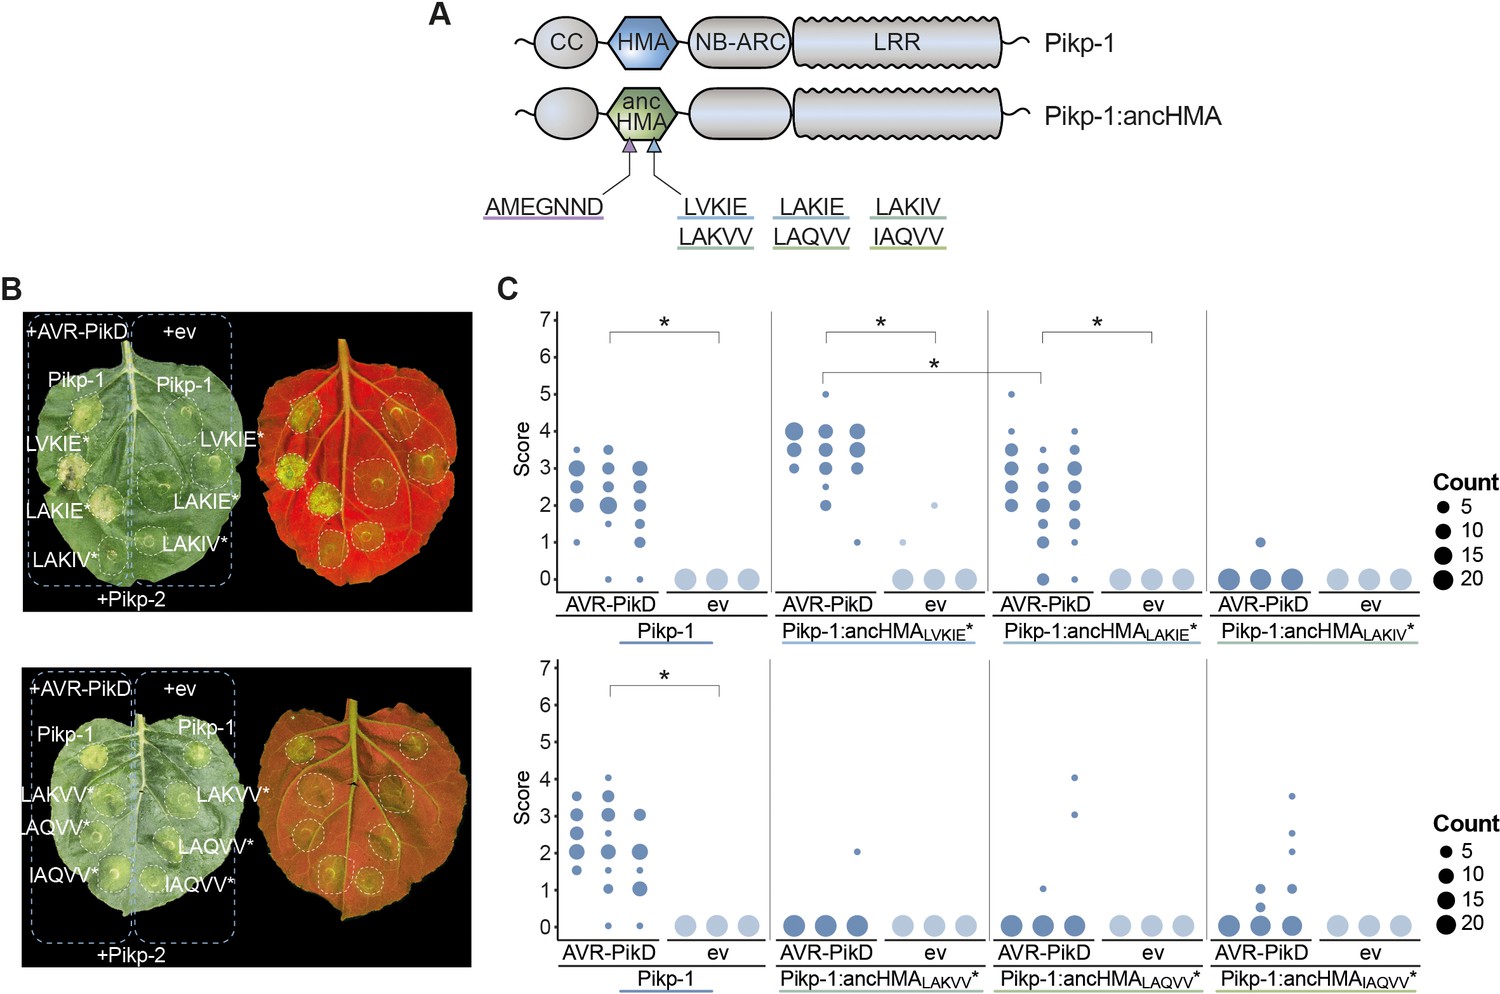
Pikp-1:ancHMALVKIE* and Pikp-1:ancHMALAKIE* mediate immune response towards the AVR-PikD effector.
(A) Schematic representation of wild-type Pikp-1 and Pikp-1:ancHMA fusions used in the assay. The mutated regions are presented with arrowheads and listed. (B) Representative images of hypersensitive response (HR) cell death assay after transient co-expression of the Pikp-1:ancHMA* mutants (C-terminally tagged with HF) with AVR-PikD (N-terminally tagged with Myc) and Pikp-2 (C-terminally tagged with HA). Empty vector (ev) was used as a negative control. All constructs were co-expressed with the gene silencing suppressor p19 (Win and Kamoun, 2003). The leaves were photographed 5 days after infiltration under daylight (left) and UV light (right). (C) HR was scored at 5 days post-agroinfiltration. The results are presented as dot plots, where the size of a dot is proportional to the number of samples with the same score (count) within the same biological replicate. The experiment was independently repeated at least three times with 23–24 internal replicates; the columns within tested conditions (labelled on the bottom) correspond to results from different biological replicates. Significant differences between relevant conditions are marked with an asterisk (*); details of the statistical analysis are summarised in Figure 6—figure supplement 5.
-
Figure 6—source data 1
Hypersensitive response scores for IAQVV to LVKIE mutations in Pikp-HMA.
- https://cdn.elifesciences.org/articles/66961/elife-66961-fig6-data1-v1.xlsx
Figure 6—figure supplement 1

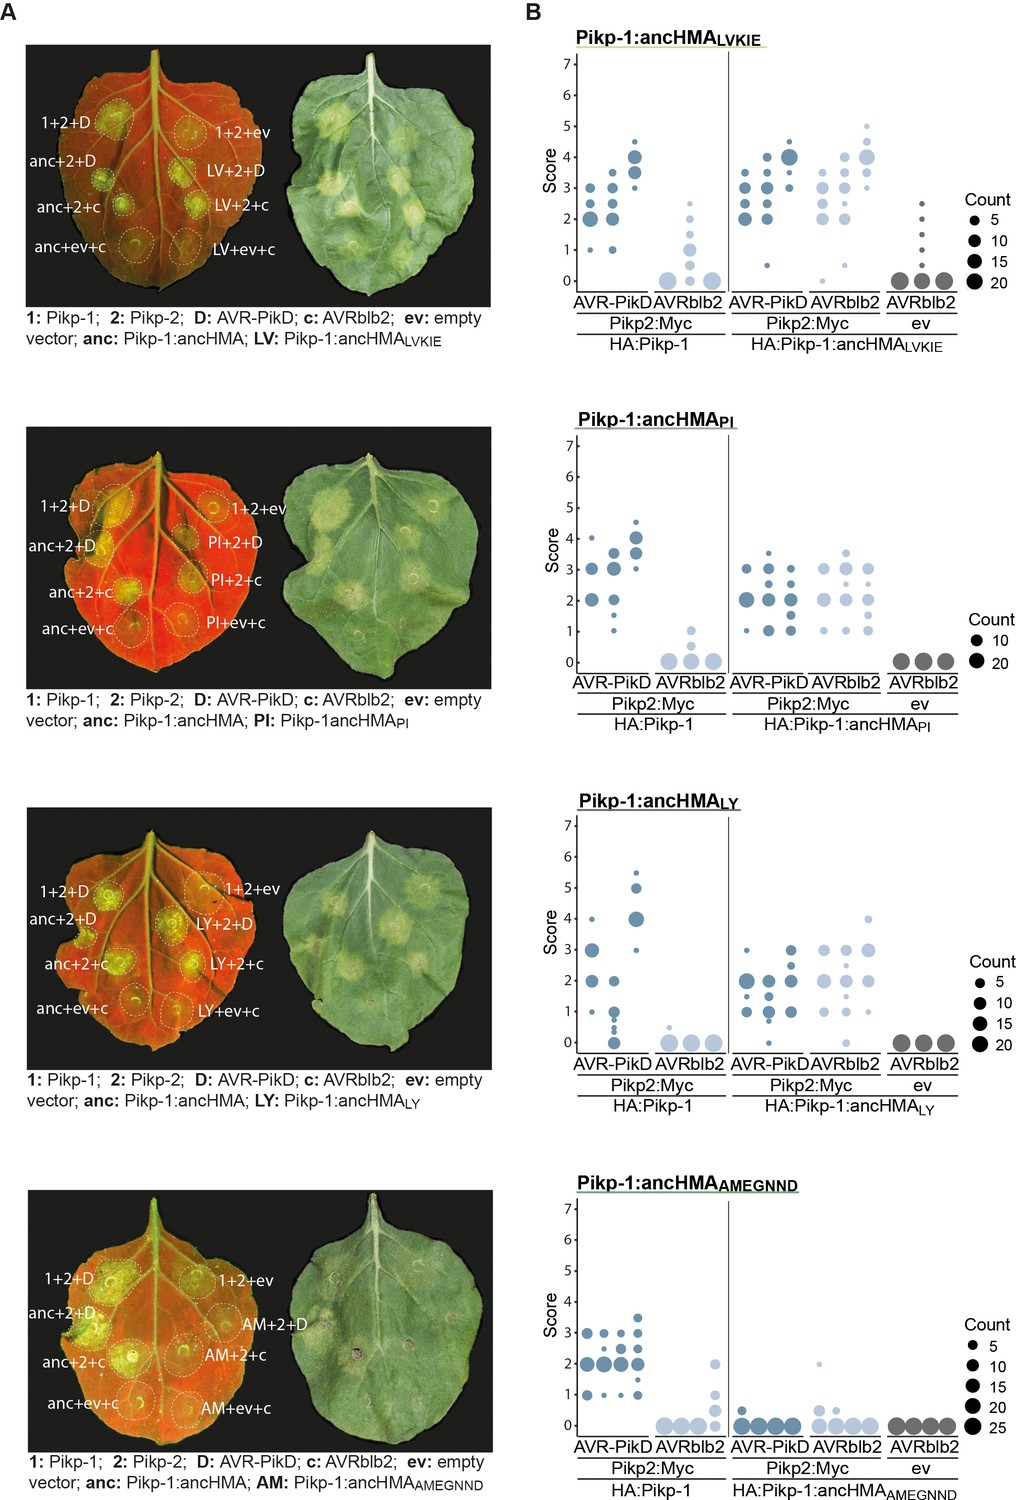
Pikp-1:ancHMA fusions are autoactive in a Pikp-2-dependent manner.
Hypersensitive response (HR) assay after transient co-expression of Pikp-1:HMA variants (N-terminally tagged with HA) with AVR-PikD (N-terminally tagged with FLAG) and Pikp-2 (C-terminally tagged with Myc). AVRblb2 and the empty vector (ev) were used as negative controls. (A) Representative N. benthamiana leaves infiltrated with samples (labelled next to the infiltration spot) were photographed 5 days post infiltration under UV (left) and daylight (right). (B) HR was scored 5 days after agroinfiltration. The results are presented as dots plot, where the size of a dot is proportional to the number of samples with the same score (count) within the same replicate. The experiment was repeated at least three times with 22–26 internal replicates; the columns within tested conditions (labelled on the bottom) show results from different biological replicates. The statistical analyses of these results are presented in Figure 6—figure supplement 2.
-
Figure 6—figure supplement 1—source data 1
Hypersensitive response scores used in Figure 6—figure supplement 1.
- https://cdn.elifesciences.org/articles/66961/elife-66961-fig6-figsupp1-data1-v1.xlsx
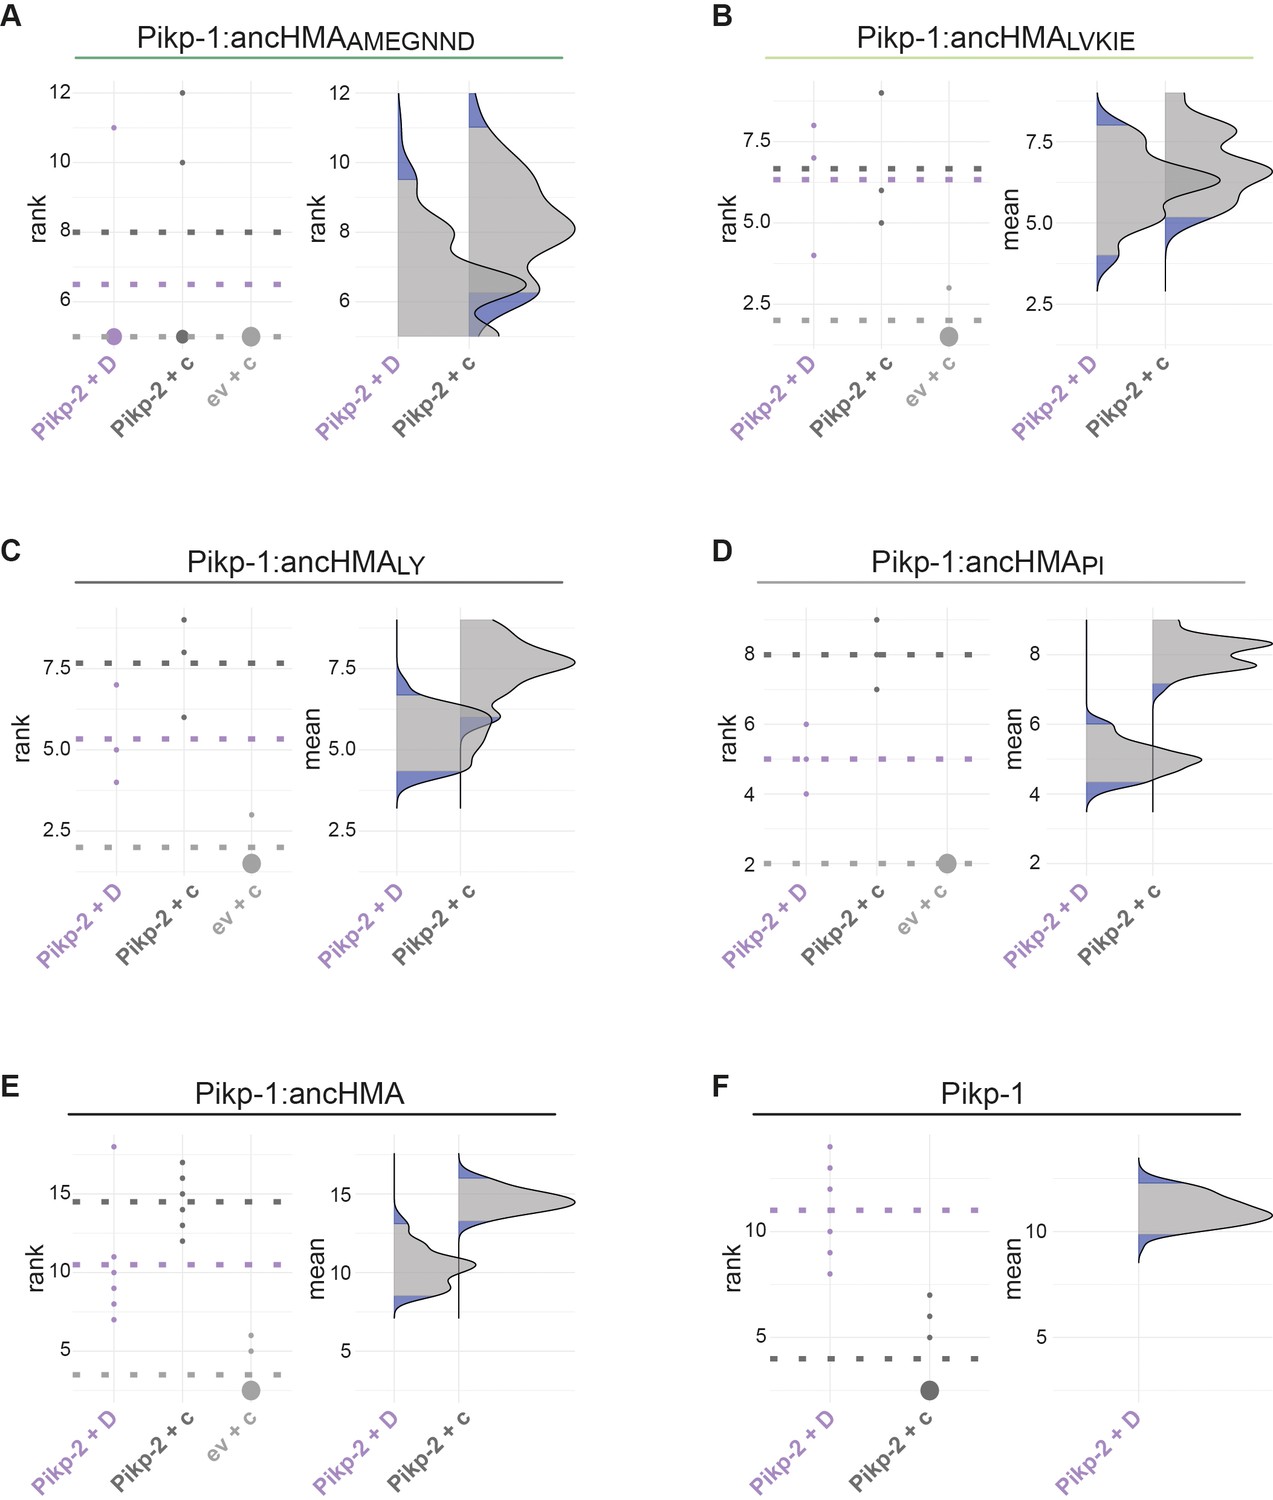
Figure 6—figure supplement 2
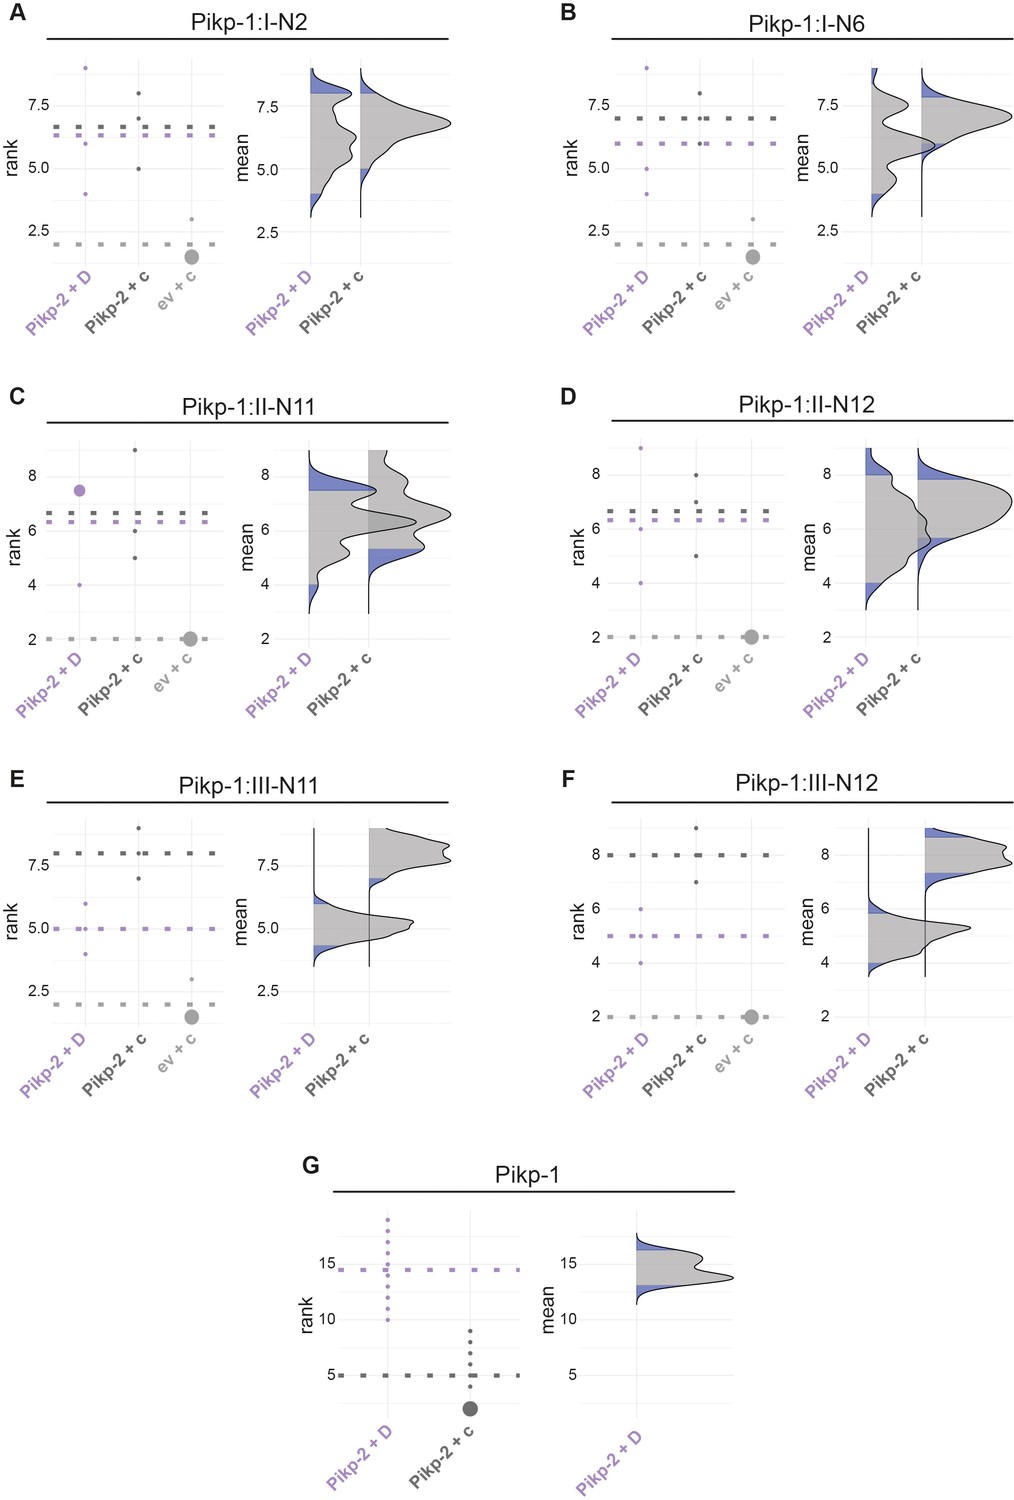
Statistical analysis of hypersensitive response cell death for the Pikp-1:ancHMA fusions.
The statistical analysis was conducted using an estimation method using besthr R library (MacLean, 2019). (A–G) Each panel corresponds to a different Pikp-1:ancHMA fusion (labelled above), co-expressed with Pikp-2 and AVR-PikD (Pikp-2 + D), Pikp-2 and AVRblb2 (Pikp-2 + c), or empty vector and AVRblb2 (ev + c). AVRblb2 and empty vector were used as controls. The left panels represent the ranked data (dots) and their corresponding mean (dashed line), with the size of a dot proportional to the number of observations with that specific value. The panels on the right show the distribution of 1000 bootstrap sample rank means, with the blue areas illustrating the 0.025 and 0.975 percentiles of the distribution. The difference is considered significant if the ranked mean for a given condition falls within or beyond the blue percentile of the mean distribution for another condition.
Figure 6—figure supplement 3
The AMEGNND mutations within ancestral HMA (ancHMA) abolish autoactivity.
Hypersensitive response (HR) assay after transient co-expression of Pikp-1:HMA mutants (N-terminally tagged with HA) with AVR-PikD (N-terminally tagged with FLAG) and Pikp-2 (C-terminally tagged with Myc). AVRblb2 and the empty vector (ev) were used as negative controls. (A) Representative N. benthamiana leaves infiltrated with appropriate constructs (labelled next to the infiltration spot) were photographed 5 days post-infiltration under UV (left) and daylight (right). (B) HR was scored 5 days after agroinfiltration. The results are presented as dot plots where the size of a dot is proportional to the number of samples with the same score (count) within the same biological replicate. The experiment was independently repeated at least three times with 20–28 internal replicates; the columns within tested conditions (labelled on the bottom) illustrate results from different biological replicates. The statistical analyses of these results are presented in Figure 6—figure supplement 4.
-
Figure 6—figure supplement 3—source data 1
Hypersensitive response scores used in Figure6—figure supplement 3.
- https://cdn.elifesciences.org/articles/66961/elife-66961-fig6-figsupp3-data1-v1.xlsx
Figure 6—figure supplement 4
Statistical analysis of cell death assay for the Pikp-1:ancHMA chimeras.
The statistical analysis was carried out using an estimation method implemented in besthr R library (MacLean, 2019). (A–F) Each panel corresponds to a different chimera of Pikp-1:ancHMA (labelled above), co-expressed with Pikp-2 and AVR-PikD (Pikp-2 + D), Pikp-2 and AVRblb2 (Pikp-2 + c), or empty vector and AVRblb (ev + c). AVRblb2 and empty vector were used as controls. The left panels represent the ranked data (dots) and their corresponding mean (dashed line), with the size of a dot proportional to the number of observations with that specific value. The panels on the right show the distribution of 1000 bootstrap sample rank means, with the blue areas corresponding to the 0.025 and 0.975 percentiles of the distribution. The difference is considered statistically significant if the ranked mean for a given condition falls within or beyond the blue percentile of the mean distribution for another condition.
Figure 6—figure supplement 5
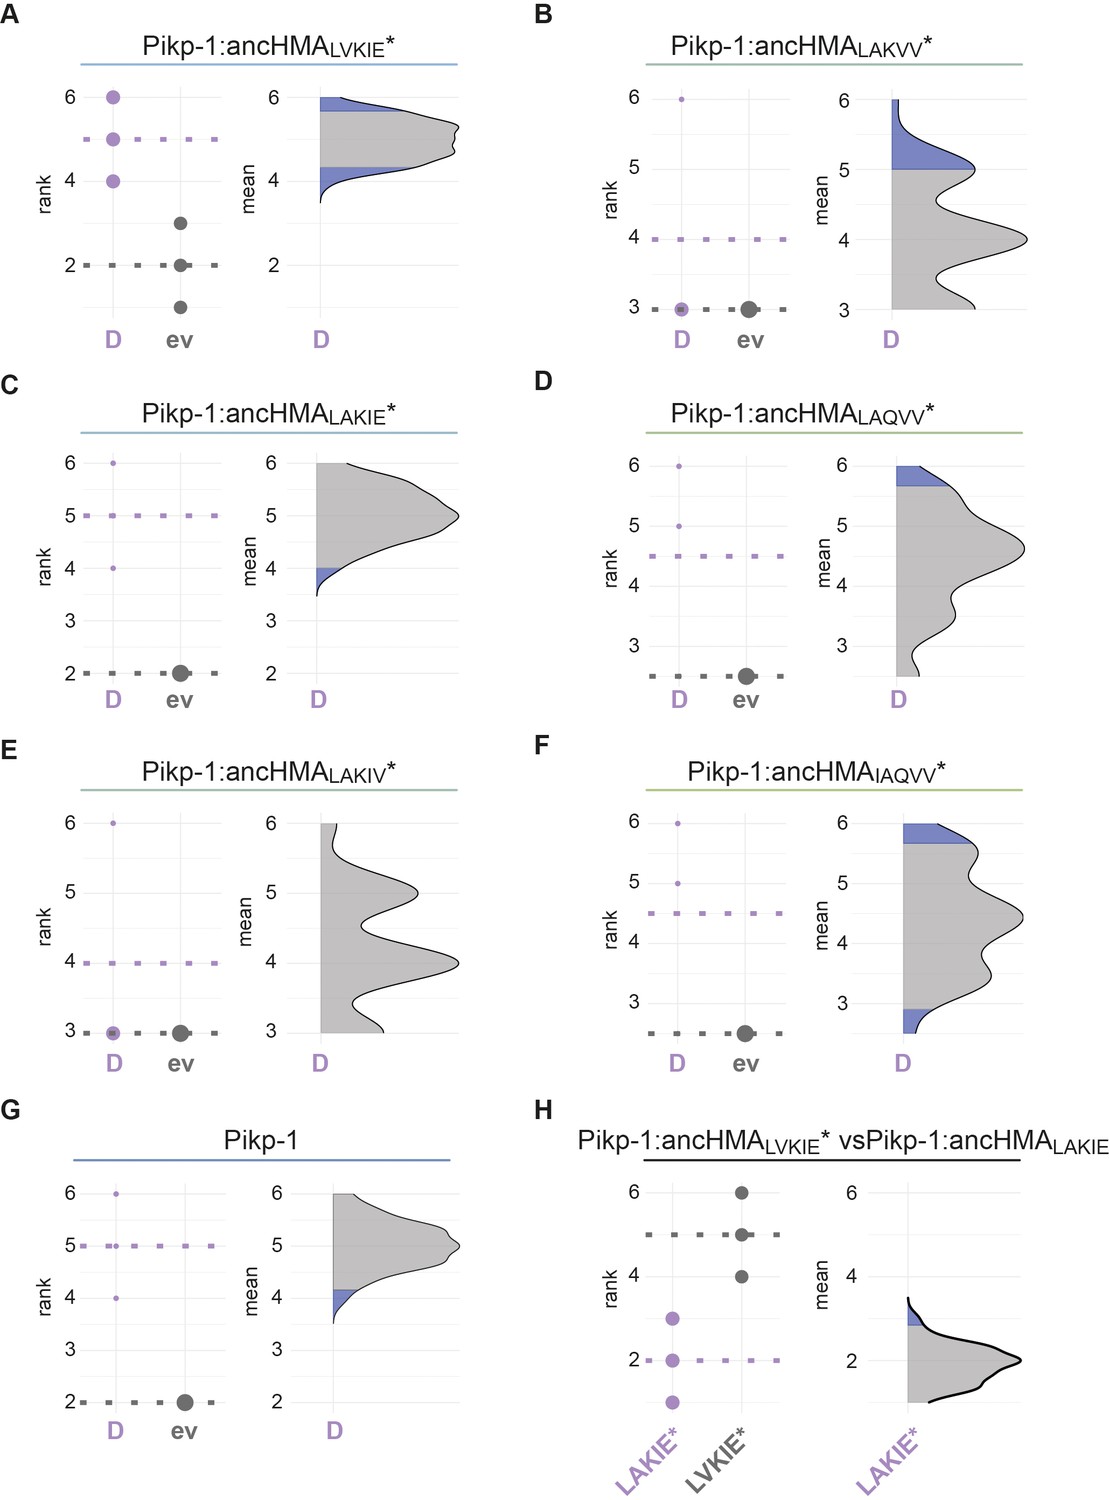
Statistical analysis of cell death for the Pikp-1:ancHMA mutants within the IAQVV/LVKIE region.
The statistical analysis was performed using an estimation method implemented in besthr R library (MacLean, 2019). (A–G) Each panel corresponds to a different Pikp-1:ancHMA* mutant co-expressed with AVR-PikD (D) or empty vector (ev). All the constructs were co-expressed with Pikp-2. The left panels represent the ranked data (dots) and their corresponding mean (dashed line). The size of a dot centre is proportional to the number of observations with that specific value. The panels on the right show the distribution of 1000 bootstrap sample rank means, with the blue areas illustrating the 0.025 and 0.975 percentiles of the distribution. The difference is considered significant if the ranked mean for the co-expression with AVR-PikD falls within or beyond the blue percentile of the mean distribution for co-expression with the empty vector. (H) Statistical analysis by the estimation method of Pikp:ancHMALVKIE* (LVKIE*) and Pikp:ancHMALAKIE* (LAKIE*) co-expressed with AVR-PikD and Pikp-2 analysed as in (A–G).
Figure 6—figure supplement 6
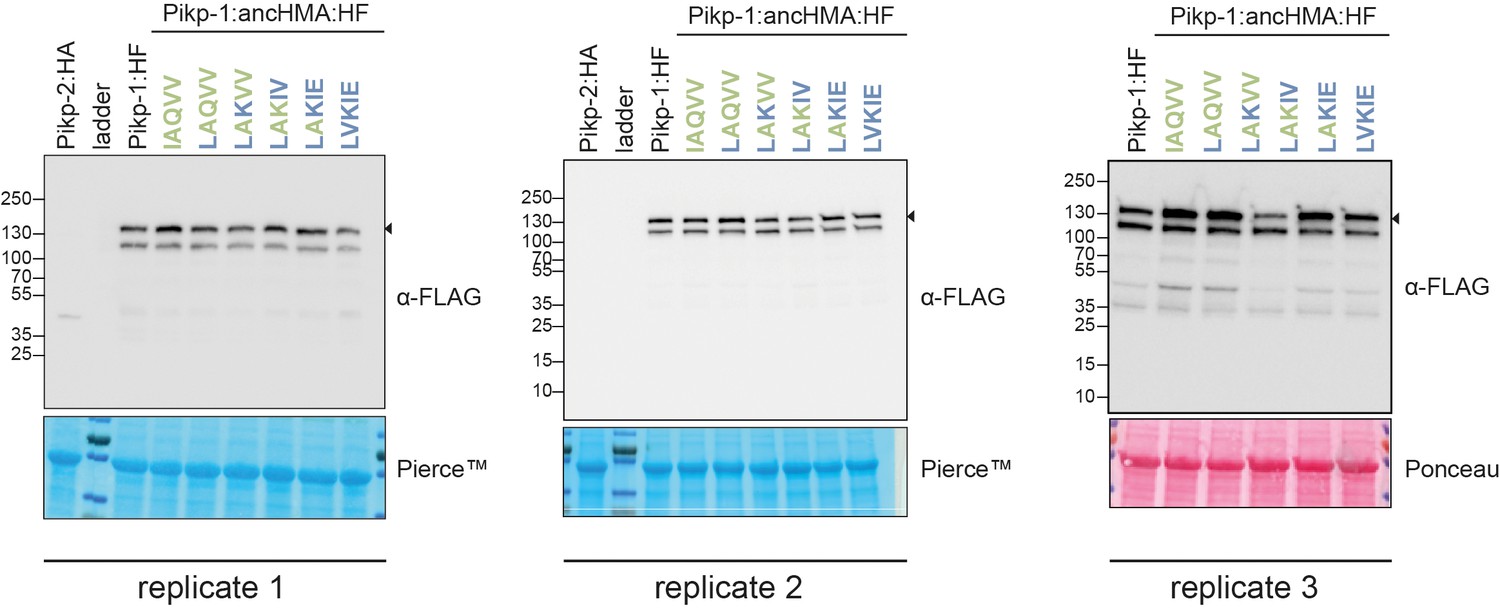
In planta accumulation of the Pikp-1:ancHMA* mutants in the IAQVV/LVKIE region.
Western blot experiments of the Pikp-1:ancHMA* mutants (C-terminally tagged with HF) labelled above. Pikp-2 (C-terminally tagged with HA) was included as a negative control. Proteins were immunoblotted with the FLAG antisera (labelled on the right). Rubisco loading control was performed using Pierce or Ponceau staining solutions. The black arrowheads indicate expected band size. The figure shows the results from three independent experiments.
Figure 7 with 2 supplements
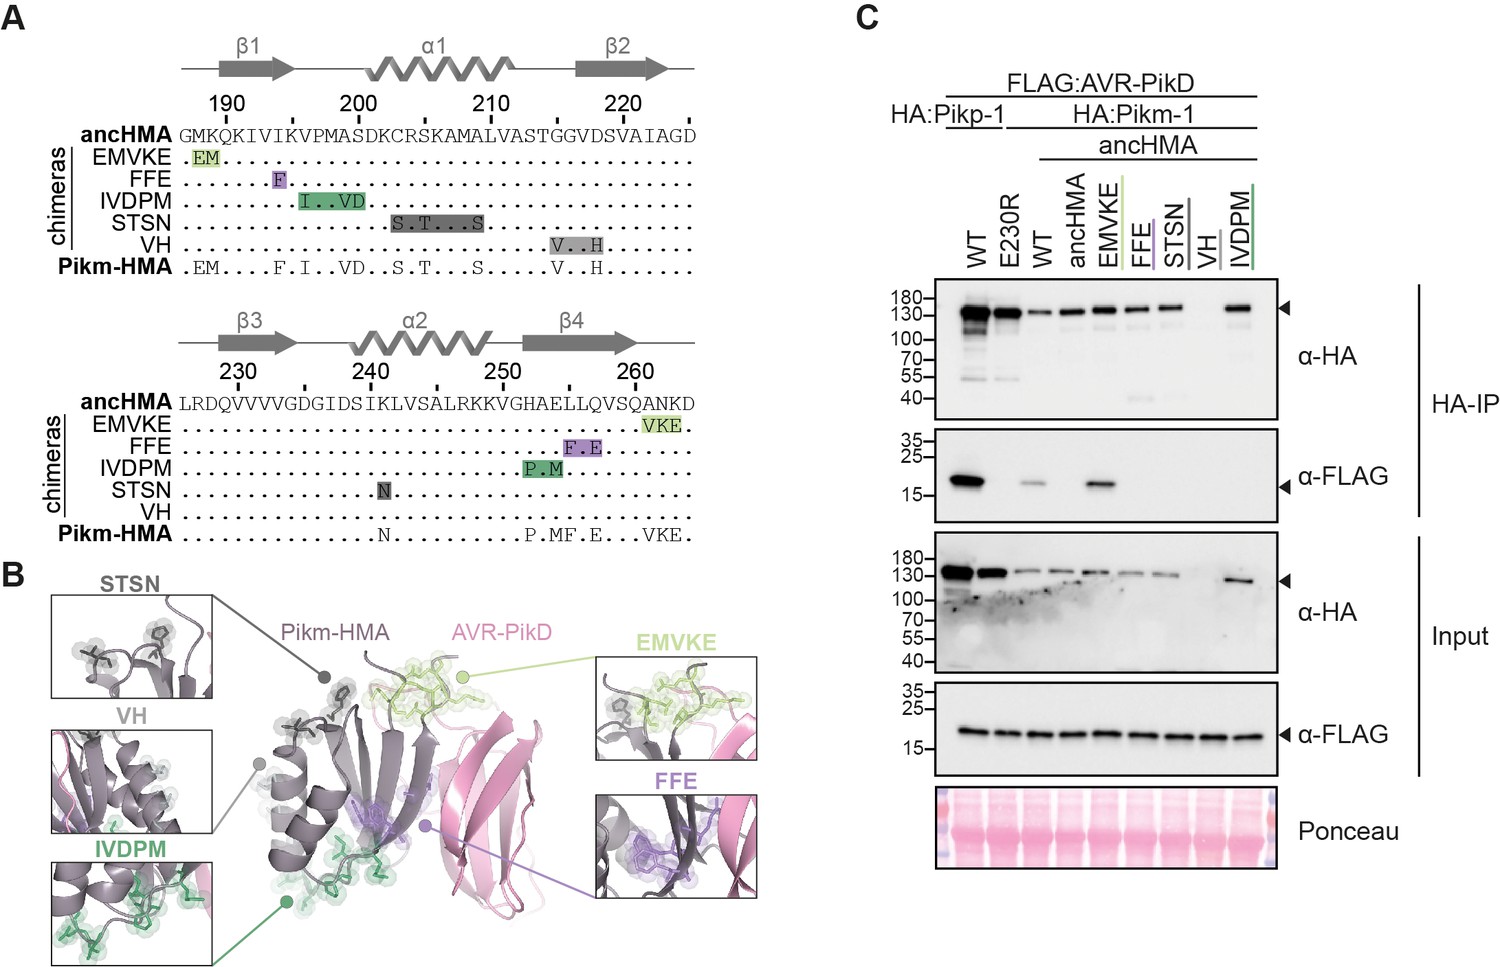
The MKANK/EMVKE region of the heavy metal-associated (HMA) domain of Pikm-1 determines high-affinity AVR-PikD binding.
(A) Protein sequence alignment between the ancestral HMA (ancHMA), Pikm-HMA, and Pikm–ancHMA chimeras. The protein model above the alignment depicts Pikm-HMA secondary structure. The colour-coded rectangles mark polymorphic regions used for chimeric swaps. (B) Schematic representation of the Pikm-HMA domain (purple) in complex with AVR-PikD (pink) (De la Concepcion et al., 2018), with polymorphic regions between Pikm-HMA and ancHMA colour-coded as in (A). The molecular surfaces of the polymorphic residues are also shown. (C) EMVKE substitutions in the ancHMA restore in planta association with AVR-PikD. Co-immunoprecipitation experiment between AVR-PikD (N-terminally tagged with FLAG) and Pikp-1:ancHMA chimeras (N-terminally tagged with FLAG), labelled above. Wild-type (WT) Pikp-1/Pikm-1 and Pikp-1E230R were used as positive and negative controls, respectively. Immunoprecipitates (HA-IP) obtained with anti-HA probe and total protein extracts (input) were immunoblotted with the appropriate antisera (labelled on the right). Rubisco loading control was carried out using Ponceau staining. Arrowheads indicate expected band sizes. Three independent replicates of this experiment are shown in Figure 7—figure supplement 2.
Figure 7—figure supplement 1
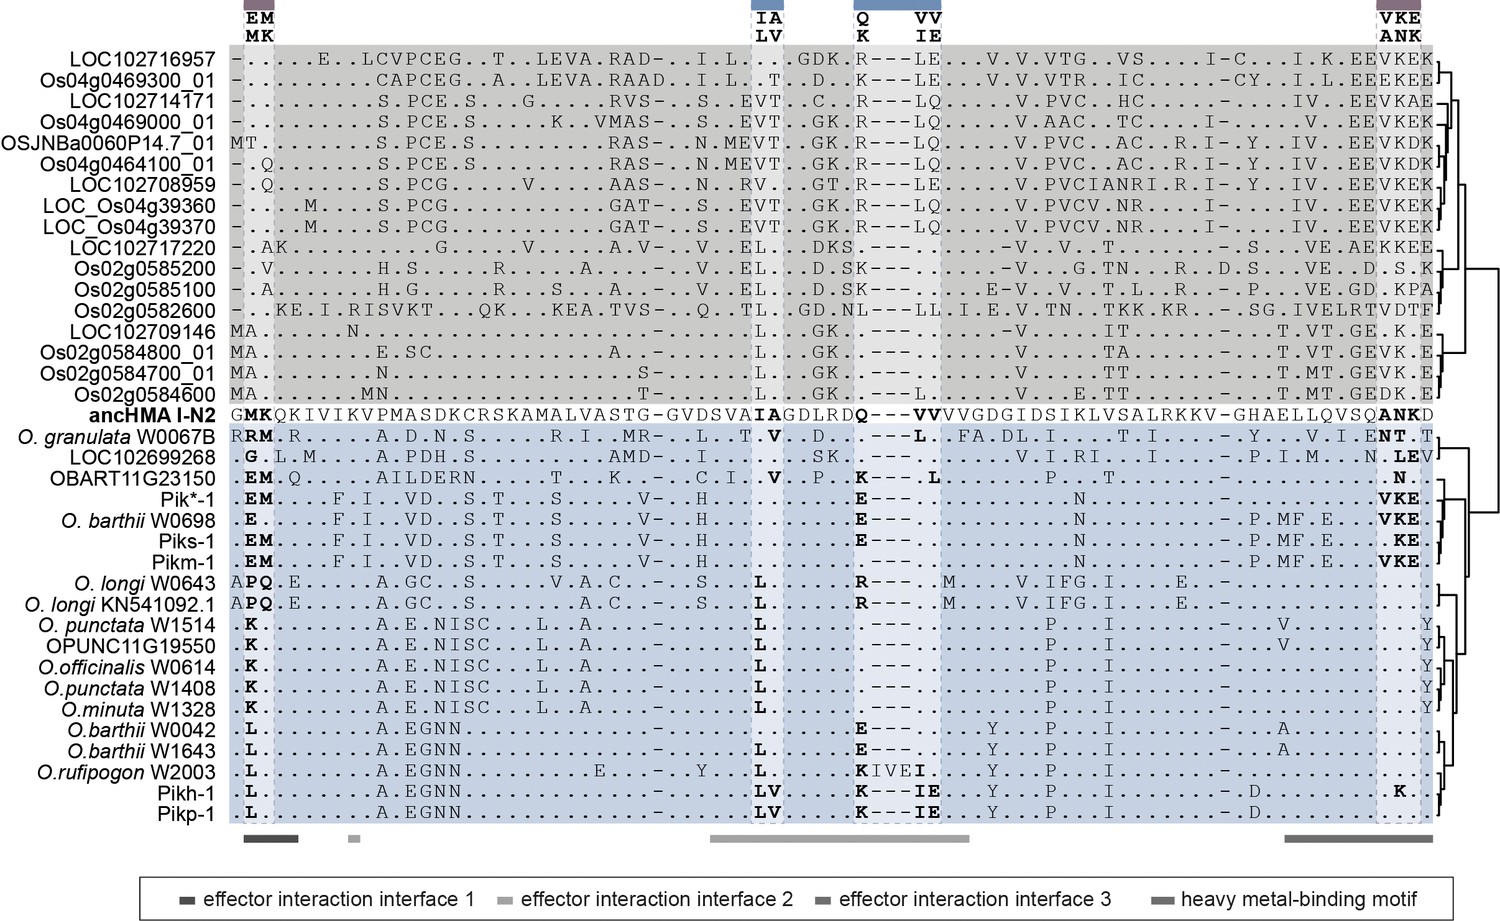
Protein sequence alignment of the heavy metal-associated (HMA) domain from the Oryza spp.
Sequences of the K-type Pik-1-integrated HMA domains (blue), non-integrated HMAs from O. sativa and O. brachyantha (grey), and I-N2 ancHMA (bold) were aligned using MUSCLE (Edgar, 2004). Regions with known function are marked with horizontal lines at the bottom. The MKANK/EMVKE and IAQVV/LVKIE regions are marked above.
Figure 7—figure supplement 2
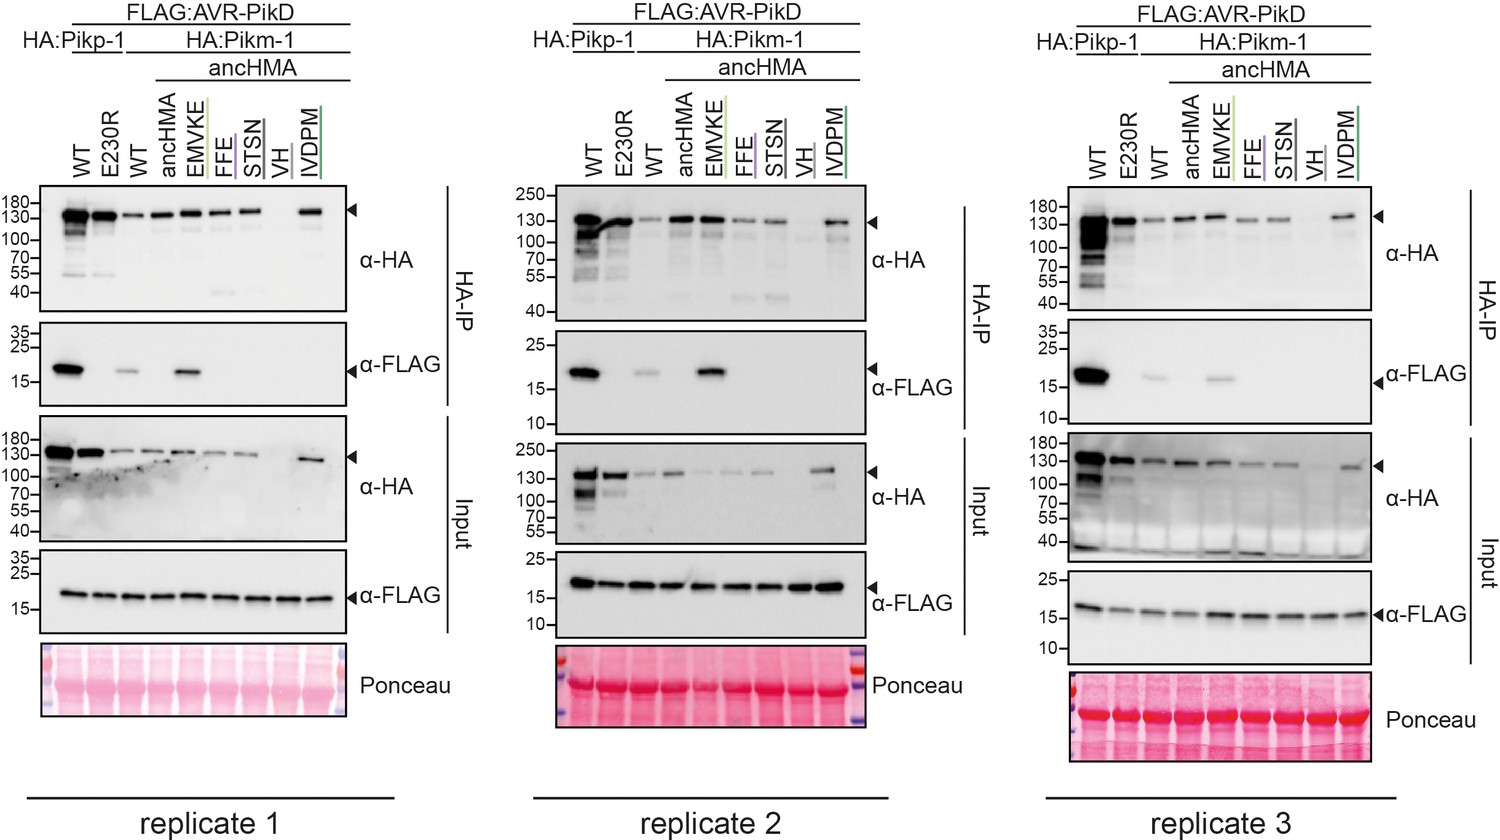
Replicates of the co-immunoprecipitation (co-IP) experiment between the Pikm-1:ancHMA chimeras and AVR-PikD.
In planta association of AVR-PikD (N-terminally tagged with FLAG) with Pikp-1, Pikp-1E230R, Pikm-1, Pikm-1:ancHMA, and Pikm-1:ancHMA chimeras (N-terminally tagged with HA), labelled above. Wild-type (WT) Pikp-1/Pikm-1 and Pikp-1E230R were used as positive and negative controls, respectively. Immunoprecipitate (HA-IP) obtained by co-IP with anti-HA probe and total protein extracts (input) were immunoblotted with the appropriate antisera labelled on the right. Arrowheads indicate expected band sizes. Rubisco loading controls were performed using Ponceau staining. The figure presents the results from three independent experiments.
Figure 8 with 5 supplements
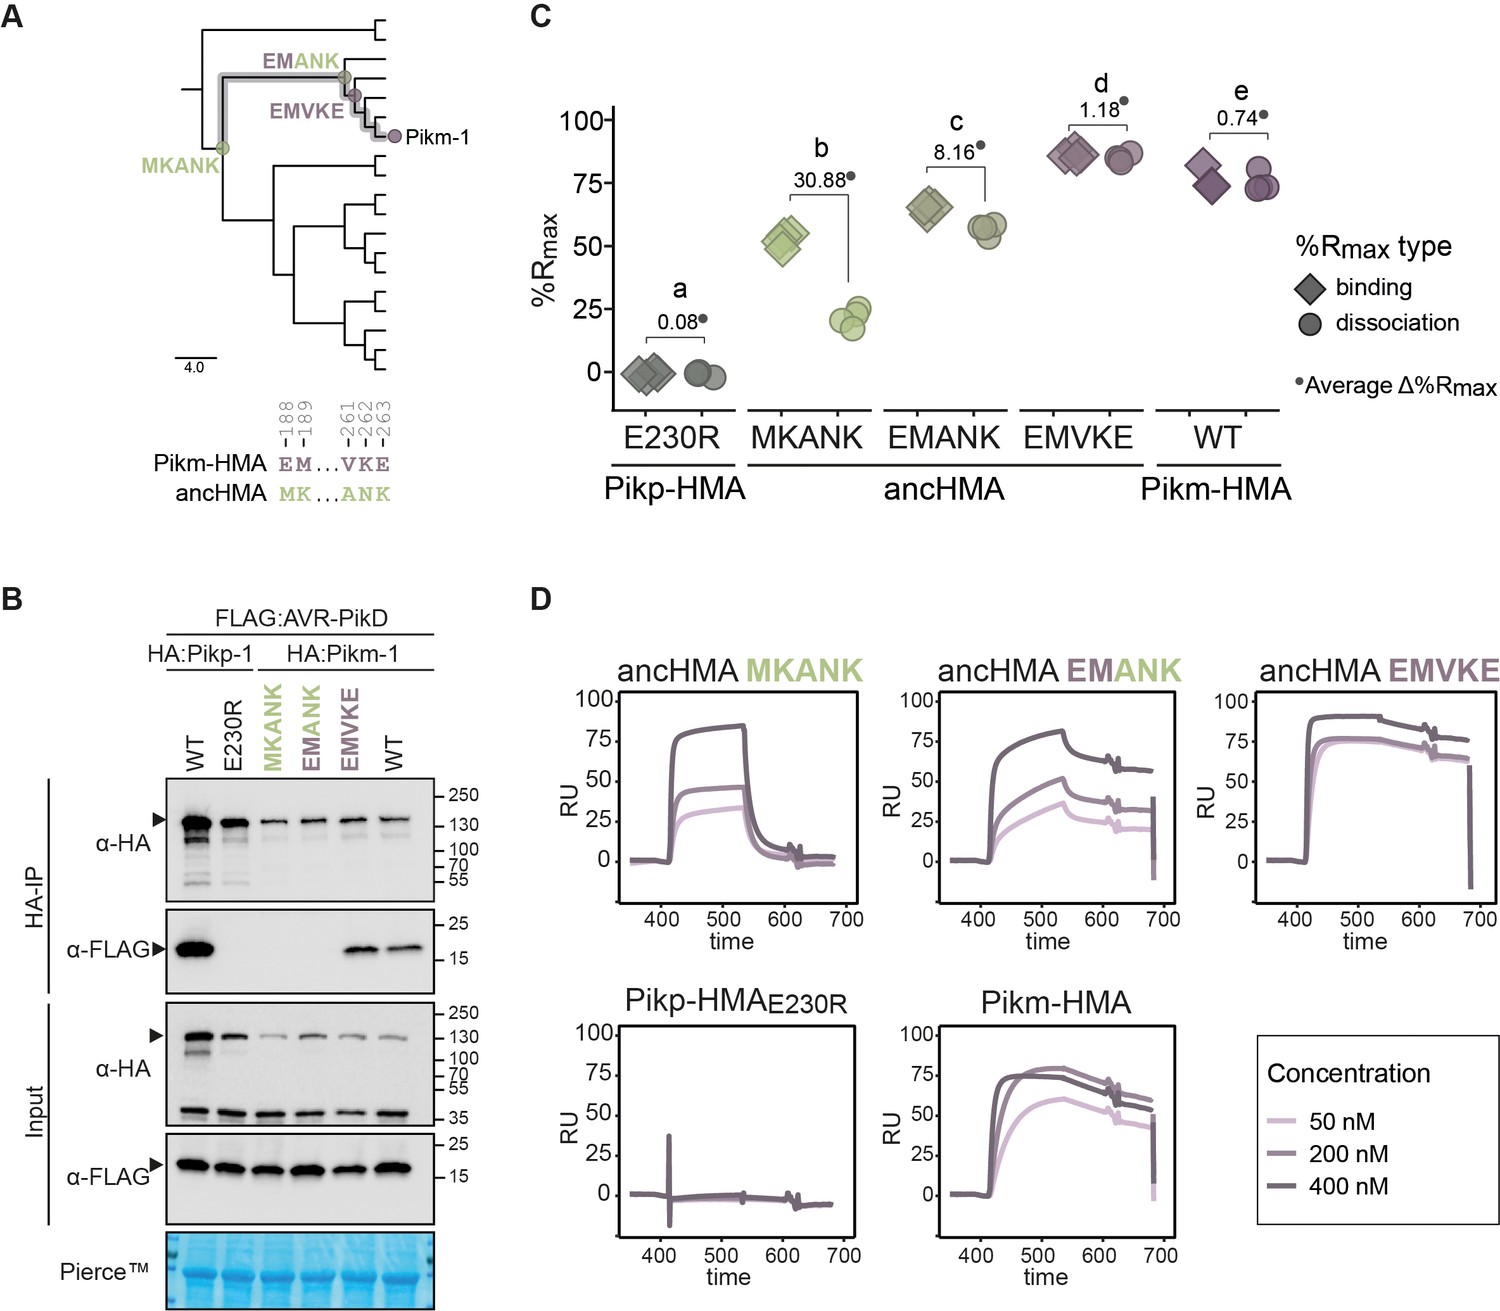
The ANK-VKE substitutions are essential for Pikm-HMA adaptation towards high-affinity binding to AVR-PikD.
(A) Schematic representation of the neighbour joining (NJ) tree of the ancestral HMA (HMA) domains from Oryza spp. (shown in Figure 3—figure supplement 2). The scale bar indicates the evolutionary distance based on the number of base substitutions per site. Historical substitutions in the MKANK/EMVKE region acquired over the course of Pikm-HMA evolution are shown next to the corresponding nodes. The mutations are colour-coded to match the ancestral (green) and present-day (purple) states. (B) Co-immunoprecipitation experiment illustrating in planta association of AVR-PikD (N-terminally tagged with FLAG) with Pikm-1 and Pikm-1:ancHMA proteins (N-terminally tagged with HA), labelled above. Wild-type (WT) Pikp-1/Pikm-1 and Pikp-1E230R constructs were used as positive and negative controls, respectively. Immunoprecipitates (HA-IP) obtained using anti-HA probes and total protein extracts (input) were immunoblotted with the appropriate antisera (depicted on the left). The arrowheads indicate expected band sizes. Rubisco loading control was performed using Pierce solution. Three independent replicates of this experiment are shown in Figure 8—figure supplement 1. (C) Plot illustrating calculated percentage of the theoretical maximum response (%Rmax) values for interaction of heavy metal-associated (HMA) analytes, labelled below, with AVR-PikD ligand (C-terminally tagged with HIS) determined by surface plasmon resonance (SPR). %Rmax was calculated assuming a one-to-one (HMA-to-effector) binding model for Pikm-HMA and ancHMAs, and a two-to-one for Pikp-1E230R. The values were normalised for the amount of ligand immobilised on the NTA-chip. The chart summarises the results obtained for HMA analytes at 200 nM concentration from five independent experiments, with all the data points represented as diamonds (‘binding’) or circles (‘dissociation’). Three different concentrations of analytes (400 nM, 200 nM, 50 nM) were tested; results for 400 nM and 50 nM concentrations are shown in Figure 8—figure supplement 4. Average Δ%Rmax (•) values represent absolute differences between values for ‘binding’ and ‘dissociation’, calculated from the average values for each sample, and serve as an off-rate approximate. Statistical differences among the samples were analysed with Tukey’s honest significant difference (HSD) test (p<0.01); p-values for all pairwise comparisons are presented in Supplementary file 1K. (D) The SPR sensorgrams of the AVR-PikD and HMA proteins, corresponding to the data used in (C). Independent replicates of this experiment are presented in Figure 8—figure supplement 5.
-
Figure 8—source data 1
Raw data of Pikm-ancHMA Rmax SPR.
- https://cdn.elifesciences.org/articles/66961/elife-66961-fig8-data1-v1.xlsx
Figure 8—figure supplement 1
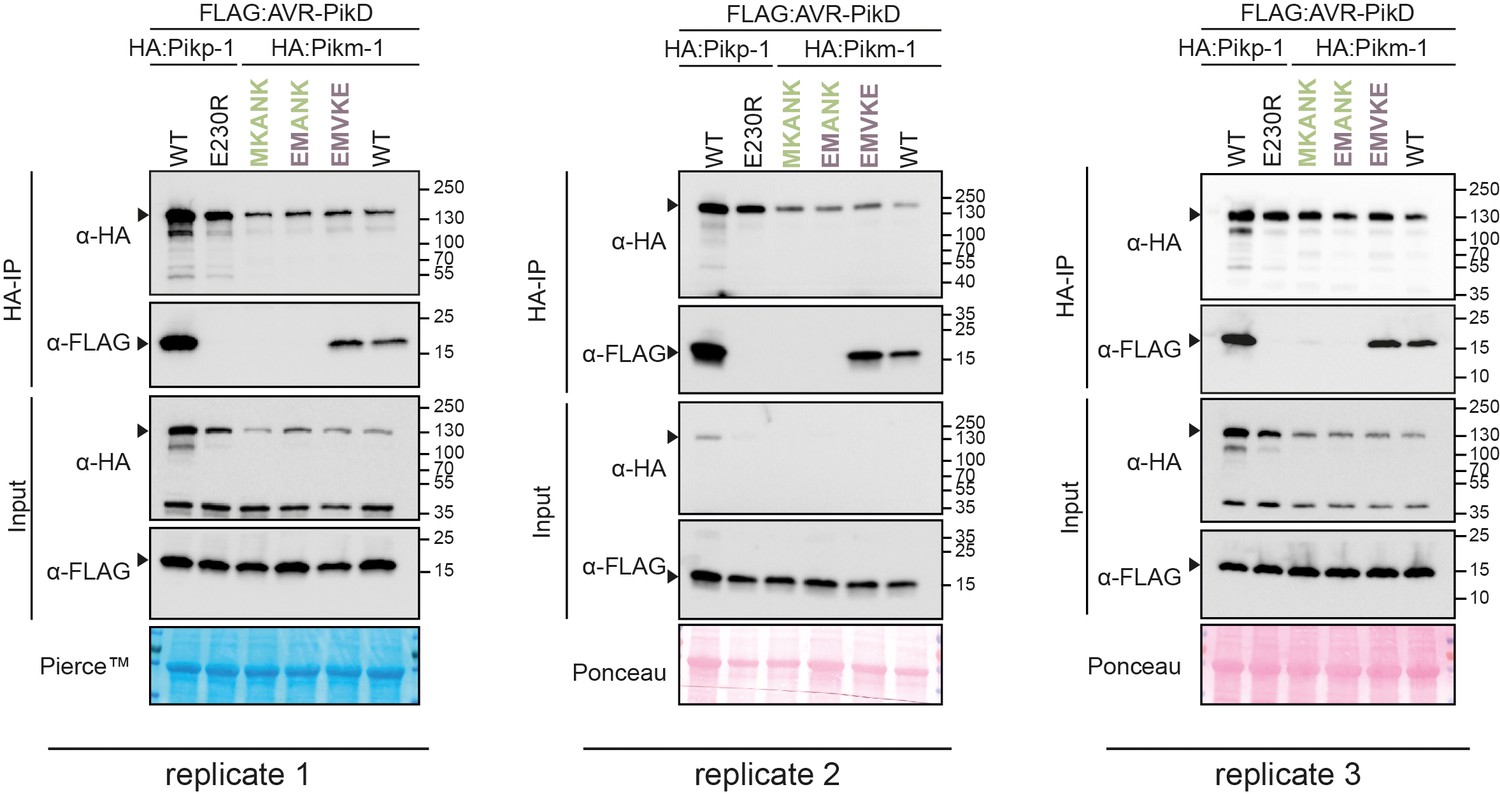
Replicates of the co-immunoprecipitation experiment between Pikm-1:ancHMA mutants in the MKANK/EMVKE region and AVR-PikD.
In planta association of AVR-PikD (N-terminally tagged with FLAG) with Pikp-1, Pikp-1E230R, Pikm-1, Pikm-1:ancHMA, and Pikm-1:ancHMA mutants (N-terminally tagged with HA), labelled above. Wild-type (WT) Pikp-1/Pikm-1 and Pikp-1E230R were used as positive and negative controls, respectively. Immunoprecipitates (HA-IP) obtained with anti-HA probe and total protein extracts (input) were immunoblotted with the appropriate antisera labelled on the left. Arrowheads correspond to expected band sizes. Rubisco loading controls were performed using Pierce or Ponceau staining. The figure depicts the results from three independent experiments.
Figure 8—figure supplement 2
Purified proteins used in surface plasmon resonance studies.
(A) Coomassie Blue-stained SDS-PAGE gel showing purified heavy metal-associated proteins used in in vitro experiments. (B) Table summarising intact masses (monoisotopic) of proteins from (A). *The Pikp-HMAE230R protein appears to lack two amino acids at the N-terminus, corresponding to the linker between the protein and HIS-tag used for purification.
Figure 8—figure supplement 3
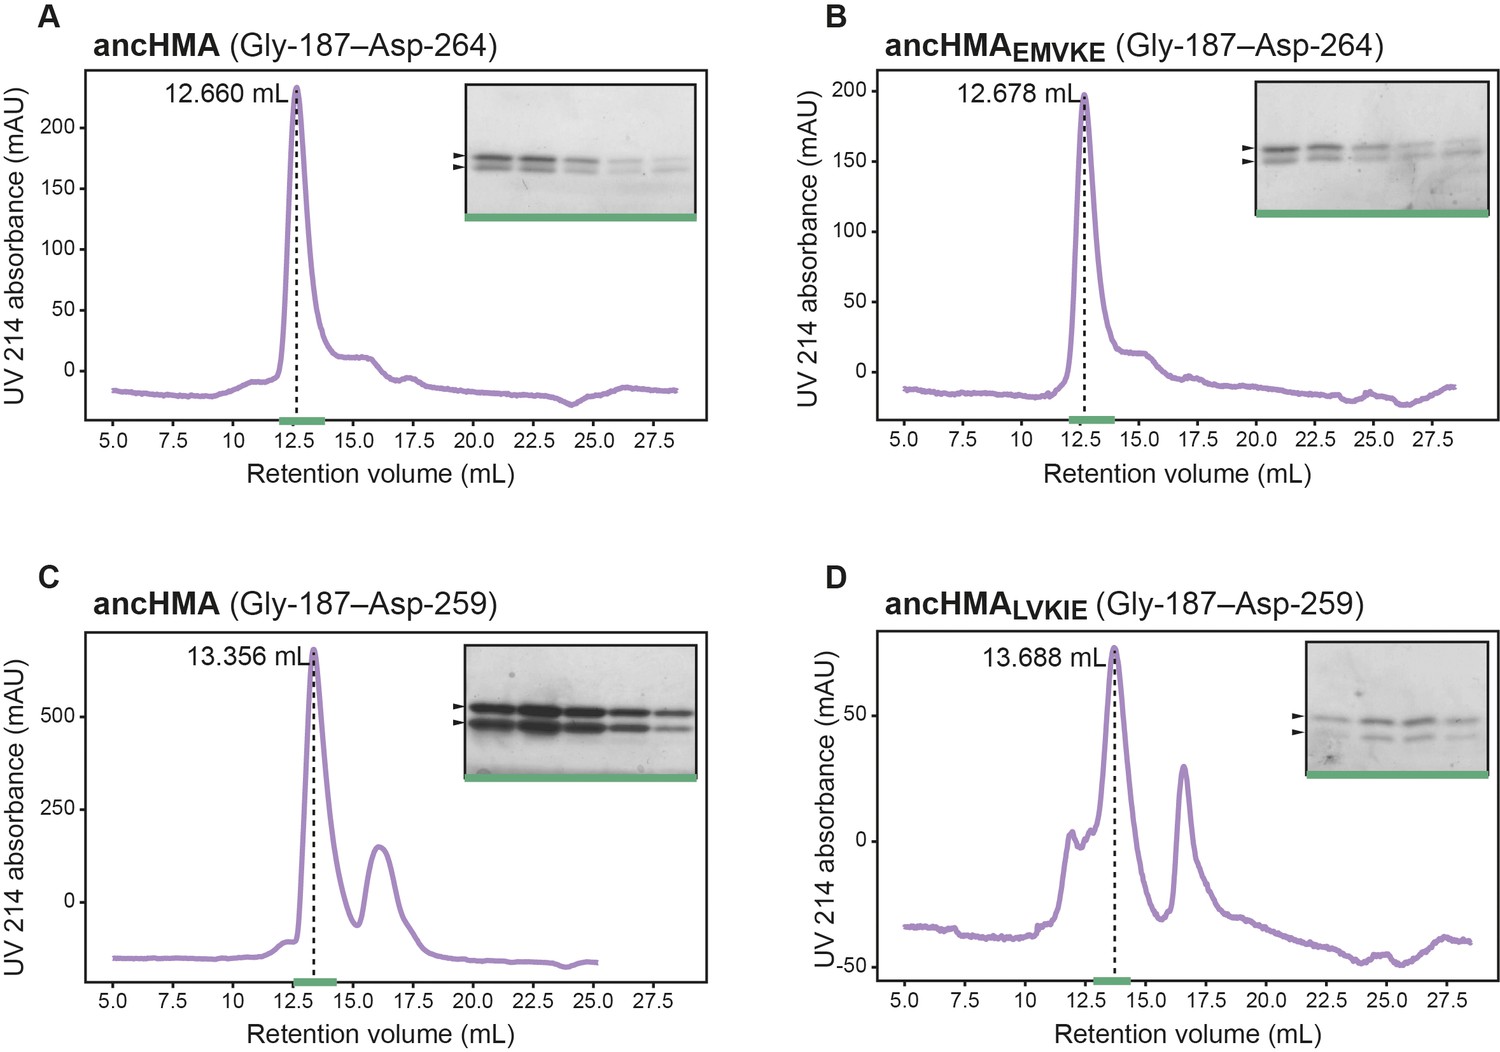
Different stoichiometry of the ancHMA–AVR-PikD complexes.
Analytical gel filtration traces depicting the retention volumes of AVR-PikD in complexes with (A) ancHMA and (B) ancHMAEMVKE with 5-amino acid extension, and (C) ancHMA and (D) ancHMALVKIE without the extension. The peaks corresponding to protein complexes are indicated with dashed lines, with the retention volumes shown on the left. Coomassie Blue-stained SDS-PAGE gels of relevant fractions, marked with green line, are presented on the right. Arrowheads correspond to expected protein sizes.
Figure 8—figure supplement 4
Surface plasmon resonance (SPR) results showing the effect of the step-by-step mutations within the MKANK/EMVKE region on the AVR-PikD binding in vitro, as indicated by %Rmax.
(A) Schematic illustration of the SPR sensorgram and the timepoints corresponding to ‘binding’ and ‘dissociation’, recorded in this study. (B) Plots illustrating calculated percentage of the theoretical maximum response (%Rmax) values for interaction of heavy metal-associated (HMA) analytes, labelled below, with AVR-PikD ligand (C-terminally tagged with HIS). %Rmax was calculated assuming a two-to-one model for Pikp-HMAE230R and a one-to-one binding model for the remaining constructs. The values were normalised for the amount of ligand immobilised on the NTA-chip. The HMA analytes were tested at three different concentrations (labelled on the left) in at least four independent experiments. All of the data points are represented as diamonds or circles. Average Δ%Rmax (•) values represent absolute differences between values for ‘binding’ and ‘‘dissociation’, calculated from the average values for each sample, and serve as an off-rate approximate. Statistical differences among the samples were analysed with ANOVA and Tukey’s honest significant difference (HSD) test (p<0.01). p-values for all pairwise comparisons are presented in Supplementary file 1K. (C) The results, identical to those presented in (B), are shown as histograms to emphasise the differences in binding dynamics between the constructs. Bars represent the average response, and the error bars represent the standard deviation.
Figure 8—figure supplement 5
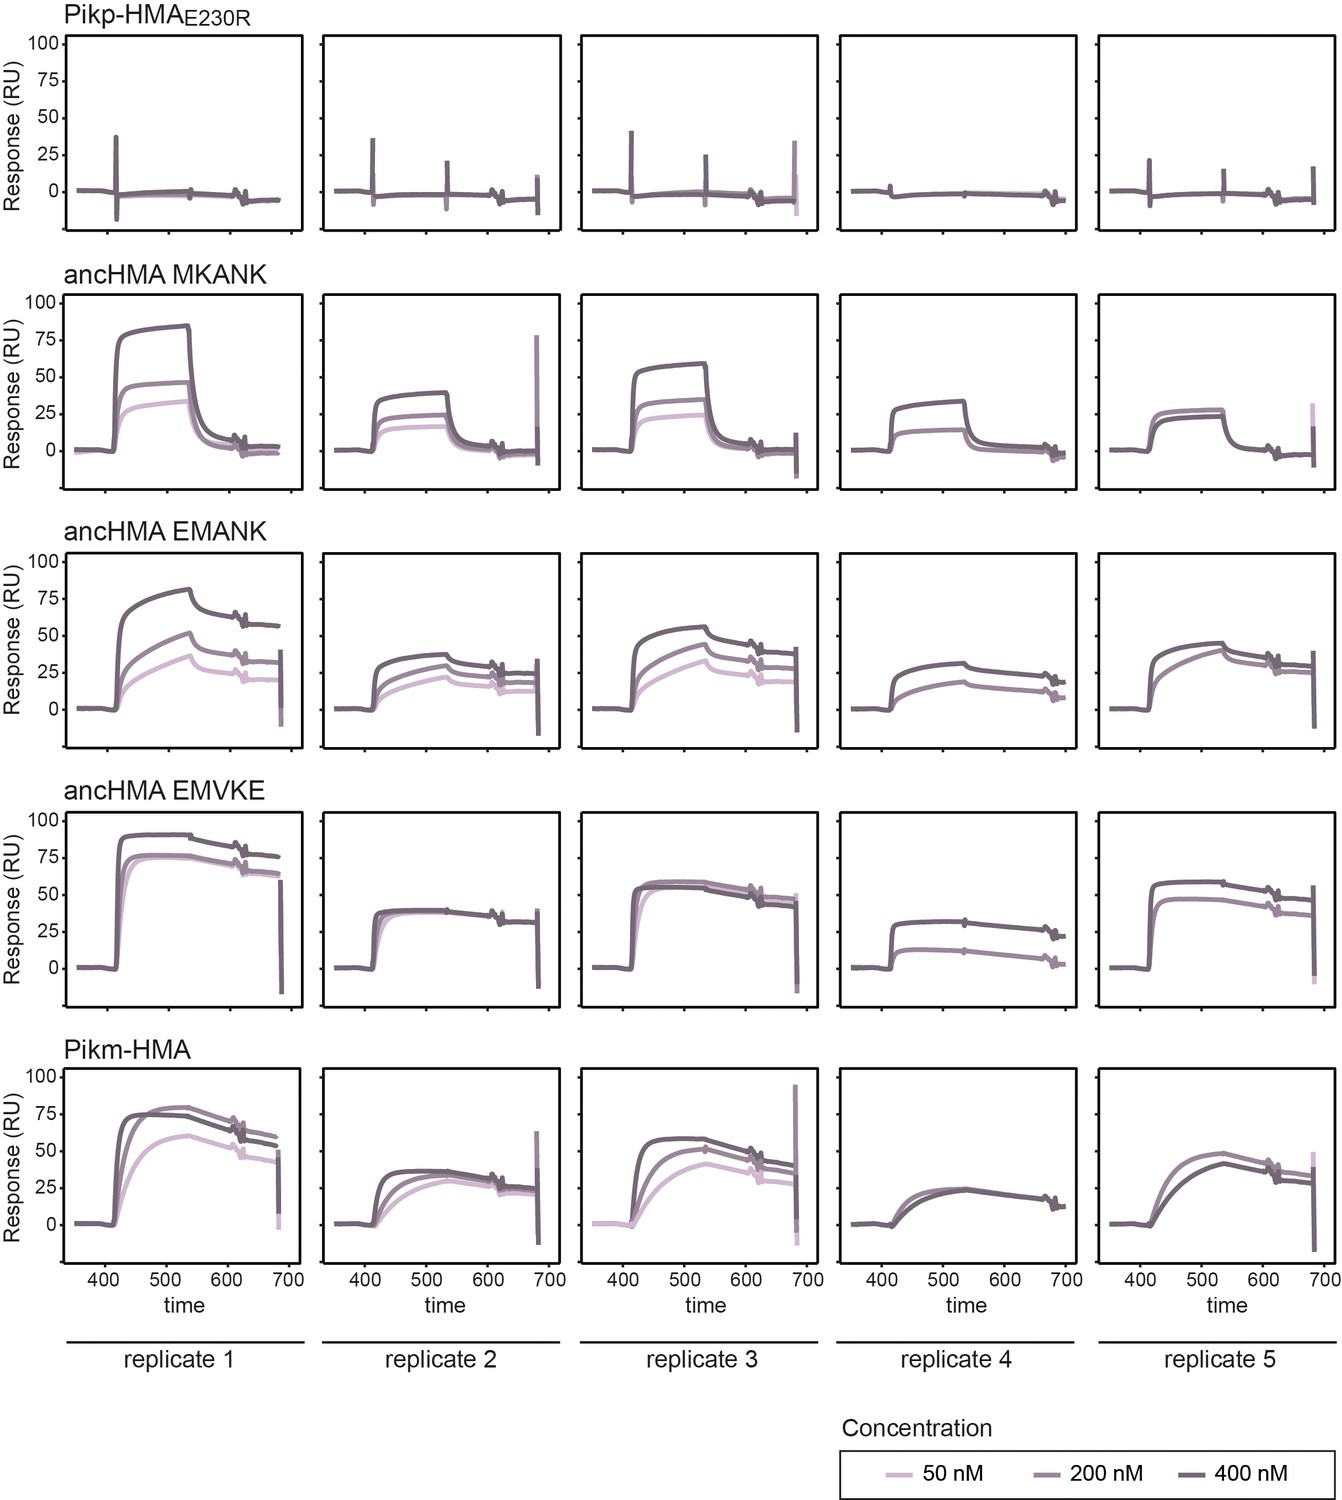
The surface plasmon resonance (SPR) sensorgrams for the AVR-PikD–HMA binding.
The SPR sensorgrams from five independent replicates are shown. His-tagged AVR-PikD was immobilised on the sample cell, giving a response level of 99 ± 33 response units (RU).
Figure 9 with 1 supplement
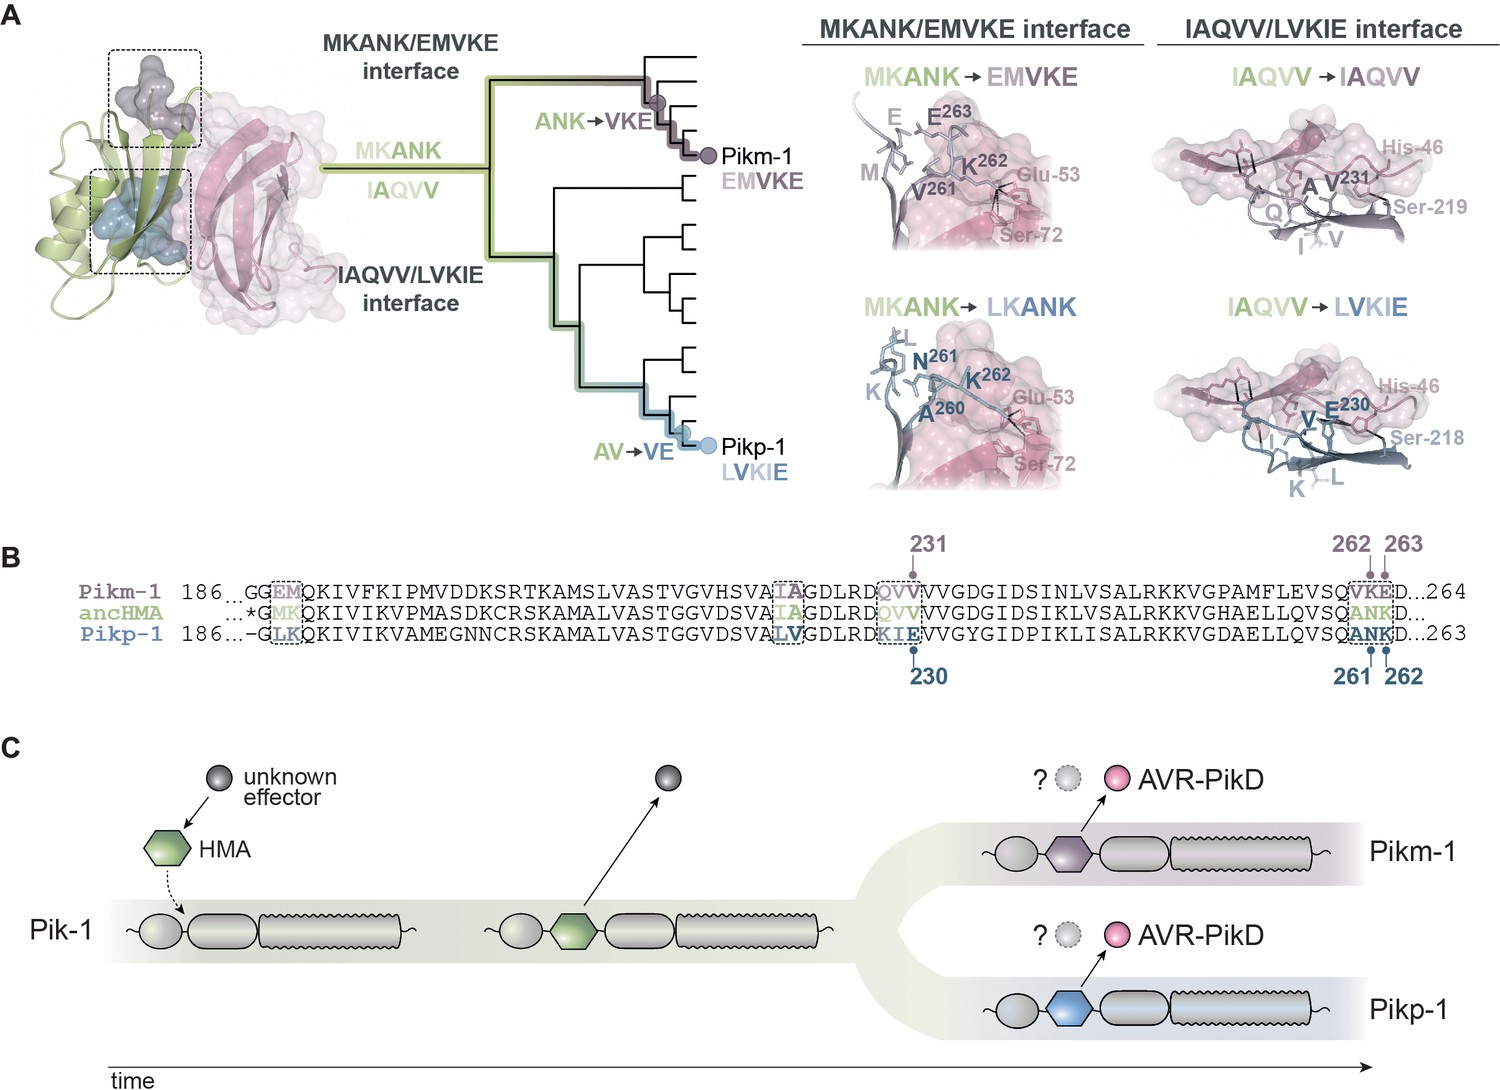
Model of molecular convergence of Pikp-1 and Pikm-1 towards AVR-PikD binding at high affinity.
(A) The heavy metal-associated (HMA) domains of Pikp-1 and Pikm-1 receptors have convergently evolved through distinct evolutionary and biochemical paths to bind AVR-PikD with high affinity. The Pikp-HMA domain evolved through the AV-VE adaptations in the IAQVV/LVKIE region, whereas Pikm-HMA domain acquired the ANK-VKE mutations in the MKANK/EMVKE region. Schematic representations of the HMA–AVR-PikD structures, adapted from De la Concepcion et al., 2018, are presented with selected side chains shown as sticks and labelled; the colours of the residue labels match colours of the respective molecules. Dashed lines stand for hydrogen bonds or salt bridges. (B) The protein sequence alignment between Pikp-HMA, Pikm-HMA, and ancestral HMA (ancHMA), with relevant amino acids marked. (C) We propose a model in which the HMA effector target integrated into Pik-1 to bait the recognition of an unknown effector. Throughout evolution the Pik-1 receptor and its integrated HMA domain diversified and led to the emergence of the Pikp-1 and Pikm-1 allelic variants that bind newly emerged AVR-PikD effector.
Figure 9—figure supplement 1

The Val-230-Glu mutation within the LVKIE region of ancestral HMA (ancHMA) enhances interaction with AVR-PikD through hydrogen bond formation.
(A) Schematic representation of the structure of ancHMALVKIE complexed with the AVR-PikD effector. The molecules are shown as ribbons with selected side chains presented as sticks and labelled; the colours of the residue labels match the colours of the respective molecules. The molecular surfaces of AVR-PikD (pink) and LVKIE residues (blue) within ancHMALVKIE are also shown. Dashed lines represent hydrogen bonds or salt bridges formed between the two molecules. (B) Superimposition of the ancHMALVKIE structure and the ancHMA homology model (grey) in complex with AVR-PikD. (C) Close-up views of the IAQVV/LVKIE region of ancHMALVKIE (green and blue) and ancHMA (green) showcasing differences in binding to AVR-PikD (pink). The selected residues involved in binding are labelled with labels matching the colours of the corresponding molecules. The LVKIE residues are labelled with single-letter amino acid symbols—Ile/Leu-221 (I/L), Ala/Val-222 (A/V), Gln/Lys-228 (Q/K), Val/Ile-229 (V/I), Val/Glu-230 (V/E) for ancHMA/ancHMALVKIE; and Ile-222 (I), Ala-223 (A), Gln-231 (Q), Val-232 (V), Val-233 (V) for Pikm-HMA. Dashed lines represent hydrogen bonds or salt bridges formed between the two molecules.
Tables
Key resources table
| Reagent type (species) or resource | Designation | Source or reference | Identifiers | Additional information |
|---|---|---|---|---|
| Recombinant DNA reagent | pICH41308 | Addgene | No. 47998 | Golden Gate level 0 acceptor |
| Recombinant DNA reagent | pICSL12008 | TSL (The Sainsbury Laboratory) SynBio team | 35S + Ω promoter Golden Gate module | |
| Recombinant DNA reagent | pICH41414 | Addgene | No. 50337 | 35S terminator Golden Gate module |
| Recombinant DNA reagent | pICSL30007 | TSL (The Sainsbury Laboratory) SynBio team | N-terminal 6×HA Golden Gate module | |
| Recombinant DNA reagent | pICH47732 | Addgene | No. 48001 | Level 1 binary vector |
| Recombinant DNA reagent | p41308-PikpN | This paper | Materials and methods: Cloning for in planta assays | |
| Recombinant DNA reagent | p41308-PikpC | This paper | Materials and methods: Cloning for in planta assays | |
| Recombinant DNA reagent | pICSL13004 | TSL (The Sainsbury Laboratory) SynBio team | Mas promoter Golden Gate module | |
| Recombinant DNA reagent | pICSL50001 | TSL (The Sainsbury Laboratory) SynBio team | C-terminal HF Golden Gate module | |
| Recombinant DNA reagent | pICH77901 | TSL (The Sainsbury Laboratory) SynBio team | Mas terminator Golden Gate module | |
| Recombinant DNA reagent | p41308-PikmN | This paper | Materials and methods: Cloning for in planta assays | |
| Recombinant DNA reagent | p41308-PikmC | This paper | Materials and methods: Cloning for in planta assays | |
| Recombinant DNA reagent | pOPIN-M | Addgene | No. 26044 | E. coli expression vector |
| Recombinant DNA reagent | AVR-PikD in pOPIN-S3C | Maqbool et al., 2015 | E. coli expression construct | |
| Commercial assay, kit | Anti-HA Affinity Matrix, from rat IgG1 | Roche | 11815016001 | Materials and methods: Protein–protein interaction studies: co-IP; 20 μL |
| Antibody | HA-probe (F-7) HRP-conjugated; mouse monoclonal IgG2a | Santa Cruz Biotech | sc-7392 | Materials and methods: Protein–protein interaction studies: co-IP; 1:5000 |
| Antibody | Mouse monoclonal ANTI-FLAG M2 | Sigma | F3165 | Materials and methods: Protein–protein interaction studies: co-IP |
| Antibody | A-14 anti-Myc antibody; A-14 anti-Myc antibody | Santa Cruz Biotechnology | Sc-40 | Materials and methods: Protein–protein interaction studies: co-IP; 1:5000 |
| Commercial assay, kit | Pierce ECL Western Blotting Substrate | Thermo Fisher Scientific | 32109 | Materials and methods: Protein–protein interaction studies: co-IP; 1:5000 |
| Commercial assay, kit | SuperSignal West Femto Maximum Sensitivity Substrate | Thermo Fisher Scientific | 34094 | Materials and methods: Protein–protein interaction studies: co-IP; 1:5000 |
| Commercial assay, kit | Pierce Reversible Protein Stain Kit | Thermo Fisher Scientific | 24585 | Materials and methods: Protein–protein interaction studies: co-IP; 1:5000 |
| Software, algorithm | CCP4i2 graphical interface | Potterton et al., 2018 | Materials and methods: Crystallisation, data collection, and structure solution | |
| Software, algorithm | MolProbity | Chen et al., 2010 | Materials and methods: Crystallisation, data collection, and structure solution | |
| Software, algorithm | CCP4MG | McNicholas et al., 2011 | Materials and methods: Crystallisation, data collection, and structure solution | |
| Software, algorithm | SWISS-MODEL | Waterhouse et al., 2018 | Materials and methods: Crystallisation, data collection, and structure solution | |
| Software, algorithm | besthr | MacLean, 2019 | Materials and methods: Cell death assay | |
| Software, algorithm | NLR-Parser | Steuernagel et al., 2015 | ||
| Software, algorithm | HMMER 3.2b2 | Eddy, 1998 | Materials and methods: Identification and phylogenetic analysis of CC-NLRs from grasses | |
| Software, algorithm | MUSCLE v2.8.31 | Edgar, 2004 | Materials and methods: Identification and phylogenetic analysis of CC-NLRs from grasses | |
| Software, algorithm | QKphylogeny | https://github.com/matthewmoscou/QKphylogeny | Materials and methods: Identification and phylogenetic analysis of CC-NLRs from grasses | |
| Software, algorithm | RAxML v8.2.11 | Stamatakis, 2014 | Materials and methods: Identification and phylogenetic analysis of CC-NLRs from grasses | |
| Software, algorithm | iTOL v5.5.1 | Letunic and Bork, 2007 | Materials and methods: Identification and phylogenetic analysis of CC-NLRs from grasses | |
| Software, algorithm | BLAST v2.3.0 | Altschul et al., 1990 | Materials and methods: Identification and phylogenetic analysis of Pik-1 and Pik-2 homologues | |
| Software, algorithm | MEGA X | Kumar et al., 2018 | Materials and methods: Phylogenetic analyses of rice HMA domains and ancestral sequence reconstruction | |
| Software, algorithm | FastML | Ashkenazy et al., 2012 | Materials and methods: Phylogenetic analyses of rice HMA domains and ancestral sequence reconstruction | |
| Software, algorithm | PAML v4.9j | Yang, 1997 | Materials and methods: Testing for selection | |
| Software, algorithm | ggplot2 R v3.6.3 package | Ginestet, 2011 | Materials and methods: Testing for selection | |
| Software, algorithm | SNAP | https://www.hiv.lanl.gov/ | Materials and methods: Testing for selection | |
| Sequence-based reagent | 5′-TGAAGCAGATCCGAGACATAGCCT-3′ | This study | PCR primer | Materials and methods: Identification and cloning of Pik-1 and Pik-2 from Oryza brachyantha |
| Sequence-based reagent | 5′-TACCCTGCTCCTGATTGCTGACT-3′ | This study | PCR primer | Materials and methods: Identification and cloning of Pik-1 and Pik-2 from Oryza brachyantha |
| Sequence-based reagent | 5′-AGGGAGCAATGATGCTTCACGA-3′ | This study | PCR primer | Materials and methods: Identification and cloning of the Pik-1–integrated HMA domains from wild rice relatives |
| Sequence-based reagent | 3′-TTCTCTGGCAACCGTTGTTTTGC-5′ | This study | PCR primer | Materials and methods: Identification and cloning of the Pik-1–integrated HMA domains from wild rice relatives |
| Commercial assay or kit | In-Fusion HD Cloning | Clontech | 639647 | Materials and methods: Cloning for in vitro studies |
| Gene (O. brachyantha) | W0654 | Wild Rice Collection ‘Oryzabase’; Kurata and Yamazaki, 2006 | Materials and methods: Identification and cloning of Pik-1 and Pik-2 from Oryza brachyantha | |
| Gene (O. brachyantha) | W0655 | Wild Rice Collection ‘Oryzabase’; Kurata and Yamazaki, 2006 | Materials and methods: Identification and cloning of Pik-1 and Pik-2 from Oryza brachyantha | |
| Gene (O. brachyantha) | W0656 | Wild Rice Collection ‘Oryzabase’; Kurata and Yamazaki, 2006 | Materials and methods: Identification and cloning of Pik-1 and Pik-2 from Oryza brachyantha | |
| Gene (O. brachyantha) | W1057 | Wild Rice Collection ‘Oryzabase’; Kurata and Yamazaki, 2006 | Materials and methods: Identification and cloning of Pik-1 and Pik-2 from Oryza brachyantha | |
| Gene (O. brachyantha) | W1401 | Wild Rice Collection ‘Oryzabase’; Kurata and Yamazaki, 2006 | Materials and methods: Identification and cloning of Pik-1 and Pik-2 from Oryza brachyantha | |
| Gene (O. brachyantha) | W1402 | Wild Rice Collection ‘Oryzabase’; Kurata and Yamazaki, 2006 | Materials and methods: Identification and cloning of Pik-1 and Pik-2 from Oryza brachyantha | |
| Gene (O. brachyantha) | W1403 | Wild Rice Collection ‘Oryzabase’; Kurata and Yamazaki, 2006 | Materials and methods: Identification and cloning of Pik-1 and Pik-2 from Oryza brachyantha | |
| Gene (O. brachyantha) | W1404 | Wild Rice Collection ‘Oryzabase’; Kurata and Yamazaki, 2006 | Materials and methods: Identification and cloning of Pik-1 and Pik-2 from Oryza brachyantha | |
| Gene (O. brachyantha) | W1405 | Wild Rice Collection ‘Oryzabase’; Kurata and Yamazaki, 2006 | Materials and methods: Identification and cloning of Pik-1 and Pik-2 from Oryza brachyantha | |
| Gene (O. brachyantha) | W1407(B) | Wild Rice Collection ‘Oryzabase’; Kurata and Yamazaki, 2006 | Materials and methods: Identification and cloning of Pik-1 and Pik-2 from Oryza brachyantha | |
| Gene (O. brachyantha) | W1703 | Wild Rice Collection ‘Oryzabase’; Kurata and Yamazaki, 2006 | Materials and methods: Identification and cloning of Pik-1 and Pik-2 from Oryza brachyantha | |
| Gene (O. brachyantha) | W1705 | Wild Rice Collection ‘Oryzabase’; Kurata and Yamazaki, 2006 | Materials and methods: Identification and cloning of Pik-1 and Pik-2 from Oryza brachyantha | |
| Gene (O. brachyantha) | W1706 | Wild Rice Collection ‘Oryzabase’; Kurata and Yamazaki, 2006 | Materials and methods: Identification and cloning of Pik-1 and Pik-2 from Oryza brachyantha | |
| Gene (O. brachyantha) | W1708 | Wild Rice Collection ‘Oryzabase’; Kurata and Yamazaki, 2006 | Materials and methods: Identification and cloning of Pik-1 and Pik-2 from Oryza brachyantha | |
| Gene (O. brachyantha) | W1711 | Wild Rice Collection ‘Oryzabase’; Kurata and Yamazaki, 2006 | Materials and methods: Identification and cloning of Pik-1 and Pik-2 from Oryza brachyantha | |
| Gene (O. brachyantha) | W1712 | Wild Rice Collection ‘Oryzabase’; Kurata and Yamazaki, 2006 | Materials and methods: Identification and cloning of Pik-1 and Pik-2 from Oryza brachyantha | |
| Gene (O. brachyantha) | W0654 | Wild Rice Collection ‘Oryzabase’; Kurata and Yamazaki, 2006 | Materials and methods: Identification and cloning of the Pik-1-integrated HMA domains from wild rice relatives | |
| Gene (O. australiensis) | W0008 | Wild Rice Collection ‘Oryzabase’; Kurata and Yamazaki, 2006 | Materials and methods: Identification and cloning of the Pik-1-integrated HMA domains from wild rice relatives | |
| Gene (O. australiensis) | W1628 | Wild Rice Collection ‘Oryzabase’; Kurata and Yamazaki, 2006 | Materials and methods: Identification and cloning of the Pik-1-integrated HMA domains from wild rice relatives | |
| Gene (O. barthii) | W1643 | Wild Rice Collection ‘Oryzabase’; Kurata and Yamazaki, 2006 | Materials and methods: Identification and cloning of the Pik-1-integrated HMA domains from wild rice relatives | |
| Gene (O. barthii) | W1605 | Wild Rice Collection ‘Oryzabase’; Kurata and Yamazaki, 2006 | Materials and methods: Identification and cloning of the Pik-1-integrated HMA domains from wild rice relatives | |
| Gene (O. barthii) | W0042 | Wild Rice Collection ‘Oryzabase’; Kurata and Yamazaki, 2006 | Materials and methods: Identification and cloning of the Pik-1-integrated HMA domains from wild rice relatives | |
| Gene (O. barthii) | W0698 | Wild Rice Collection ‘Oryzabase’; Kurata and Yamazaki, 2006 | Materials and methods: Identification and cloning of the Pik-1-integrated HMA domains from wild rice relatives | |
| Gene (O. eichingeri) | W1526 | Wild Rice Collection ‘Oryzabase’; Kurata and Yamazaki, 2006 | Materials and methods: Identification and cloning of the Pik-1-integrated HMA domains from wild rice relatives | |
| Gene (O. glumaepatula) | W1171 | Wild Rice Collection ‘Oryzabase’; Kurata and Yamazaki, 2006 | Materials and methods: Identification and cloning of the Pik-1-integrated HMA domains from wild rice relatives | |
| Gene (O. glumaepatula) | W2203 | Wild Rice Collection ‘Oryzabase’; Kurata and Yamazaki, 2006 | Materials and methods: Identification and cloning of the Pik-1-integrated HMA domains from wild rice relatives | |
| Gene (O. grandiglumis) | W1480(B) | Wild Rice Collection ‘Oryzabase’; Kurata and Yamazaki, 2006 | Materials and methods: Identification and cloning of the Pik-1-integrated HMA domains from wild rice relatives | |
| Gene (O. granulata) | W0005 | Wild Rice Collection ‘Oryzabase’; Kurata and Yamazaki, 2006 | Materials and methods: Identification and cloning of the Pik-1-integrated HMA domains from wild rice relatives | |
| Gene (O. granulata) | W0067(B) | Wild Rice Collection ‘Oryzabase’; Kurata and Yamazaki, 2006 | Materials and methods: Identification and cloning of the Pik-1-integrated HMA domains from wild rice relatives | |
| Gene (O. latifolia/O. alta) | W0542 | Wild Rice Collection ‘Oryzabase’; Kurata and Yamazaki, 2006 | Materials and methods: Identification and cloning of the Pik-1-integrated HMA domains from wild rice relatives | |
| Gene (O. latifolia/O. alta) | W1539 | Wild Rice Collection ‘Oryzabase’; Kurata and Yamazaki, 2006 | Materials and methods: Identification and cloning of the Pik-1-integrated HMA domains from wild rice relatives | |
| Gene (O. longiglumis) | W1228 | Wild Rice Collection ‘Oryzabase’; Kurata and Yamazaki, 2006 | Materials and methods: Identification and cloning of the Pik-1-integrated HMA domains from wild rice relatives | |
| Gene (O. longistaminata) | W1504 | Wild Rice Collection ‘Oryzabase’; Kurata and Yamazaki, 2006 | Materials and methods: Identification and cloning of the Pik-1-integrated HMA domains from wild rice relatives | |
| Gene (O. longistaminata) | W1540 | Wild Rice Collection ‘Oryzabase’; Kurata and Yamazaki, 2006 | Materials and methods: Identification and cloning of the Pik-1-integrated HMA domains from wild rice relatives | |
| Gene (O. longistaminata) | W0643 | Wild Rice Collection ‘Oryzabase’; Kurata and Yamazaki, 2006 | Materials and methods: Identification and cloning of the Pik-1-integrated HMA domains from wild rice relatives | |
| Gene (O. meridionalis) | W2081 | Wild Rice Collection ‘Oryzabase’; Kurata and Yamazaki, 2006 | Materials and methods: Identification and cloning of the Pik-1-integrated HMA domains from wild rice relatives | |
| Gene (O. meridionalis) | W2112 | Wild Rice Collection ‘Oryzabase’; Kurata and Yamazaki, 2006 | Materials and methods: Identification and cloning of the Pik-1-integrated HMA domains from wild rice relatives | |
| Gene (O. meyeriana) | W1354 | Wild Rice Collection ‘Oryzabase’; Kurata and Yamazaki, 2006 | Materials and methods: Identification and cloning of the Pik-1-integrated HMA domains from wild rice relatives | |
| Gene (O. minuta) | W1328 | Wild Rice Collection ‘Oryzabase’; Kurata and Yamazaki, 2006 | Materials and methods: Identification and cloning of the Pik-1-integrated HMA domains from wild rice relatives | |
| Gene (O. officinalis) | W0614 | Wild Rice Collection ‘Oryzabase’; Kurata and Yamazaki, 2006 | Materials and methods: Identification and cloning of the Pik-1-integrated HMA domains from wild rice relatives | |
| Gene (O. officinalis) | W1200 | Wild Rice Collection ‘Oryzabase’; Kurata and Yamazaki, 2006 | Materials and methods: Identification and cloning of the Pik-1-integrated HMA domains from wild rice relatives | |
| Gene (O. punctata) | W1408 | Wild Rice Collection ‘Oryzabase’; Kurata and Yamazaki, 2006 | Materials and methods: Identification and cloning of the Pik-1-integrated HMA domains from wild rice relatives | |
| Gene (O. punctata) | W1514 | Wild Rice Collection ‘Oryzabase’; Kurata and Yamazaki, 2006 | Materials and methods: Identification and cloning of the Pik-1-integrated HMA domains from wild rice relatives | |
| Gene (O. rhizomatis) | W1808 | Wild Rice Collection ‘Oryzabase’; Kurata and Yamazaki, 2006 | Materials and methods: Identification and cloning of the Pik-1-integrated HMA domains from wild rice relatives | |
| Gene (O. ridleyi) | W0001 | Wild Rice Collection ‘Oryzabase’; Kurata and Yamazaki, 2006 | Materials and methods: Identification and cloning of the Pik-1-integrated HMA domains from wild rice relatives | |
| Gene (O. ridleyi) | W2035 | Wild Rice Collection ‘Oryzabase’; Kurata and Yamazaki, 2006 | Materials and methods: Identification and cloning of the Pik-1-integrated HMA domains from wild rice relatives | |
| Gene (O. rufipogon) | W2003 | Wild Rice Collection ‘Oryzabase’; Kurata and Yamazaki, 2006 | Materials and methods: Identification and cloning of the Pik-1-integrated HMA domains from wild rice relatives | |
| Gene (O. rufipogon) | W1715 | Wild Rice Collection ‘Oryzabase’; Kurata and Yamazaki, 2006 | Materials and methods: Identification and cloning of the Pik-1-integrated HMA domains from wild rice relatives | |
| Gene (O. rufipogon/ O. meridionalis) | W2117 | Wild Rice Collection ‘Oryzabase’; Kurata and Yamazaki, 2006 | Materials and methods: Identification and cloning of the Pik-1-integrated HMA domains from wild rice relatives | |
| Gene (O. brachyantha) | LOC102699268 | GenBank | Materials and methods: Phylogenetic analyses of rice HMA domains andancestral sequence reconstruction | |
| Gene (O. barthii) | OBART11G23150 | GenBank | Materials and methods: Phylogenetic analyses of rice HMA domains andancestral sequence reconstruction | |
| Gene (O. longistaminata) | KN541092.1 | GenBank | Materials and methods: Phylogenetic analyses of rice HMA domains andancestral sequence reconstruction | |
| Gene (O. punctata) | OPUNC11G19550 | GenBank | Materials and methods: Phylogenetic analyses of rice HMA domains andancestral sequence reconstruction | |
| Gene (O. sativa) | HM035360.1 | GenBank | Materials and methods: Phylogenetic analyses of rice HMA domains andancestral sequence reconstruction | |
| Gene (O. sativa) | HM048900_1 | GenBank | Materials and methods: Phylogenetic analyses of rice HMA domains andancestral sequence reconstruction | |
| Gene (O. sativa) | HQ662330_1 | GenBank | Materials and methods: Phylogenetic analyses of rice HMA domains andancestral sequence reconstruction | |
| Gene (O. sativa) | HQ662329_1 | GenBank | Materials and methods: Phylogenetic analyses of rice HMA domains andancestral sequence reconstruction | |
| Gene (O. sativa) | AB462324.1 | GenBank | Materials and methods: Phylogenetic analyses of rice HMA domains andancestral sequence reconstruction | |
| Gene (O. brachyantha) | LOC102708959 | GenBank | Materials and methods: Phylogenetic analyses of rice HMA domains andancestral sequence reconstruction | |
| Gene (O. brachyantha) | LOC102709146 | GenBank | Materials and methods: Phylogenetic analyses of rice HMA domains andancestral sequence reconstruction | |
| Gene (O. brachyantha) | LOC102714171 | GenBank | Materials and methods: Phylogenetic analyses of rice HMA domains andancestral sequence reconstruction | |
| Gene (O. brachyantha) | LOC102716957 | GenBank | Materials and methods: Phylogenetic analyses of rice HMA domains andancestral sequence reconstruction | |
| Gene (O. brachyantha) | LOC102717220 | GenBank | Materials and methods: Phylogenetic analyses of rice HMA domains andancestral sequence reconstruction | |
| Gene (O. sativa) | LOC_Os04g39360 | GenBank | Materials and methods: Phylogenetic analyses of rice HMA domains andancestral sequence reconstruction | |
| Gene (O. sativa) | LOC_Os04g39370 | GenBank | Materials and methods: Phylogenetic analyses of rice HMA domains andancestral sequence reconstruction | |
| Gene (O. sativa) | Os04g0469000_01 | GenBank | Materials and methods: Phylogenetic analyses of rice HMA domains andancestral sequence reconstruction | |
| Gene (O. sativa) | Os02g0585200 | GenBank | Materials and methods: Phylogenetic analyses of rice HMA domains andancestral sequence reconstruction | |
| Gene (O. sativa) | Os02g0584800_01 | GenBank | Materials and methods: Phylogenetic analyses of rice HMA domains andancestral sequence reconstruction | |
| Gene (O. sativa) | Os02g0584700_01 | GenBank | Materials and methods: Phylogenetic analyses of rice HMA domains andancestral sequence reconstruction | |
| Gene (O. sativa) | Os04g0469300_01 | GenBank | Materials and methods: Phylogenetic analyses of rice HMA domains and ancestral sequence reconstruction | |
| Gene (O. sativa) | Os02g0585100 | GenBank | Materials and methods: Phylogenetic analyses of rice HMA domains andancestral sequence reconstruction | |
| Gene (O. sativa) | Os02g0584600 | GenBank | Materials and methods: Phylogenetic analyses of rice HMA domains andancestral sequence reconstruction | |
| Gene (O. sativa) | OSJNBa0060P14.7_01 | GenBank | Materials and methods: Phylogenetic analyses of rice HMA domains and ancestral sequence reconstruction | |
| Gene (O. sativa) | Os04g0464100_01 | GenBank | Materials and methods: Phylogenetic analyses of rice HMA domains andancestral sequence reconstruction | |
| Gene (O. sativa) | Os02g0582600 | GenBank | Materials and methods: Phylogenetic analyses of rice HMA domains andancestral sequence reconstruction |
Additional files
-
Supplementary file 1
Supplementary tables A–N.
- https://cdn.elifesciences.org/articles/66961/elife-66961-supp1-v1.docx
-
Supplementary file 2
Full list of all Poaceae NLRs and filtering details.
- https://cdn.elifesciences.org/articles/66961/elife-66961-supp2-v1.xlsx
-
Supplementary file 3
Site selection test for K-type HMAs.
- https://cdn.elifesciences.org/articles/66961/elife-66961-supp3-v1.xlsx
-
Supplementary file 4
ancHMA prediction probabilities.
- https://cdn.elifesciences.org/articles/66961/elife-66961-supp4-v1.xlsx
-
Transparent reporting form
- https://cdn.elifesciences.org/articles/66961/elife-66961-transrepform-v1.docx
Download links
A two-part list of links to download the article, or parts of the article, in various formats.
Downloads (link to download the article as PDF)
Open citations (links to open the citations from this article in various online reference manager services)
Cite this article (links to download the citations from this article in formats compatible with various reference manager tools)
Two NLR immune receptors acquired high-affinity binding to a fungal effector through convergent evolution of their integrated domain
eLife 10:e66961.
https://doi.org/10.7554/eLife.66961


