5-Hydroxymethylcytosine-mediated active demethylation is required for mammalian neuronal differentiation and function
- Laboratory of Molecular Biology, Howard Hughes Medical Institute, The Rockefeller University, United States
- Sanford Consortium for Regenerative Medicine, United States
- La Jolla Institute for Allergy and Immunology, United States
- Department of Pharmacology, University of California San Diego, United States
Figures
Figure 1 with 1 supplement
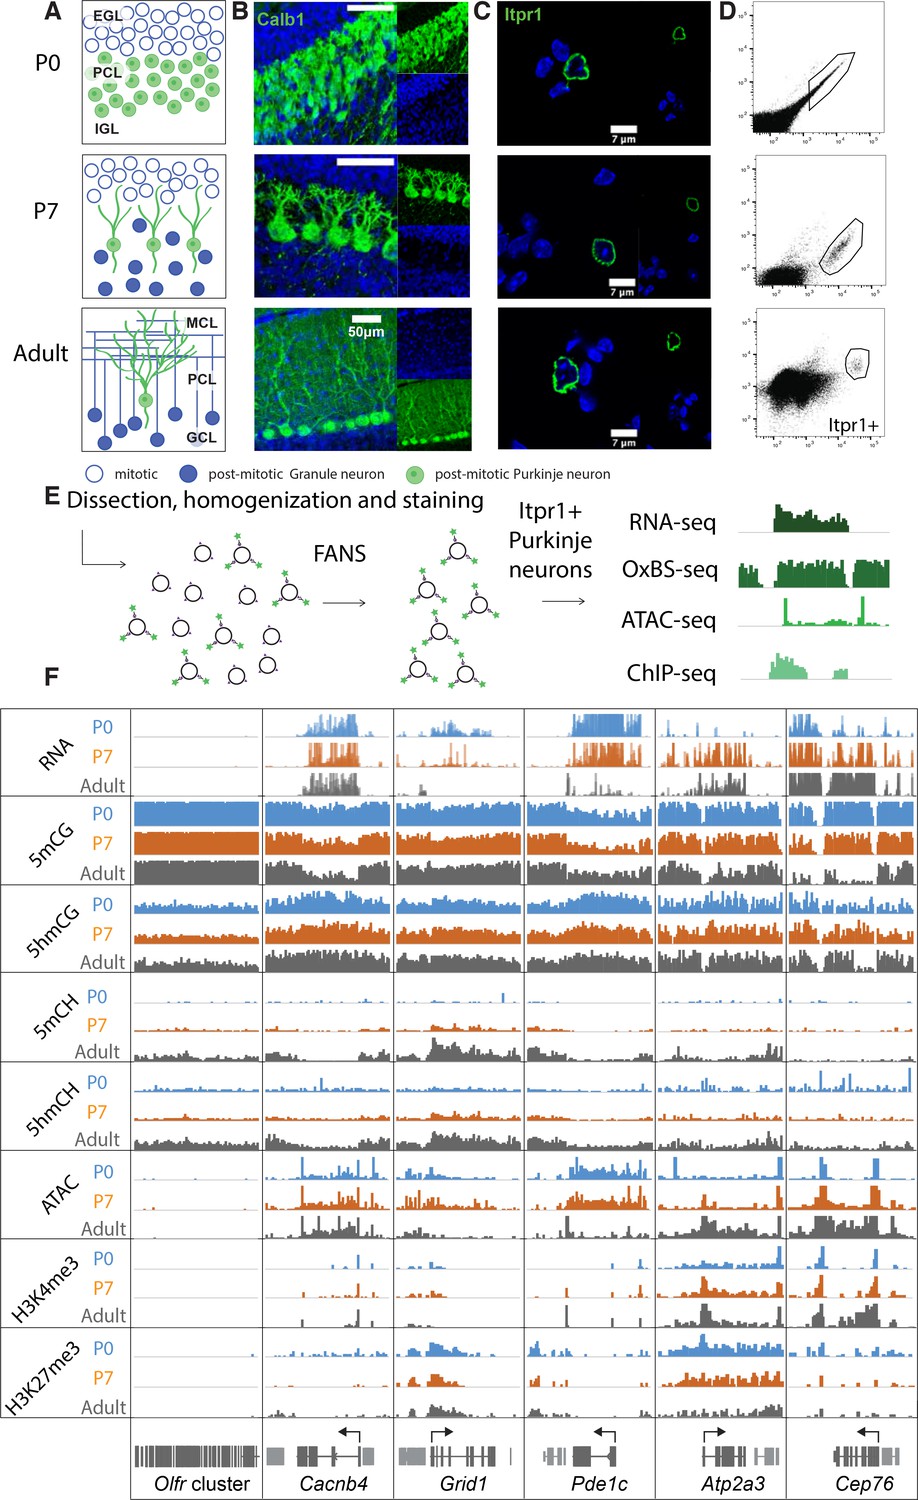
Chromatin landscape in differentiating Purkinje neurons.
(A) Schematic of Purkinje cell (PC) differentiation and growth at P0, P7, and adult (approximately 8-week-old) timepoints. EGL – external granule layer, PCL – Purkinje cell layer, IGL – internal granule layer, MCL – molecular cell layer, GCL – granule cell layer. (B) Immunofluorescence staining with Calb1 (green) of PCs in murine cerebella at P0, P7, and adult timepoints. (C) Example of PC nuclei stained with Itpr1 (green) post-dissociation and pre-sorting, counterstained with DAPI. (D) Representative plots of fluorescence-activated nuclear sorting of PCs at P0, P7, and adult timepoints with Itpr1. (E) Workflow schematic of nuclei isolation, antibody staining with anti-Itpr1, fluorescence-activated sorting, and downstream sequencing applications. (D) Integrated genome viewer (IGV) representation of example regions of differentially regulated genes (Olfr cluster – always silent, Cacnb4 – always expressed, Grid1 and Pde1c – developmentally down-regulated, Atp2a3 and Cep76 – developmentally up-regulated). Top tracks show RNA expression in RPKM (reads per kilobase per million mapped reads), mCG tracks show methylation level in CG context from 0 to 0.8, hmCG tracks show hydroxymethylation level in CG context from 0 to 0.45, mCH and hmCH show methylation and hydroxymethylation level in CH context (H = A, C, or T) from 0 to 0.04. ATAC tracks show ATACSeq read density in RPKM from 0 to 10. H3K4me3 tracks show input normalized enrichment in RPKM from 0 to 5. H3K27me3 tracks show input normalized enrichment in RPKM from 0 to 3.
Figure 1—figure supplement 1
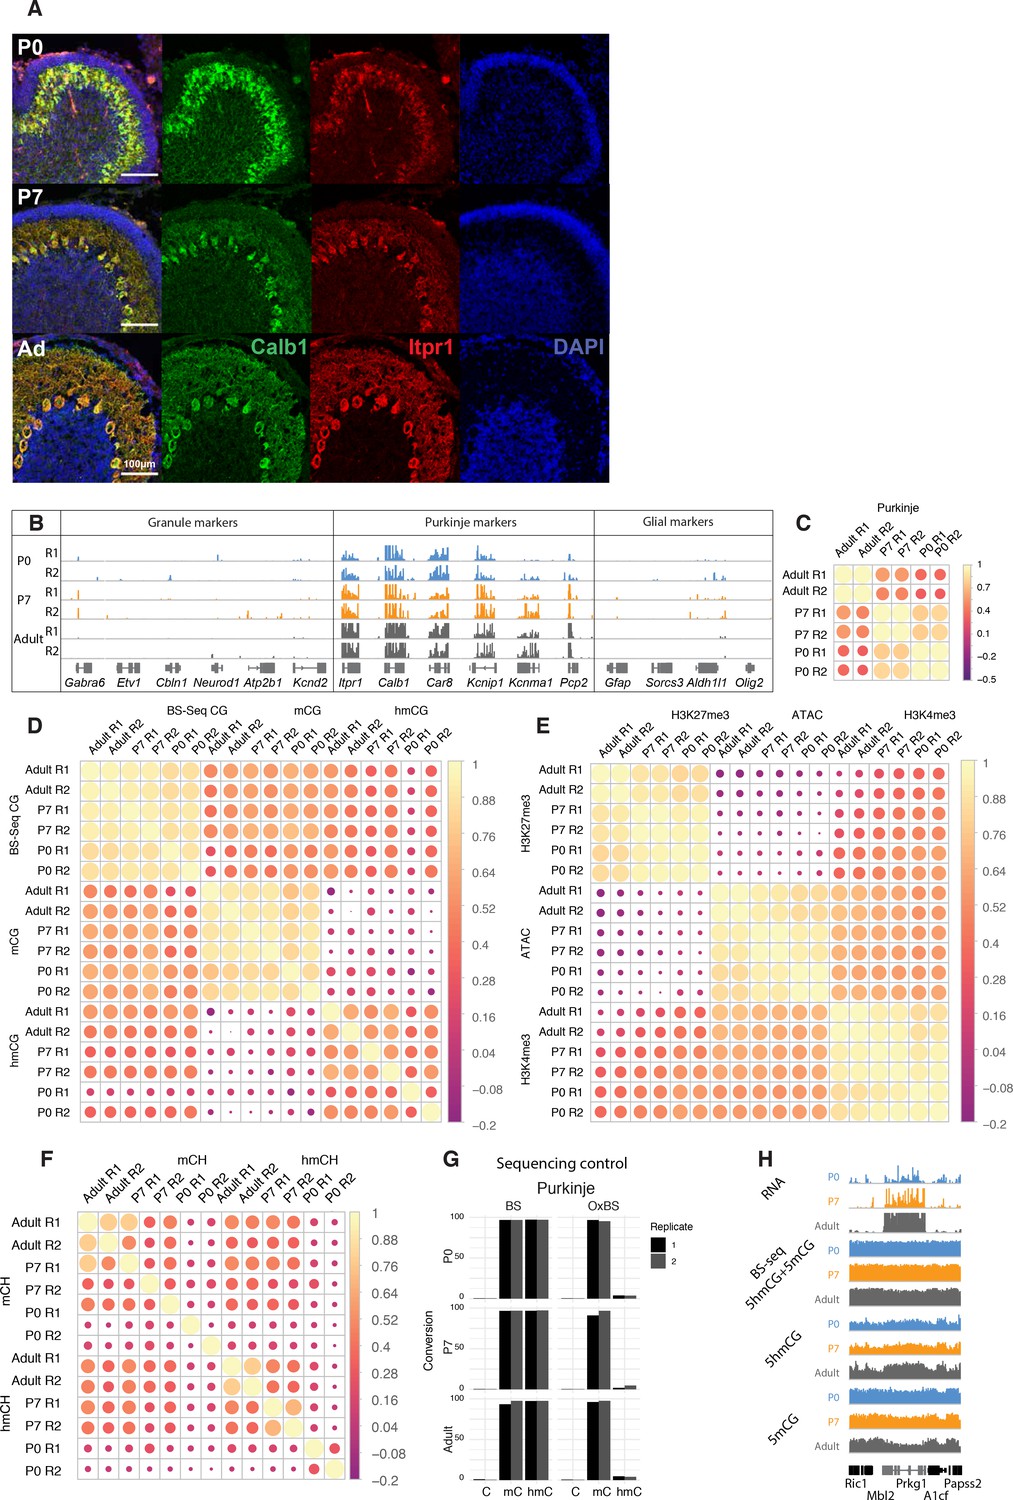
Quality control of sequencing datasets.
(A) Immunofluorescence staining of Purkinje cells at P0, P7, and adult timepoints with Calb1 (green) and Itpr1 (red). (B) Integrated genome viewer (IGV) representation of Purkinje-specific markers (Itpr1, Calb1, Car8, Kcnip1, Kcnma1, Pcp2) enrichment and depletion of granule (Gabra6, Etv1, Cbln1, Neurod1, Atp2b1, Kcnd2) and glial (Gfap, Sorcs3, Aldh1l1, Olig2) markers. (C) Pearson correlation of RNASeq datasets. (D) Pearson correlation of gene body accumulation of 5hmCG + 5 mCG (bisulfite sequencing [BSSeq]), 5hmCG, and 5mCG (derived from maximum likelihood estimator model of BSSeq and oxidative bisulfite sequencing [OxBSSeq]). (E) Pearson correlation of assay for transposase-accessible chromatin sequencing (ATACSeq), H3K4me3, and H3K27me3 chromatin immunoprecipitation sequencing (ChIPSeq) dataset enrichment ±5 kb around the gene promoters. (F) Pearson correlation of gene body accumulation of 5hmCH and 5mCH (derived from maximum likelihood estimator model of BSSeq and OxBSeq). (G) Bisulfite conversion and oxidation efficiency in BSSeq and OxBSSeq datasets. (H) IGV representation of BSSeq (showing 5hmCG + 5 mCG signal together) and OxBSSeq (showing 5hmCG + 5 mCG signal separately) at the three developmental timepoints.
Figure 2 with 1 supplement
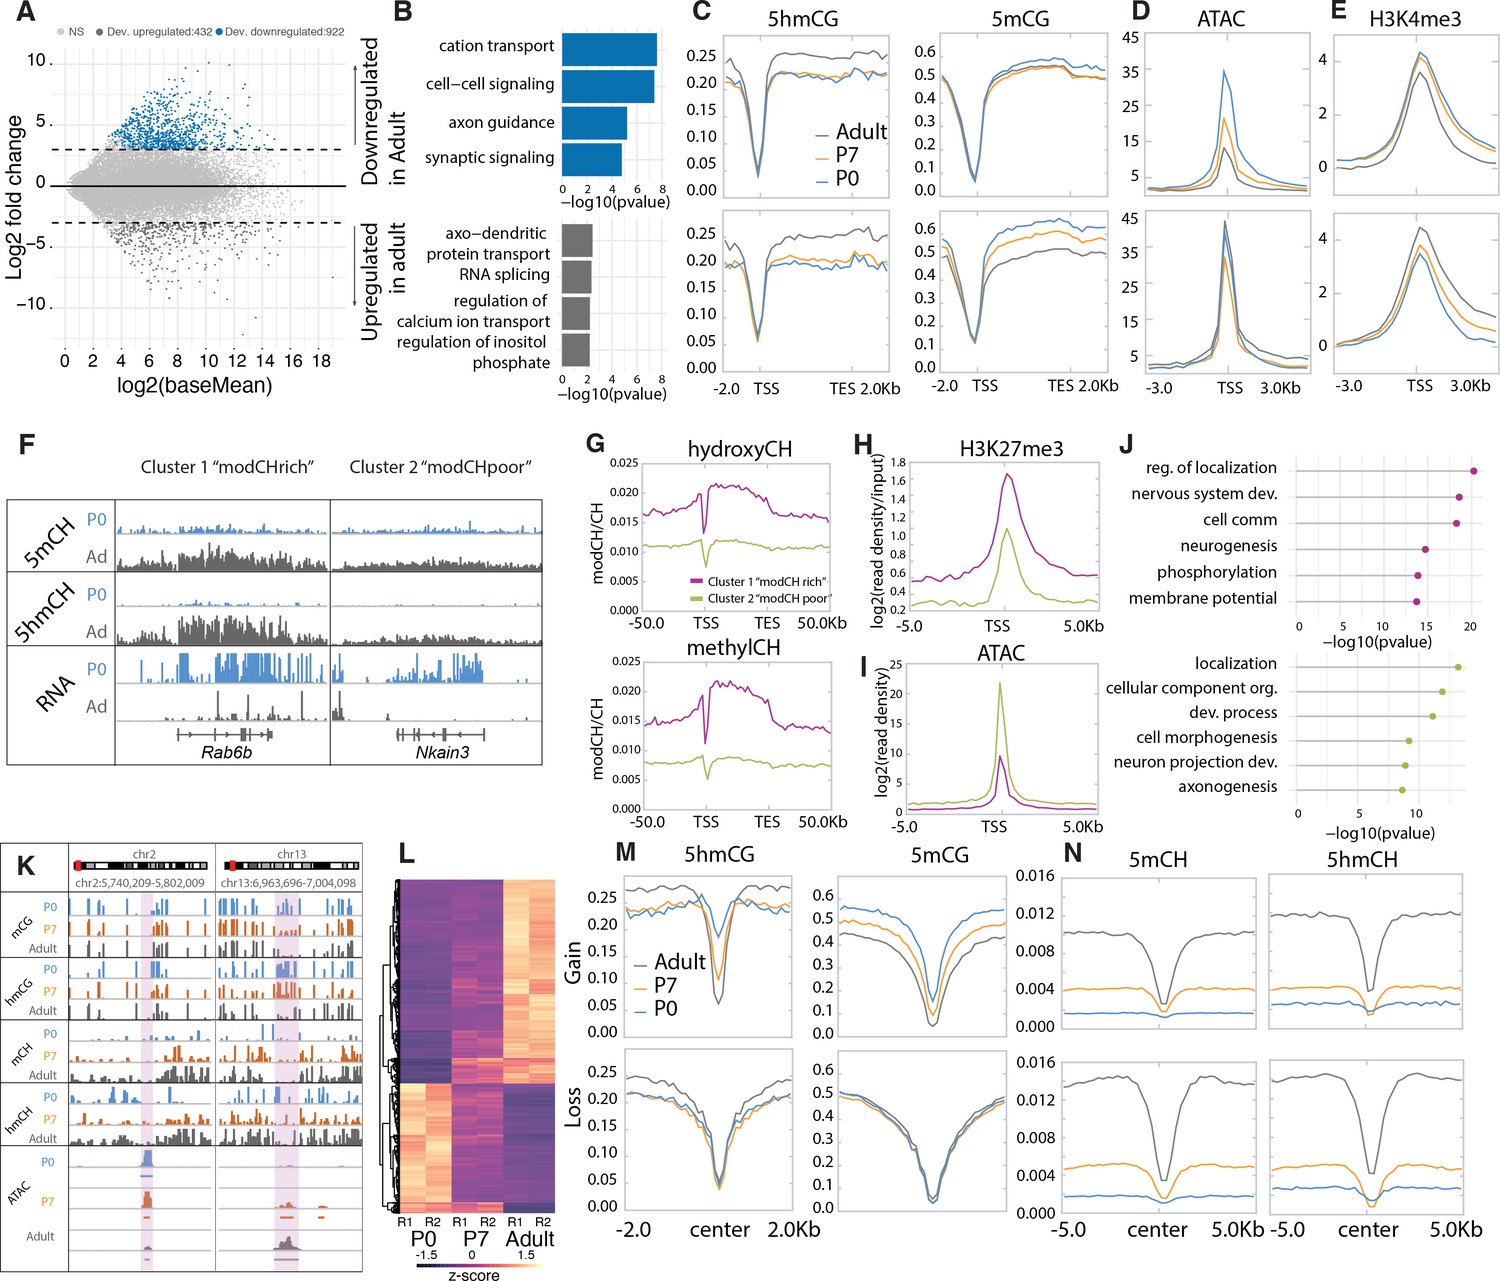
Cytosine modification dynamics in in relation to differential expression and accessibility.
(A) MA plot representing statistically significant (p < 0.01, log2(fold change) > 2) differential gene expression between P0 (blue) and adult (dark gray). Light gray dots represent genes that are not statistically significant. (B) Gene ontology analysis of the developmentally up- and down-regulated genes. (C–E) Metagene plots representing the mean value of 5hmCG/CG, 5mCG/CG (C), assay for transposase-accessible chromatin sequencing (ATACSeq) read density (D) and H3K4me3 accumulation (E) over the gene bodies and promoters of developmentally up- and down-regulated genes over the three timepoints (P0 – blue, P7 – orange, and adult – dark gray). (F) Genome browser representation of the two classes of developmentally down-regulated genes with differential accumulation of CpH modifications. (G–I) Metagene plots representing the mean value of 5hmCH/CH, 5mCH/CH (G), ATACSeq read density (H), and H3K27me3 accumulation (I) over the gene bodies and promoters of developmentally down-regulated genes divided into two clusters by k-means clustering analysis (green for ‘modCHpoor’, purple for ‘modCHrich’). (J) Gene ontology analysis of the two clusters. (K) Genome browser representation of two regions with differential accessibility. (L) Heatmap representing the differentially accessible regions between P0 and adult Purkinje cells (PCs) (p < 0.01, log2(fold change) > 4). (M–N) Metagene plots representing the mean values of 5hmCG/CG and 5mCG/CG (M) and 5hmCH/CH and 5mCH/CH (N) over the centers and flanking regions of peaks that gained or lost accessibility relative to adult PCs.
Figure 2—figure supplement 1
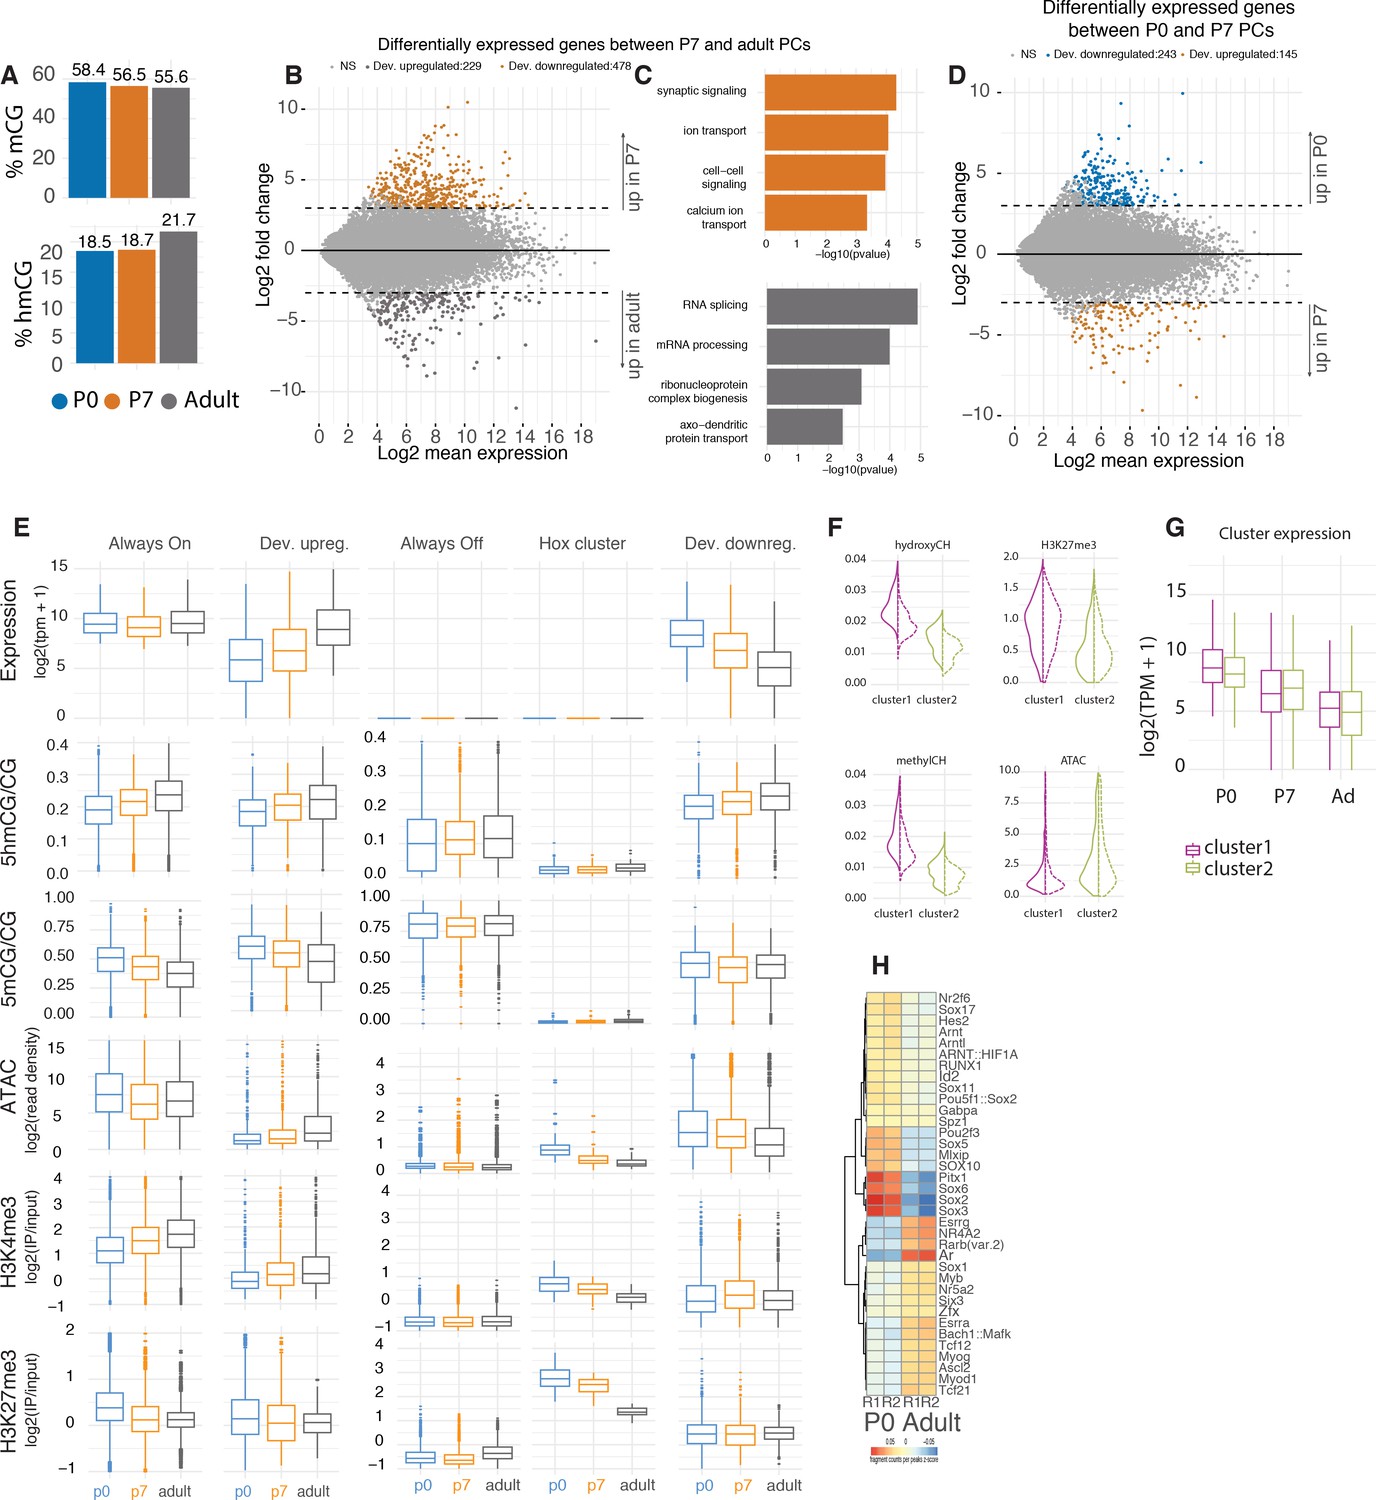
Gene expression and chromatin dynamics during Purkinje cell (PC) development.
(A). Genome-wide quantification of the levels of 5hmCG and 5mCG at each timepoint. (B) MA plot representing differential gene expression between P7 and adult. Orange shaded dots represent genes enriched in P7 and gray dots represent genes enriched in adult, with absolute log2 fold change of 2 and p-adj value of 0.05. (C) Gene ontology (GO) analysis of differentially expressed genes between P7 and adult. (D) MA plot representing differential gene expression between P0 and P7 timepoints. Blue shaded dots represent genes enriched in P0 and orange dots represent genes enriched in P7, with absolute log2 fold change of 2 and p-adj value of 0.05. (E) Quantification of expression, chromatin accessibility, 5mCG, 5hmCG, H3K4me3, and H3K27me3. (F) Violin plots of the quantifications of 5hmCH, 5mCH, ATAC, and H3K27me3 density over the two clusters of repressed genes. (G) Expression levels log2(TPM + 1) of the genes in each cluster. (H) Differentially abundant motifs of transcription factors in chromatin accessibility data between P0 and adult PCs.
Figure 3 with 1 supplement
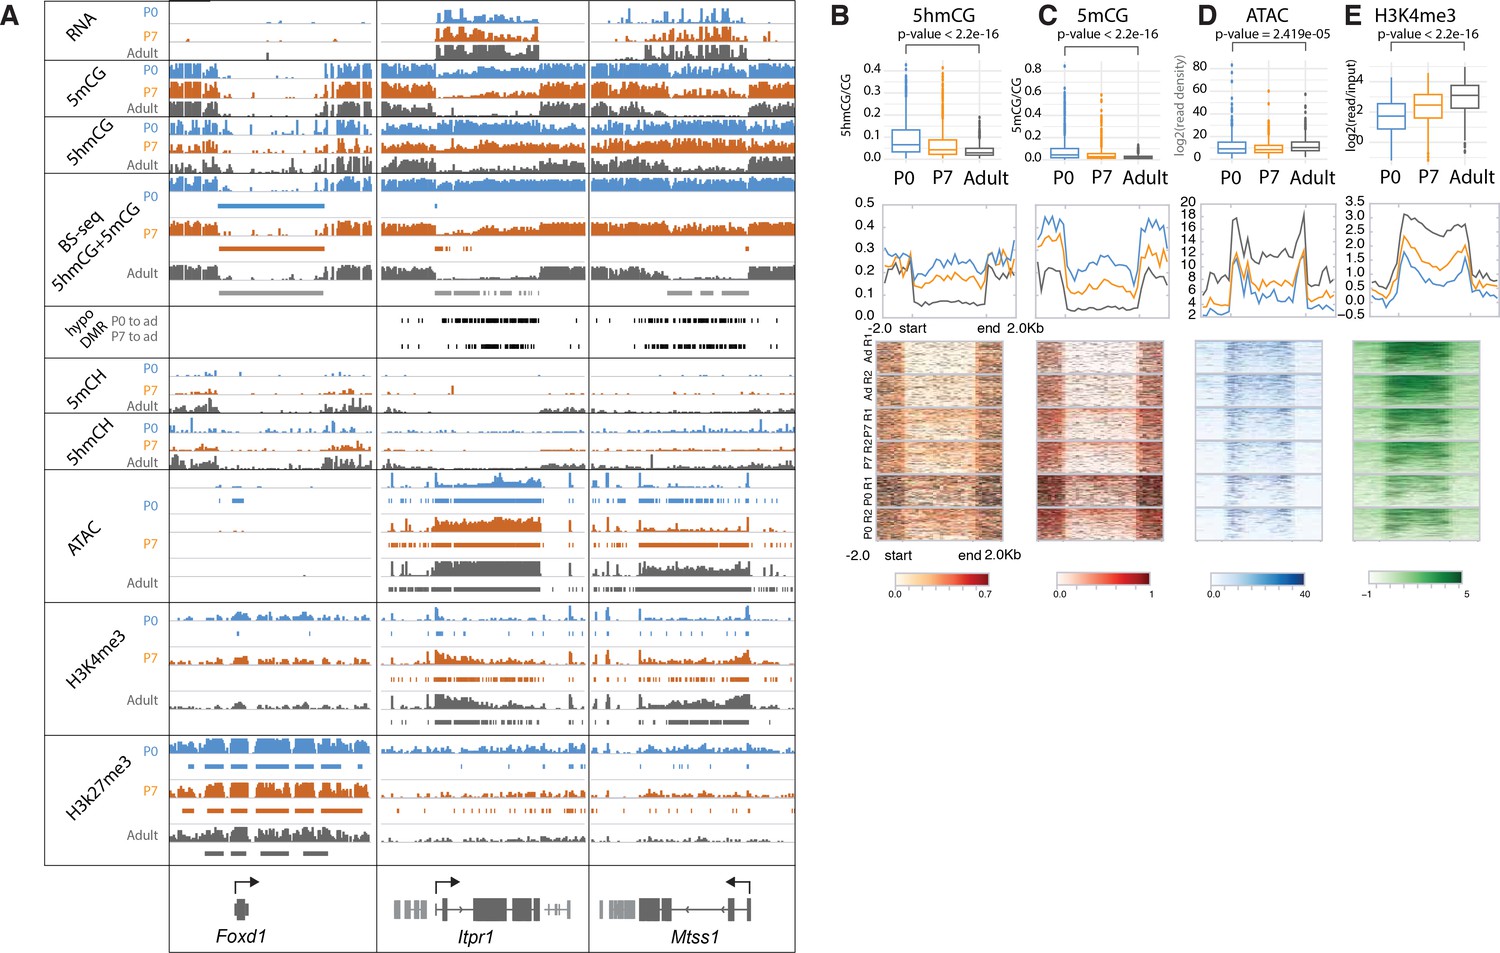
Loss of 5mCG and 5hmCG in a novel class of epigenetically regulated highly expressed Purkinje-specific genes.
(A) Integrated genome viewer (IGV) representation of example regions of inactive DNA methylation valley (DMV) (Foxd1) and active Purkinje cell (PC)-specific DMVs (Itpr1, Mtss1). Bisulfite sequencing (BSSeq) tracks shows combined levels of mCG and hmCG ranging from 0 to 1. Bars under BSSeq tracks are computationally identified DMVs, black bars denote hypo-DMRs (differentially methylated regions) in adult, compared to P0 or P7. Bars under assay for transposase-accessible chromatin sequencing (ATACSeq), H3K4me3, and H3K27me3 tracks denote broad peaks of signal enrichment. (B–E) 5hmCG/CG (B), 5mCG/CG (C), ATACSeq log2(read density) RPKM enrichment (D) and H3K4me3 log2(input normalized) RPKM enrichment (E) quantification over DMVs at each timepoint. Boxplots show mean value per DMVs, the test for significance is Wilcoxon. Metagene plots show mean value ±2 kb around the DMV region, regardless of gene directionality. Heatmaps show data summarized in the metagene plots.
Figure 3—figure supplement 1
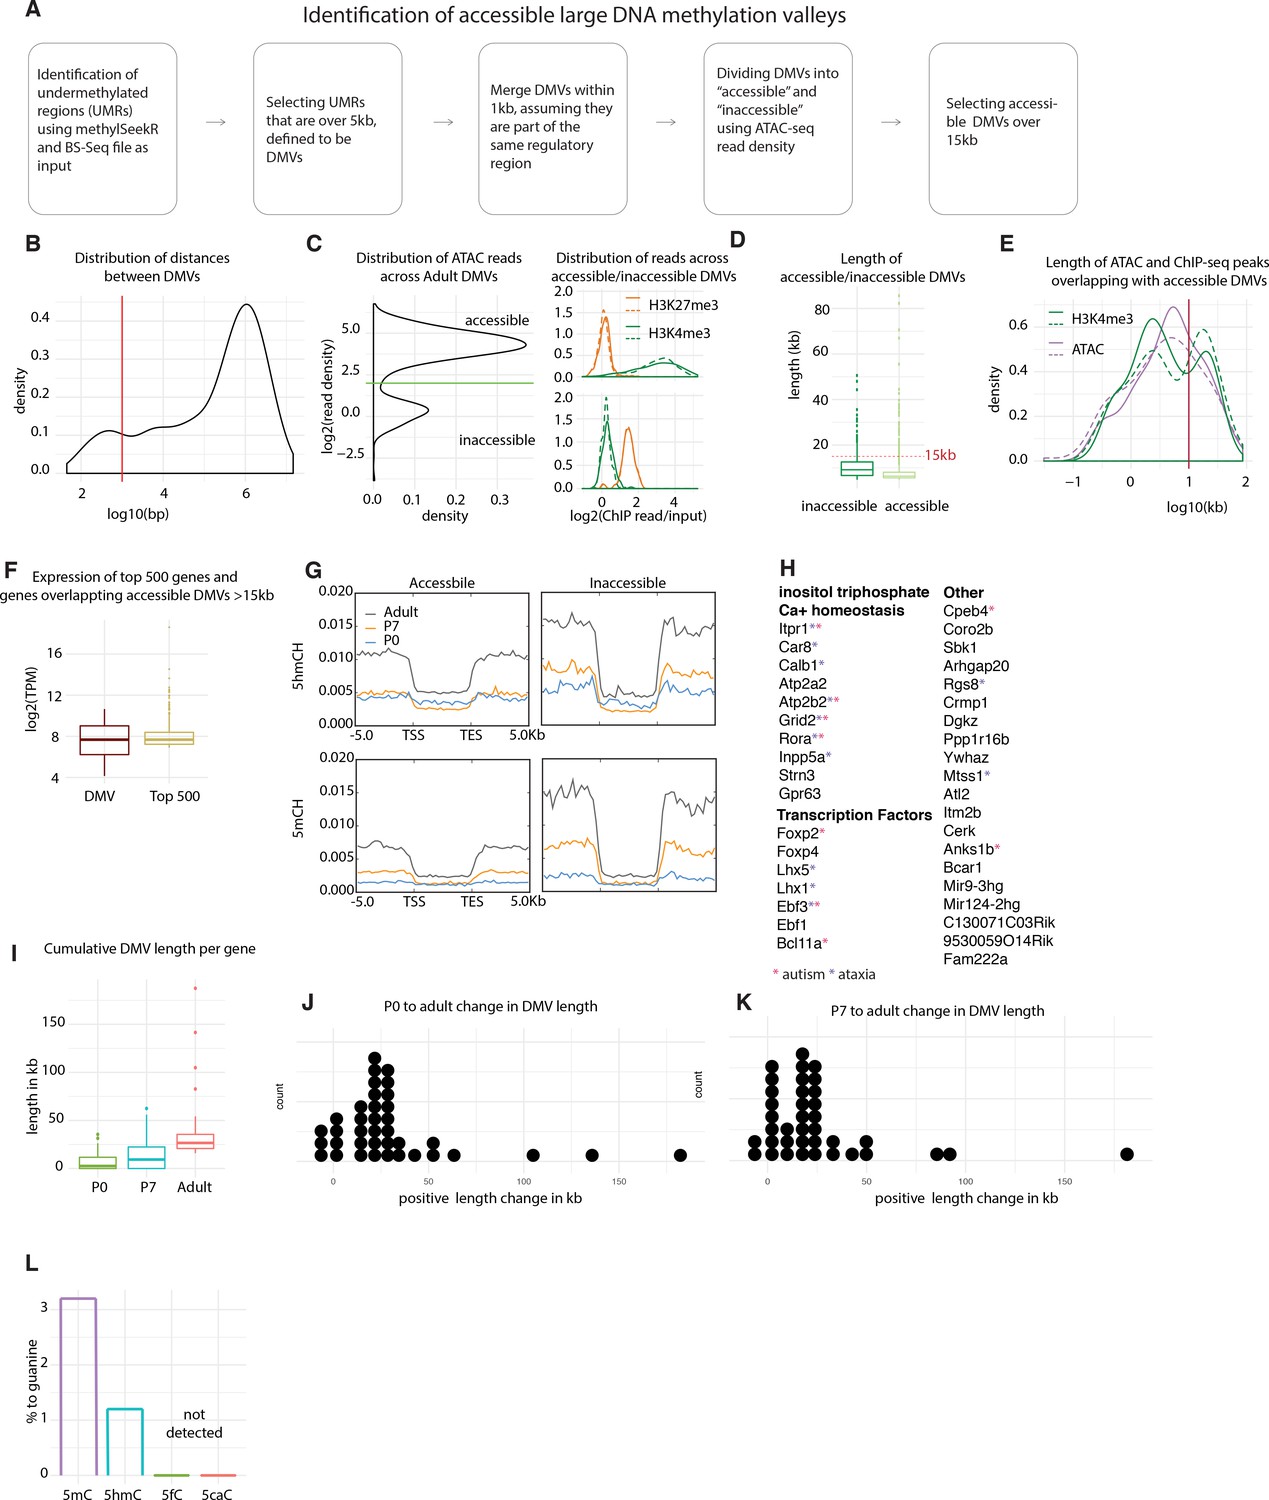
Characterization of Purkinje-specific DNA methylation valleys (DMVs).
(A) Schematic of DMV identification and filtering. (B) Distribution of distances between DMVs. DMVs within 1 kb of each other are assumed to be part of the same regulatory region and therefore merged. (C) Assay for transposase-accessible chromatin sequencing (ATACSeq) read density over DMVs shows a bimodal distribution, segregating DMVs into accessible and inaccessible (left panel). Inaccessible DMVs show enrichment for H3K27me3 reads, while accessible DMVs show enrichment for H3K4me3 reads (right panel, dotted and straight lines designate replicates). (D) Distribution of lengths of accessible and inaccessible DMVs. (E) Length of broad peaks of ATACSeq and H3K4me3 chromatin immunoprecipitation sequencing (ChIPSeq) overlapping large accessible DMVs. (F) Expression of the top 500 most expressed genes in Purkinje cells (PCs) and the genes associated with DMVs. (G) DMVs do not accumulate any modifications in CH context. (H). Genes associated with DMVs, red star denotes role in autism, gray in ataxia (I). Cumulative length of DMVs per gene. (J–K) Change of DMV length between P0 and adult (J) and P7 and adult (K). (L) Mass spectrometry analysis of genomic DNA from adult PCs.
Figure 4 with 2 supplements
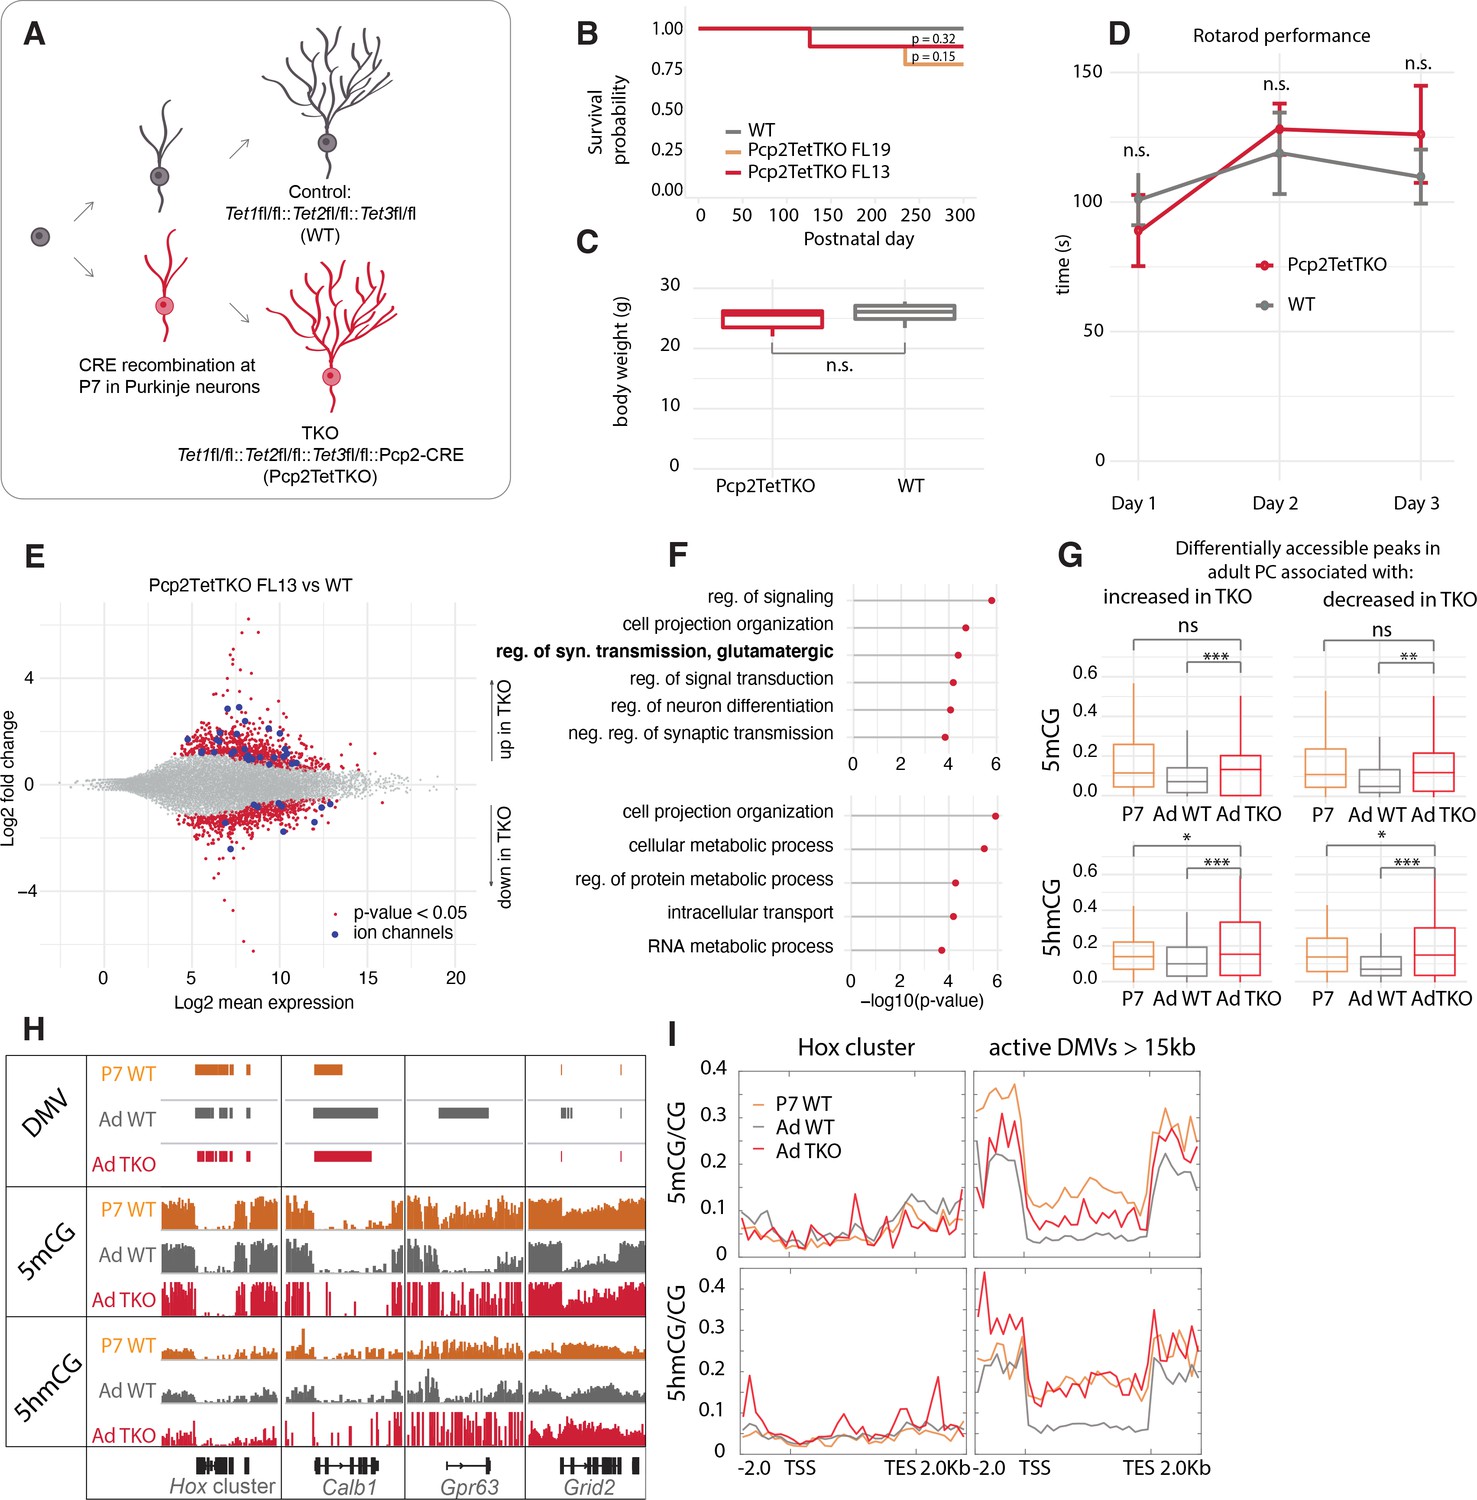
Loss of Tet activity leads to impaired gene expression regulation in Purkinje cells (PCs).
(A) Schematic of experimental design to probe the triple Tet1, Tet2, Tet3 knockout effect in adult PCs. (B) Kaplan-Meier curve representing the survival fraction of wild-type (WT) (n = 8) and PC-specific triple knockout (Pcp2TetTKO) (Founder13 n = 8, Founder19 n = 8) mice since date of birth. (C) Body weight of WT and Pcp2TetTKO at 8 weeks. (D) Rotarod evaluation of motor skills in WT and Pcp2TetTKO at 8 weeks. (E) MA plot representing differential gene expression analysis between WT and Pcp2TetTKO. Navy dots represent genes with p-value < 0.05, red dots – ion channels. (F) Gene ontology analysis of statistically significant differentially expressed genes. Top panel shows categories of genes with increased expression in Pcp2TetTKO, bottom panel shows genes with decreased expression in Pcp2TetTKO. (G) Levels of 5hmCG/CG and 5mCG/CG over differentially accessible peaks only present in adult PCs (compared to P0). (H) Integrated genome viewer (IGV) representation of example DNA methylation valleys (DMVs) affected by Pcp2TetTKO. Hox cluster and Calb1 show minor changes in length as they are established before the P7 onset of Cre. Gpr63 and Grid2 show significant reduction in length as they are established after P7. Solid bars represent DMVs identified at each condition. (I) Quantification of 5hmCG/CG and 5mCG/CG over the two classes of DMVs – Hox cluster and large active DMVs.
Figure 4—figure supplement 1
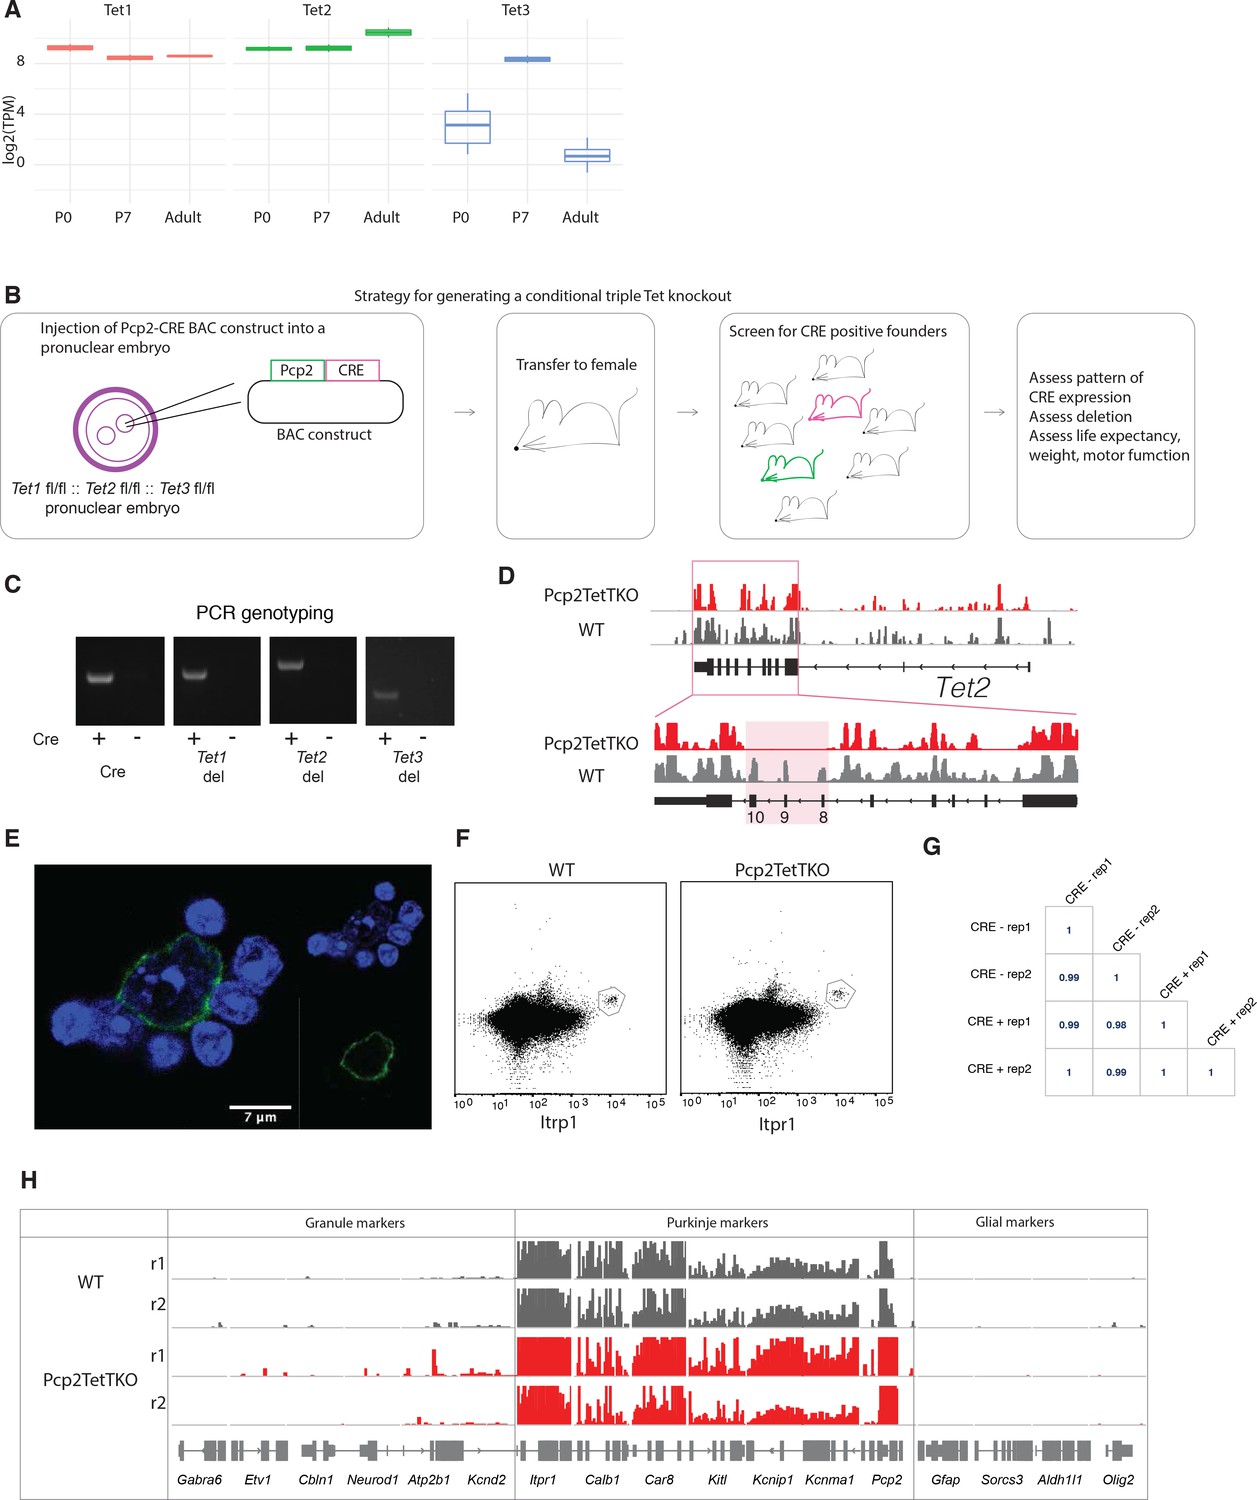
Generation of Pcp2 cre/wt:: Tet1 del/del:: Tet2 del/del:: Tet3 del/del (Purkinje cell-specific triple knockout [Pcp2TetTKO]) mouse founder lines.
(A) Expression levels of Tet1, Tet2, and Tet3 proteins at P0, P7, and adult developmental stages of Purkinje cells. (B) Schematic of Pcp2TetTKO generation via pronuclear injection. (C) PCR genotyping for CRE, Tet1 deletion, Tet2 deletion, and Tet3 deletion in adult Pcp2TetTKO Purkinje genomic DNA. (D) Deletion of Tet2 exons evident in nuclear RNASeq Pcp2TetTKO. (E) Example of Pcp2TetTKO nuclei stained with Itpr1 post-dissociation and pre-sorting, counterstained with DAPI, a heterochromatin marker. (F) Example fluorescence-activated nuclear sorting (FANS) plot of adult Pcp2TetTKO nuclei. (G) Pearson correlation between TKO and control. (H) Integrated genome viewer (IGV) representation of Purkinje-specific markers (Itpr1, Calb1, Car8, Kitl, Kcnip1, Kcnma1, Pcp2) enrichment and depletion of granule (Gabra6, Etv1, Cbln1, Neurod1, Atp2b1, Kcnd2) and glial (Gfap, Sorcs3, Aldh1l1, Olig2) markers in Pcp2TetTKO and wild type (WT).
Figure 4—figure supplement 2

Cytosine dynamics in Purkinje cell-specific triple knockout (Pcp2TetTKO).
(A-C) Pcp2 cre/wt:: Tet1 del/del:: Tet2 del/del:: Tet3 del/del mice were crossed to ROSA26-eGFP reporter line to evaluate CRE expression during development. Panels represent murine cerebella at P0 (A), P7 (B), and P56 (C) timepoints in FL13, stained with anti-GFP antibody. (D) Anti-GFP staining in P56 FL19. (E) Expression of genes with increased and decreased expression in Pcp2TetTKO (boxplots in left panel, heatmaps in right panel). (F) Metagene plot of mean mCG and hmCG modifications over promoters and gene bodies of genes with increased or decreased expression in Pcp2TetTKO. (G) Cumulative DNA methylation valley (DMV) length per gene body between Pcp2TetTKO and wild type (WT). (H) Change in cumulative DMV length between adult Pcp2TetTKO and WT.
Tables
Key resources table
| Reagent type (species) or resource | Designation | Source or reference | Identifiers | Additional information |
|---|---|---|---|---|
| Strain, strain background (Mus musculus) | Wild type | Jackson Labs | RRID:IMSR_JAX:000664 | |
| Strain, strain background (Mus musculus) | Tet1 fl/fl:: Tet2 fl/fl:: Tet3 fl/fl | Anjana Rao | ||
| Strain, strain background (Mus musculus) | Tet1 fl/fl:: Tet2 fl/fl:: Tet3 fl/fl:: Pcp2-CRE | This paper | This line was generated as described in the Materials and methods section ‘Pcp2TetTKO murine strain generation’ | |
| Recombinant DNA reagent | Pcp2-CRE (BAC construct) | GENSAT | RP24-186D18 | |
| Antibody | Anti-Itpr1 (mouse monoclonal) | Origene | Origene: TA326547 | (1:500) |
| Antibody | Anti-Itpr1 (mouse monoclonal) | Abcam | Abcam: ab190239 | (1:500) |
| Antibody | Anti-Calb1 (rabbit polyclonal) | Immunostar | RRID: AB_572222Immunostar: 24,427 | (1:500) |
| Antibody | Anti-H3K27me3 (rabbit polyclonal) | Active motif | RRID: AB_2561020Active motif: 39,155 | (4 µL) |
| Antibody | Anti-H3K4me3 (rabbit polyclonal) | Active motif | RRID: AB_2615077Active motif: 39,159 | (4 µL) |
| Antibody | Anto-GFP (chicken polyclonal) | Abcam | Abcam: ab13970 | (1:500) |
| Sequence-based reagent | Raw and processed sequencing data | This paper | GSE166423 | The sequencing data was generated as described in the Materials and methods section ‘Sequencing methods’ |
| Commercial assay or kit | AllPrep FFPE | Qiagen | Qiagen: 80,234 | |
| Commercial assay or kit | Low Cell ChIPSeq kit | Active motif | Active motif: 53,084 | |
| Commercial assay or kit | Ultralow MethylSeq with Trumethyl OxBS | Tecan Genomics | Tecan Genomics: 0414–32 | |
| Commercial assay or kit | Nextera library prep kit | Illumina | Illumina: FC-131–1024 | |
| Commercial assay or kit | Bioanalyzer Pico | Agilent | Agilent: 5067–1513 | |
| Commercial assay or kit | TapeStation High sensitivity D1000 | Agilent | Agilent: 5067–5593 |
Additional files
-
Supplementary file 1
Developmental differentially expressed genes between P0 and adult Purkinje cells.
- https://cdn.elifesciences.org/articles/66973/elife-66973-supp1-v1.xlsx
-
Supplementary file 2
DNA methylation valleys (DMVs) identified in adult Purkinje neurons.
- https://cdn.elifesciences.org/articles/66973/elife-66973-supp2-v1.xlsx
-
Supplementary file 3
Differentially expressed genes in the adult triple Tet proteins knockout.
- https://cdn.elifesciences.org/articles/66973/elife-66973-supp3-v1.xlsx
-
Transparent reporting form
- https://cdn.elifesciences.org/articles/66973/elife-66973-transrepform1-v1.docx
Download links
A two-part list of links to download the article, or parts of the article, in various formats.
Downloads (link to download the article as PDF)
Open citations (links to open the citations from this article in various online reference manager services)
Cite this article (links to download the citations from this article in formats compatible with various reference manager tools)
5-Hydroxymethylcytosine-mediated active demethylation is required for mammalian neuronal differentiation and function
eLife 10:e66973.
https://doi.org/10.7554/eLife.66973


