Fish primary embryonic pluripotent cells assemble into retinal tissue mirroring in vivo early eye development
- Centre for Organismal Studies Heidelberg, Heidelberg University, Germany
- Heidelberg International Biosciences Graduate School HBIGS and HeiKa Graduate School on “Functional Materials”, Germany
Figures
Figure 1 with 2 supplements
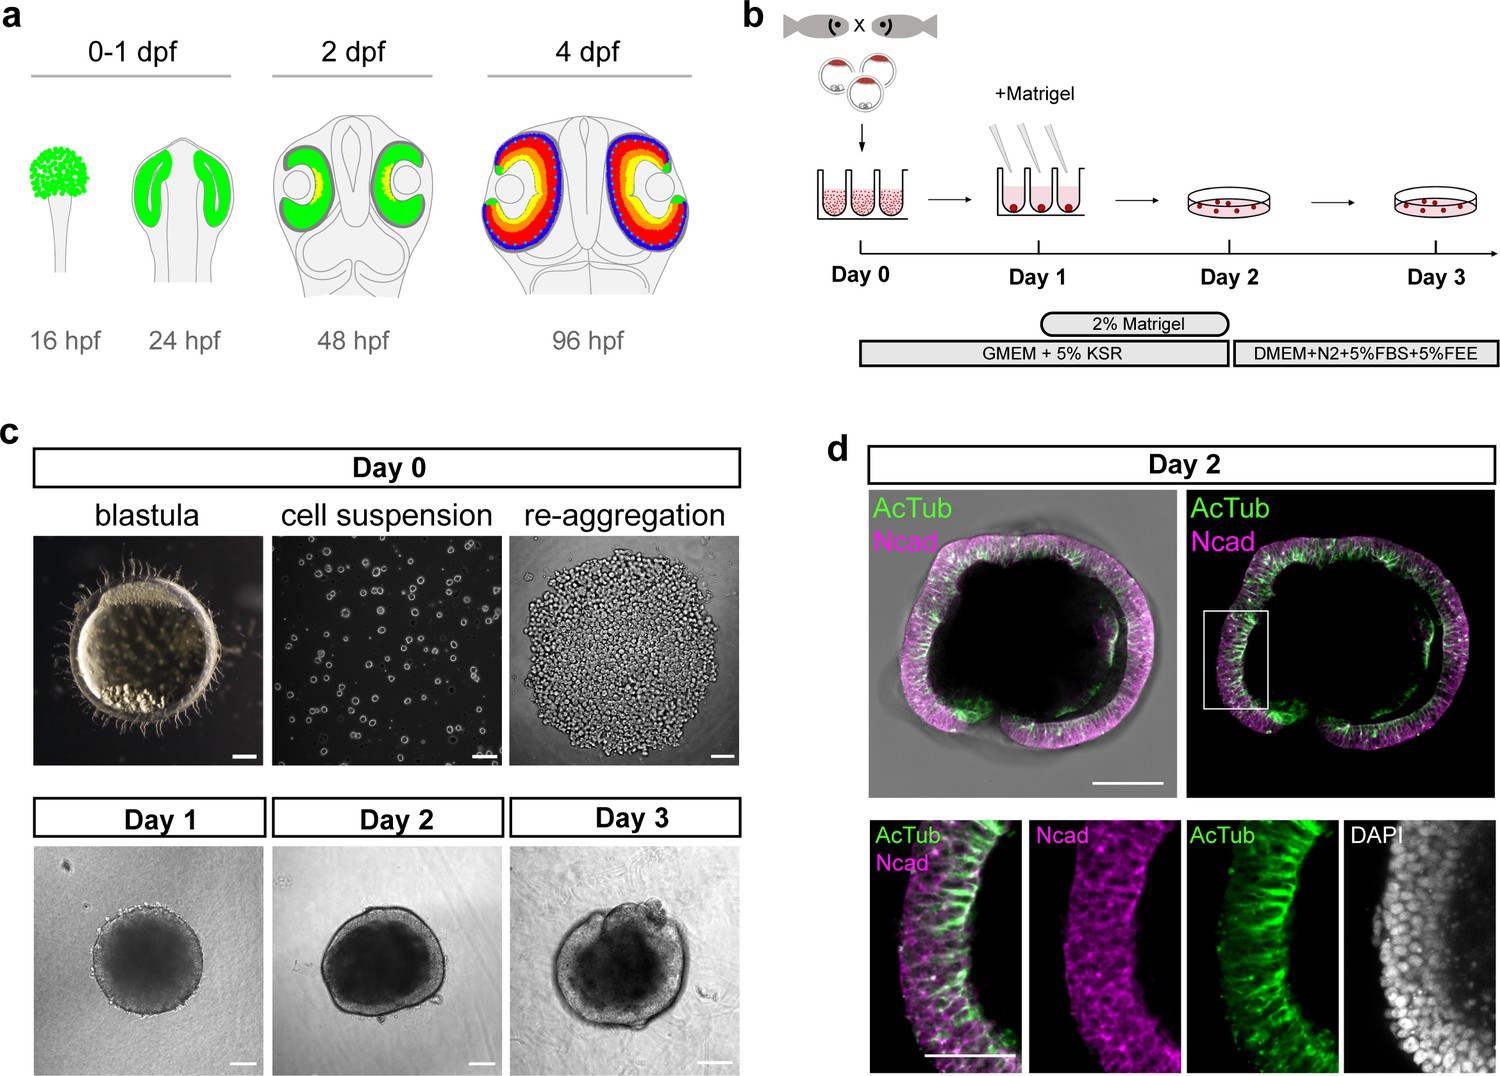
Generation of medaka fish primary pluripotent cell-derived aggregates.
(a) Scheme representing stages and timing of the medaka fish retinal development. The retinal domain is indicated in green. Establishment of the eye field within the anterior neural plate is followed by the formation of optic vesicles at 1 day post-fertilization (dpf). Optic vesicle evagination is followed by the morphogenesis of a bi-layered optic cup formed by retina surrounded by retinal pigmented epithelium (RPE) and subsequent onset of retinal differentiation at 2 dpf. By 4 dpf, the major retinal cell types – retinal ganglion cells (yellow), amacrine cells (orange), bipolar cells (red), horizontal cells (cyan), and photoreceptor cells (blue) – are generated. (b) Schematic representation of aggregate generation, its timeline and culture conditions. At day 0, primary pluripotent cells were harvested from blastula-stage medaka embryos and re-aggregated in low binding U-shape 96-well plates. At day 1, the culture media was supplemented with Matrigel. At day 2, the aggregates were transferred to a low binding culture plate and maintained in 3D suspension culture conditions in DMEM/F12 media supplemented with 5% FBS, 5% FEE, and N2 supplement. The gross morphology of the aggregates was analyzed at days 1, 2, and 3. KSR, knockout serum replacement; FBS, fetal bovine serum; FEE, fish embryonic extract. (c) Dark-field images of a blastula-stage embryo, a blastula-derived cell suspension, and re-aggregated cells and the gross morphology of aggregates at days 1, 2, and 3 after re-aggregation. (d) Optical section showing aggregate organization at day 2 visualized by immunostaining against neuroepithelium-specific markers, N-cadherin (Ncad), and acetylated tubulin (AcTub), co-stained with DAPI nuclear stain. Scale bars: 100 and 50 μm (enlargement in (d)).
Figure 1—figure supplement 1
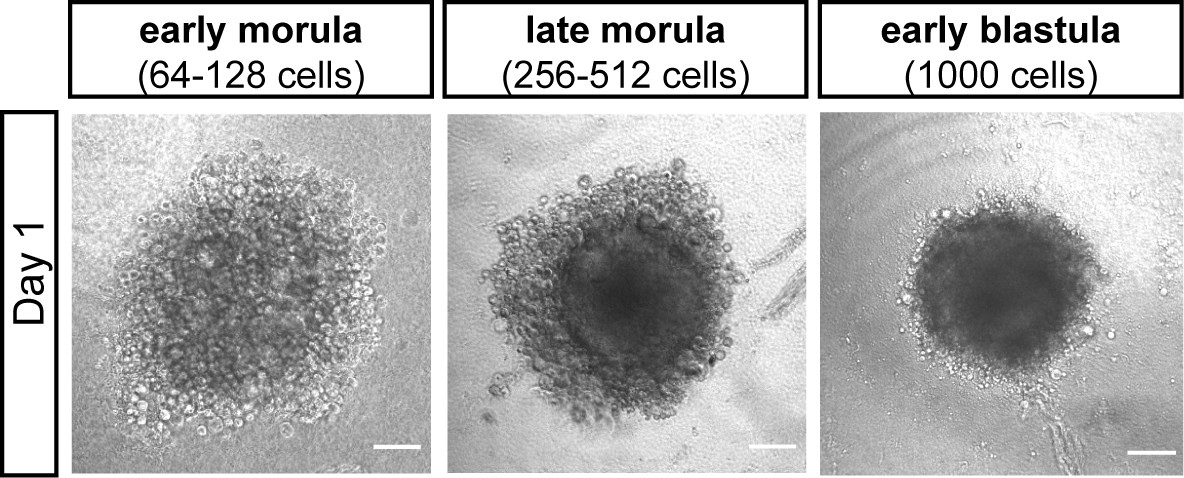
Impact of time point of medaka cell extraction on aggregation efficiency.
Bright-field images of day 1 aggregates derived from early morula (64–128 cells), late morula (256–512 cells), and early blastula (1000 cells). Scale bar: 100 μm.
Figure 1—figure supplement 2
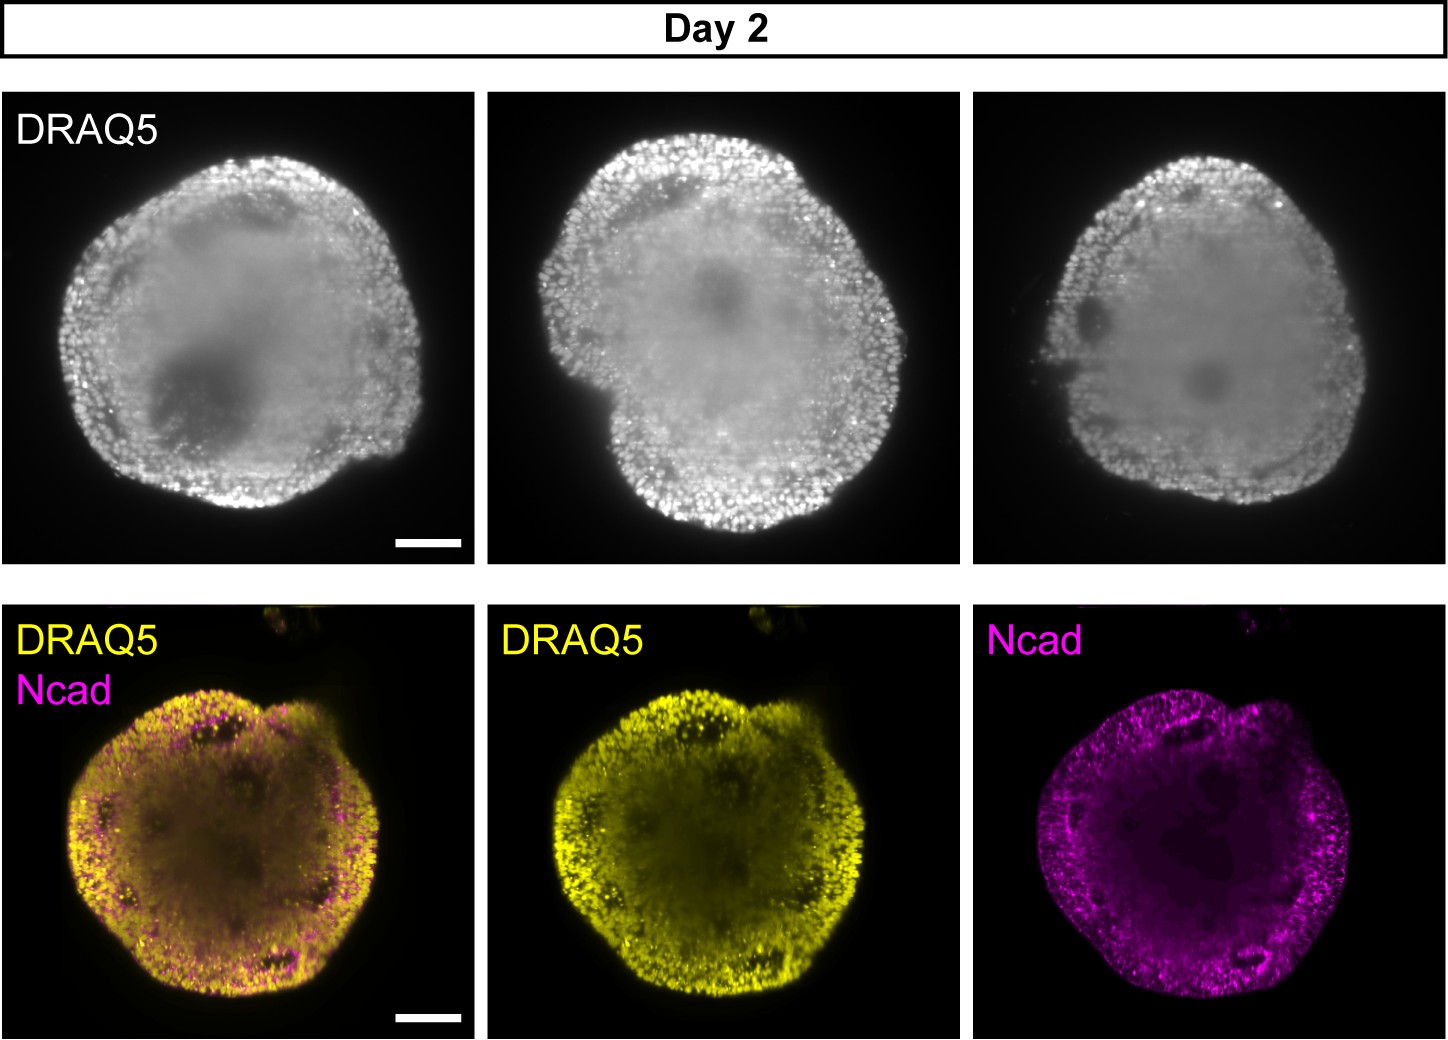
Interior composition of day 2 organoids.
Virtual planes of four day 2 aggregates, stained with N-cadherin (Ncad) and DRAQ5 nuclear stain, showing the interior cellular composition using SPIM imaging. Scale bar: 100 μm.
Figure 2 with 4 supplements

Medaka-derived organoids form retinal neuroepithelium under the control of Rx3.
(a) Schematic representation of the Rx3::H2B-GFP transgenic construct and the corresponding expression domain of GFP in the optic vesicles of a developing medaka embryo at 1 dpf. (b) Scheme of organoid generation from Rx3::H2B-GFP transgenic fish. (c) Bright-field and fluorescence images of aggregates derived from Rx3::H2B-GFP transgenic fish at 0.5, 6, and 16 hpa. (d) Analysis of the onset of GFP expression in Rx3::H2B-GFP-derived fish embryos (n = 6) and organoids (n = 17). ***p<0.001. (e) Optical sections of day 1 (before the addition of Matrigel) and day 2 organoids derived from Rx3::H2B-GFP transgenic fish stained with antibodies against N-cadherin (Ncad) and GFP, co-stained with DAPI nuclear stain. (f) Generation of Rx3KO (Rx3saGFP) line – schematic representation of the Rx3 locus with integrated saGFP-OPT cassette. An open reading frame-adjusted gene trap cassette comprising a splice acceptor and a GFP sequence (saGFP) followed by a polyA and a strong terminator sequence derived from the ocean pout (OPT; STOP) were inserted into the Rx3 locus. (g) Scheme of organoid generation from Rx3-deficient single blastulae. (h) Bright-field and fluorescence images of phenotypes of Rx3saGFP/+(Rx3 +/- heterozygote) and Rx3saGFP/saGFP (Rx3 -/- homozygote) mutants at 1 dpf and corresponding organoids at day 2. dpf, days post-fertilization; hpa, hours post-aggregation; hpf, hours post-fertilization; wt, wild type. Scale bar: 100 μm.
Figure 2—figure supplement 1
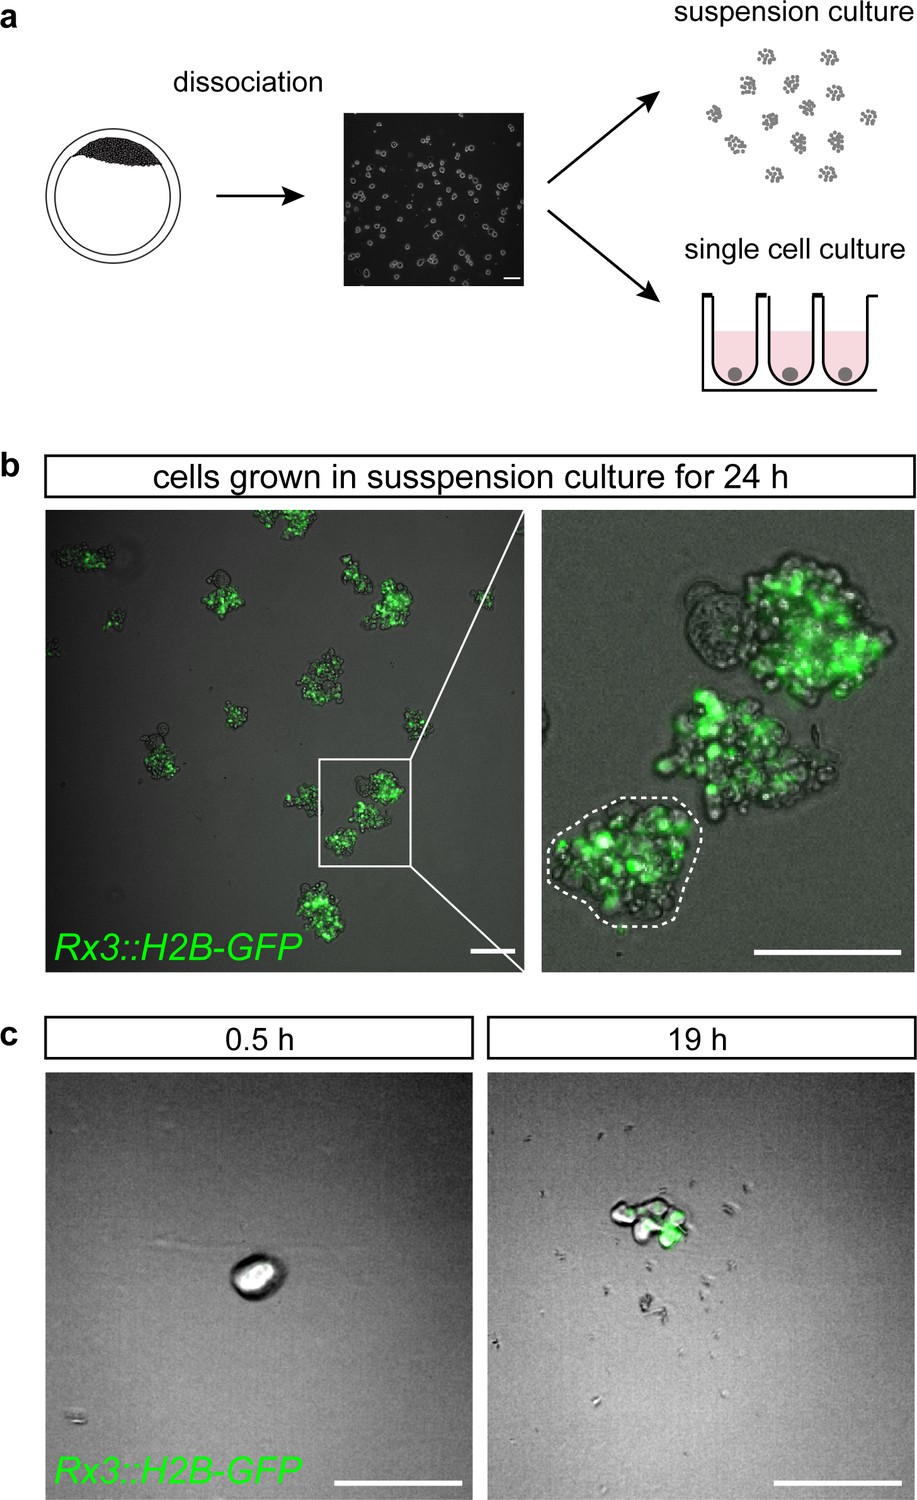
Medaka primary embryonic pluripotent cells acquire retinal fate cell autonomously, independently of cell aggregation.
(a) Schematic representation of primary embryonic pluripotent cell culture. Blastula-stage embryos were dissociated and cultured either under rocking suspension culture condition or as individual cells in wells of 96-well plates. (b) Overlay of bright-field and fluorescence images of cells derived from Rx3::H2B-GFP transgenic fish and cultured for 24 hr under rocking suspension culture conditions. Magnification shows three individual clusters of cells. Dashed line outlines the borders of an individual cluster. (c) Overlay of bright-field and fluorescence images of cells derived from Rx3::H2B-GFP transgenic fish cultured individually in wells of 96-well plates at time 0.5 hr (just about 30 min after dissociation and seeding) and 19 hr of the culture. Scale bars: 100 μm.
Figure 2—figure supplement 2
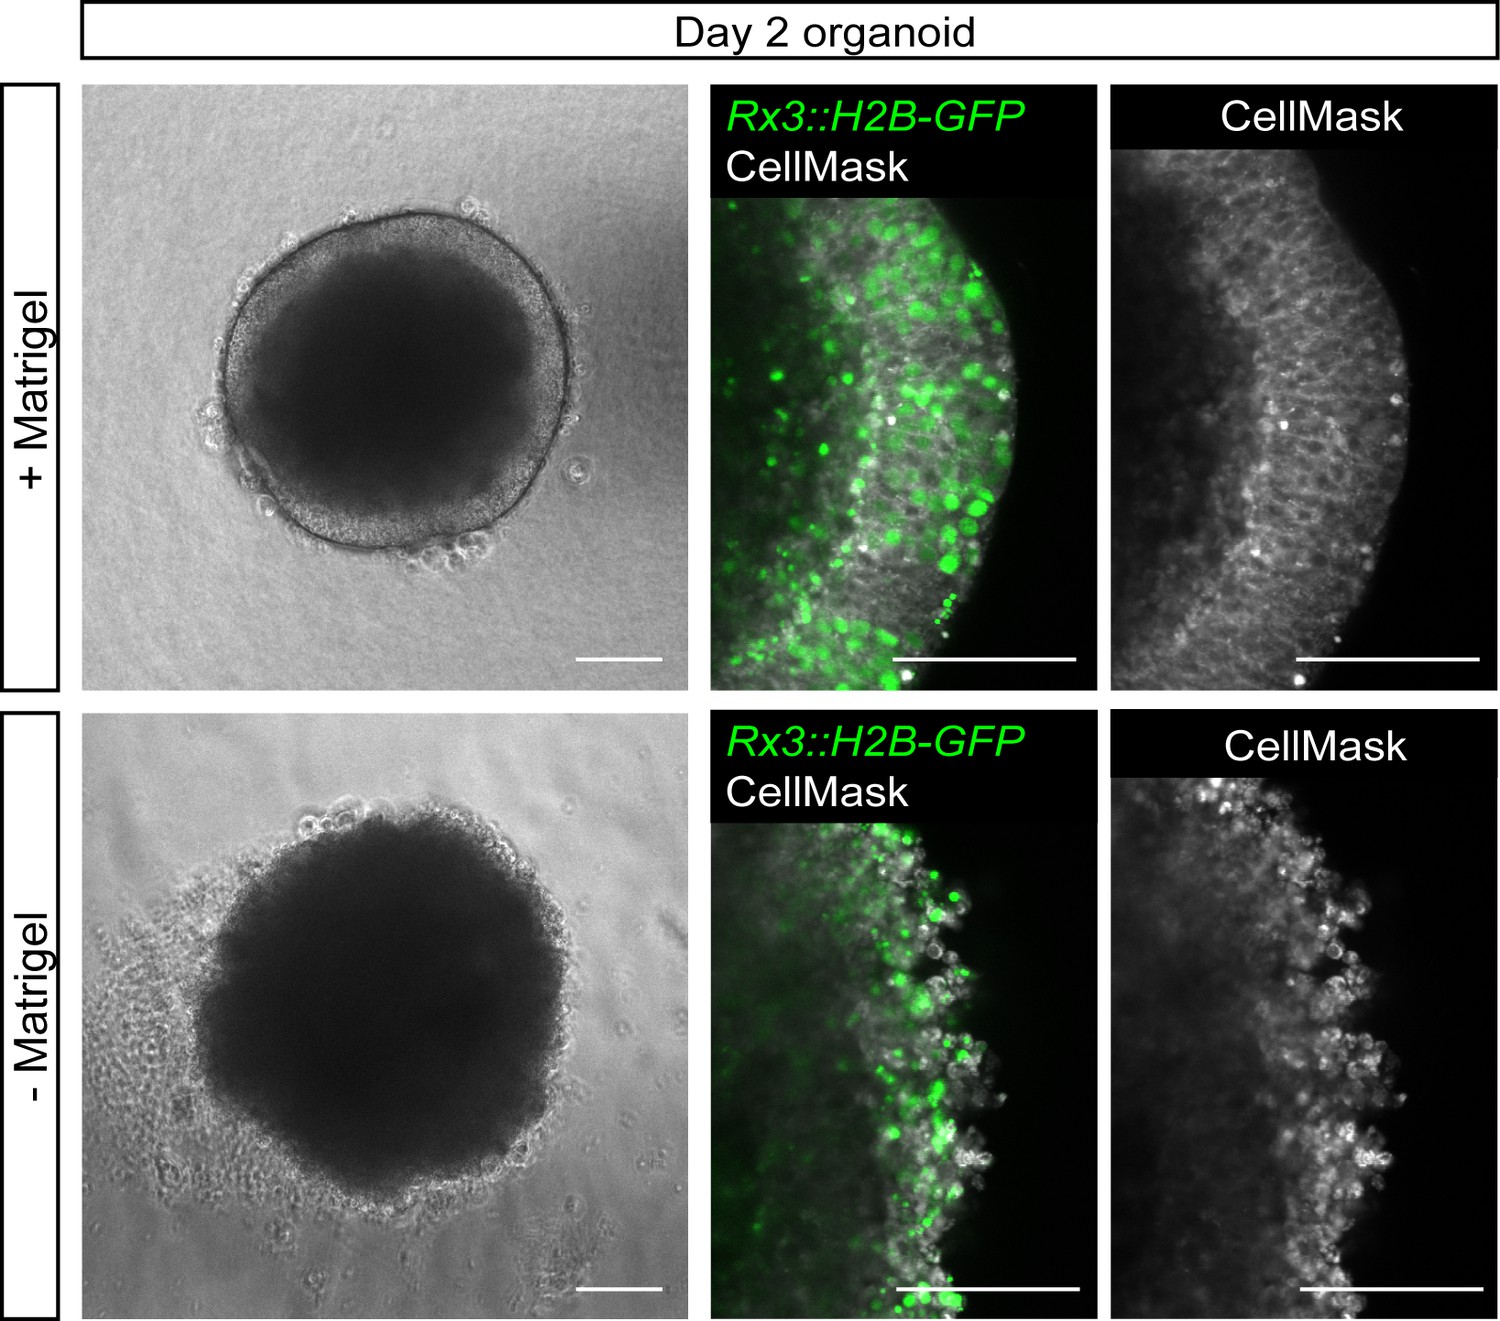
Impact of Matrigel addition on neuroepithelium organization.
Bright-field and fluorescence images of day 2 organoids derived from Rx3::H2B-GFP transgenic fish incubated with and without Matrigel from day 1 to day 2. Membrane stain (CellMask) shows the organization of the neuroepithelium. Scale bars: 100 and 50 μm (enlargement in detail of neuroepithelium).
Figure 2—figure supplement 3
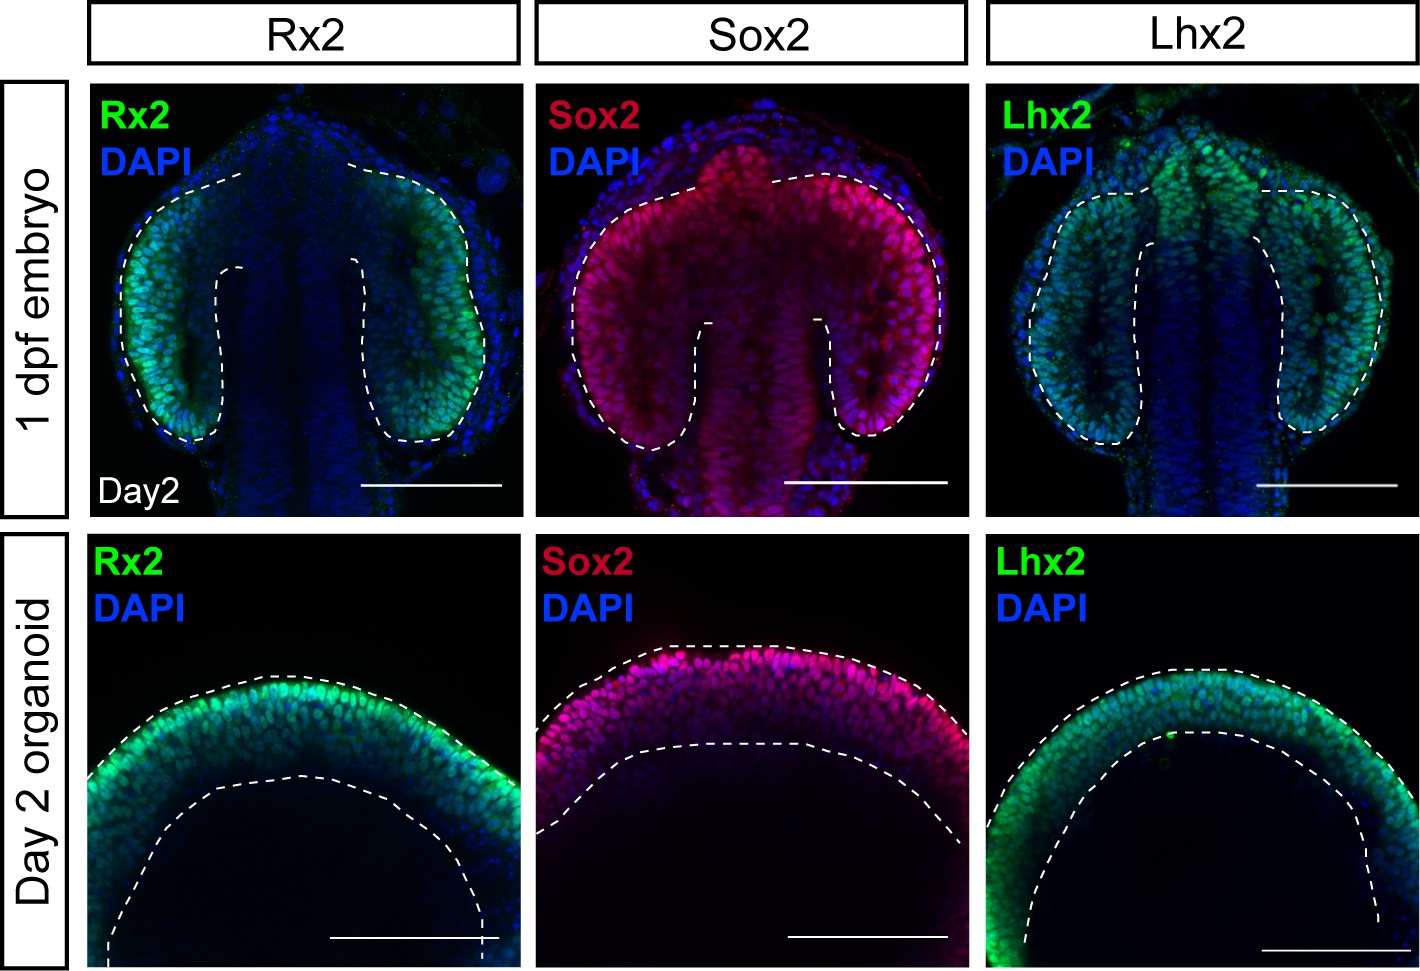
Expression of retina-specific factors Rx2, Sox2, and Lhx2 in retinal organoid neuroepithelium.
Optical sections of embryonic heads (upper panel) and organoids (lower panel) stained with antibodies showing expression of Rx2, Sox2, and Lhx2 co-stained with DAPI nuclear stain. Dashed lines indicate optic vesicles in an embryo or neuroepithelium in an organoid. dpf, days post-fertilization. Scale bar: 100 μm.
Figure 2—figure supplement 4
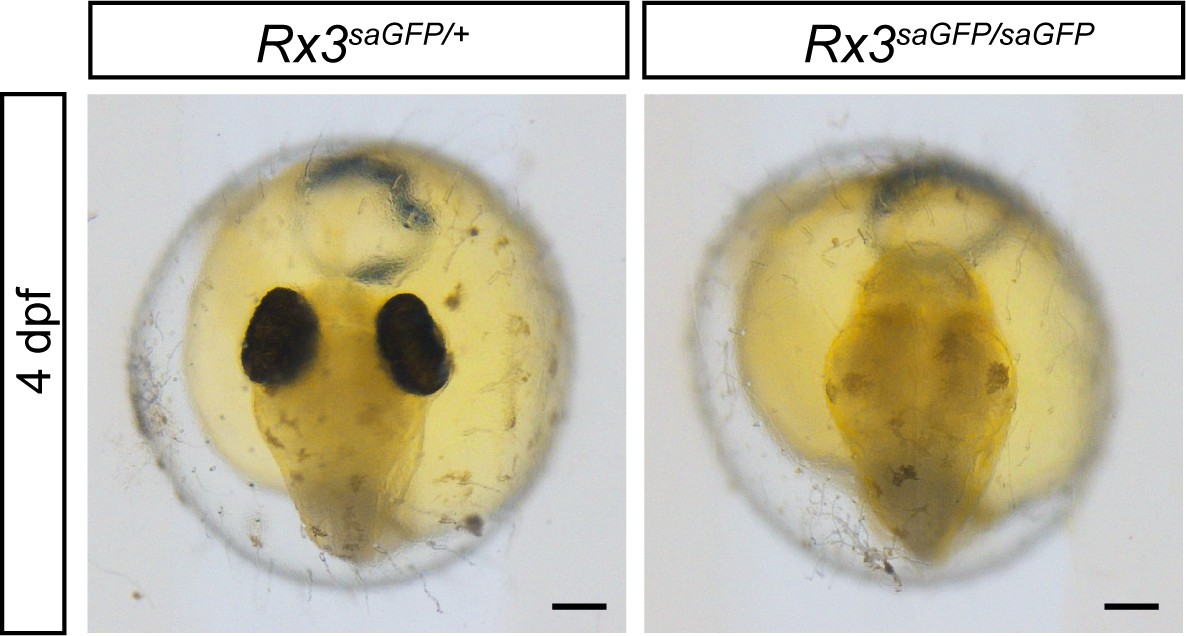
Characterization of Rx3saGFP line.
Bright-field images of fish embryos 4 dpf showing the phenotypical consequence of cassette integration in the Rx3 locus. dpf, days post-fertilization. Scale bar: 100 μm.
Figure 3
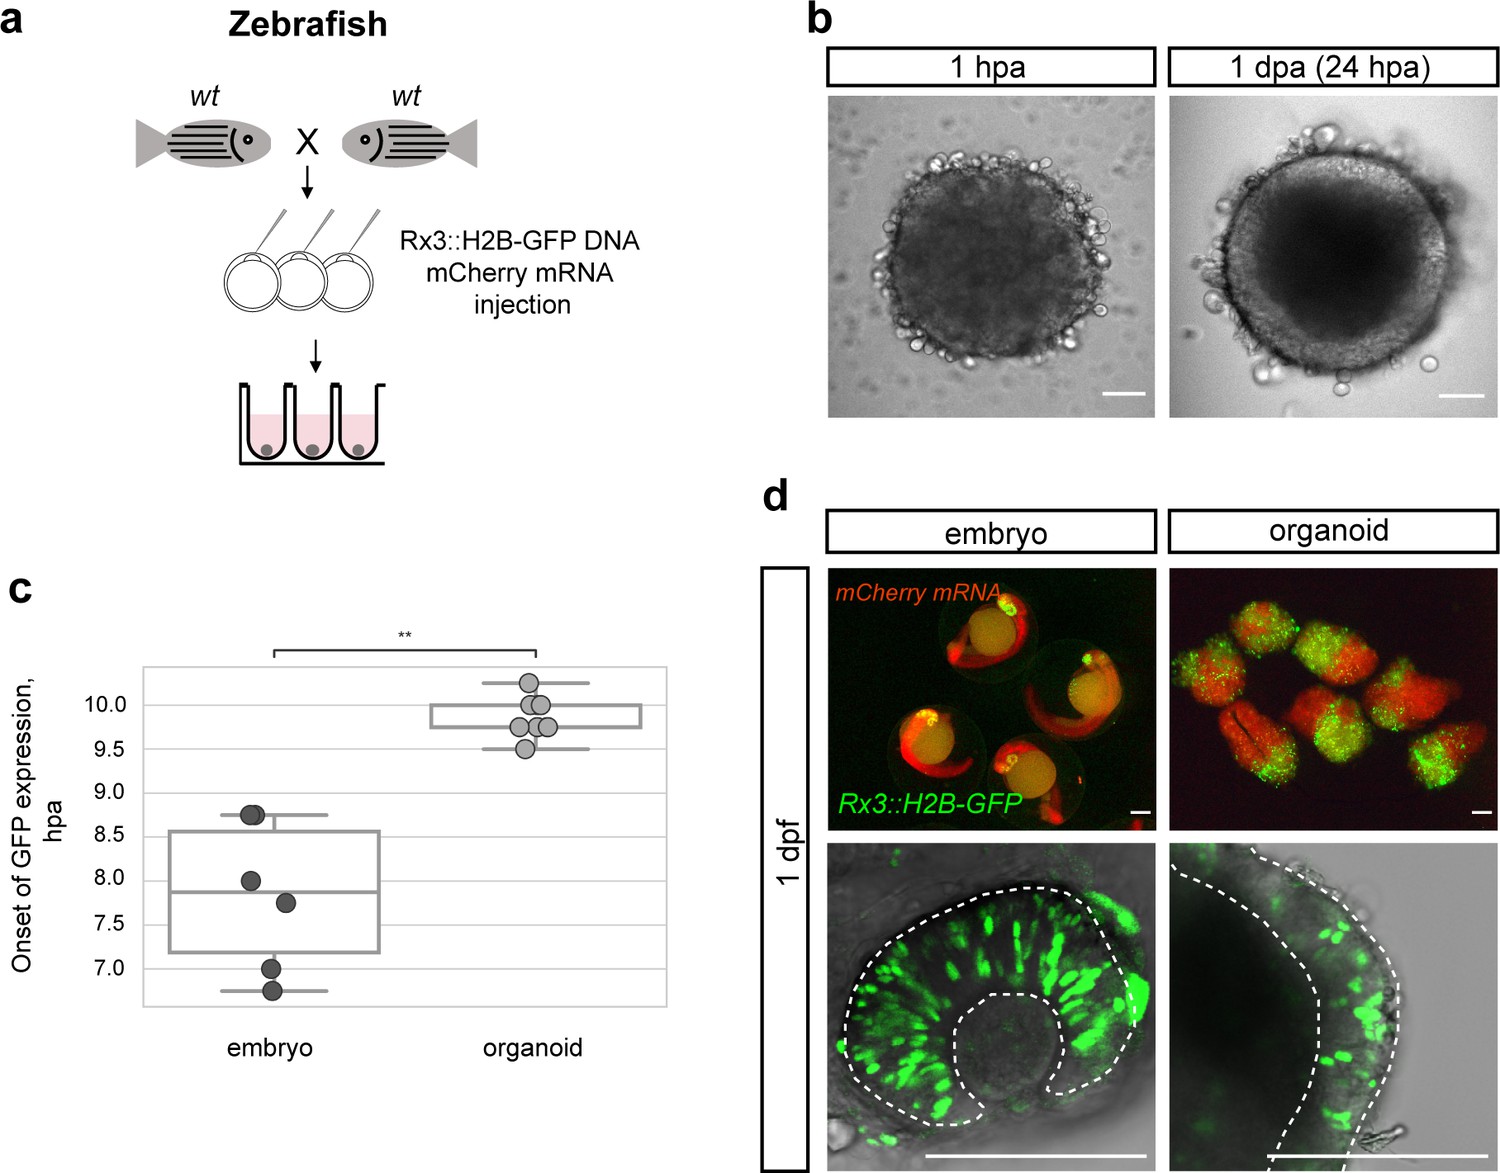
Zebrafish blastula-derived primary embryonic pluripotent cells forming retinal organoids.
(a) Scheme of aggregate generation from Rx3::H2B-GFP DNA-injected blastulae. (b) Bright-field images of zebrafish-derived aggregates at 1 hpa and 1 dpa. (c) Analysis of the onset of GFP expression in Rx3::H2B-GFP-derived zebrafish embryos (n = 6) and organoids (n = 15). **p<0.01. (d) Fluorescent images of mCherry and GFP expression domains in Rx3::H2B-GFP-injected embryos at 1 dpf and corresponding aggregates at day 1. Dashed lines indicate the embryonic retina and organoid retinal neuroepithelium, respectively. wt, wild type; dpf, days post-fertilization; dpa, days post-aggregation; hpa, hours post-aggregation. Scale bar: 100 μm.
Figure 4 with 2 supplements

Medaka primary embryonic pluripotent cells form optic vesicle-like structures.
(a) Fluorescence and bright-field images of day 2 organoids produced by aggregation of >1000 cells and <1000 cells stained with anti-Rx2 antibody. (b) Analysis of the area of Rx2 (wild-type organoids stained with anti-Rx2 antibody) and Rx3 (Rx3::H2B-GFP-derived organoids stained with anti-GFP antibody) expression area (% of total organoid area) in day 2 organoids. ****p<0.0001. (c) Number of organoids forming (1–4) individual retinal regions produced by aggregation of >1000 (n = 26 for Rx2, n = 9 for Rx3) and <1000 (n = 57 for Rx2, n = 66 for Rx3) cells from nine independent experiments. (d) Size, measured as largest circumference, of the optic vesicle of 1 dpf embryos and optic vesicle-like structures formed by day 2 organoids (n = 16 embryos, n = 56 aggregates from six independent experiments). ns, non-significant. (e) Bright-field and fluorescent images of day 2 Rx3::H2B-GFP organoids stained with anti-GFP antibody. Optical sections of an organoid (day 2) (n = 9/10) and an embryo (1 dpf) stained with anti-Rx2 and anti-Otx2 antibodies. (f) Maximal projection of day 2 organoids and 1 dpf embryo generated from Rx3::H2B-GFP transgenic or wild-type blastulae and stained with neural tissue-specific anti-Sox2 (n = 12/12) and anti-Otx2 (n = 10/10) antibodies, co-stained with anti-Rx2 and DAPI nuclear stain. hpa, hours post-aggregation; dpf, days post-fertilization. Scale bars: 100 μm.
Figure 4—figure supplement 1
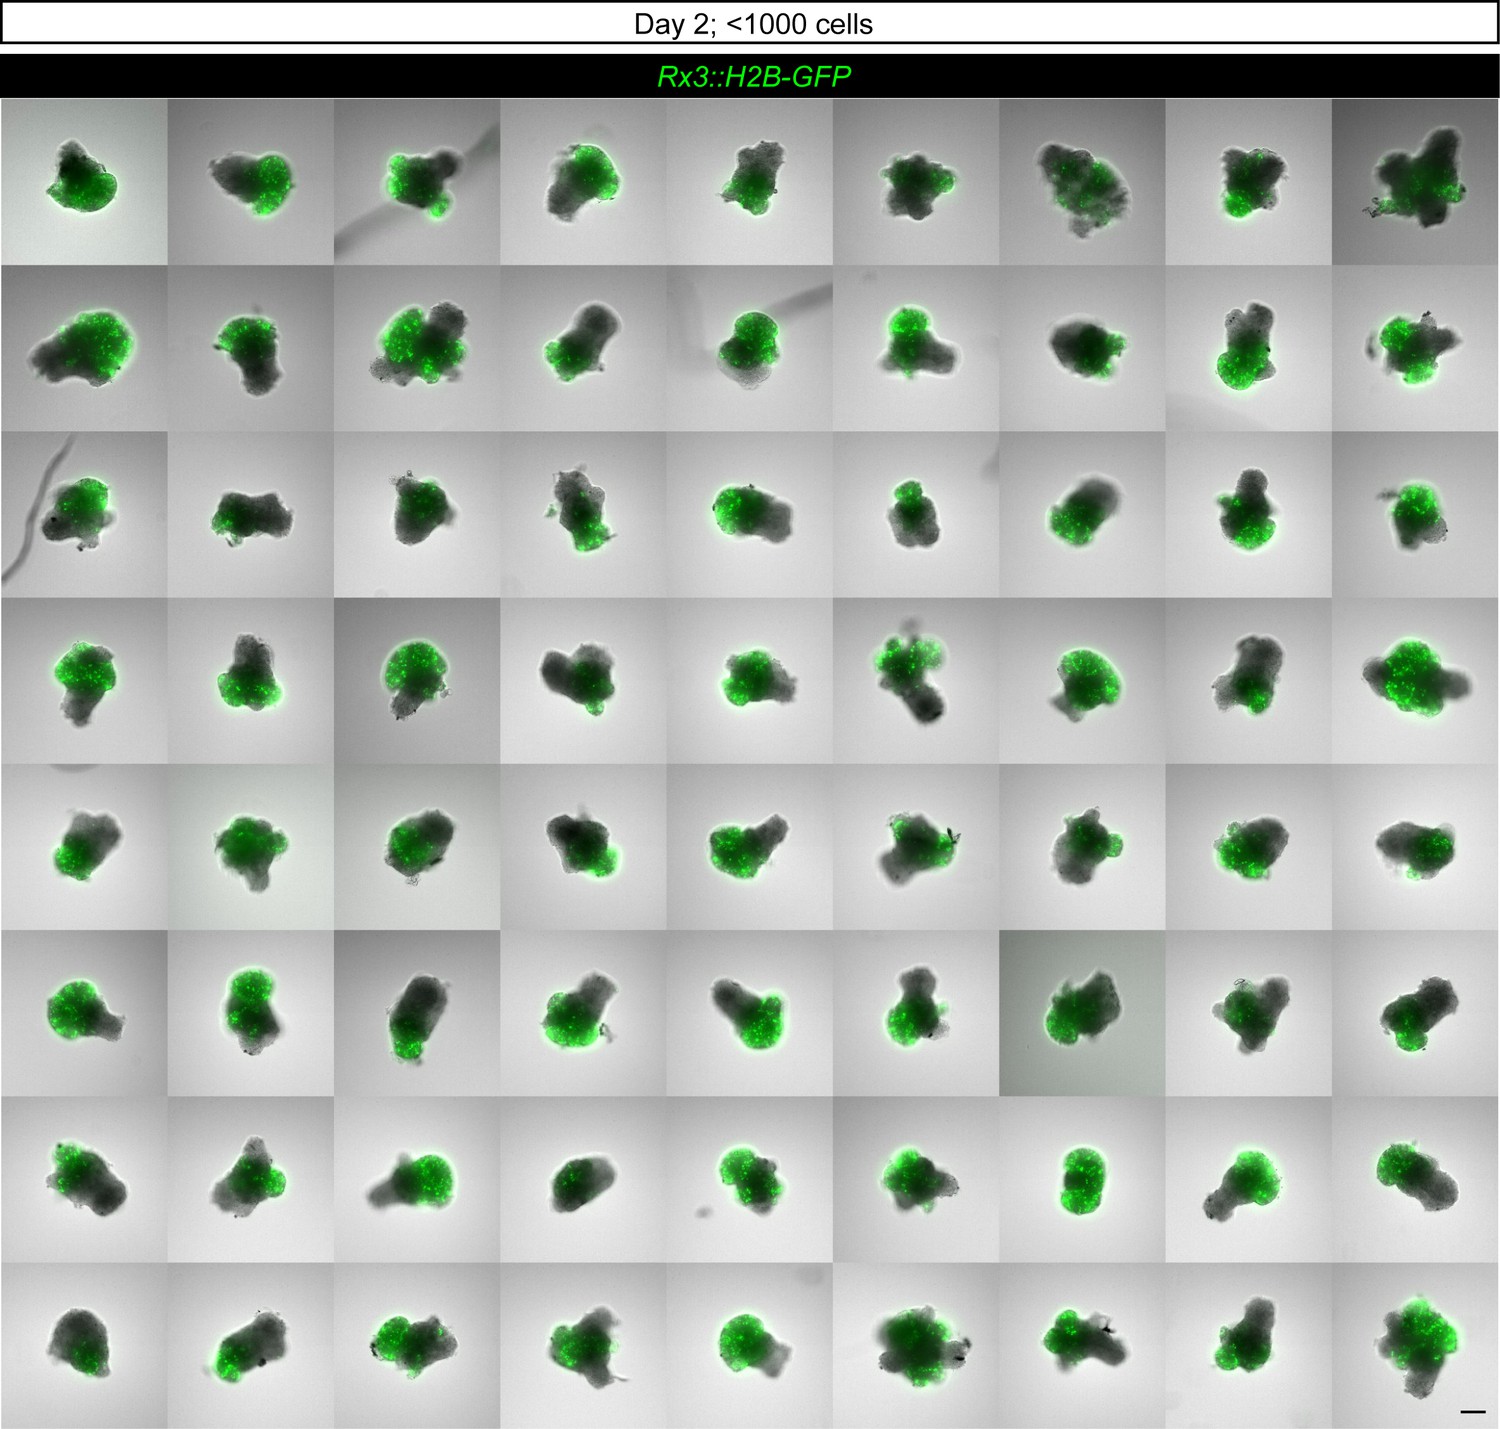
Overview of complexity and variability of organoid morphology generated within one experiment.
Overlay of fluorescence and bright-field images of retinal organoids on day 2 generated from the Rx3::H2B-GFP reporter line formed by aggregation of <1000 primary embryonic pluripotent cells stained with anti-GFP antibody. Scale bar: 100 μm.
Figure 4—figure supplement 2
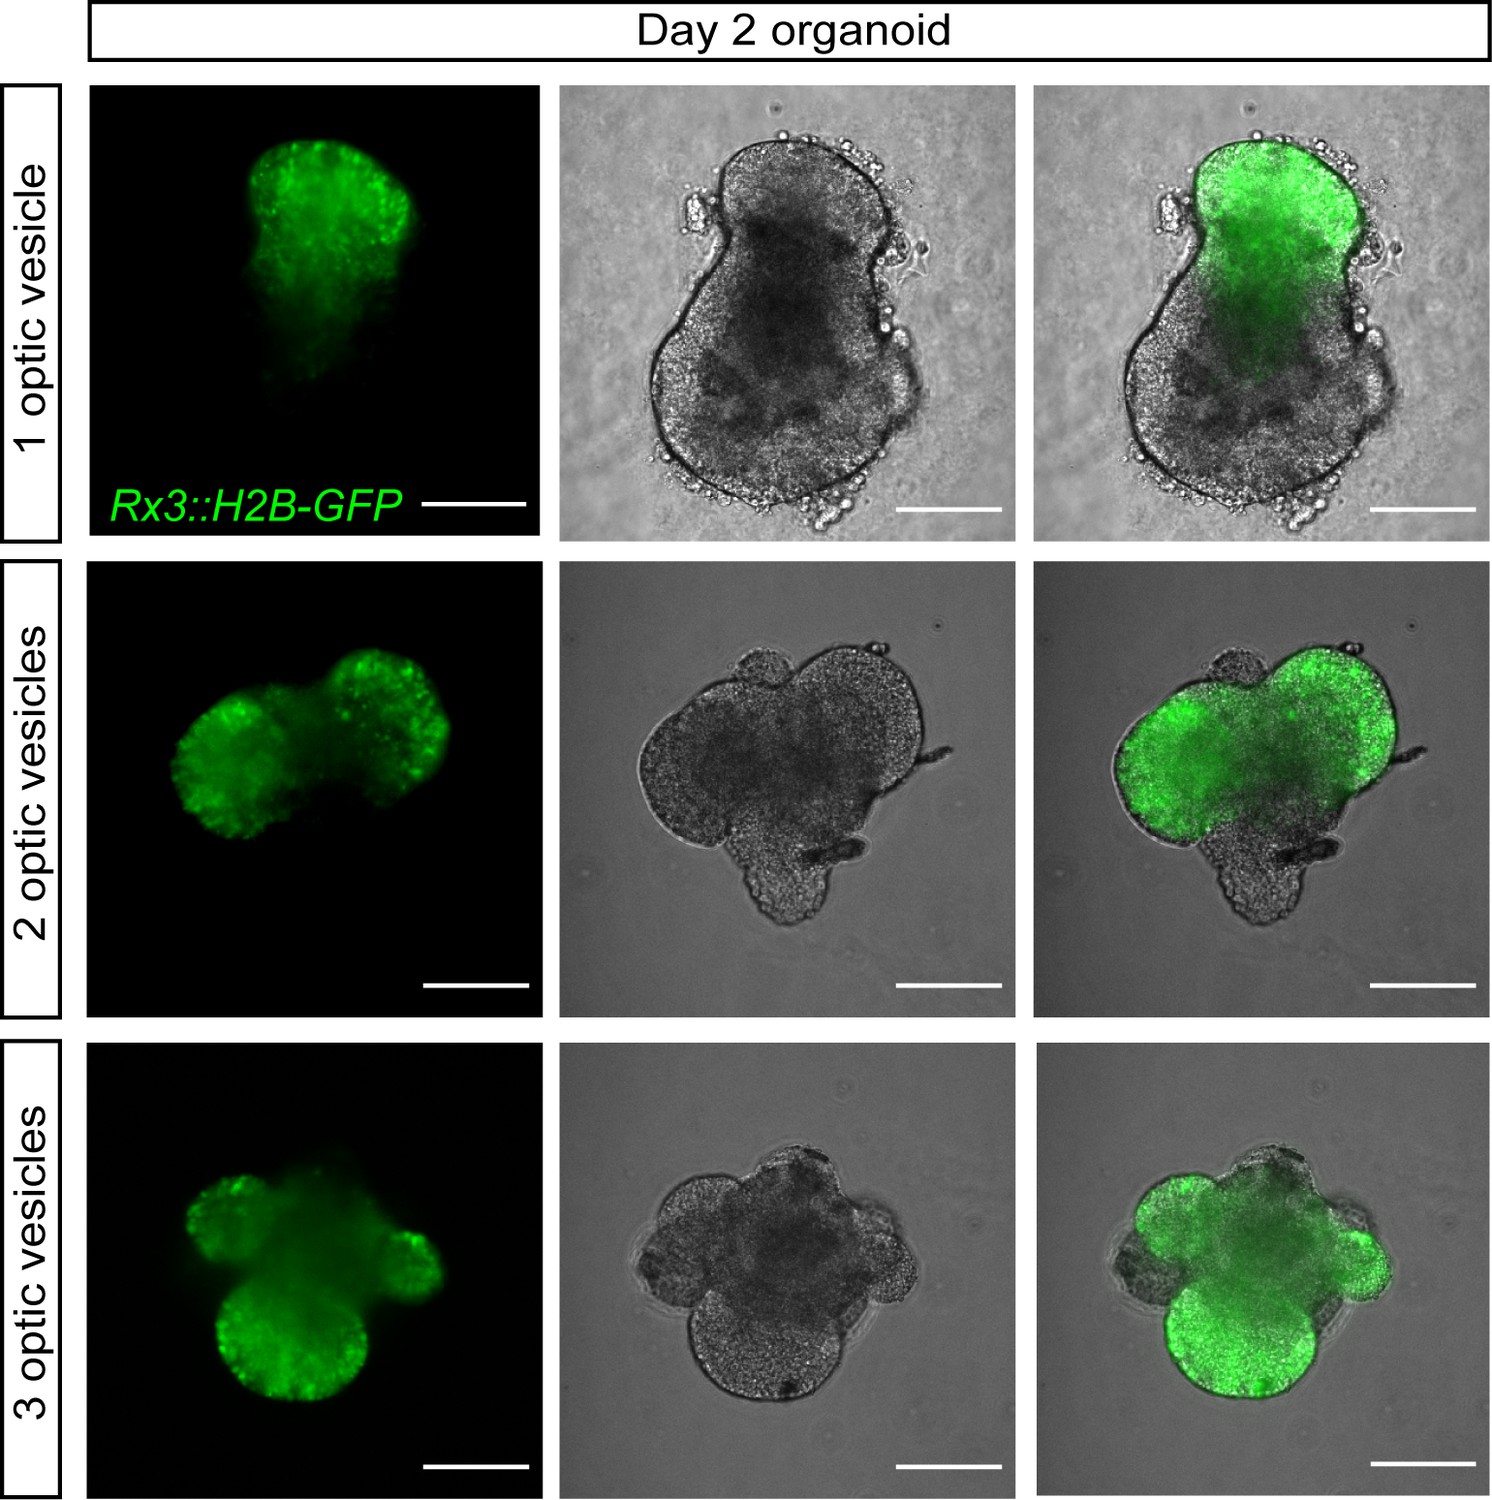
Examples of organoids generated by aggregation of <1000 cells forming one, two, and three optic vesicle-like structures.
Fluorescence images, bright-field images, and their overlay of retinal organoids on day 2 generated from the Rx3::H2B-GFP reporter line formed by aggregation of <1000 primary embryonic pluripotent cells stained with anti-GFP antibody. Scale bar: 100 μm.
Figure 5
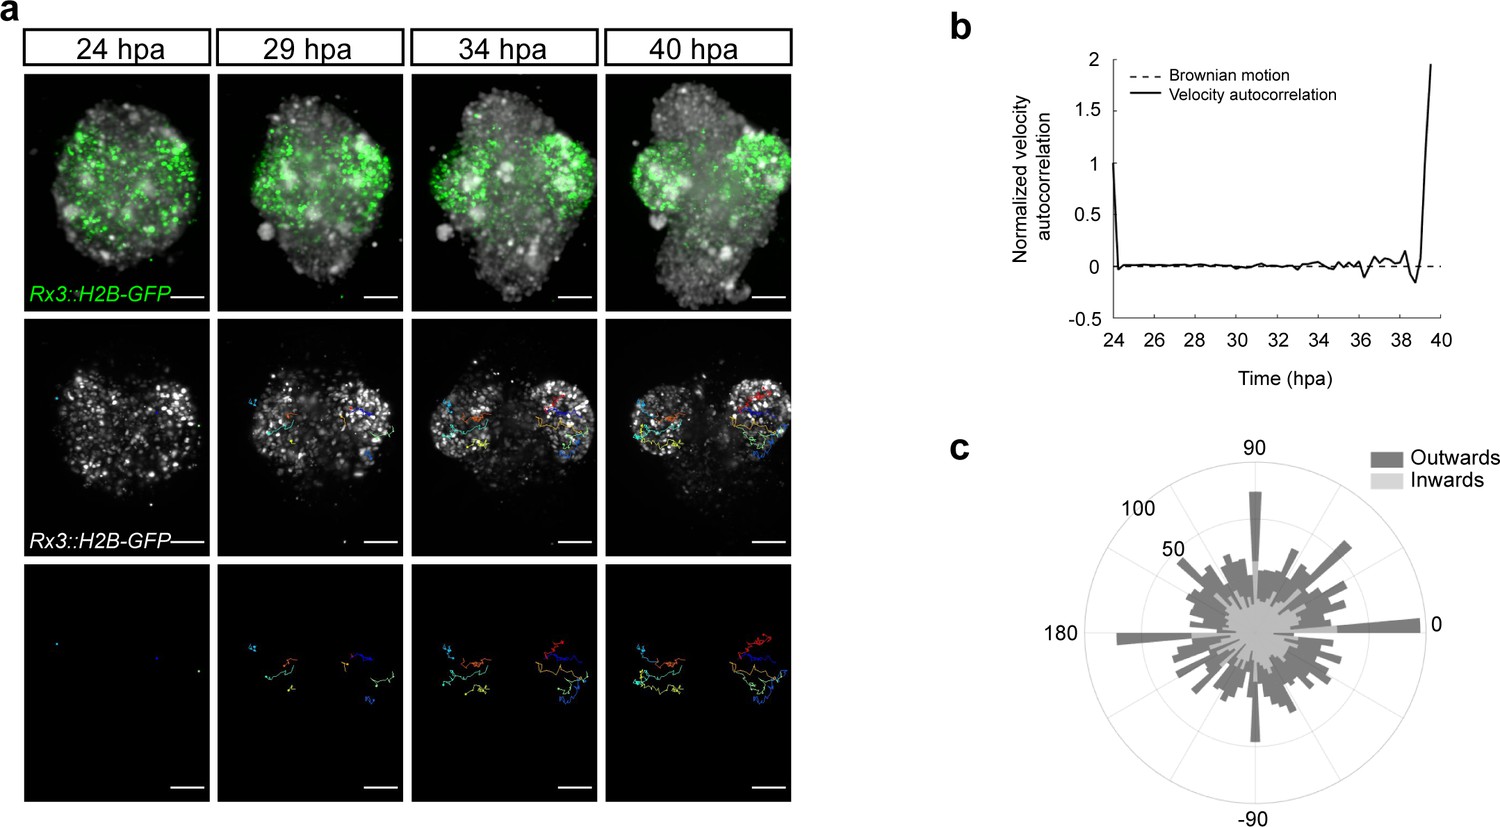
Dynamics of the optic vesicle formation in medaka organoids.
(a) In vivo time-lapse images acquired with MuVi SPIM of optic vesicle-like structure evagination in Rx3::H2B-GFP retinal organoids. From top to bottom: maximal projection of quasi bright field, GFP, and tracks of exemplary cells. (b) Normalized velocity autocorrelation for all tracks (n = 4600; from two optic vesicles of one organoid). (c) Directional histogram of tracks (n = 4600; from two optic vesicles of one organoid) separated for inward and outward movements. hpa, hours post-aggregation; dpf, days post-fertilization. Scale bar: 100 μm.
Figure 6 with 2 supplements

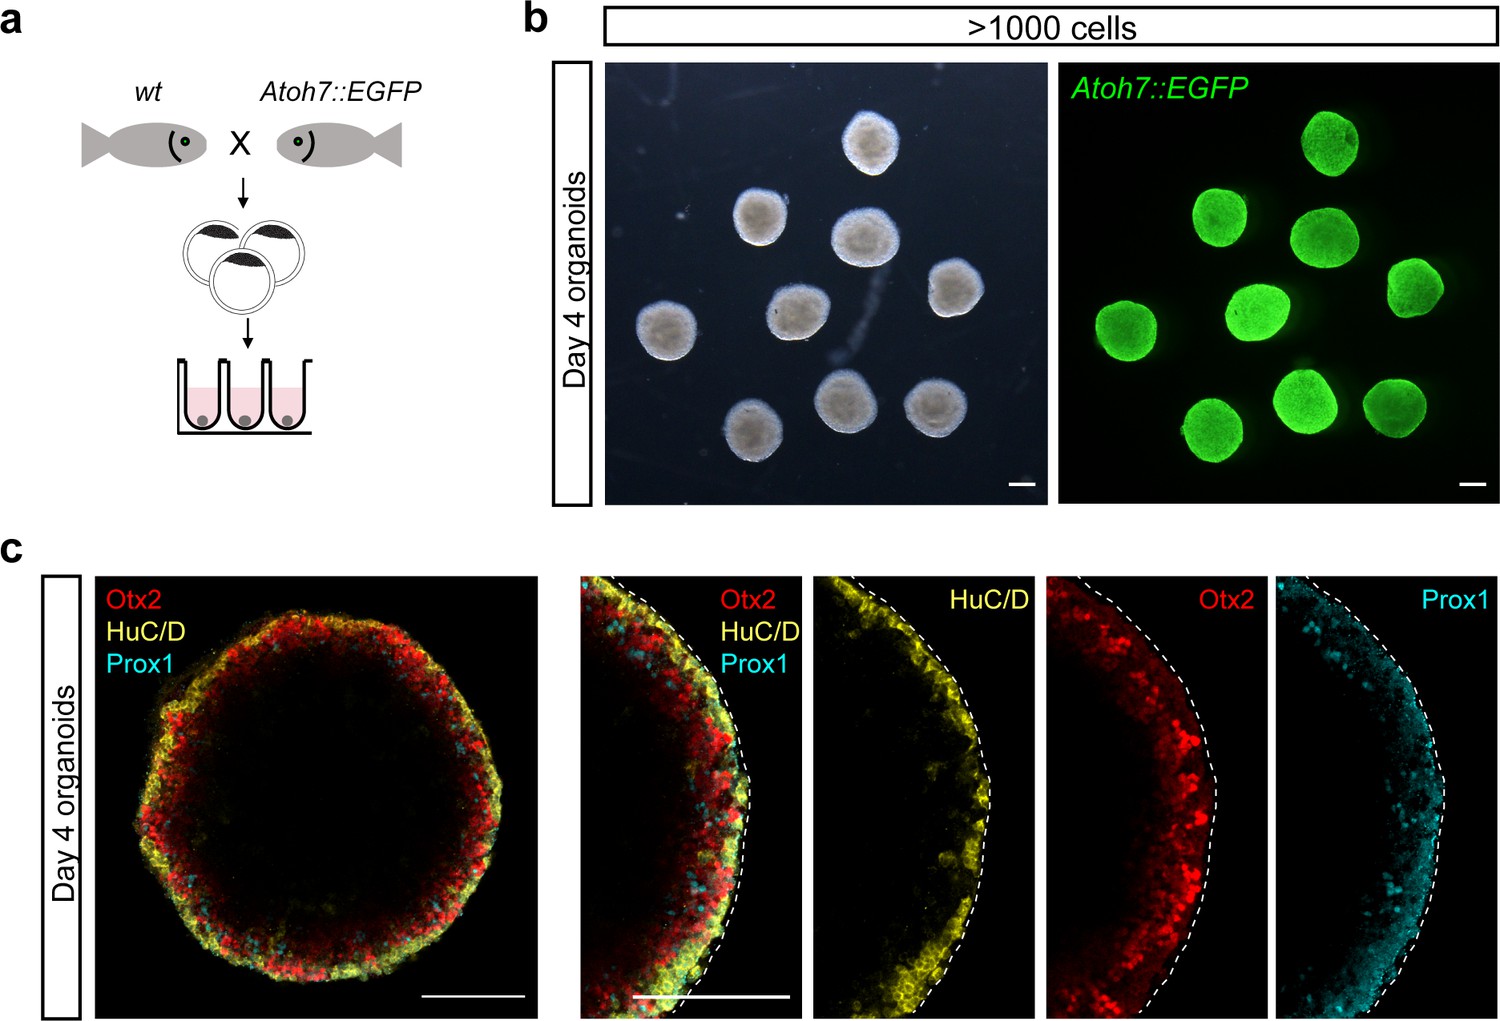
Medaka-derived organoids show onset of retinal differentiation.
(a) Scheme of organoid generation from Atoh7::EGFP transgenic fish. (b) Fluorescent images of day 3 Atoh7::EGFP organoids (generated by aggregation of <1000 cells). (c) Optical sections and maximal projections showing EGFP expression in the eye of the developing embryo at 2 dpf and the retinal organoid at day 3 co-stained with antibody against HuC/D and DAPI. (d) Optical sections showing expression of HuC/D (amacrine and ganglion cells), Otx2 (bipolar and photoreceptor cells), and Prox1 (horizontal cells) in day 4 organoid. (e) Sketch of the arrangement of cellular layers in the organoid and the embryonic retina. dpf, days post-fertilization. Scale bar: 100 μm.
Figure 6—figure supplement 1
Neuroepithelium of the organoids generated by >1000 cells shows the onset on retinal differentiation.
(a) Scheme of organoid generation from Atoh7::EGFP transgenic fish. (b) Bright-field and fluorescent images of day 3 Atoh7::EGFP organoids. (c) Optical sections of day 4 Atoh7::EGFP organoids co-stained with antibodies against HuC/D (amacrine and ganglion cells), Otx2 (bipolar and photoreceptor cells), and Prox1 (horizontal cells). Dashed lines indicate the retinal domain. Scale bar: 100 μm.
Figure 6—figure supplement 2
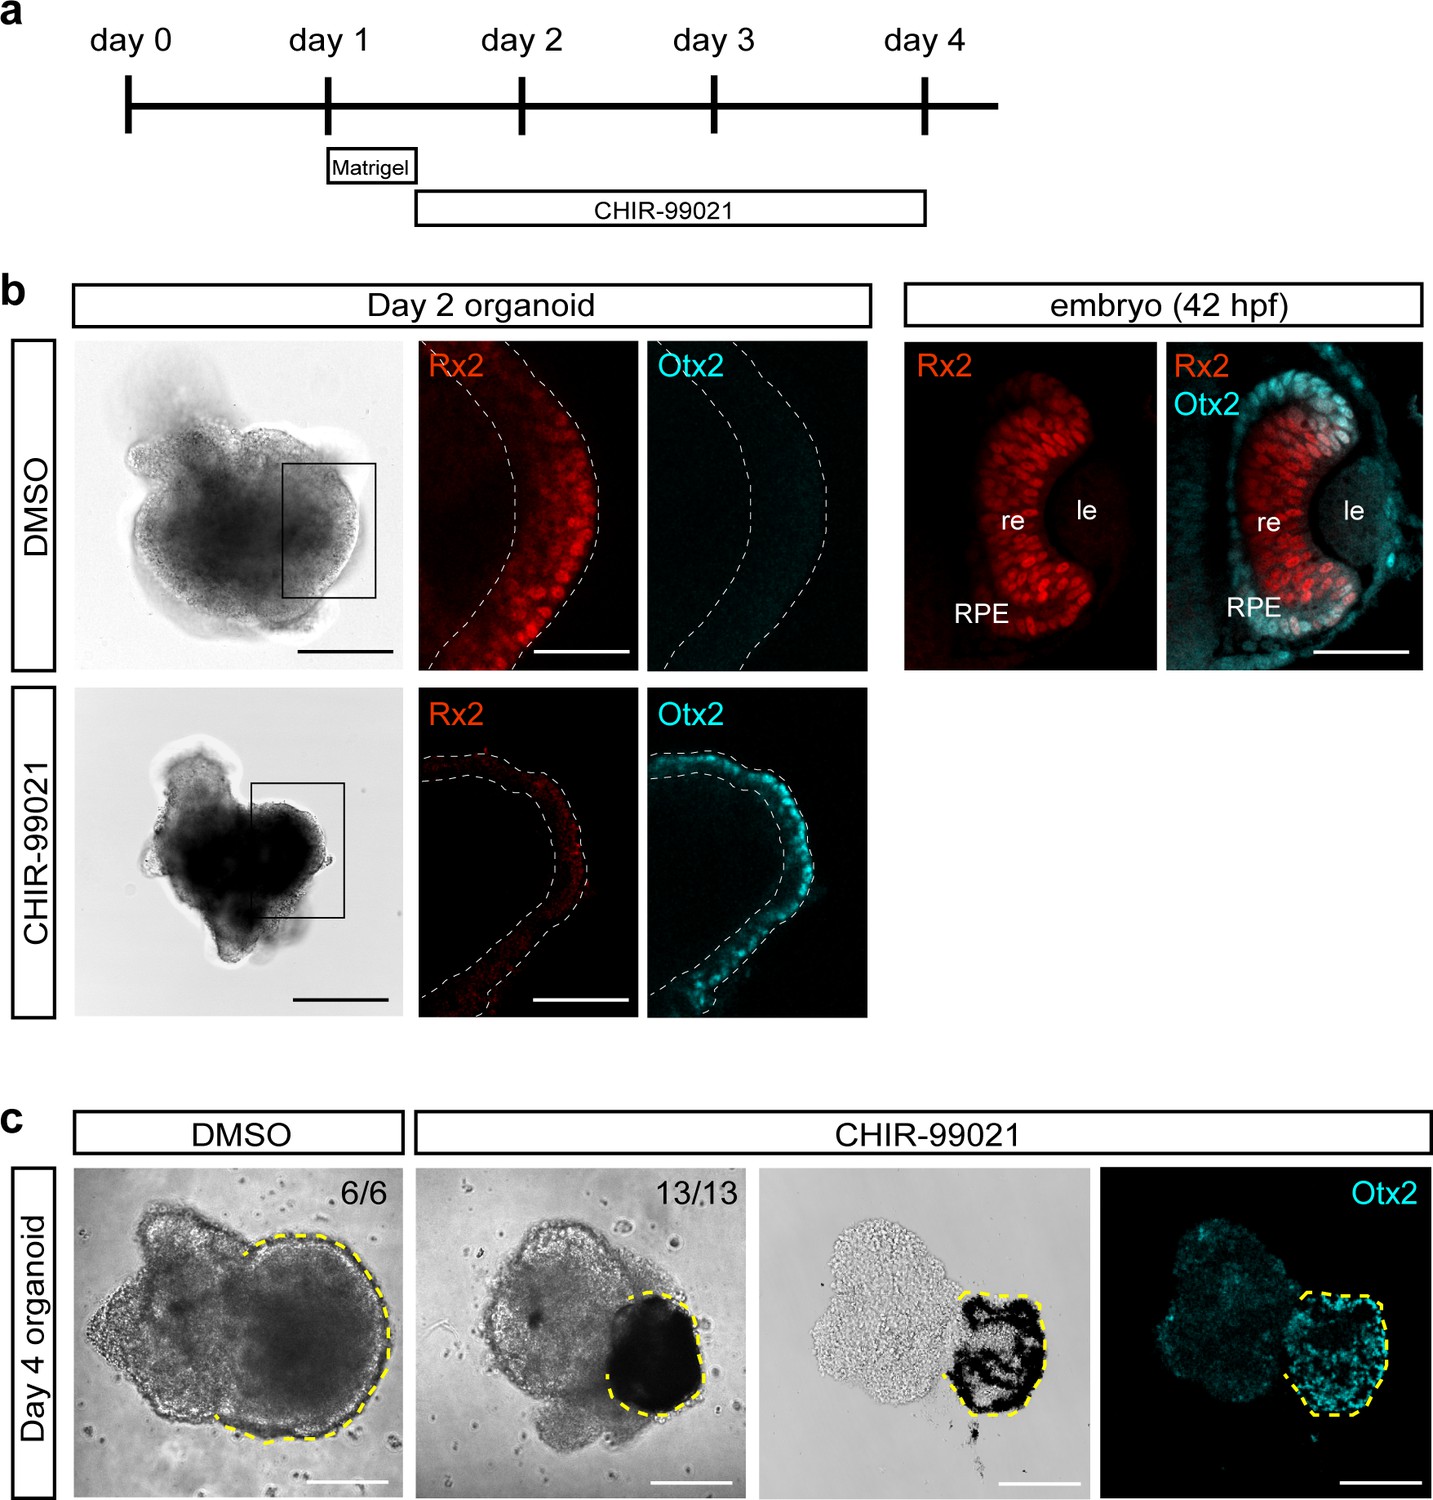
Treatment of medaka-derived organoids with the GSK3β inhibitor CHIR-99021 promote RPE differentiation.
(a) Schematic representation of CHIR-99021 treatment. Day 1 aggregates were washed and incubated with Matrigel for 6 hr. Organoids were washed and incubated in media containing 5 μM CHIR-99021 or DMSO. (b) DMSO- and CHIR-99021-treated day 2 organoids and medaka embryonic eye (42 hr post-fertilization [hpf]) showing expression of retina- and RPE-specific transcription factors Rx2 and Otx2, respectively. (c) DMSO- (n = 6/6) and CHIR-99021-treated (n = 13/13) day 4 organoids, including section through CHIR-99021-treated organoid stained with anti-Otx2 antibody. Dashed lines indicate retinal or RPE domains. re, retina; le, lens; RPE, retinal pigmented epithelium. Scale bars: 100 μm, 50 μm in enlargements in b and in fish embryonic retina in b.
Videos
Video 1
Aggregation and compaction of blastula-derived cells.
Time-lapse imaging of medaka-derived blastula cells going through the process of aggregation and compaction. Imaging was performed with 30 min intervals on all aggregates (n = 30) in the batch. Scale bar: 100 μm.
Video 2
Acquisition of retinal fate within medaka blastula-derived aggregates.
Time-lapse imaging of Rx3::H2B-GFP medaka-derived blastula cells going through the process of aggregation, compaction, and acquisition of retinal fate (GFP expression). Imaging was performed with 30 min intervals on all aggregates (n = 54). Scale bar: 100 μm.
Video 3
Acquisition of retinal fate within individual medaka – derived primary embryonic pluripotent cells.
Time-lapse imaging of medaka-derived blastula cells derived from Rx3::H2B-GFP transgenic fish. Imaging was performed with 30 min intervals. Scale bar: 100 μm.
Video 4
Acquisition of retinal fate within zebrafish blastula-derived aggregates.
Time-lapse imaging of Rx3::H2B-GFP zebrafish-derived blastula cells going through the process of aggregation, compaction, and acquisition of retinal fate (GFP expression). Imaging was performed with 30 min intervals. Scale bar: 100 μm.
Video 5
Optic vesicle formation within blastula-derived retinal organoid.
Time-lapse imaging of optic vesicle-like structure evagination in the medaka Rx3::H2B-GFP retinal organoid. Maximal projection of quasi bright field, GFP, and tracks of exemplary cells. Imaging was performed with 15 min intervals. Scale bar: 100 μm.
Video 6
Example of organoids forming single and multiple optic vesicle-like structures.
Time-lapse imaging of optic vesicle-like structure evagination in medaka Rx3::H2B-GFP retinal organoids. Maximal projection of GFP and tracks of exemplary cells. Imaging was performed with 15 min intervals. Scale bar: 100 μm.
Video 7
Extracellular matrix controls formation of optic vesicle neuroepithelium.
Time-lapse imaging of optic vesicle-like structure evagination in medaka Rx3::H2B-GFP retinal organoids in presence or absence of Matrigel (extracellular matrix component) shown as maximal projection of GFP and bright field. Imaging was performed with 30 min intervals. Scale bar: 100 μm.
Video 8
Organoids show complex morphology with the onset of retinal differentiation.
3D rendering of medaka Atoh7::EGFP day 3 organoid stained with anti-GFP (green), anti-β-catenin (cyan), and anti HuC/D (magenta) antibodies.
Tables
Key resources table
| Reagent type (species) or resource | Designation | Source or reference | Identifiers | Additional information |
|---|---|---|---|---|
| Gene (Oryzia latipes) | rx3 | Ensembl | ENSORLG00000027320 | – |
| Strain, strain background (Oryzia latipes) | Cab | Loosli et al., 2000 | – | – |
| Strain, strain background (Danio rerio) | AB | ZIRC | ZFIN: ZBD-GENO-960809–7 | – |
| Genetic reagent (Oryzia latipes) | Atoh7::EGFP | Del Bene et al., 2007 | – | – |
| Genetic reagent (Oryzia latipes) | Rx3::H2B-GFP | Rembold et al., 2006 | – | – |
| Genetic reagent (Oryzia latipes) | Rx3saGFP | This study | – | Insertion of splice acceptor followed by GFP (saGFP) andocean pout polyA terminator (OPT) in the first intron of Rx3 gene |
| Antibody | Anti-Otx2 (polyclonal goat IgG) | R&D Systems | Cat#:AF1979 RRID:AB_2157172 | IHC (1:200) |
| Antibody | Anti-Rx2 (polyclonal rabbit IgG) | In-house; Reinhardt et al., 2015 | – | IHC (1:200) |
| Antibody | Anti-Lhx2 (polyclonal rabbit IgG) | GeneTex | Cat#:GTX129241 RRID:AB_2783558 | IHC (1:500) |
| Antibody | Anti-β-catenin (polyclonal rabbit IgG) | Abcam | Cat#:Ab6302 RRID:AB_305407 | IHC (1:500) |
| Antibody | Anti-acetylated tubulin (monoclonal mouse IgG2b) | Merck | Cat#:T7451 RRID:AB_609894 | IHC (1:200) |
| Antibody | Anti-Sox2 (polyclonal rabbit IgG) | GeneTex | Cat#:GTX124477 RRID:AB_11178063 | IHC (1:200) |
| Antibody | Anti-GFP (polyclonal chicken IgY) | Thermo Fisher Scientific | Cat#:A10262 RRID:AB_2534023 | IHC (1:500) |
| Antibody | Anti-N-cadherin (monoclonal rabbit IgG) | Abcam | Cat#:ab76011 RRID:AB_1310479 | IHC (1:200) |
| Antibody | Anti-Prox1 (polyclonal rabbit IgG) | Merck | Cat#:AB5475 RRID:AB_177485 | IHC (1:500) |
| Antibody | Anti-HuC/HuD (monoclonal mouse IgG2b) | Thermo Fisher Scientific | Cat#:A21271 RRID:AB_221448 | IHC (1:200) |
| Recombinant DNA reagent | pGBT-RP2 (plasmid) | Clark et al., 2011 | – | Ocean pout polyA terminator (OPT) sequence-carrying plasmid |
| Recombinant DNA reagent | pGGEV_5_linker (plasmid) | Addgene | RRID:Addgene_49285 | – |
| Recombinant DNA reagent | pGGDestSC-ATG (plasmid) | Addgene | RRID:Addgene_49322 | – |
| Recombinant DNA reagent | pGGEV_4_linker (plasmid) | Addgene | RRID:Addgene_49284 | – |
| Recombinant DNA reagent | pGGEV_7’_linker (plasmid) | Addgene | RRID:Addgene_49293 | – |
| Recombinant DNA reagent | Rx3::H2B-GFP (plasmid) | Rembold et al., 2006 | – | – |
| Recombinant DNA reagent | pGGD(saGFP-OPT-MCS+2) (plasmid) | This study | – | Splice acceptor and GFP (saGFP); ocean pout polyA terminator (OPT) sequence-carrying plasmid |
| Sequence-based reagent | Rx3_F | This study | PCR primer | TCCTTTTTAGACAAATGTGGCTCC |
| Sequence-based reagent | GFP_R | This study | PCR primer | GCTCGACCAGGATGGGCA |
| Sequence-based reagent | pDest_F | This study | PCR primer | ATTACCGCCTTTGAGTGAGC |
| Sequence-based reagent | Rx3_R | This study | PCR primer | GACAGGTATCCGGTAAGCGG |
| Sequence-based reagent | rx3_T1 | This study | sgRNA | AGCAGAGCGCGCAAAGAACC[AGG] |
| Sequence-based reagent | rx3_T2 | This study | sgRNA | AGCGCGCAAAGAACCAGGCA[GGG] |
| Peptide, recombinant protein | Q5 High-Fidelity DNA Polymerase | NEB | Cat#:M0491L | – |
| Peptide, recombinant protein | I-SceI meganuclease | NEB | Cat#:R0694L | – |
| Commercial assay or kit | InnuPREP DOUBLEpure Kit | AnalyticJena | Cat#:845-KS-5050250 | – |
| Chemical compound, drug | CHIR-99021 | Merck | Cat#:SML1046 | – |
| Software, algorithm | Geneious R8.1 | Biomatters | – | – |
| Software, algorithm | CCTop | Stemmer et al., 2015 | RRID:SCR_016890 | – |
| Software, algorithm | Fiji distribution of ImageJ | Schindelin et al., 2012 | RRID:SCR_002285 | – |
| Software, algorithm | Hyper stack generator (Fiji plugin) | 10.5281/zenodo.3368134 | – | Generate hyperstack for images acquired with the Acquifer machine |
| Software, algorithm | ElastixWrapper (Fiji plugin) | Tischer, 2019; Klein et al., 2010 | – | – |
| Software, algorithm | MATLAB | MathWorks | RRID:SCR_001622 | – |
| Software, algorithm | MSD analysis | Tinevez and Herbert, 2020 | – | MATLAB script for MSD analysis |
| Software, algorithm | Directionality analysis | This studyhttps://github.com/VeneraW/DirectionalityANalysisOrganoids (copy archived atswh:1:rev:31a89aead3e83ac774e13c0161e44deafce58f05; Zilova, 2021) | – | MATLAB script for organoid directionality analysis |
| Software, algorithm | TrackMate | Tinevez et al., 2017 | – | – |
| Software, algorithm | Statannot package, Jupyter notebook | https://github.com/webermarcolivier/statannot, Weber, 2020 | – | – |
| Other | Matrigel | Corning | Cat#:356238 | – |
| Other | DRAQ5 | Thermo Fisher Scientific | Cat#:65-0880-92 | 1:1000 |
| Other | CellMask | Thermo Fisher Scientific | Cat#:C10045 | 1:1000 |
| Other | Tissue Freezing Media | Leica | Cat#:14020108926 | – |
Additional files
Download links
A two-part list of links to download the article, or parts of the article, in various formats.
Downloads (link to download the article as PDF)
Open citations (links to open the citations from this article in various online reference manager services)
Cite this article (links to download the citations from this article in formats compatible with various reference manager tools)
Fish primary embryonic pluripotent cells assemble into retinal tissue mirroring in vivo early eye development
eLife 10:e66998.
https://doi.org/10.7554/eLife.66998


