Mechanism for differential recruitment of orbitostriatal transmission during actions and outcomes following chronic alcohol exposure
- Department of Psychology, University of California San Diego, United States
- The Neurosciences Graduate Program, University of California San Diego, United States
- Department of Neurosciences, University of California San Diego, United States
- Research Service, VA San Diego Healthcare System, United States
Figures
Figure 1 with 1 supplement
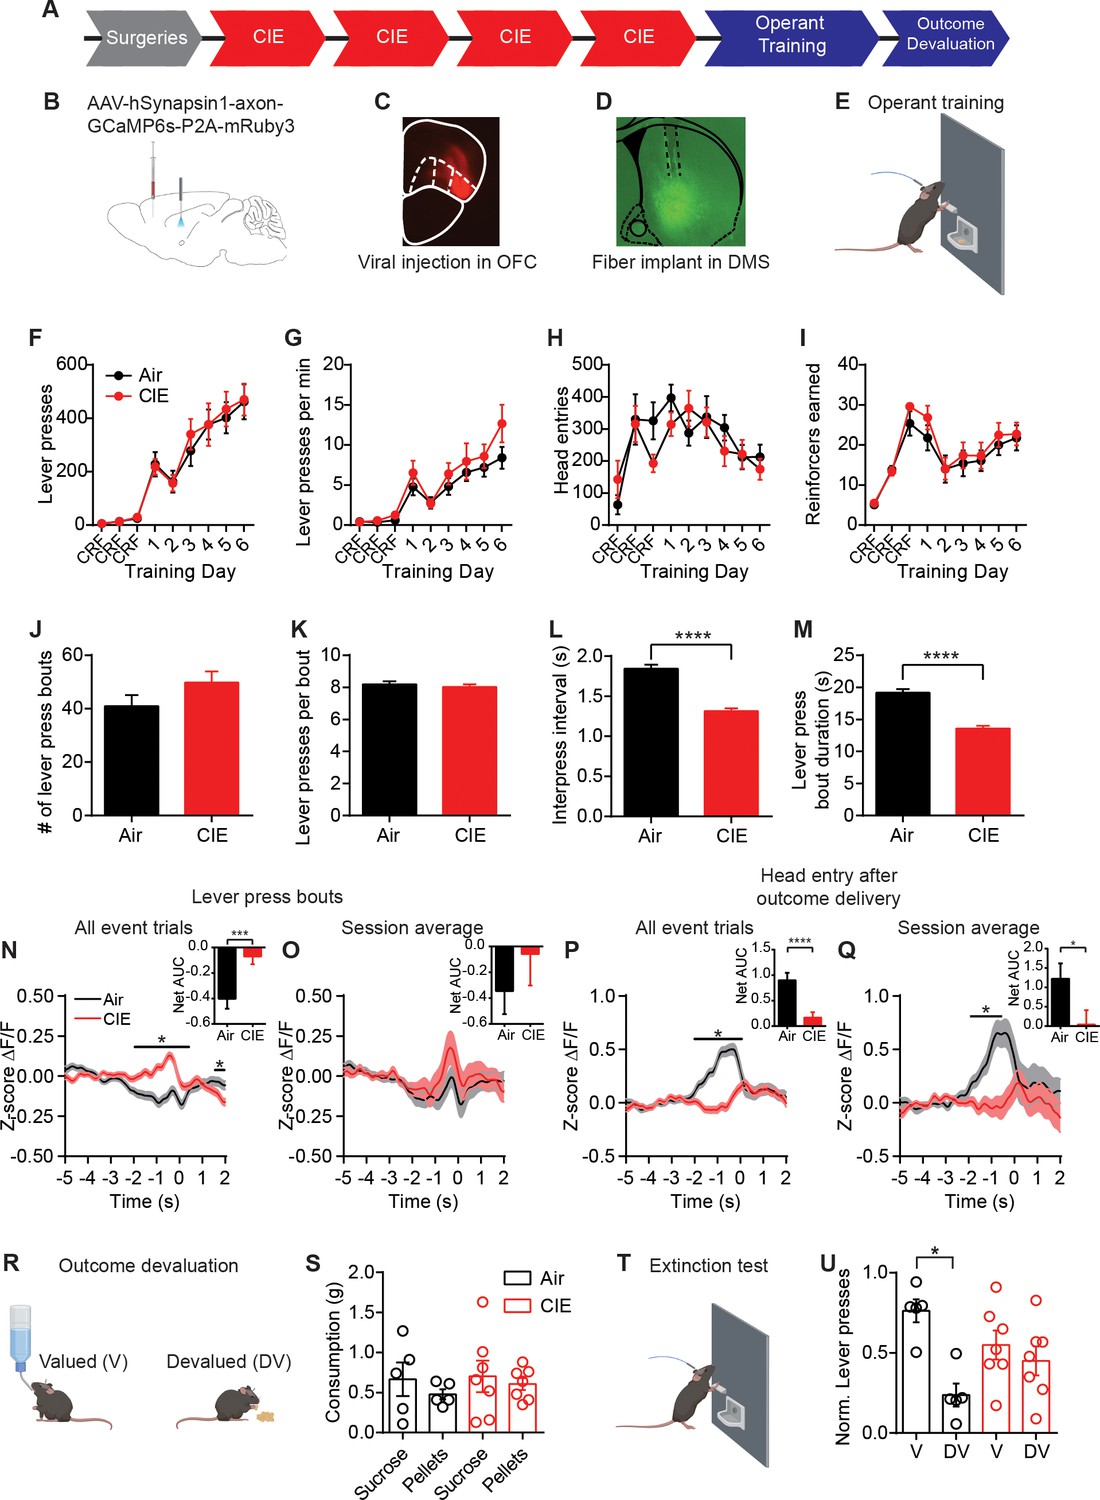
CIE-induced alterations in OFC terminal activity in the DS during instrumental responding.
(A) Experimental timeline that includes surgeries followed by four cycles of CIE exposure, operant training, and outcome devaluation. (B) Schematic of viral injections in the OFC and fiber implant in the DS. (C) Example viral expression in OFC. (D) Example OFC terminal expression and fiber placement in the DS. (E) Lever press training for a food pellet under random ratio schedule of reinforcement. (F) Lever presses, (G) response rate, (H) head entries, and (I) reinforcers earned during training in Air (n = 10 mice, three vapor cohorts) and CIE (n = 12 mice, three vapor cohorts) mice. (J) Average number of lever press bouts in Air and CIE mice. (K) Average number of lever presses per bout. (L) Average inter-press interval within lever press bouts. (M) Average bout duration. (N) Z-score of ΔF/F GCaMP6s traces recorded in OFC terminals during lever press bouts including all event trials and net area under the curve (AUC) of Z-score GCaMP6s signal during lever press bouts. (O) Z-score of ΔF/F GCaMP6s traces during lever press bouts including session averages and net area under the curve (AUC) of Z-score GCaMP6s signal during lever press bouts. (P) Z-score of ΔF/F GCaMP6s trace during the first head entry after outcome delivery including all event trials and net AUC of Z-score GCaMP6s signal during first head entry after outcome delivery. (Q) Z-score of ΔF/F GCaMP6s trace during the first head entry after outcome delivery including session averages and net AUC of Z-score GCaMP6s signal during first head entry after outcome delivery. (R) Schematic of outcome devaluation procedure. (S) Consumption of sucrose and pellets in Air (n = 5 mice) and CIE (n = 7 mice) mice during 1 hr free feed period. (T) Schematic of extinction test following free feed period. (U) Distribution of lever presses across valued (V) and devalued (DV) days. Data points and bar graphs represent mean ± SEM. Bonferroni-corrected post hoc test of repeated-measures ANOVA, two-sided FDR-corrected permutation test, or Kolmogorov–Smirnov test, *p≤0.05, ****p≤0.0001.
-
Figure 1—source data 1
CIE-induced alteractions in OFC terminal activity in the DS during instrumental responding source data.
- https://cdn.elifesciences.org/articles/67065/elife-67065-fig1-data1-v2.xlsx
Figure 1—figure supplement 1
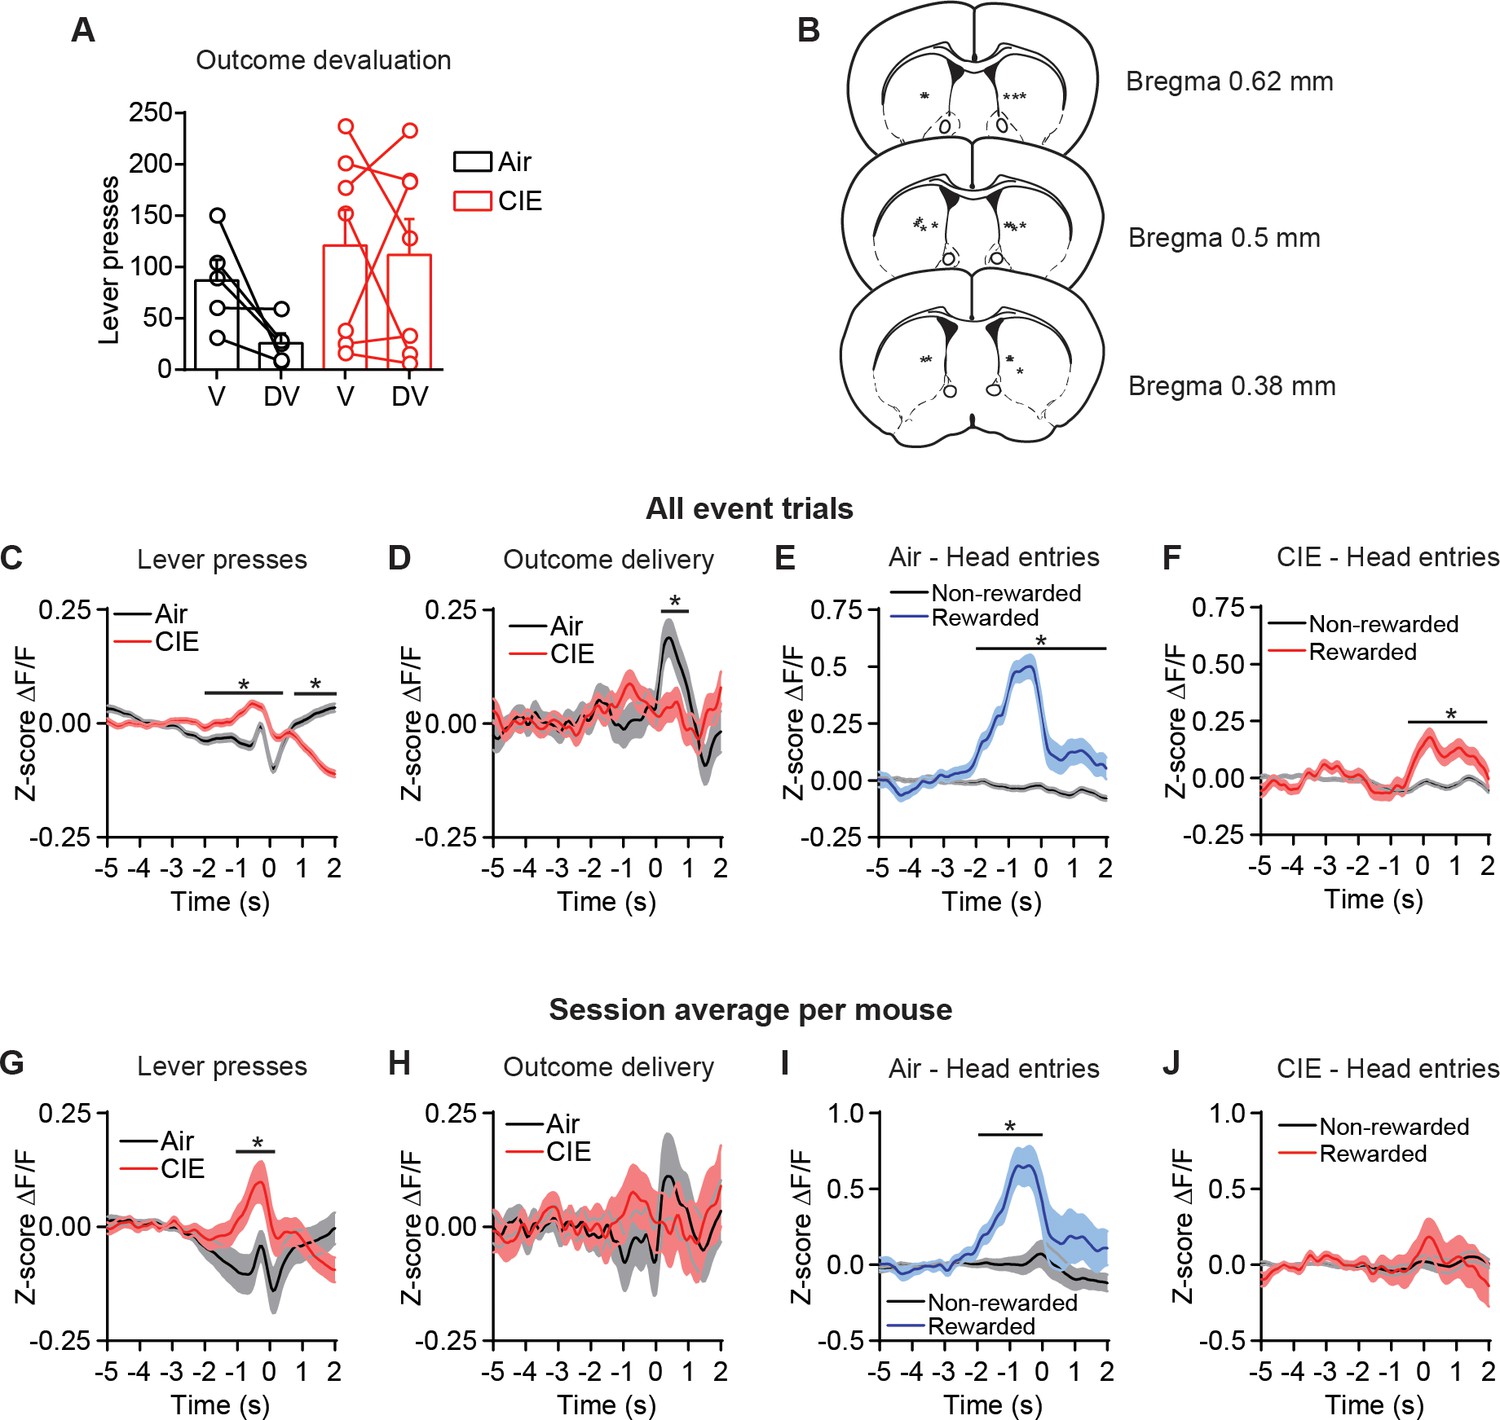
CIE-induced alterations in OFC terminal activity in the DS during instrumental responding, devaluation testing, and histological placements.
(A) Lever presses on valued (V) and devalued (DV) days (repeated-measures ANOVA: No interaction or main effect of Time or Treatment, Fs < 2.64). (B) Schematic representation of fiber placement in DS. (C) Z-score of ΔF/F GCaMP6s trace including all event trials during lever presses (two-sided FDR-corrected permutation test, Air: n = 12673; CIE: n = 14871), (D) outcome delivery (two-sided FDR-corrected permutation test, Air: n = 569; CIE: n = 705), and (E) rewarded and non-rewarded head entries in Air mice (two-sided FDR-corrected permutation test, Rewarded: n = 563; Non-rewarded: n = 8034), and (F) rewarded and non-rewarded head entries in CIE mice (two-sided FDR-corrected permutation test, Rewarded: n = 703; Non-rewarded: n = 8291). (G) Z-score of ΔF/F GCaMP6s trace including the session average for each mouse during lever presses (two-sided FDR-corrected permutation test, Air: n = 36; CIE: n = 34), (H) outcome delivery (two-sided permutation test, Air: n = 32; CIE: n = 36), (I) rewarded and non-rewarded head entries in Air mice (two-sided FDR-corrected permutation test, Rewarded: n = 34; Non-rewarded: n = 34), and (J) rewarded and non-rewarded head entries in CIE mice (two-sided FDR-corrected permutation test, Rewarded: n = 38; Non-rewarded: n = 29). Two-sided FDR-corrected permutation test, *p≤0.05.
-
Figure 1—figure supplement 1—source data 1
Figure 1—figure supplement 1 CIE-induced alterations in OFC terminal activity in the DS during instrumental responding, devaluation testing, and histological placements source data 1.
- https://cdn.elifesciences.org/articles/67065/elife-67065-fig1-figsupp1-data1-v2.xlsx
-
Figure 1—figure supplement 1—source data 2
Figure 1—figure supplement 1 CIE-induced alterations in OFC terminal activity in the DS during instrumental responding, devaluation testing, and histological placements source data 2.
- https://cdn.elifesciences.org/articles/67065/elife-67065-fig1-figsupp1-data2-v2.xlsx
Figure 2 with 1 supplement
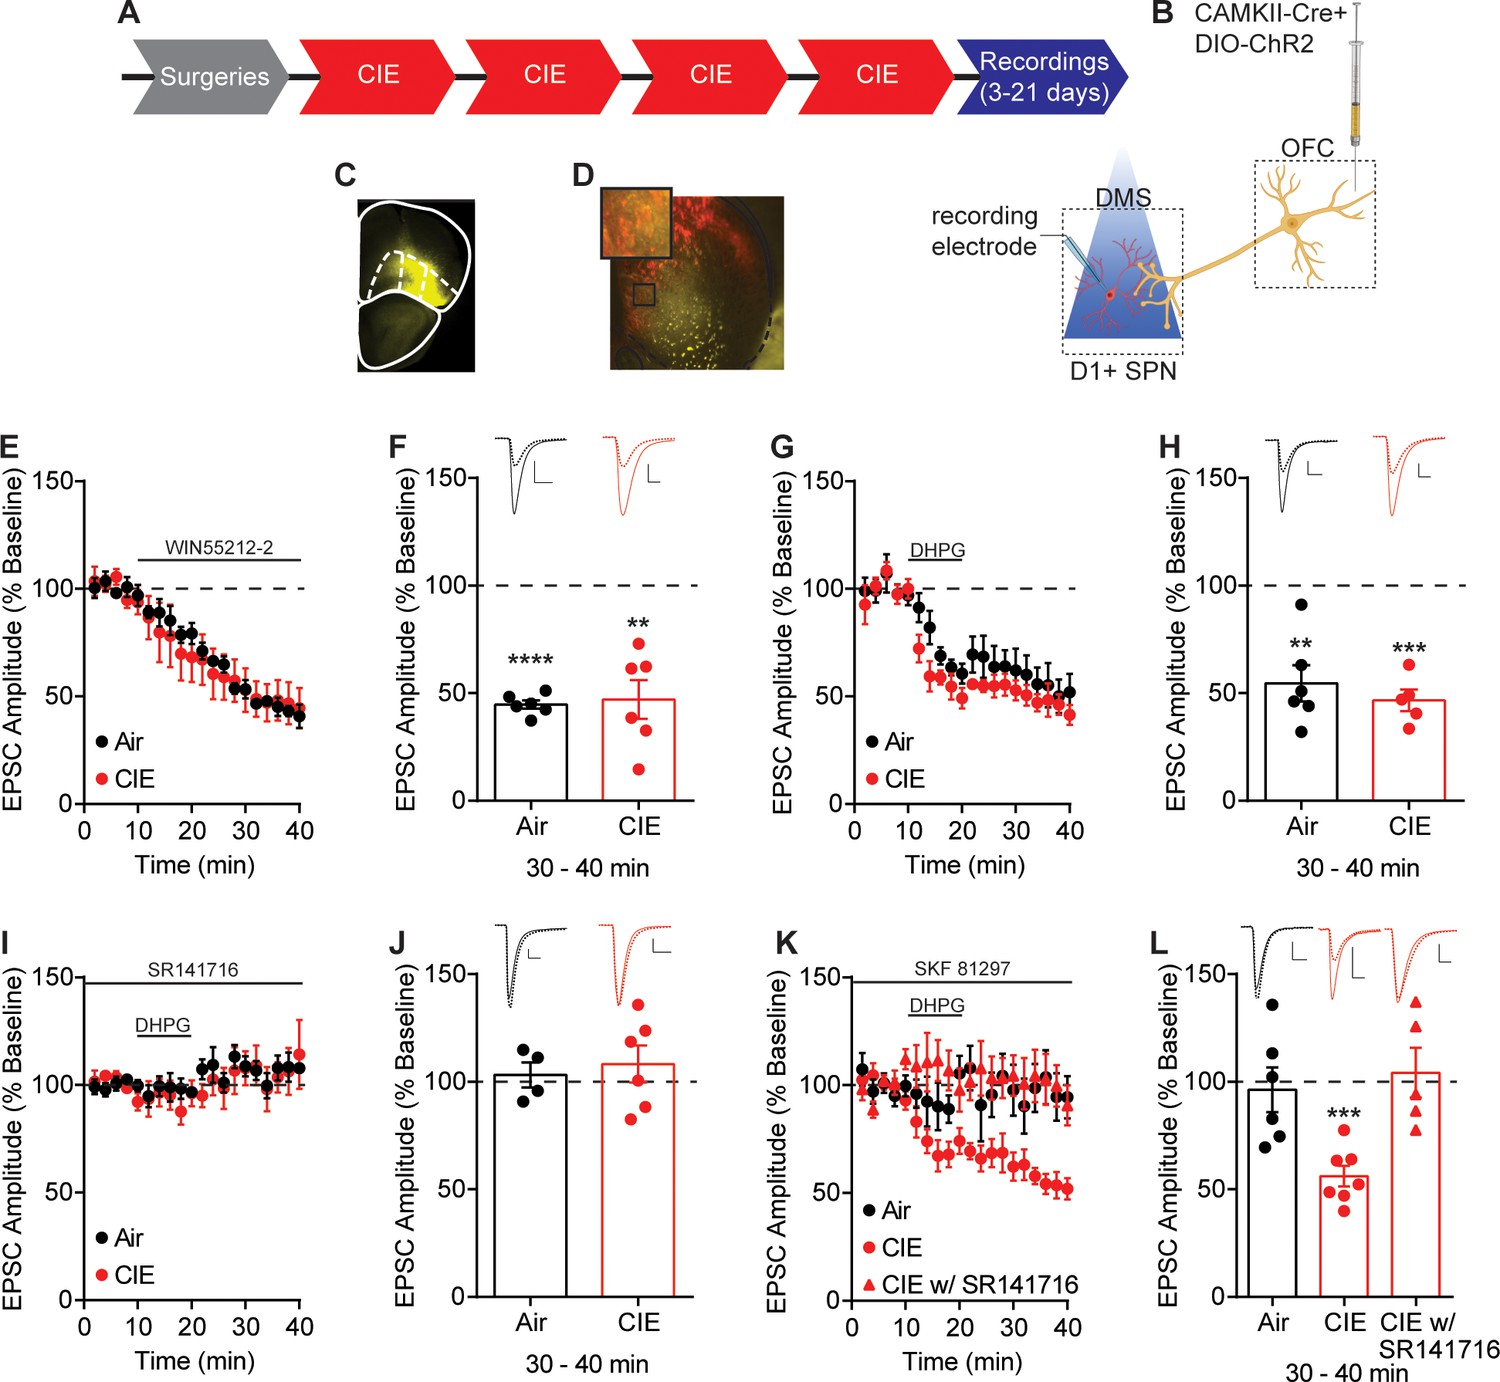
Endocannabinoid-mediated plasticity of OFC transmission to D1 SPNs in Air and CIE mice.
(A) Experimental timeline that includes surgeries followed by four cycles of CIE exposure and whole-cell recordings 3–21 days in withdrawal. (B) Schematic of viral injections in OFC and optical stimulation of OFC terminals during whole-cell recordings of D1 SPNs in the DS. (C) Representative viral expression of ChR2 in OFC. (D) Example ChR2 expression of OFC terminals and expression of tdTomato in D1 SPNs in the DS. (E) Bath application of a CB1 receptor agonist, WIN55212-2 (1 µM), during optical stimulation of OFC terminals to D1 SPNs in Air (n = 6 cells, four mice) and CIE (n = 6 cells, three mice). (F) Bar graphs representing the percentage change from baseline (min 0–10) after bath application of WIN55212-2 (min 30–40). (G) Endocannabinoid mediated long-term depression induced by bath application of a group 1 mGluR agonist, DHPG (50 µM) paired with depolarization to 0 mV in Air (n = 6 cells, three mice) and CIE (n = 5 cells, three mice). (H) Bar graphs representing the percentage change from baseline after bath application of DHPG. (I) DHPG-LTD of OFC transmission is blocked by a CB1 receptor antagonist, SR141716 (1 µM) in both Air (n = 4 cells, three mice) and CIE (n = 6 cells, three mice). (J) Bar graphs representing the percentage change from baseline after bath application of DHPG in the presence of SR141716. (K) D1 agonist (3 µM SKF 81297) blocks the expression of DHPG-LTD in Air mice (n = 6 cells, four mice) but has no effect in mice exposed to CIE (n = 7 cells, five mice; w/ SR141716 n = 5 cells, two mice). (L) Bar graphs representing the percentage change from baseline after bath application of DHPG in the presence of SKF 81297 or SKF 81297 with SR141716. Scale bars represent 10 ms (horizontal) and 50 pA (vertical). Data points and bar graphs represent mean ± SEM. Bonferroni-corrected or paired (vs. baseline) two-tailed t-test, **p≤0.01, ***p≤0.001, ****p≤0.0001.
-
Figure 2—source data 1
Endocannabinoid-mediated plasticity of OFC transmission to D1 SPNs in Air and CIE mice source data.
- https://cdn.elifesciences.org/articles/67065/elife-67065-fig2-data1-v2.xlsx
Figure 2—figure supplement 1
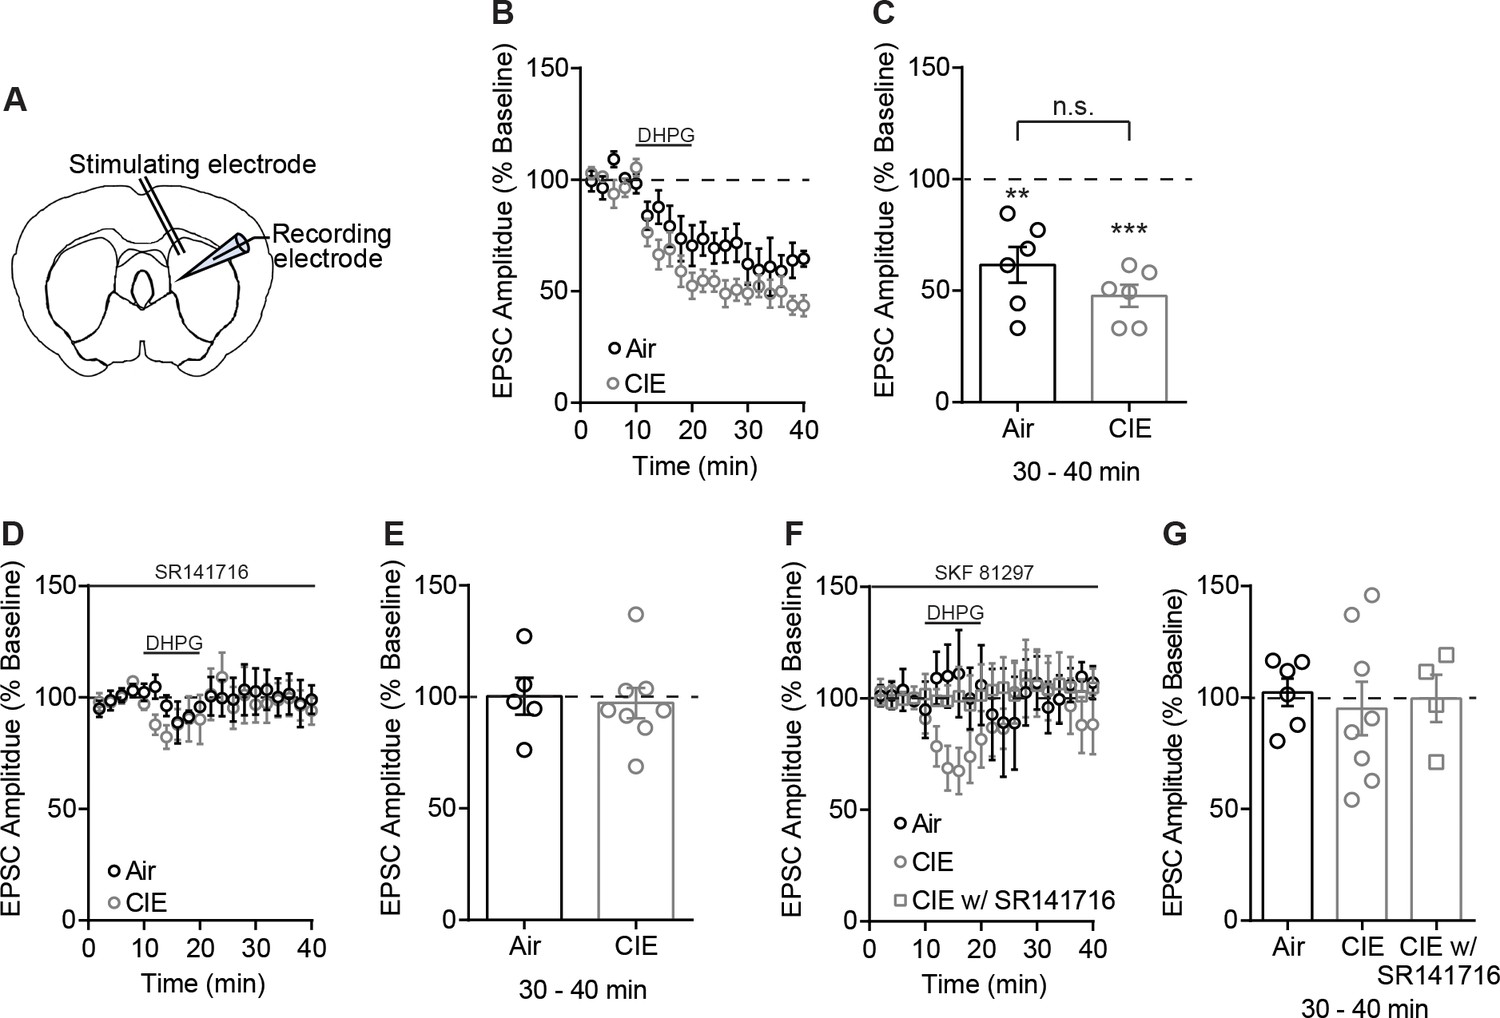
No difference between Air and CIE in the expression of DHPG-LTD of electrically evoked EPSCs.
(A) Schematic of local electrical stimulation and recording site in the DS. (B) DHPG-LTD of electrically evoked EPSCs expressed in both Air and CIE mice. (C) Bar graph representing the percentage change from baseline (min 0–10) after bath application of DHPG (min 30–40) (Air: 61.62 ± 8.03% of baseline at 30–40 min, n = 6, paired t-test vs. baseline: t5 = 4.79, p<0.01; CIE: 47.69 ± 4.95% of baseline at 30–40 min, n = 6, paired t-test vs. baseline: t5 = 10.57, p=0.0001; unpaired t-test Air vs. CIE: t10 = 1.48, p=0.17) and (D) DHPG-LTD is blocked by a CB1 receptor antagonist, SR141716 (1 µM). (E) Bar graphs representing the percentage change from baseline after bath application of DHPG in the presence of SR141716 (Air: 100.3 ± 8.27% of baseline at 30–40 min, n = 5, paired t-test vs. baseline: t4 = 0.04, p=0.97; CIE: 97.25 ± 6.87% of baseline at 30–40 min, n = 8, paired t-test vs. baseline: t7 = 0.40, p=0.70). (F) D1 agonist (3 µM SKF 81297) blocks the expression of DHPG-LTD in both Air and CIE. (G) Bar graphs representing the percentage change from baseline after bath application of DHPG in the presence of SKF 81297 or SKF 81297 with SR141716 (Air: 103.6 ± 8.45% of baseline at 30–40 min, n = 4, paired t-test vs. baseline: t3 = 0.43, p=0.70; CIE: 95.11 ± 11.97% of baseline at 30–40 min, n = 8, paired t-test vs. baseline: t7 = 0.41, p=0.70). Short-term depression in CIE mice (74.04 ± 9.88% of baseline at 10–20 min, n = 8, paired t-test vs. baseline: t7 = 2.63, p=0.03) is CB1 receptor dependent (107.10 ± 10.13% of baseline at 10–20 min, n = 4, paired t-test vs. baseline: t3 = 0.70, p=0.53; 99.61 ± 10.58% of baseline at 30–40 min, n = 4, paired t-test vs. baseline: t3 = 0.04, p=0.97). Data points and bar graphs represent the mean ± SEM.
-
Figure 2—figure supplement 1—source data 1
No difference betwen Air and CIE in the expression of DHPG-LTD of electrically evoked EPSCs.
- https://cdn.elifesciences.org/articles/67065/elife-67065-fig2-figsupp1-data1-v2.xlsx
Figure 3 with 2 supplements
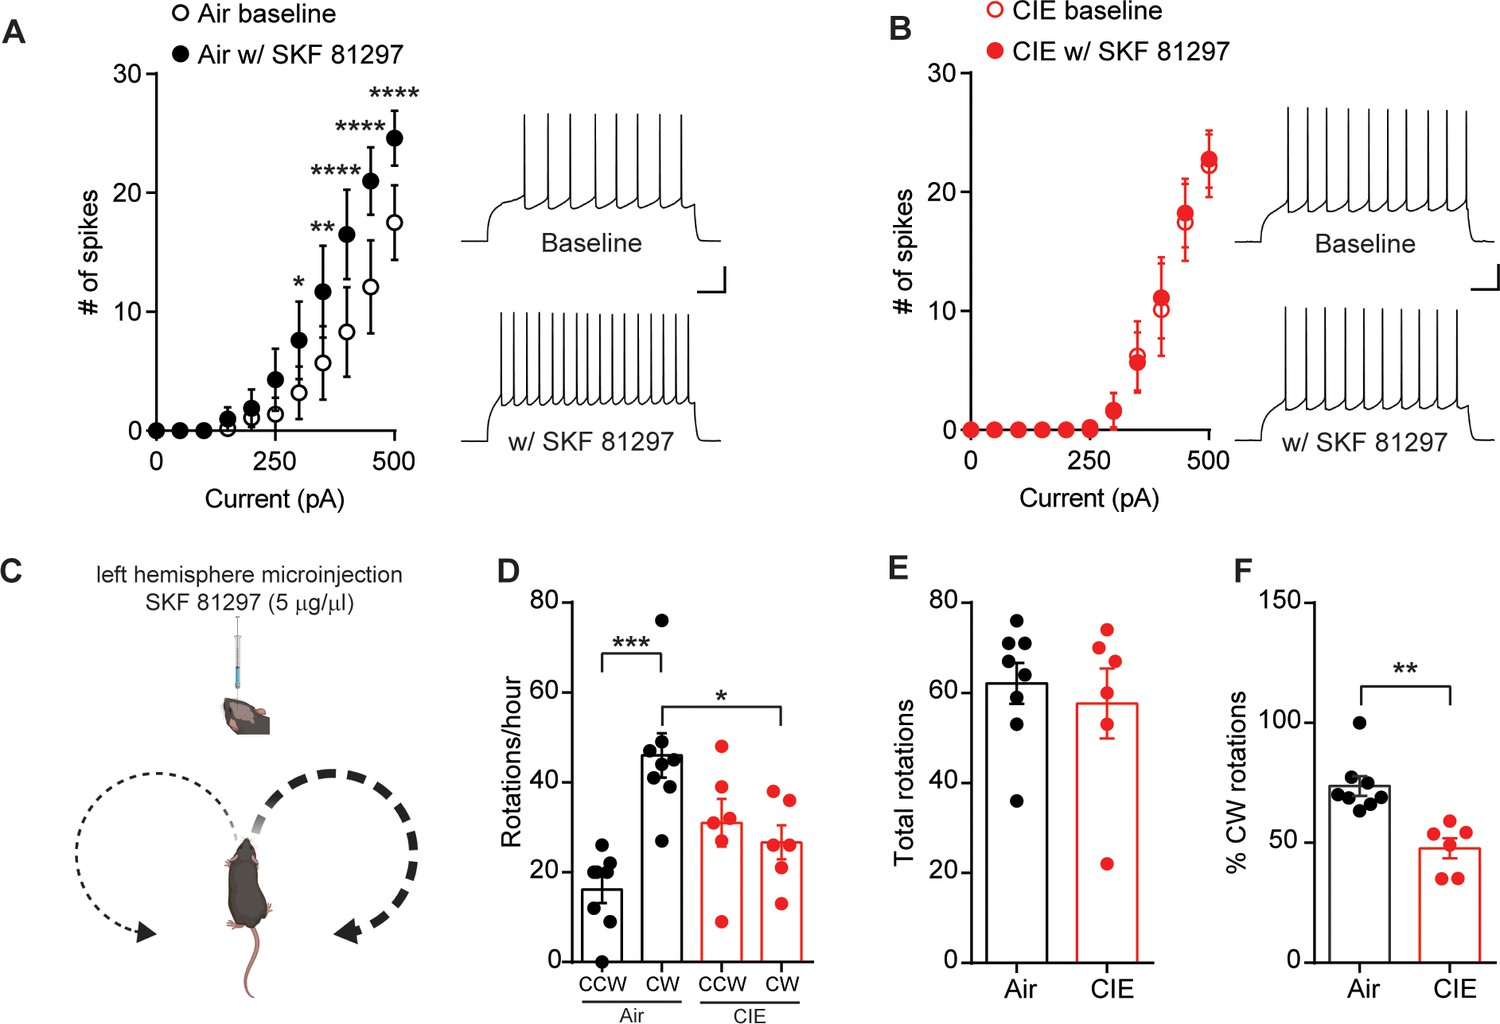
D1 receptor function is disrupted in CIE-exposed mice.
(A) Number of action potentials plotted against current injected under baseline conditions and in the presence of D1 agonist, SKF81297 (10 µM) (left) and sample traces (right) in D1 SPNs of Air (n = 10 cells, three mice) and (B) CIE (n = 9 cells, four mice). Scale bars represent 100 ms (horizontal) and 20 mV (vertical). (C) Schematic of unilateral microinjections (300 nL) of SKF 81297 (5 µg/µl) in the left hemisphere in the DS and predicted bias toward clockwise (CW) rotations. (D) Number of CW rotations and counterclockwise (CCW) rotations in Air (n = 8 mice) and CIE (n = 6 mice) (two vapor cohorts) mice counted over an hour session. (E) Total rotations (CW+CCW) in Air and CIE mice. (F) Percentage of CW turns in Air and CIE mice. Data points and bar graphs represent mean ± SEM. Bonferroni-corrected post hoc test of repeated-measures ANOVA or unpaired two-tailed t-test, *p≤0.05, **p≤0.01, ***p≤0.001, ****p≤0.0001.
-
Figure 3—source data 1
D1 receptor function is disrupted in CIE-exposed mice source data.
- https://cdn.elifesciences.org/articles/67065/elife-67065-fig3-data1-v2.xlsx
Figure 3—figure supplement 1
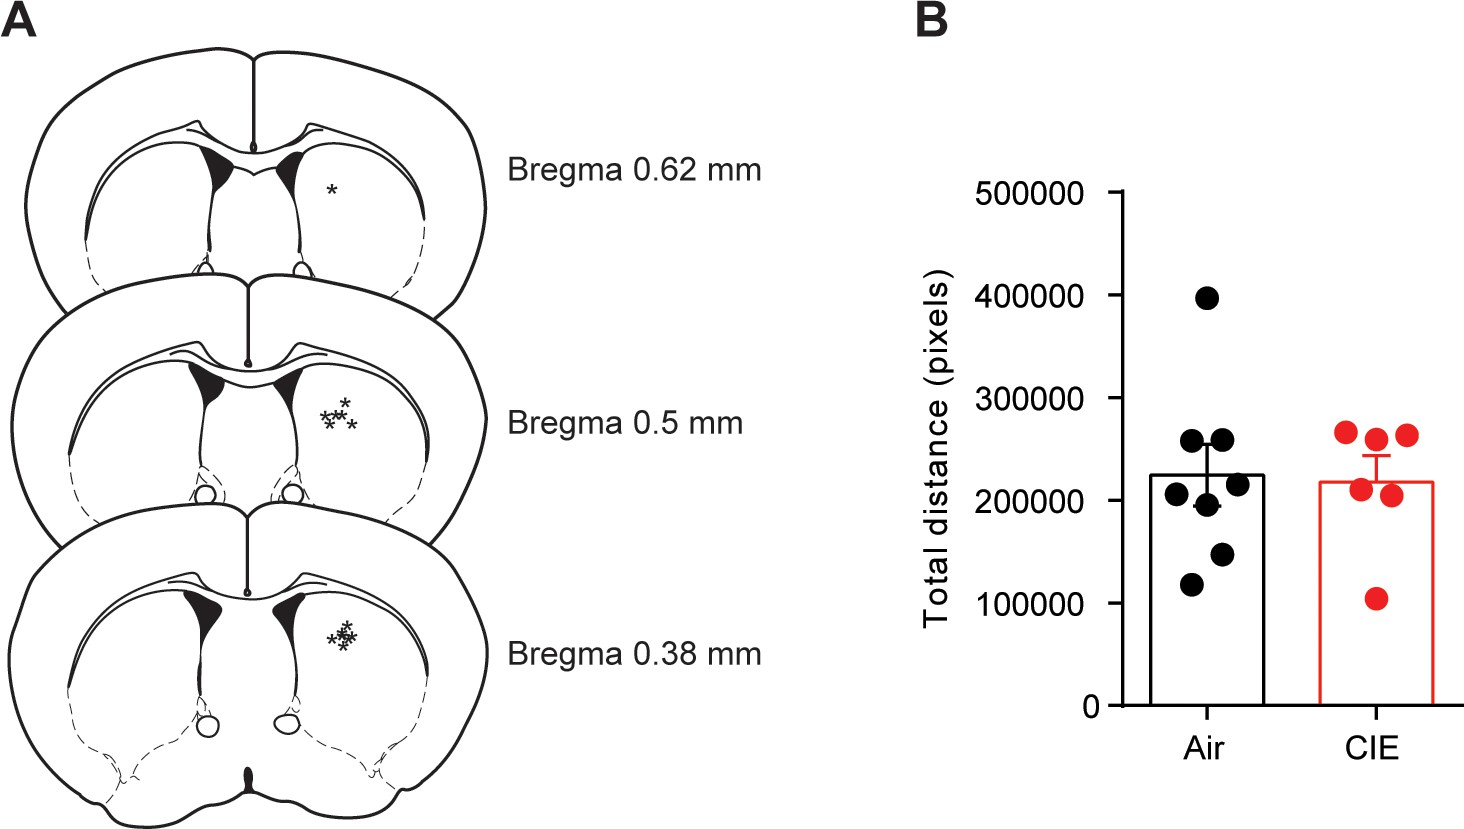
Unilateral D1 agonist injection and distance traveled.
(A) Schematic representation of cannula tip placement in DS for unilateral injections. (B) Total distance traveled in Air and CIE mice. Bar graphs represent the mean ± SEM.
-
Figure 3—figure supplement 1—source data 1
Unilateral D1 agonist injection and distance traveled source data.
- https://cdn.elifesciences.org/articles/67065/elife-67065-fig3-figsupp1-data1-v2.xlsx
Figure 3—figure supplement 2
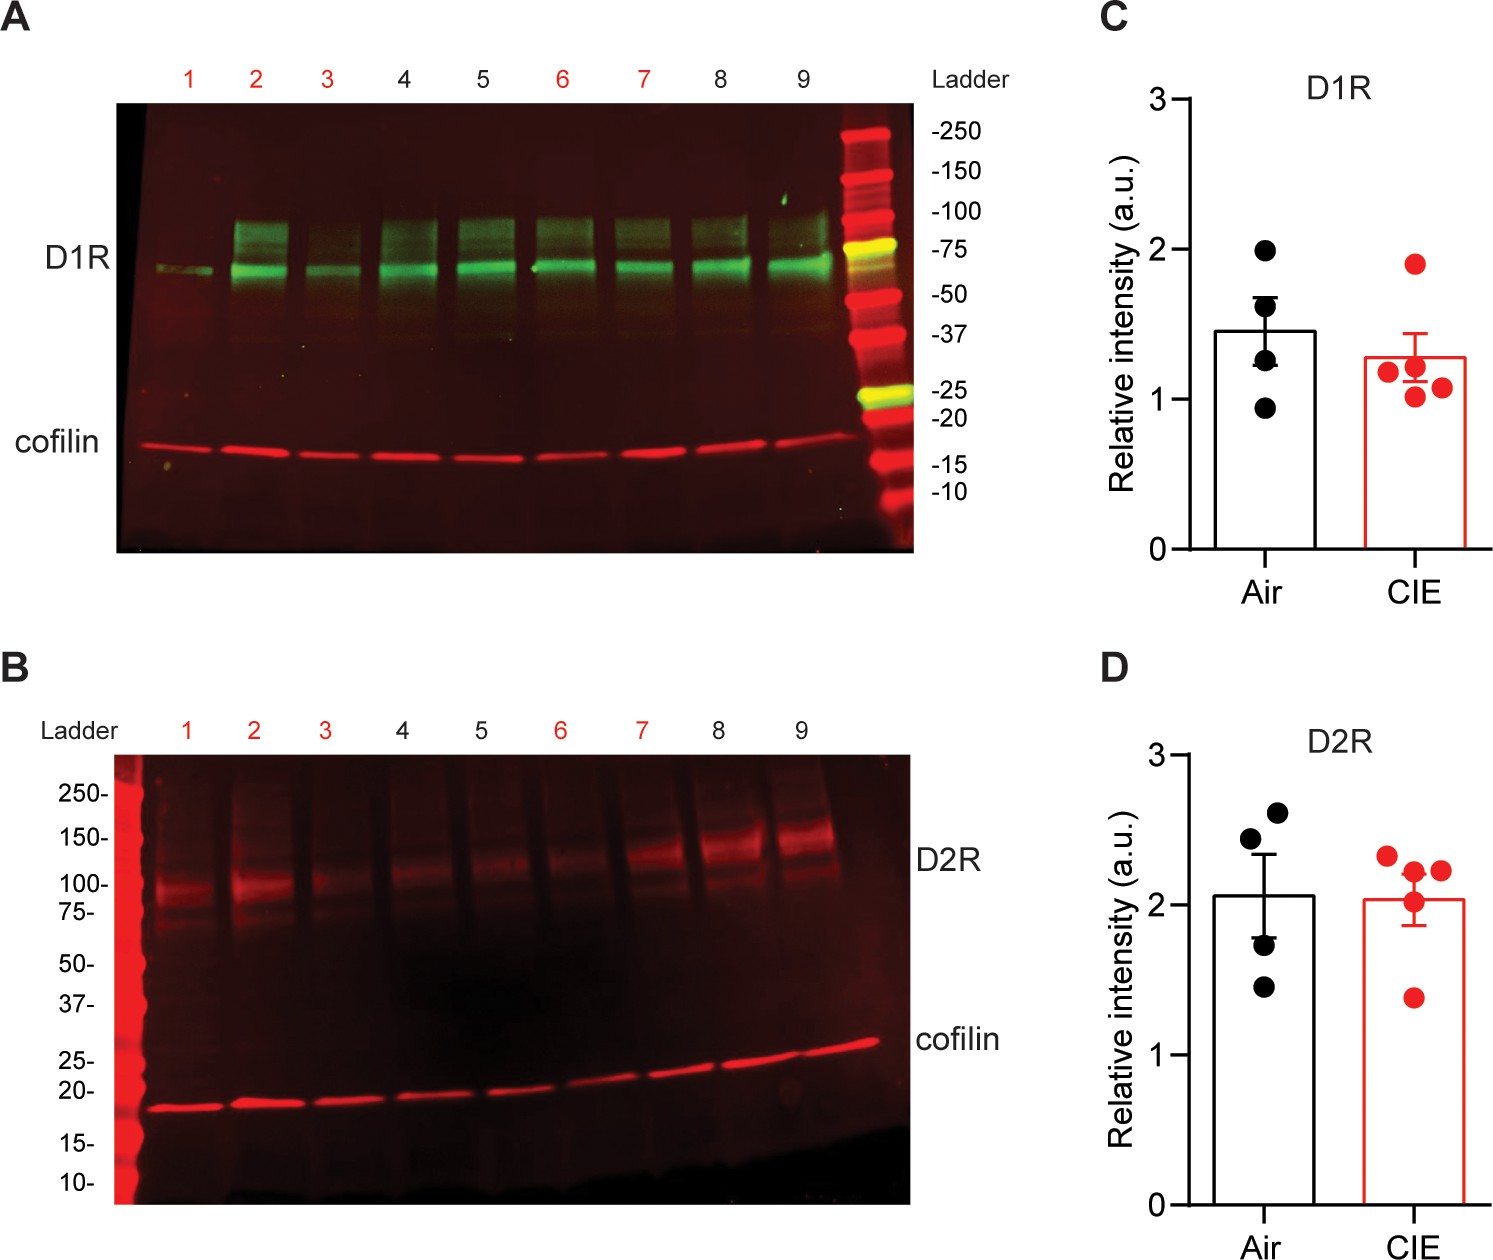
No change in DS D1 or D2 receptor expression in CIE mice compared to Air controls.
(A) Example immunoblots for D1 and (B) D2 dopamine receptors (Air = 4, 5, 8, 9; CIE = 1, 2, 3, 6, 7). (C) Band density for D1 and (D) D2 receptors normalized to coflin averaged across two runs. Bar graphs represent the mean ± SEM.
-
Figure 3—figure supplement 2—source data 1
No change in D2 D1 or D2 receptor expression in CIE mice compared to Air controls source data.
- https://cdn.elifesciences.org/articles/67065/elife-67065-fig3-figsupp2-data1-v2.xlsx
Figure 4 with 2 supplements
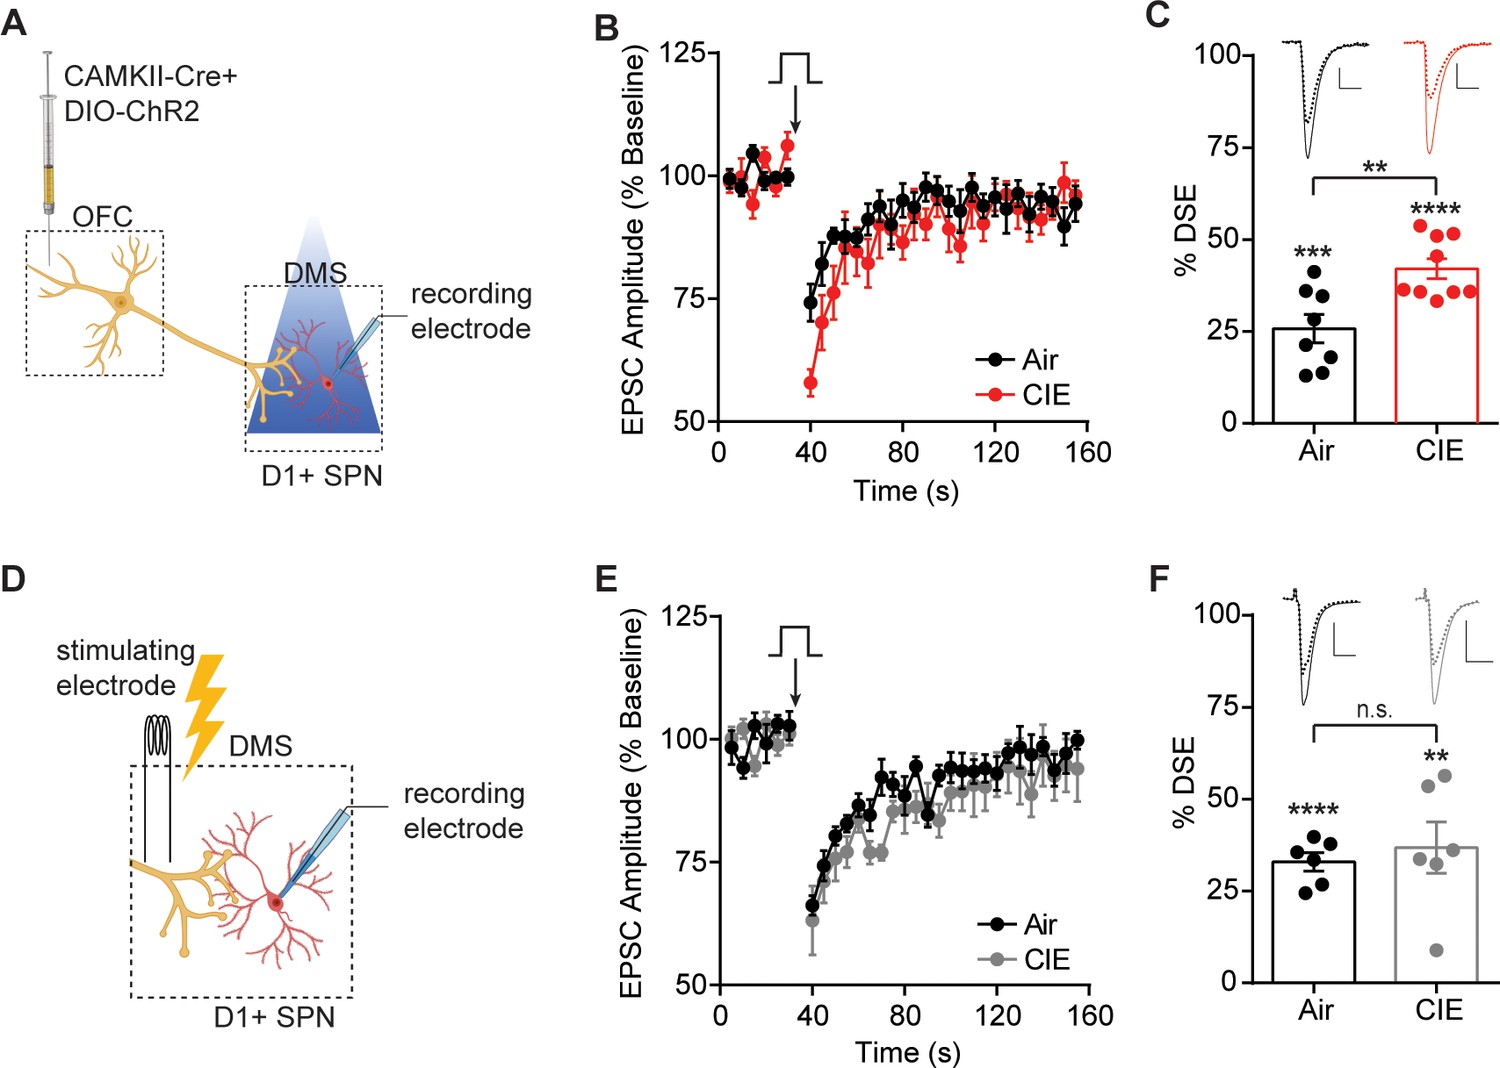
CIE-induced enhancement of DSE at OFC terminals to D1 SPNs in the DS.
(A) Schematic of viral injections in OFC and optical stimulation of OFC terminals during whole-cell recordings of D1 SPNs in the DS. (B) Depolarization-induced suppression of excitation (DSE) of OFC inputs to D1 SPNs in Air (n = 8 cells, three mice) and CIE (n = 9 cells, three mice). (C) Bar graphs representing the percentage change from baseline immediately after depolarization. (D) Schematic of local electrical stimulation during whole-cell recordings of D1 SPNs in the DS. (E) DSE of excitatory inputs to D1 SPNs using electrical stimulation in Air (n = 6 cells, two mice) and CIE (n = 6 cells, three mice). (F) Bar graphs representing the percentage change from baseline immediately after depolarization. Scale bars represent 10 ms (horizontal) and 50 pA (vertical). Data points and bar graphs represent mean ± SEM. Scale bars represent 10 ms (horizontal) and 50 pA (vertical). Unpaired (Air vs. CIE) or paired (vs. baseline) two-tailed t-test, **p≤0.01, ***p≤0.001, ****p≤0.0001.
-
Figure 4—source data 1
CIE-induced enhancement of DSE at OFC terminals to D1 SPNs in the DS source data.
- https://cdn.elifesciences.org/articles/67065/elife-67065-fig4-data1-v2.xlsx
Figure 4—figure supplement 1

DSE in D2 SPNs and effect of SR141716 on DSE in D1 SPNs.
(A) Depolarization-induced suppression of excitation (DSE) of OFC inputs to D2 SPNs in Air control and CIE mice. (B) Bar graphs representing the percentage change from baseline immediately after depolarization. (C) DSE of excitatory inputs to D2 SPNs using electrical stimulation in Air and CIE mice. (D) Bar graphs representing the percentage change from baseline immediately after depolarization. (E) DSE of OFC inputs to D1 SPNs in the presence of a CB1 receptor antagonist, SR141716 (1 µM) in Air and CIE mice. (F) Bar graphs representing the percentage change from baseline immediately after depolarization. (G) DSE of excitatory inputs to D1 SPNs using electrical stimulation in the presence of a CB1 receptor antagonist, SR141716 (1 µM) in Air and CIE mice. (H) Bar graphs representing the percentage change from baseline immediately after depolarization. Data points and bar graphs represent the mean ± SEM. Paired (vs. baseline) two-tailed t-test, **p≤0.01, ***p≤0.001.
-
Figure 4—figure supplement 1—source data 1
DSE in D2 SPNs and effect of SR141716 on DSE in D1 SPNs source data.
- https://cdn.elifesciences.org/articles/67065/elife-67065-fig4-figsupp1-data1-v2.xlsx
Figure 4—figure supplement 2
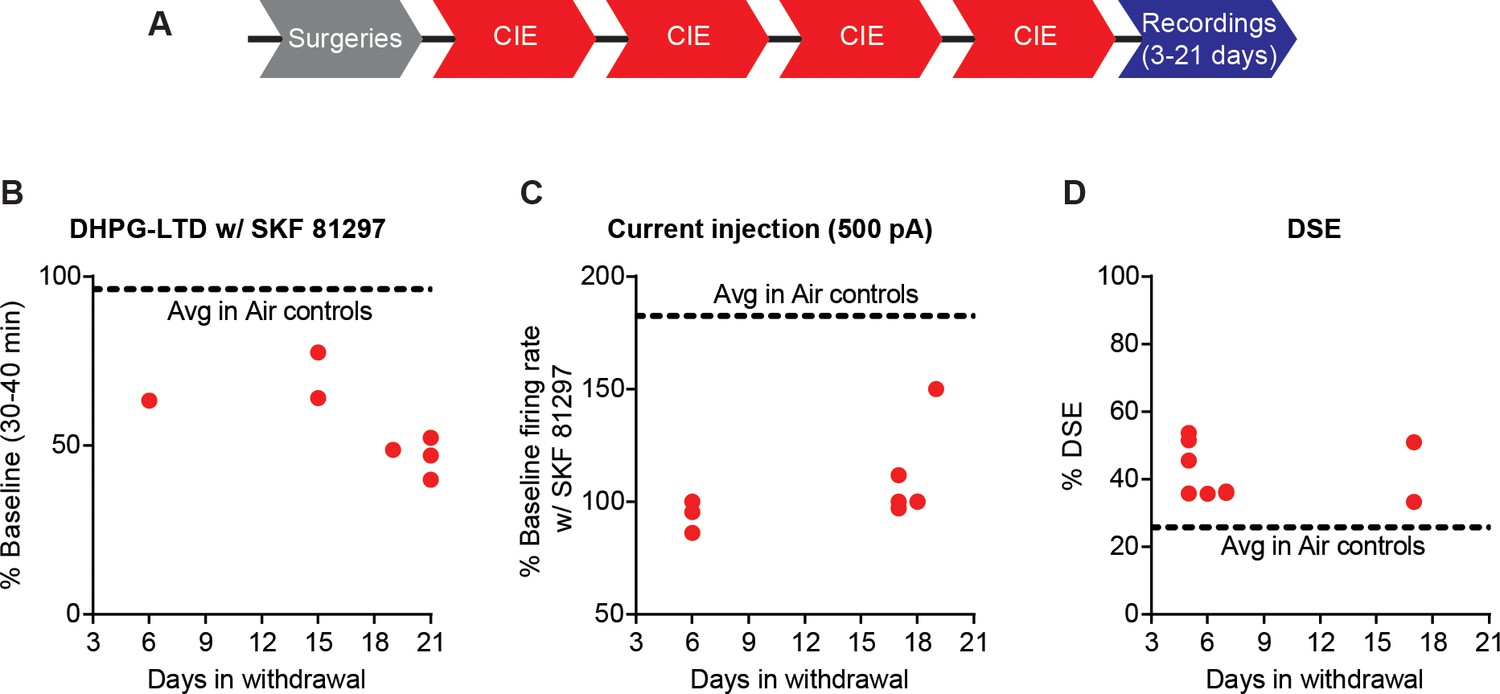
CIE-induced effects on D1 receptor function and DSE across recording days.
(A) Experimental timeline that includes surgeries followed by four cycles of CIE exposure and whole-cell recordings 3–21 days in withdrawal. (B) Expression of DHPG-LTD in the presence of SKF 81297 was persistent across the withdrawal period. (C) SKF 81297 had no effect on D1 SPN firing of CIE mice across the withdrawal period. (D) DSE was increased in CIE mice across the withdrawal period.
-
Figure 4—figure supplement 2—source data 1
CIE-induced effects on D1 receptor function and DSE across recording days source data.
- https://cdn.elifesciences.org/articles/67065/elife-67065-fig4-figsupp2-data1-v2.xlsx
Figure 5 with 2 supplements
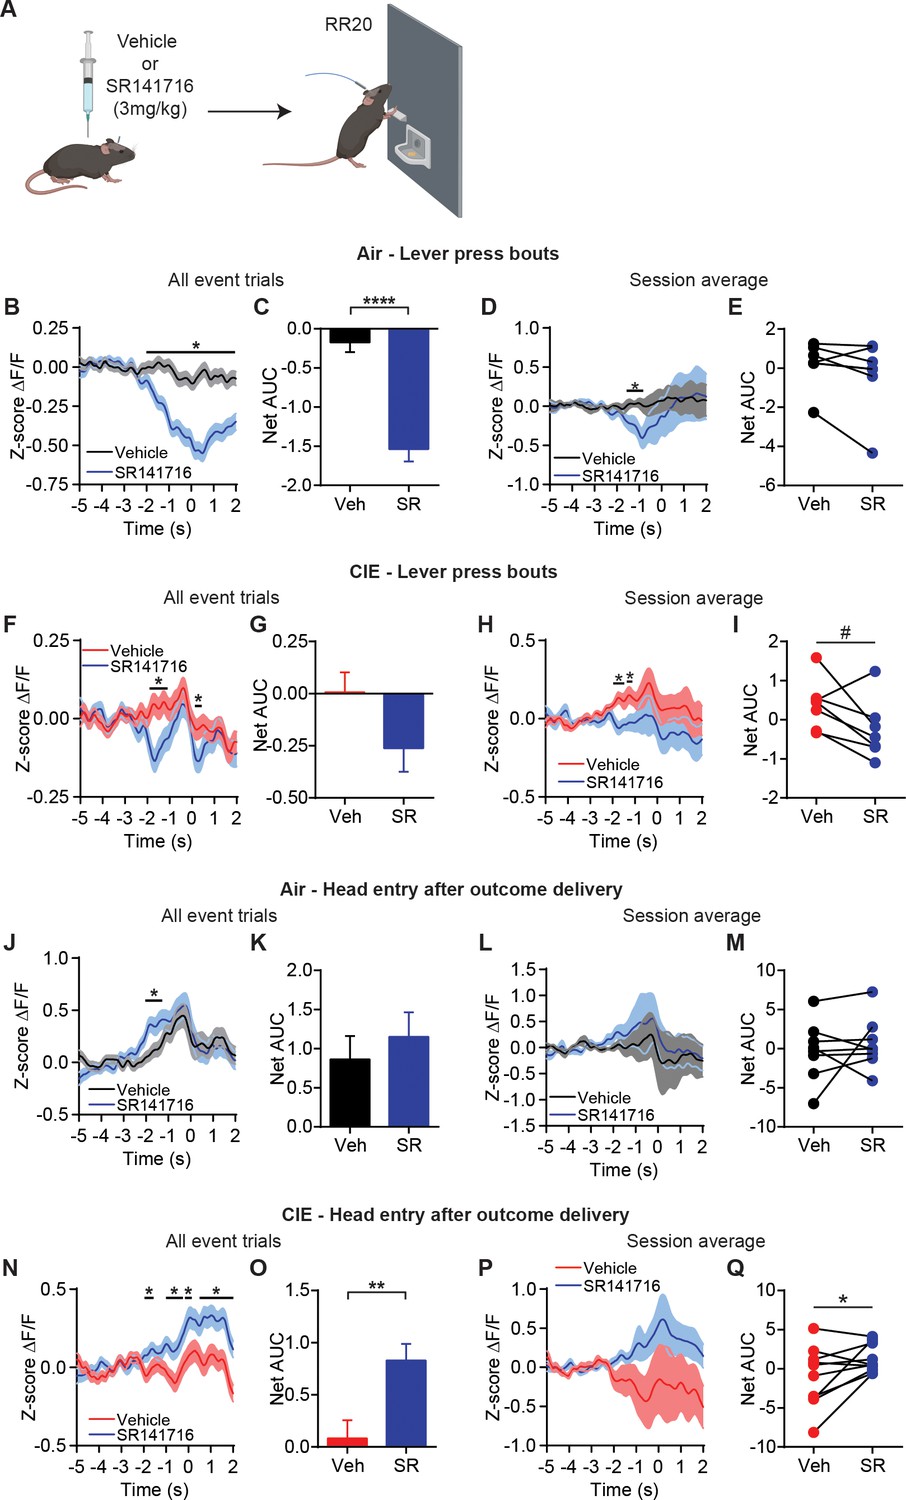
CB1 receptor antagonist restores OFC terminal activity for outcome encoding.
(A) Schematic that depicts injections with vehicle or SR141716 followed by an operant session under a random ratio 20 (RR20) schedule of reinforcement in Air (n = 9 mice, three vapor cohorts) and CIE (n = 11 mice, three vapor cohorts). (B) Z-score of ΔF/F GCaMP6s trace recorded in OFC terminals during lever press bouts in mice injected with vehicle or SR141716 including all event trials and (C) net area under the curve (AUC) in Air mice. (D) Z-score of ΔF/F GCaMP6s traces during lever press bouts including session averages and (E) net AUC of Z-score GCaMP6s signal during lever press bouts in Air mice. (F) Z-score of ΔF/F GCaMP6s trace recorded in OFC terminals during lever press bouts in mice injected with vehicle or SR141716 including all event trials and (G) net area under the curve (AUC) in CIE mice. (H) Z-score of ΔF/F GCaMP6s traces during lever press bouts including session averages and (I) net AUC of Z-score GCaMP6s signal during lever press bouts in CIE mice. (J) Z-score of ΔF/F GCaMP6s trace recorded in OFC terminals during the first head entry after outcome delivery in mice injected with vehicle or SR141716 including all event trials and (K) net AUC for each signal in Air mice. (L) Z-score of ΔF/F GCaMP6s trace recorded in OFC terminals during the first head entry after outcome delivery in mice injected with vehicle or SR141716 including session averages and (M) net AUC for each signal in Air mice. (N) Z-score of ΔF/F GCaMP6s trace recorded in OFC terminals during the first head entry after outcome delivery in mice injected with vehicle or SR141716 including all event trials and (O) net AUC for each signal in CIE mice. (P) Z-score of ΔF/F GCaMP6s trace recorded in OFC terminals during the first head entry after outcome delivery in mice injected with vehicle or SR141716 including session averages and (Q) net AUC for each signal in CIE mice. Data points and bar graphs represent mean ± SEM. Two-sided FDR-corrected permutation test or paired two-tailed t-test, *p≤0.05, **p≤0.01, ****p≤0.0001.
-
Figure 5—source data 1
CB1 receptor antagonist restores OFC terminal activity for outcome encoding source data.
- https://cdn.elifesciences.org/articles/67065/elife-67065-fig5-data1-v2.xlsx
Figure 5—figure supplement 1
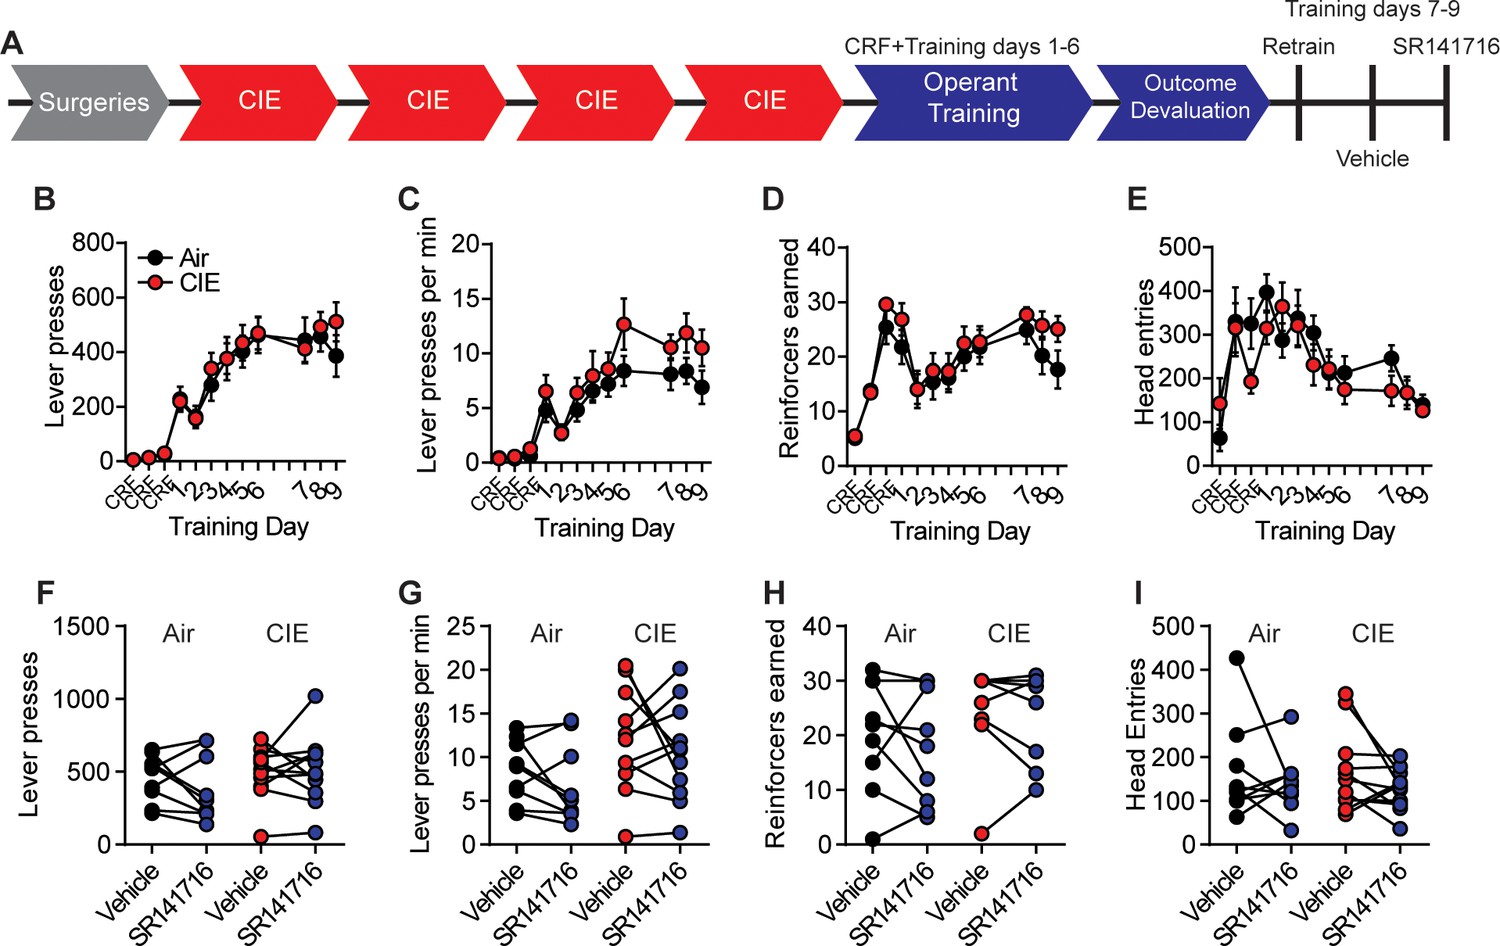
CB1 antagonist did not alter lever press behavior between training days.
(A) Experimental timeline that includes training after outcome devaluation and injections with vehicle or SR141716. (B) Lever presses, (C) response rate, (D) reinforcers earned, and (E) head entries across all training days and retraining and testing days following outcome devaluation. (F) The number of lever presses, (G) response rate, (H) reinforcers earned, and (I) head entries during vehicle or SR141716 injection test sessions in Air and CIE mice. Data points across training days represent the mean ± SEM.
-
Figure 5—figure supplement 1—source data 1
CB1 antagonist did not alter lever press behavior between training days source data.
- https://cdn.elifesciences.org/articles/67065/elife-67065-fig5-figsupp1-data1-v2.xlsx
Figure 5—figure supplement 2
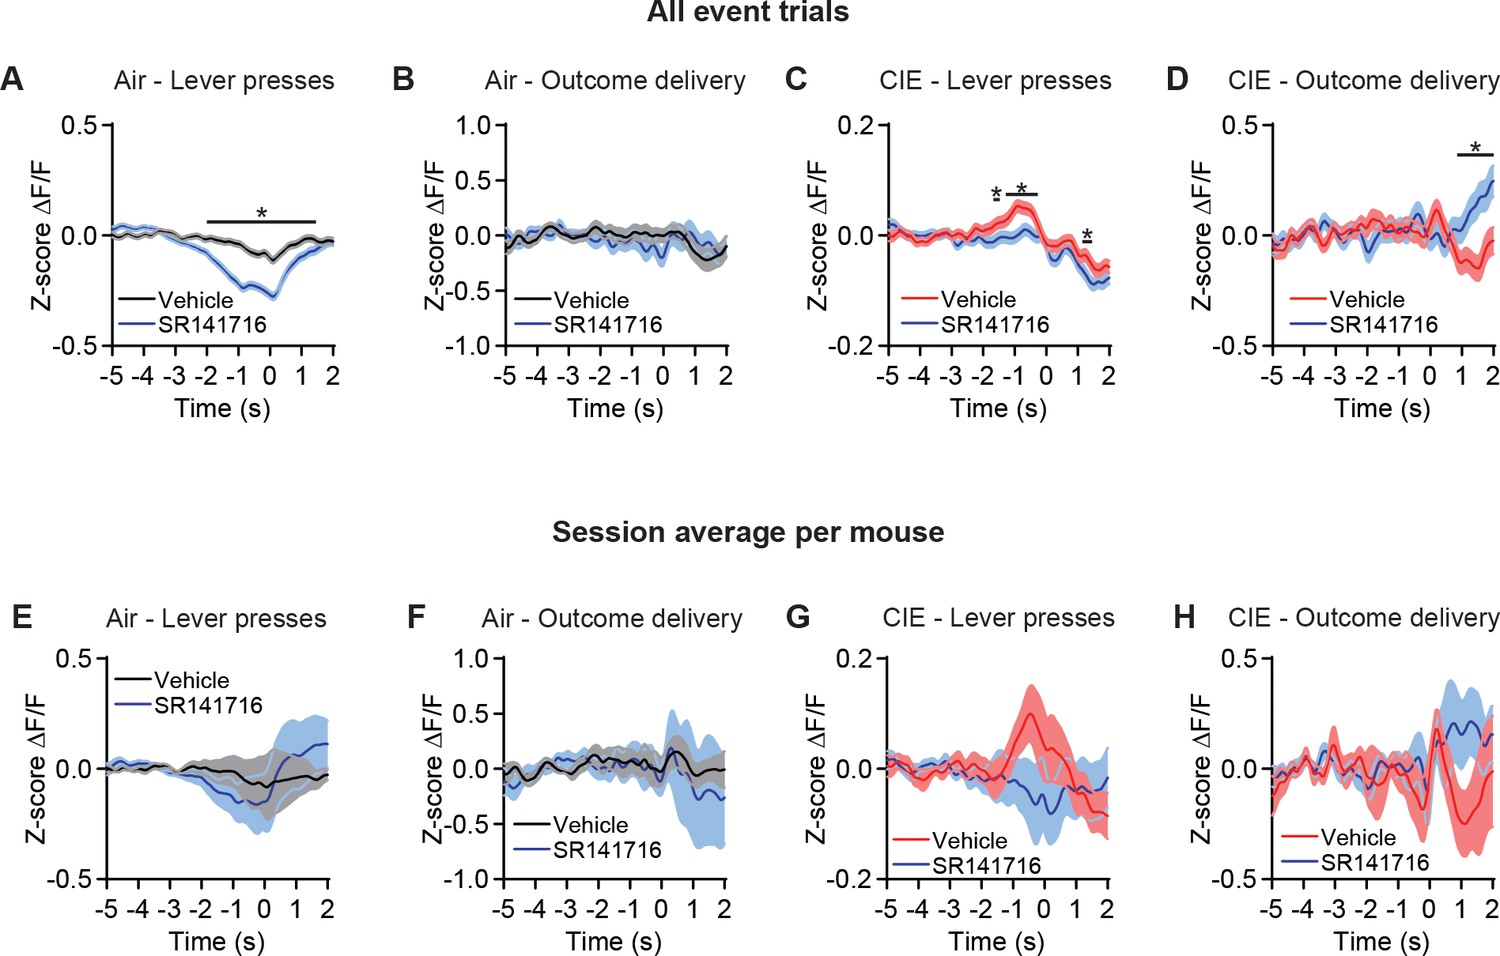
OFC terminal activity in DS with vehicle or CB1 antagonist.
(A) Z-score of ΔF/F GCaMP6s trace including all event trials in vehicle or SR141716 test sessions during lever presses (two-sided FDR-corrected permutation test, Vehicle: n = 3858; SR141716: n = 3773) and (B) outcome delivery (two-sided FDR-corrected permutation test, Vehicle: n = 177; SR141716: n = 160) in Air mice. (C) Z-score of ΔF/F GCaMP6s trace including all event trials in vehicle or SR141716 test sessions during lever presses (two-sided FDR-corrected permutation test, Vehicle: n = 5420; SR141716: n = 4721) and (D) outcome delivery (two-sided FDR-corrected permutation test, Vehicle: n = 274; SR141716: n = 217) in CIE mice. (E) Z-score of ΔF/F GCaMP6s trace including the session average for each Air mouse in vehicle or SR141716 test sessions during lever presses (two-sided FDR-corrected permutation test, Vehicle: n = 8; SR141716: n = 10) and (F) outcome delivery (two-sided FDR-corrected permutation test, Vehicle: n = 8; SR141716: n = 10). (G) Z-score of ΔF/F GCaMP6s trace including the session average for each CIE mouse in vehicle or SR141716 test sessions during lever presses (two-sided FDR-corrected permutation test, Vehicle: n = 11; SR141716: n = 10) and (H) outcome delivery (two-sided FDR-corrected permutation test, Vehicle: n = 12; SR141716: n = 9). Two-sided permutation test, *p≤0.05.
-
Figure 5—figure supplement 2—source data 1
OFC terminal activity in DS with vehicle or CB1 antagonist source data.
- https://cdn.elifesciences.org/articles/67065/elife-67065-fig5-figsupp2-data1-v2.xlsx
Figure 6 with 1 supplement

Blockade of CB1 receptors in the DS restores value-based decision-making in CIE mice.
(A) Experimental timeline that includes surgeries followed by four cycles of CIE exposure, operant training and outcome devaluation. (B) Schematic of mouse lever press training in which Air (Vehicle: n = 7 mice, SR141716: n = 8 mice, three vapor cohorts) and CIE mice (Vehicle: n = 8 mice, SR141716: n = 9 mice, three vapor cohorts) were trained under a random ratio schedule of reinforcement for a food outcome. (C) Lever presses during operant training in Air and CIE mice. (D) Outcome earned during operant training in Air and CIE mice. (E) Schematic of outcome devaluation procedure that includes 1 hr access to sucrose (valued) or the outcome earned during training (devalued) followed by a 5 min extinction test. (F) Normalized lever presses showing the distribution of lever pressing between the valued and devalued day in Air and CIE mice that received microinjections (300 nL) of vehicle or SR141716 (2 µM). Data points and bar graphs represent mean ± SEM. Bonferroni-corrected post hoc test of repeated-measures ANOVA, *p≤0.05, ***p<0.001.
-
Figure 6—source data 1
Blockade of CB1 receptors in the DS restores value-based decision-making in CIE mice source data.
- https://cdn.elifesciences.org/articles/67065/elife-67065-fig6-data1-v2.xlsx
Figure 6—figure supplement 1
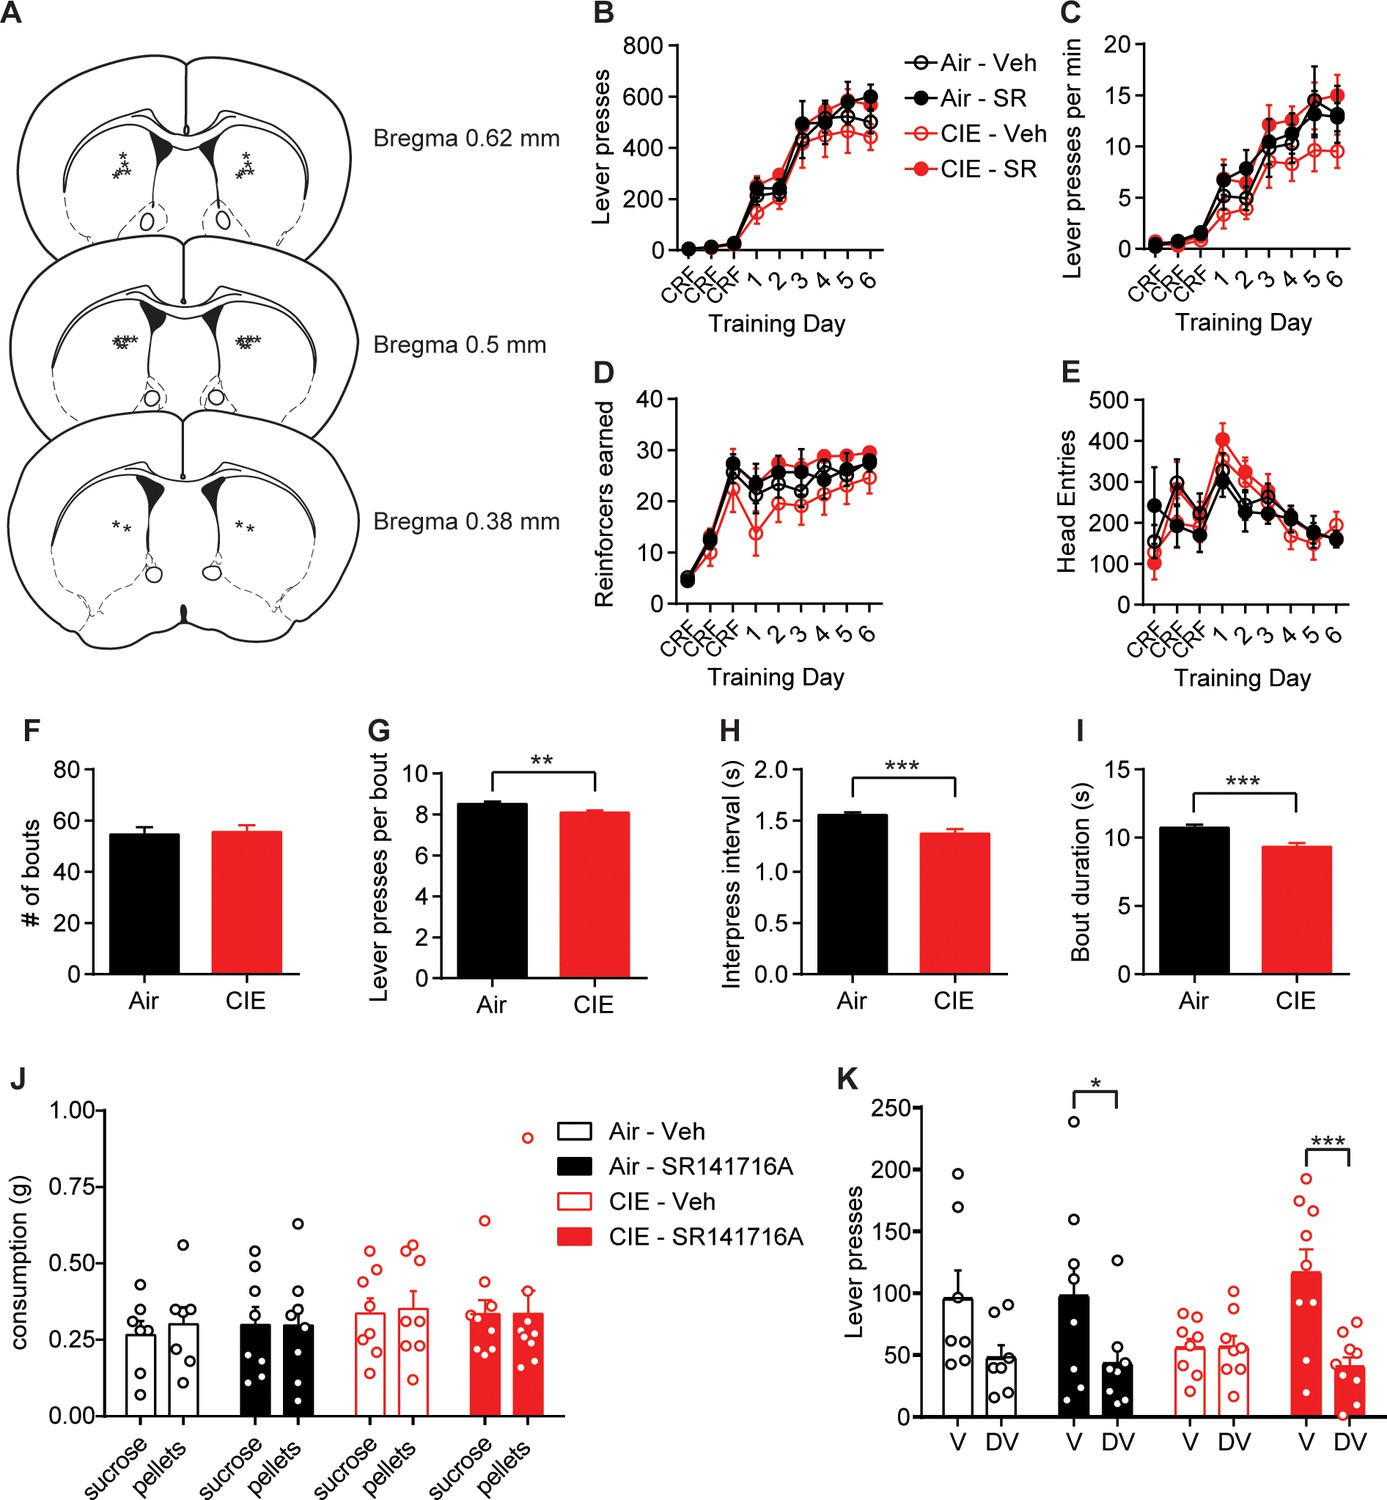
Behavioral data during lever press training and outcome devaluation in treatment and control groups of Air and CIE mice.
(A) Schematic representation of bilateral cannula placement in DS. (B) Lever presses across training days for each treatment group (repeated-measures ANOVA: main effect of Time: F(8, 224)=157.0, p<0.0001; no main effect of Treatment or interaction, Fs < 1.08). (C) Response rate of lever pressing during acquisition (repeated-measures ANOVA: main effect of Time: F(8, 224)=86.80, p<0.0001; no main effect of Treatment or interaction, Fs < 1.10). (D) Reinforcers earned across training days (repeated-measures ANOVA: main effect of Time: F(8, 224)=70.03, p<0.0001; no main effect of Treatment or interaction, Fs < 1.40). (E) Head entries across training days (repeated-measures ANOVA: main effect of Time: F(8, 224)=10.68, p<0.0001; no main effect of Treatment or interaction, Fs < 1.02). (F) Average number of lever press bouts (Air: 54.58 ± 2.83, n = 60; CIE: 55.54 ± 2.61, n = 68; unpaired t-test: t126 = 0.25, p=0.80), (G) lever presses per bout (Air: 8.52 ± 0.12, n = 3275; CIE: 8.10 ± 0.10, n = 3777; unpaired t-test: t7050 = 2.72, p<0.01), (H) inter-press interval per lever press bout (Air: 1.56 ± 0.03, n = 3275; CIE: 1.37 ± 0.05, n = 3777; unpaired t-test: t7050 = 3.33, p<0.001), and (I) bout duration in Air and CIE mice (Air: 10.72 ± 0.23, n = 3275; CIE: 9.34 ± 0.27, n = 3777; unpaired t-test: t7050 = 3.85, p<0.001). (J) Consumption of sucrose and pellets on valued and devalued days respectively (repeated-measures ANOVA: no interaction or main effects of Time or Treatment, Fs < 0.41). (K) Lever presses on Valued and Devalued days for each treatment group (repeated-measures ANOVA: Valuation state × Treatment interaction: F(3, 28)=3.28, p<0.05; main effect of Valuation state: F(1, 28)=23.71, p<0.0001; no main effect of Treatment F < 0.49). Data points and bar graphs represent the mean ± SEM. Bonferroni corrected post hoc test of repeated-measures ANOVA or unpaired two-tailed t-test, *p<0.05, **p<0.01, ***p<0.001.
-
Figure 6—figure supplement 1—source data 1
Behavioral data during lever press training and outcome devaluation in treatment and control groups of Air and CIE mice source data.
- https://cdn.elifesciences.org/articles/67065/elife-67065-fig6-figsupp1-data1-v2.xlsx
Figure 7
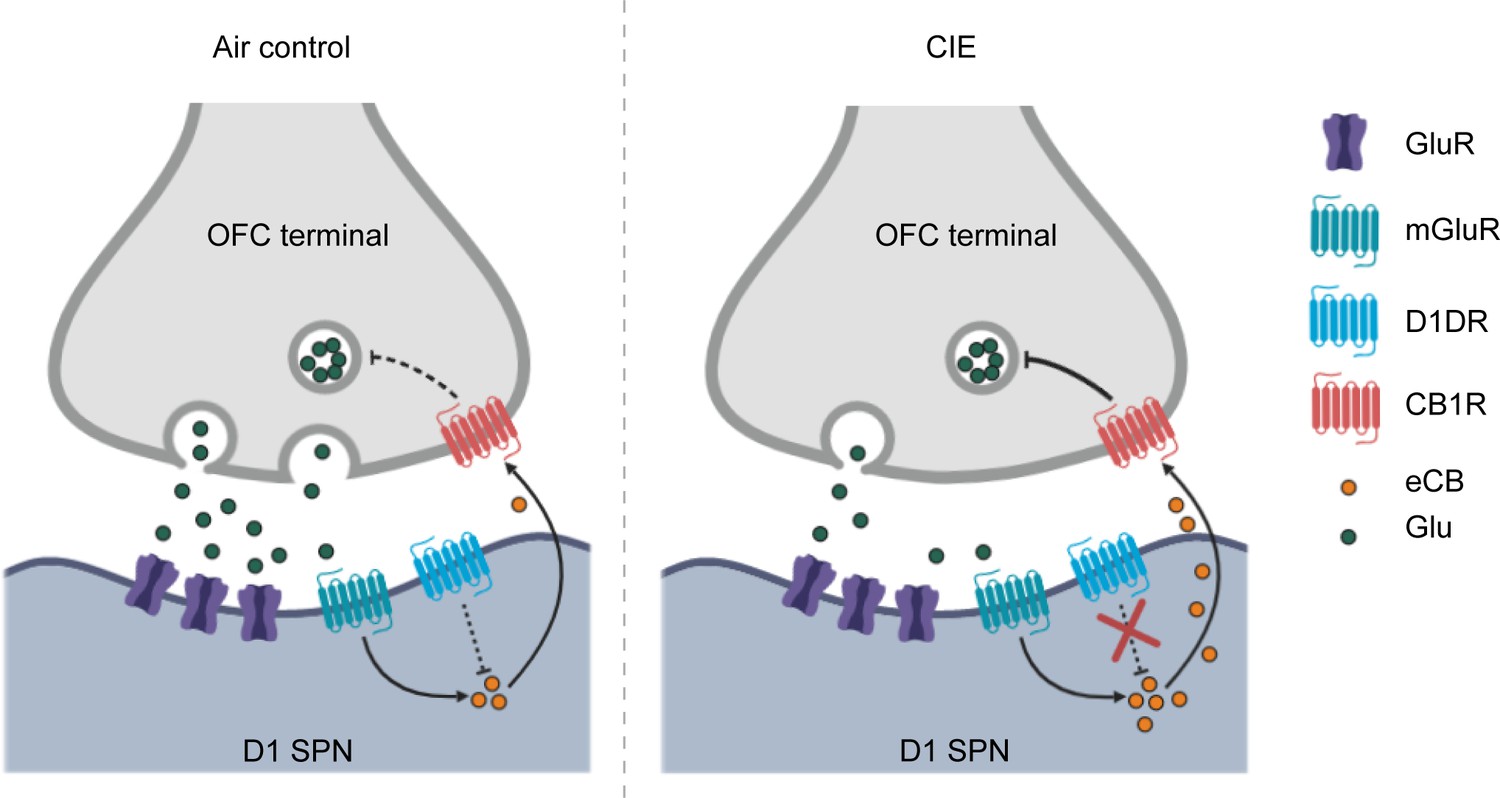
Summary of hypothesized alterations in D1 receptor function and endocannabinoid signaling in D1 SPNs of CIE-exposed mice.
In Air controls (left), D1 receptor activity regulates endocannabinoid production and/or release. In CIE mice (right), the loss of D1 receptor function leads to unregulated endocannabinoid signaling and the long-term reduction in glutamate release from OFC inputs.
Additional files
Download links
A two-part list of links to download the article, or parts of the article, in various formats.
Downloads (link to download the article as PDF)
Open citations (links to open the citations from this article in various online reference manager services)
Cite this article (links to download the citations from this article in formats compatible with various reference manager tools)
Mechanism for differential recruitment of orbitostriatal transmission during actions and outcomes following chronic alcohol exposure
eLife 10:e67065.
https://doi.org/10.7554/eLife.67065


