A Cas-BCAR3 co-regulatory circuit controls lamellipodia dynamics
- Division of Basic Sciences, Fred Hutchinson Cancer Research Center, United States
- Molecular and Cellular Biology Program, University of Washington, United States
Figures
Figure 1

CRL5 regulates BCAR3 protein turnover.
(a) Cas and BCAR3 structures. (b) Ratio of BCAR3 pY117 and pY266 phosphopeptide abundance in Cul5-deficient (shCul5) relative to control (Ctrl) MCF10A cells. n=three biological replicates. (c) BCAR3 protein and RNA levels in Ctrl and shCul5 cells. Representative immunoblot of cells cultured in assay or growth media (see Methods). Quantification of BCAR3 immunoblots and RNA analysis by qPCR, both normalized to GAPDH. Mean ± SD ; n=3 biological replicates. ***p < 0.001 (t-test). (d) BCAR3 degradation. Control and Cul5-deficient cells were treated with cycloheximide (CHX) for various times. Representative immunoblot and quantification. Mean ± SEM ; n=3 biological replicates. (e) Proteasome-dependent BCAR3 degradation. MCF10A cells were treated for 8 hr with CHX and either MLN4924 (cullin neddylation inhibitor), MG132 (proteasome inhibitor), or bafilomycin A1 (lysosome inhibitor). Mean ± SD; the number of biological replicates is noted on the graph. *p < 0.05; ****p < 0.0001 (One-way ANOVA).
Figure 2 with 1 supplement
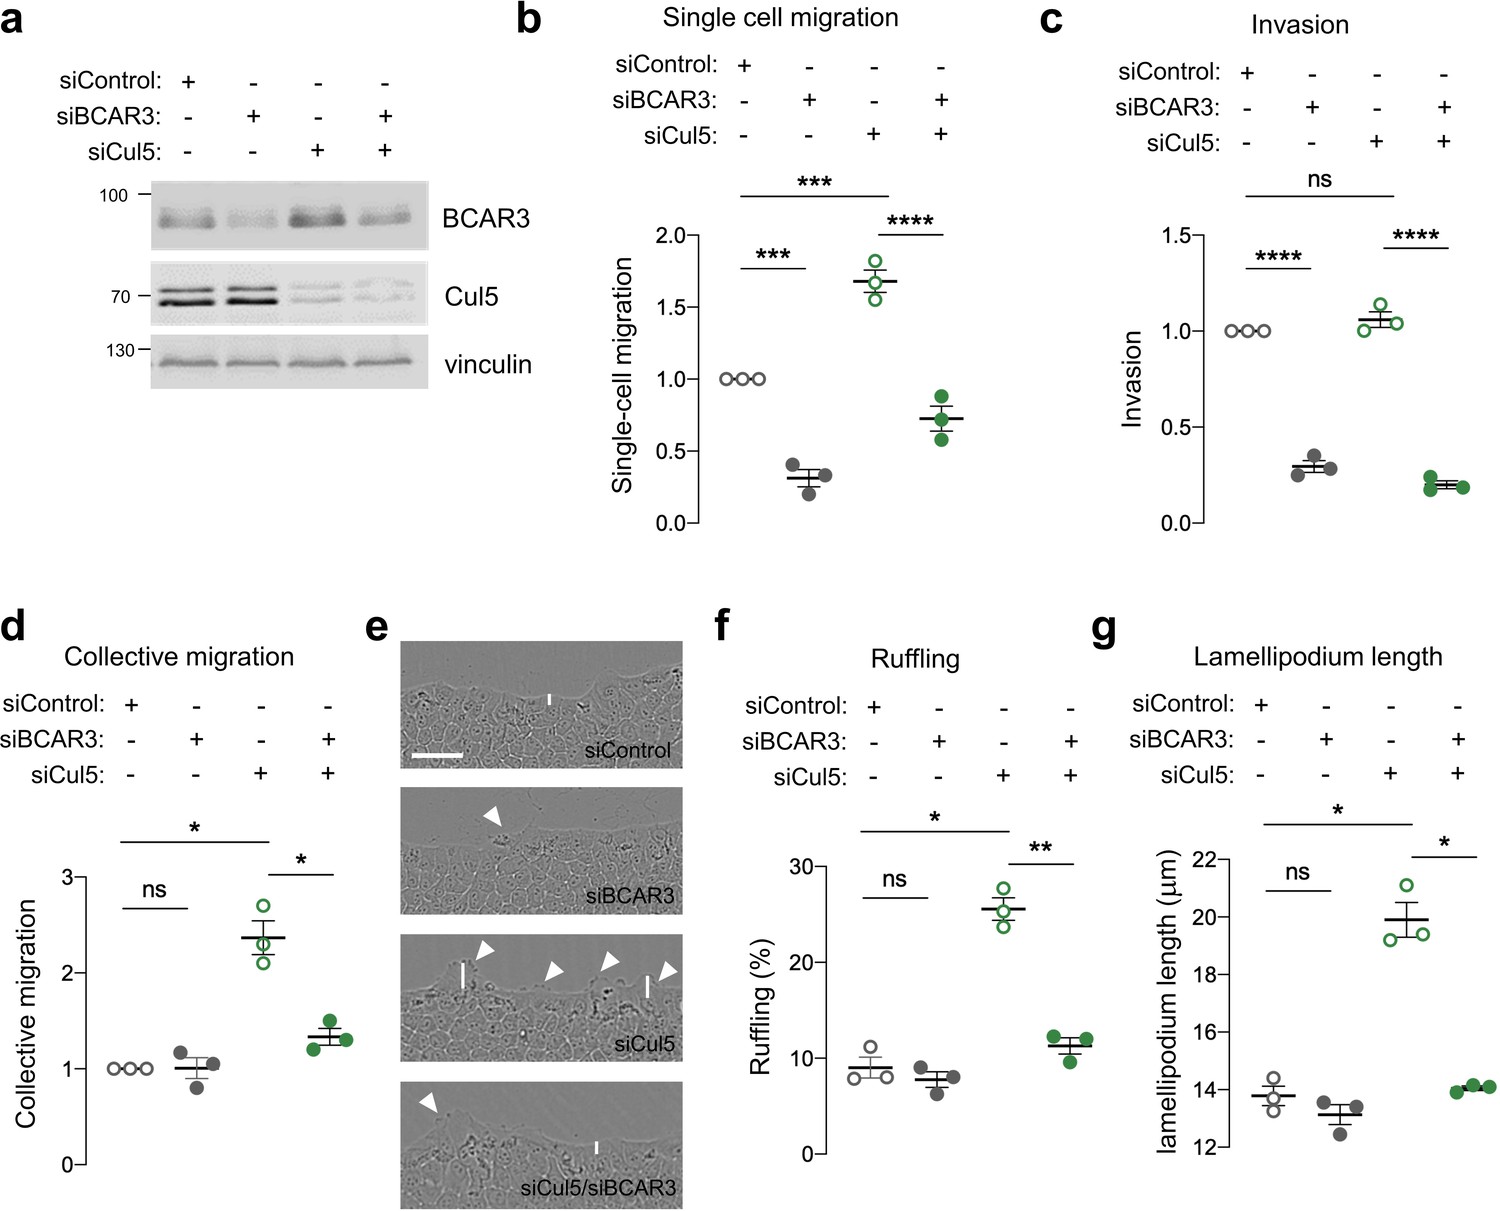
BCAR3 regulates epithelial cell migration.
MCF10A cells were transfected with control, BCAR3, or Cul5 siRNA. (a) Representative immunoblot showing BCAR3, Cul5, and vinculin protein levels. (b) Single cell migration using Boyden chamber assay. Mean ± SEM; n=3 biological replicates, each with five technical replicates. ***p<0.0005 and ****p<0.0001 (One-way ANOVA). (c) Invasion using Boyden chamber containing Matrigel. Mean ± SEM; n=3 biological replicates, each with five technical replicates. ****p<0.0001 (One-way ANOVA). (d–g) Collective migration. Confluent monolayers were placed in assay media and wounded. (d) Relative migration after 12 hr. Mean ± SEM; n=3 biological replicates each with 8–12 technical replicates. *p<0.05 (One-way ANOVA). (e) Representative images of scratch wounds after 6 hr of migration. Arrows indicate cells with membrane ruffles and lines indicate lamellipodia length measurements. Scale bar: 100 μm. (f) Percentage of ruffling cells. Mean ± SEM of >250 cells per condition from n=3 biological replicates. *p<0.05 and **p<0.005 (One-way ANOVA). (g) Lamellipodia length. Mean ± SEM of 50 cells per condition from n=3 biological replicates. *p<0.05 (One-way ANOVA).
Figure 2—figure supplement 1
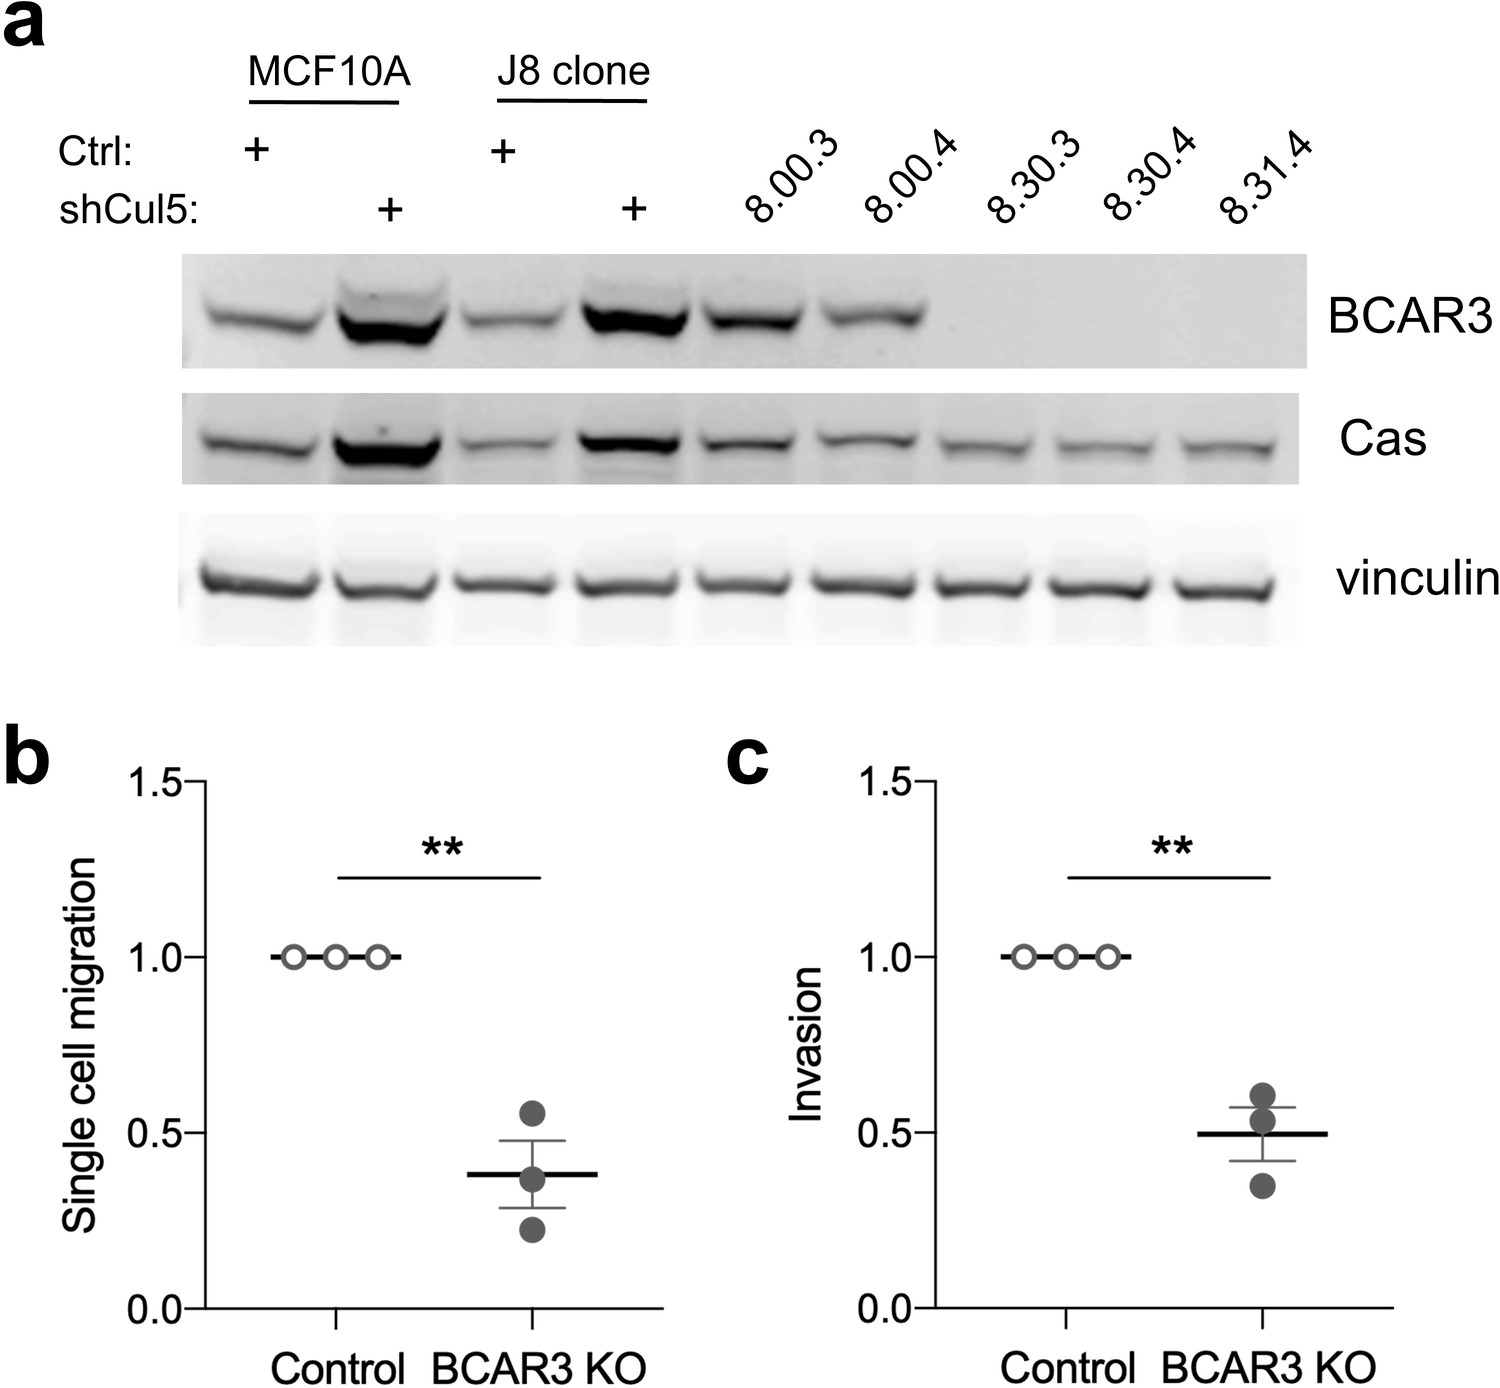
BCAR3 gene deletion inhibits single-cell migration and invasion.
(a) MCF10A subclone J8, selected for its epithelial morphology, was infected with an all-in-one CRISPR plasmid lacking or containing guide RNA against BCAR3 (guide 30 or 31). Potential knockouts were isolated through single cell expansion. Levels of BCAR3 and Cas in control clonal cell lines, 8.00.3 and 8.00.4, were similar to those in J8 or uncloned MCF10A cells. BCAR3-/- (KO) cell lines, 8.30.3, 8.30.4, and 8.31.4, express Cas but not BCAR3. These clones were confirmed by PCR and sequencing (Materials and methods). (b) Single-cell migration using a Boyden chamber assay. Mean ± SEM; n=3. **p<0.005 (unpaired t-test). (c) Invasion through Matrigel. Mean ± SEM; n=3. **p<0.005 (unpaired t-test).
Figure 3
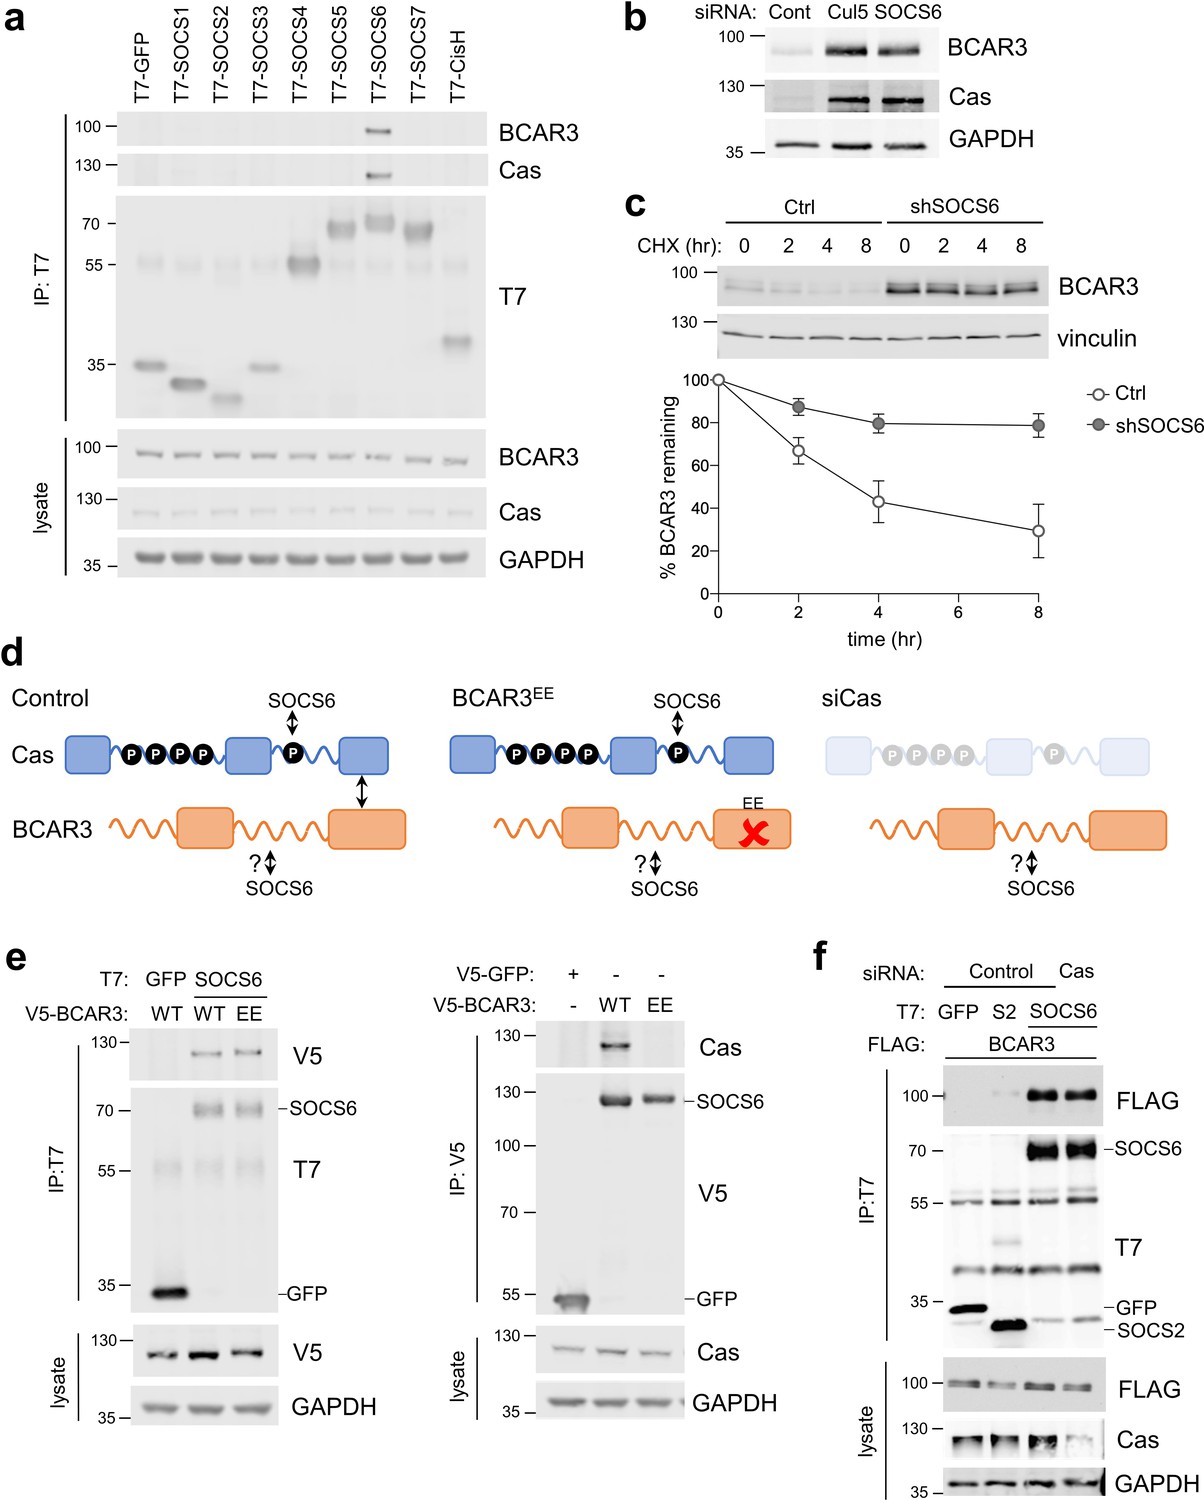
SOCS6 regulates BCAR3 stability independently from Cas.
(a) SOCS6 binds BCAR3 and Cas. HeLa cells were transfected with T7-tagged GFP or SOCS proteins and treated with pervanadate for 30 min before lysis. Lysates were immunoprecipitated with T7 antibody and immunoprecipitates and lysates were immunoblotted with antibodies to BCAR3, Cas and T7. (b) SOCS6 regulates BCAR3 protein level. MCF10A cells were transfected with control, Cul5, or SOCS6 siRNA and analyzed by immunoblotting. (c) BCAR3 degradation. MCF10A control and SOCS6-deficient cells were treated with cycloheximide (CHX) for various times. Representative immunoblot and quantification. Mean ± SEM; n=3 biological replicates. (d) Strategy for testing whether SOCS6 binding to BCAR3 requires Cas. (e) BCAR3 LxxE/RxxE mutation inhibits binding to Cas but not SOCS6. Left panel: HeLa cells were transfected with control vector or T7-SOCS6 and SNAP-V5-BCAR3WT or SNAP-V5-BCAR3EE. Right panel: HeLa cells were transfected with control vector, SNAP-V5-BCAR3WT or SNAP-V5-BCAR3EE. Lysis, immunoprecipitation and immunoblot as in (a). (f) SOCS6 binds BCAR3 in Cas-deficient cells. HeLa cells were treated with control or Cas siRNA and transfected with T7-SOCS6 and 3xFLAG-BCAR3. Lysis, immunoprecipitation and immunoblot as in (a).
Figure 4
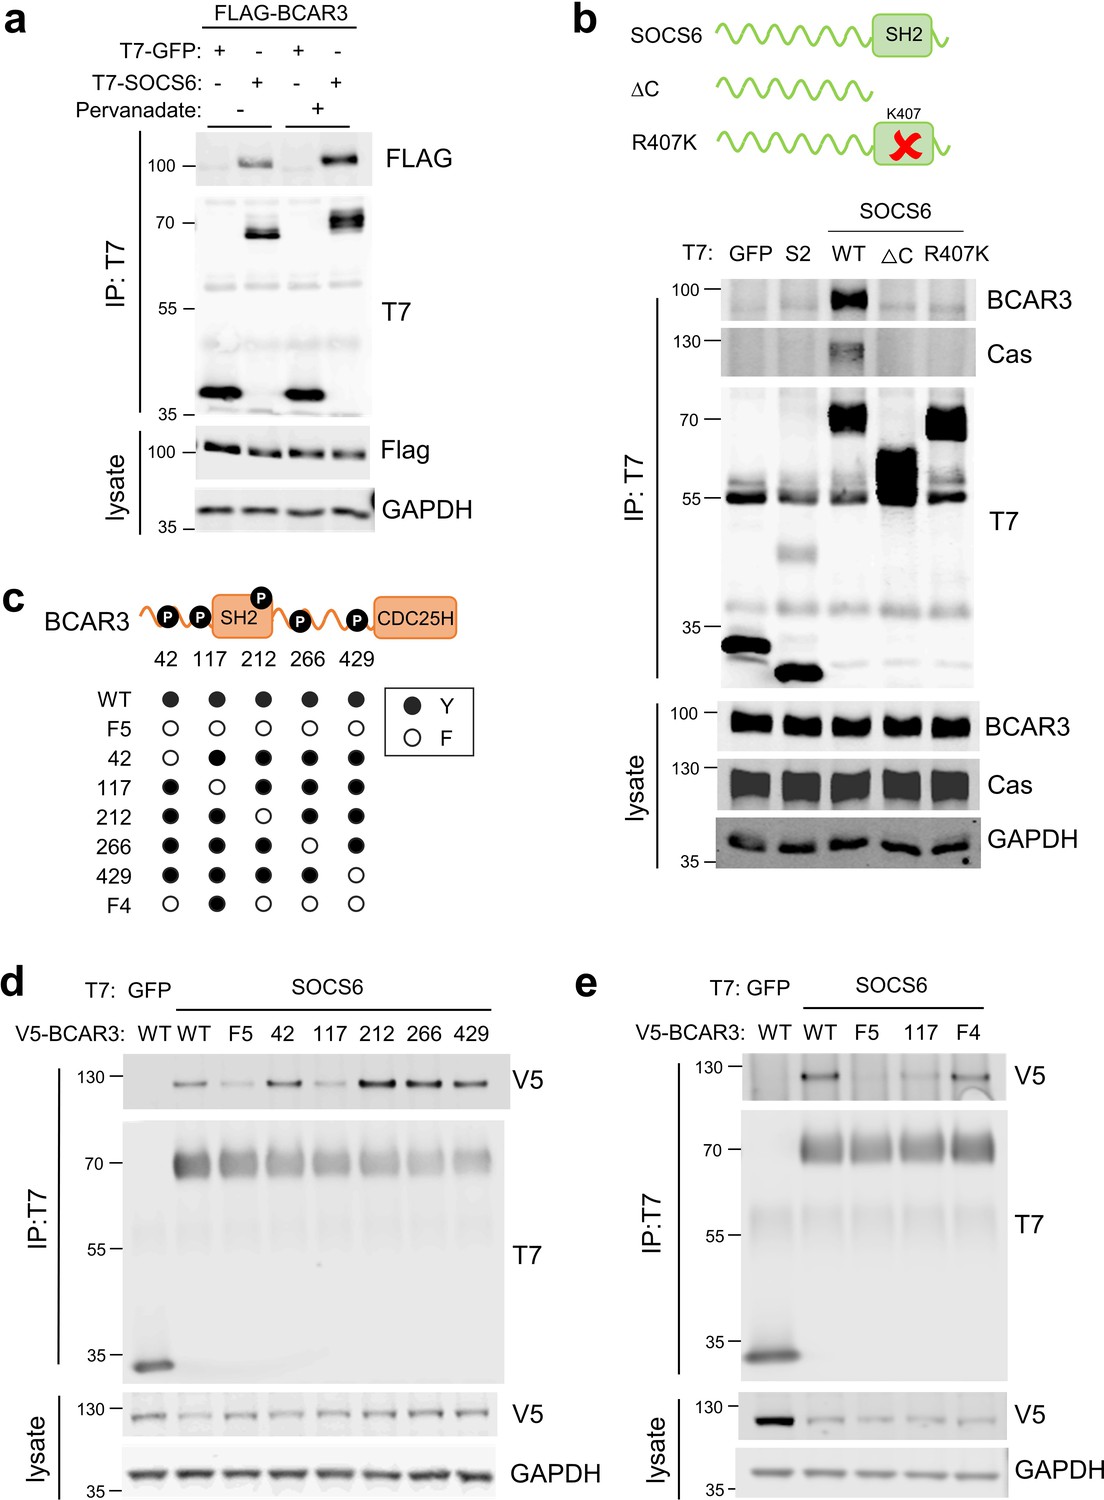
SOCS6 binds BCAR3 pY117.
(a) Phosphatase inhibition increases SOCS6-BCAR3 binding. HeLa cells were transfected with T7-GFP or T7-SOCS6 and 3xFLAG-BCAR3 and treated with pervanadate or vehicle. Lysates were immunoprecipitated with T7 antibody and immunoprecipitates and lysates were immunoblotted with T7 and FLAG antibodies. (b) SOCS6-BCAR3 binding requires the SOCS6 SH2 domain. Cells were transfected with control vector and T7-tagged SOCS constructs, treated with pervanadate and lysed. Immunoprecipitation and immunoblotting as in (a). (c) BCAR3WT and phenylalanine (F) mutants. Residues Y42, Y117, Y212, Y266, and Y429 phosphorylation sites have been detected across a range of cell lines (http://www.PhosphoSite.org). (d, e) BCAR3 Y117 is necessary and sufficient for SOCS6 binding. HeLa cells were transfected with T7-GFP or T7-SOCS6 and SNAP-V5-BCAR3WT or YF mutants. Transfected cells were treated with pervanadate and lysed. Immunoprecipitation and immunoblotting as in (a).
Figure 5 with 1 supplement
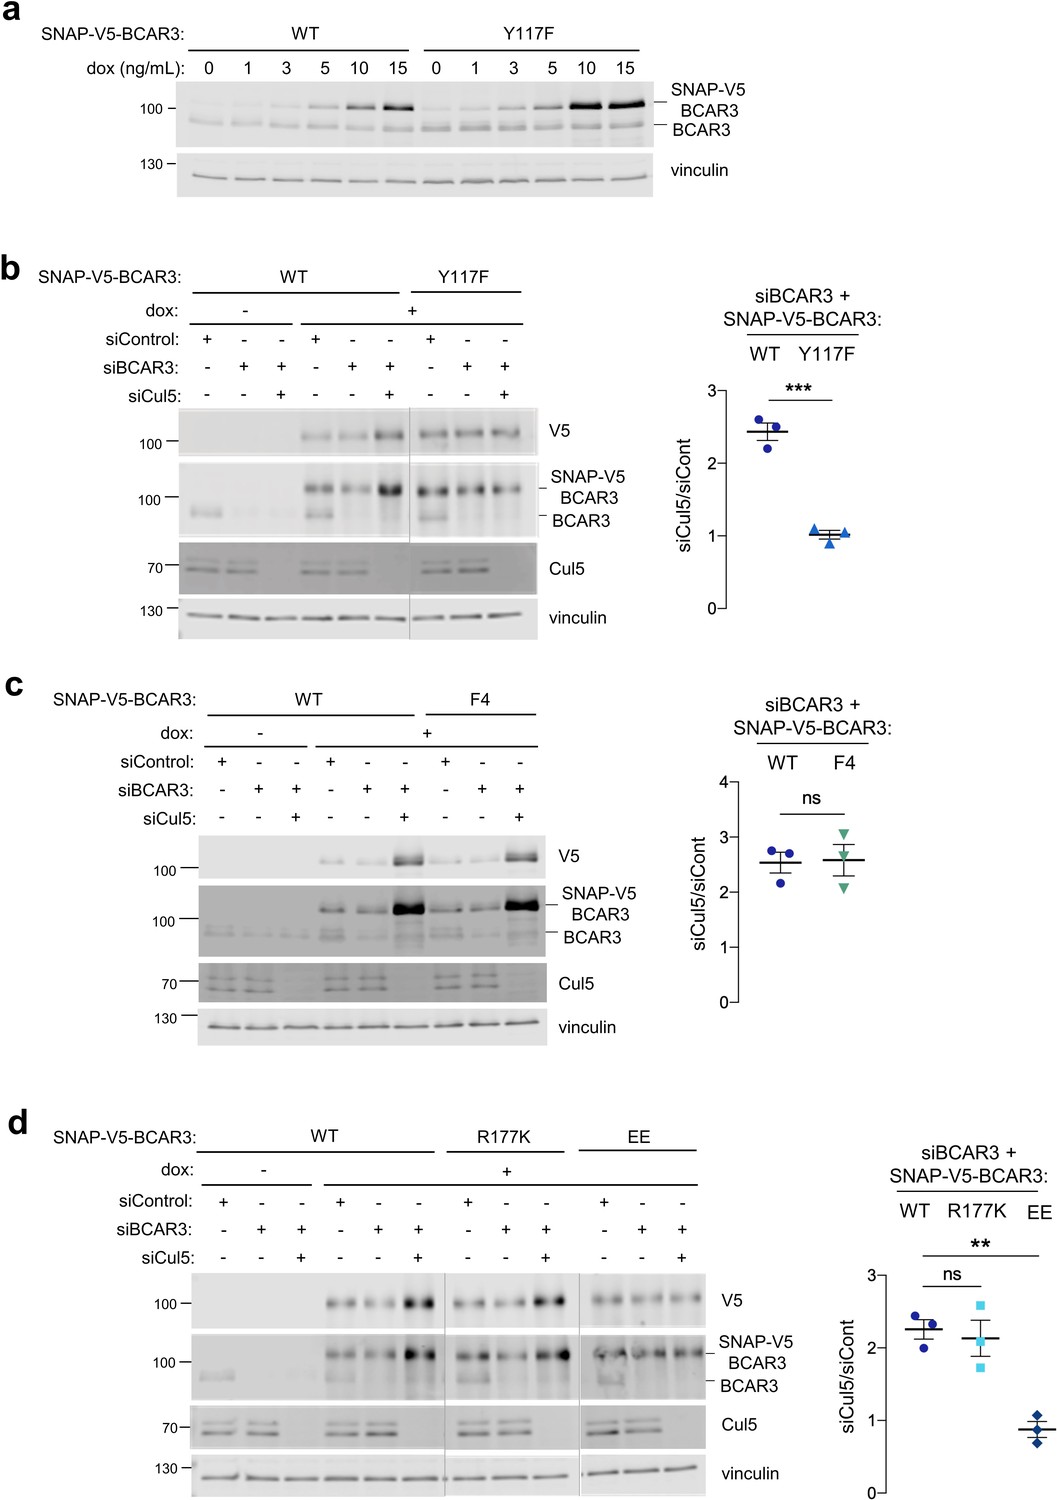
Cul5 requires Y117 and Cas association to regulate BCAR3 protein level.
(a) Y117F mutation increases BCAR3 protein level. SNAP-V5-BCAR3WT and Y117F MCF10A cells were induced with various dox concentrations (ng/mL). Lysates were immunoblotted with BCAR3 antibody to detect endogenous and induced SNAP-V5-BCAR3. (b) Cul5 regulates BCAR3 protein level through Y117. Representative immunoblot and quantification of BCAR3 protein in siRNA-treated, dox-induced SNAP-V5-BCAR3WT and Y117F cells. Mean ± SEM; n=3 biological replicates. ***p<0.001 by t-test. (c) Cul5 does not regulate SNAP-V5-BCAR3 F4. Mean ± SEM; n=3. ns, not significant. (d) Cul5 regulates SNAP-V5-BCAR3R177K but not EE. Mean ± SEM; n=3. **p<0.005 by t-test. Vertical lines indicate different immunoblots, each run with its own wild-type control.
Figure 5—figure supplement 1
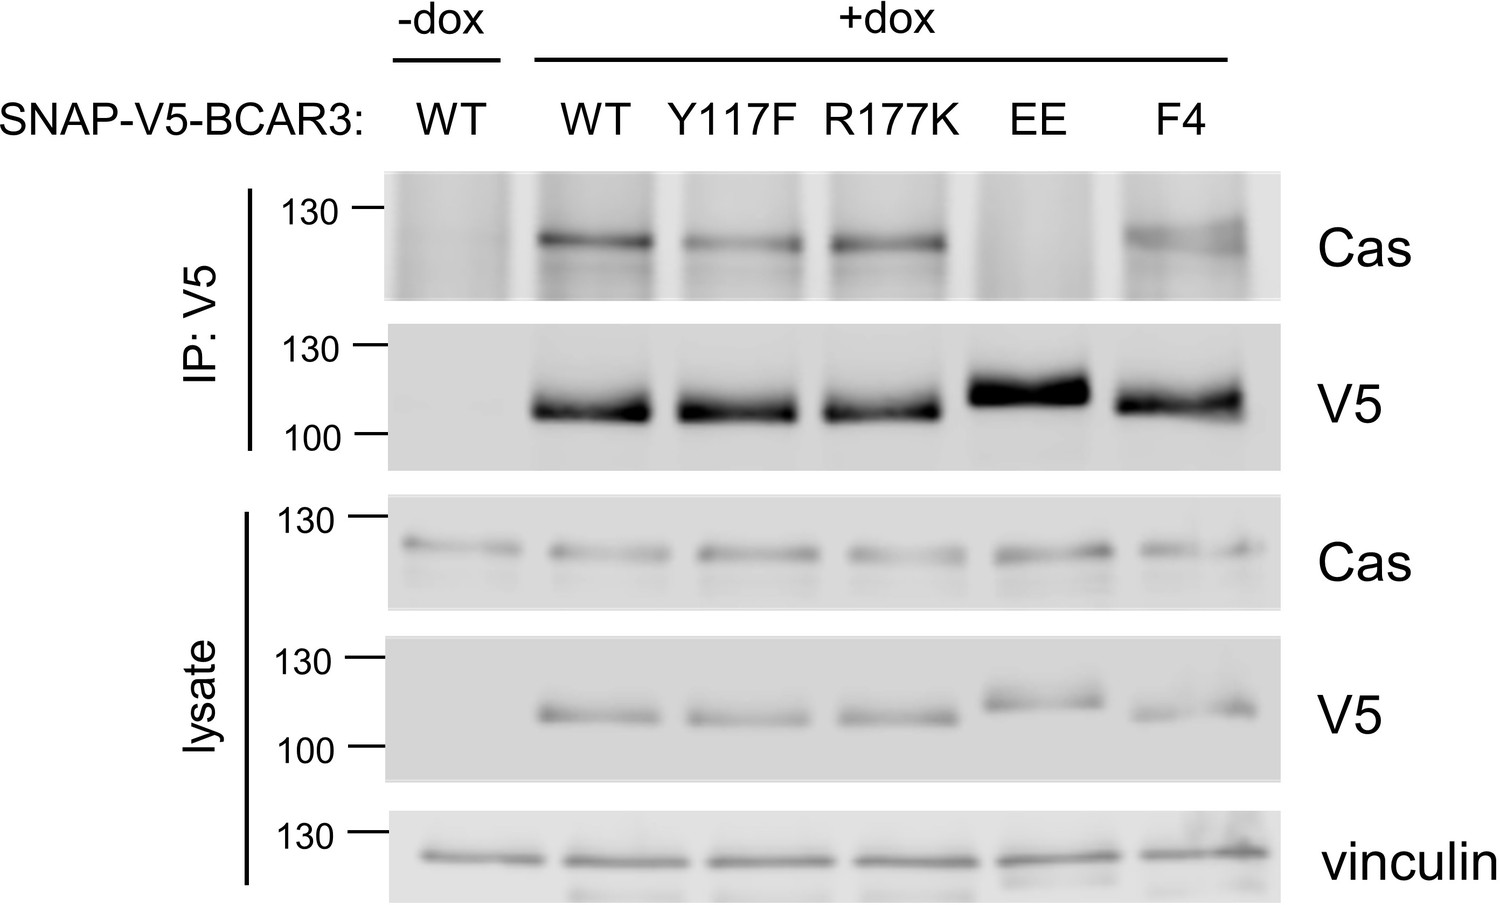
Cas binding to BCAR3 mutants.
SNAP-V5-BCAR3WT and mutants were induced in MCF10A cells with 10 ng/mL dox for 48 hr. Lysates were immunoprecipitated with V5 antibody and lysates and immunoprecipitates immunoblotted with Cas and V5 antibodies.
Figure 6
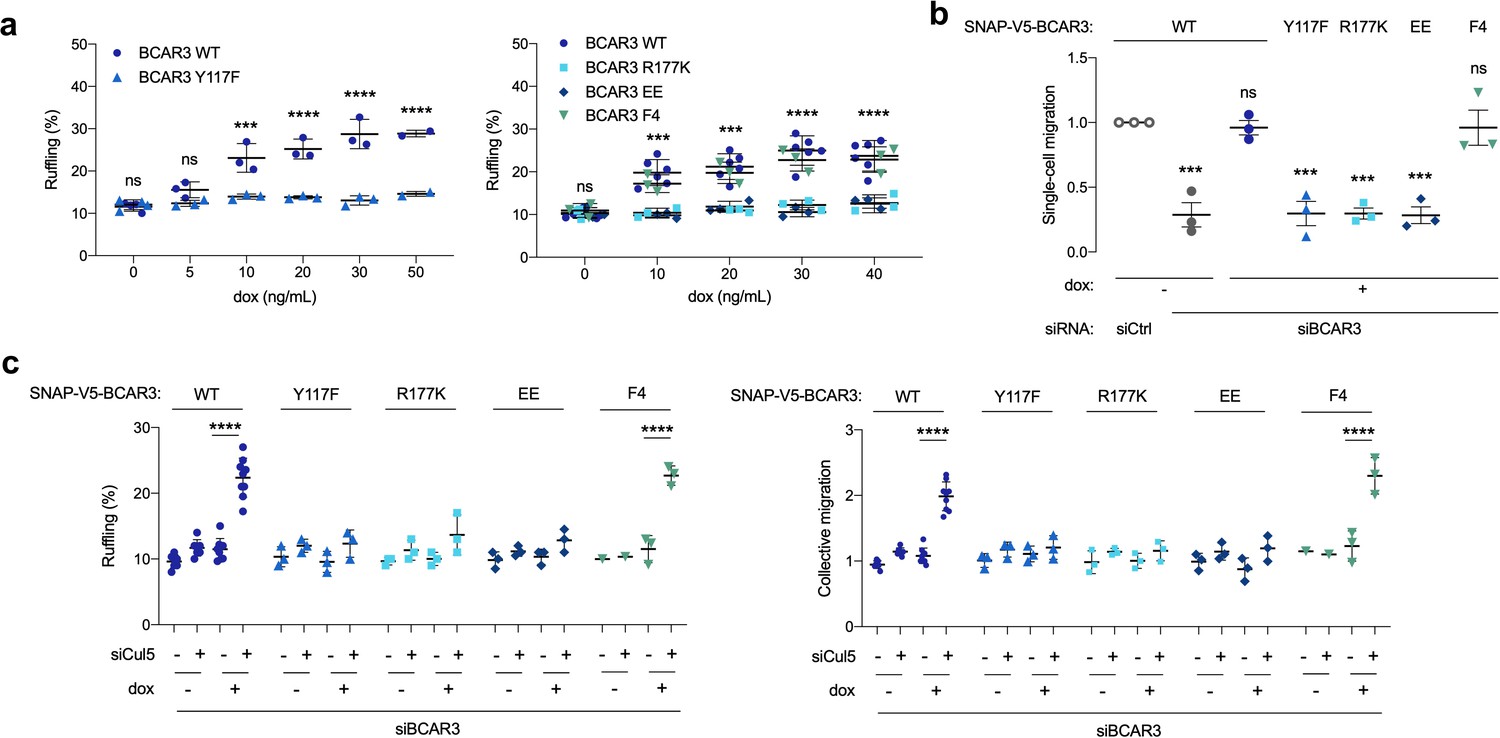
BCAR3 Y117, R177 and Cas binding regulate cell migration.
(a) Over-expression induced ruffling. MCF10A cells transduced with wildtype or mutant SNAP-V5-BCAR3 viruses were induced with various dox concentrations (ng/mL). Confluent monolayers were starved for EGF and wounded. The percentage of ruffling cells was calculated after 6 hr. Mean ± SEM; n=3–6. ***p=0.0001 and ****p<0.0001 (One-way ANOVA). (b) Rescue of single-cell migration. Cells were treated with control or BCAR3 siRNA and expression of wildtype or mutant SNAP-V5-BCAR3 induced with 10 ng/mL dox. Boyden chamber assay. Mean ± SEM; n=3 biological replicates, each with five technical replicates. ***p<0.0005 (One-way ANOVA). (c) Rescue of Cul5-regulated ruffling and collective cell migration. Cells were treated with BCAR3 siRNA and control or Cul5 siRNA and expression of wildtype or mutant SNAP-V5-BCAR3 induced with 10 ng/mL dox. Scratch wound assay. (Left) Percentage of ruffling cells. Mean ± SEM of >250 cells per condition from n=3–6 experiments. ****p<0.0001 (One-way ANOVA). (Right) Relative migration. Mean ± SEM; n=3–6 biological replicates, each with 8–12 technical replicates. ****p<0.0001 (One-way ANOVA).
Figure 7
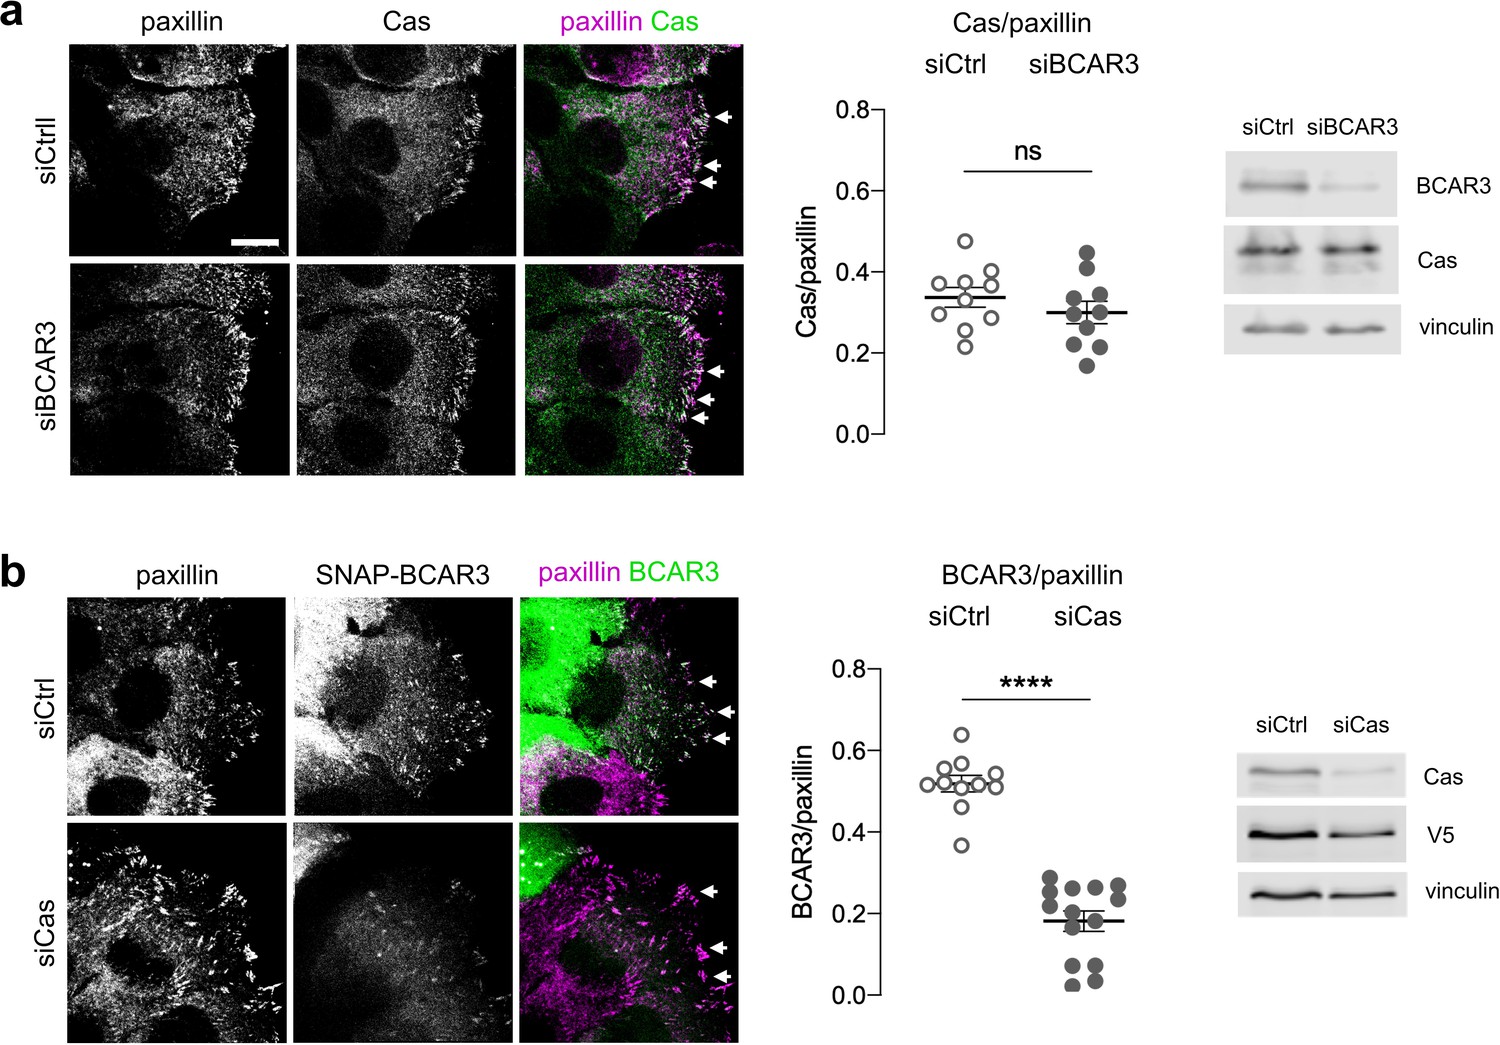
Cas recruits BCAR3 to adhesions.
(a) Cas localization does not require BCAR3. MCF10A cells were treated with control or BCAR3 siRNA. Scratch wounds were stained for Cas and paxillin. (Left) Maximum intensity projection images. Arrowheads: adhesion sites at the leading edge. Scale bar: 10 µm. (Center) Mean fluorescence intensity of Cas relative to paxillin in adhesion sites at the leading edge. Mean ± SEM; n=10 cells from two biologically independent experiments. ns, not significant. (Right) Immunoblot. (b) BCAR3 localization requires Cas. SNAP-V5-BCAR3WT MCF10A cells were treated with control or Cas siRNA and induced with 10 ng/mL dox. Scratch wounds were stained for SNAP and paxillin. (Left) Maximum intensity projection images. (Center) Mean fluorescence intensity of SNAP-BCAR3 relative to paxillin in adhesion sites at the leading edge. Mean ± SEM; n=11–14 cells from two biologically independent experiments. ****p<0.0001 by unpaired t-test. (Right) Immunoblot.
Figure 8 with 3 supplements
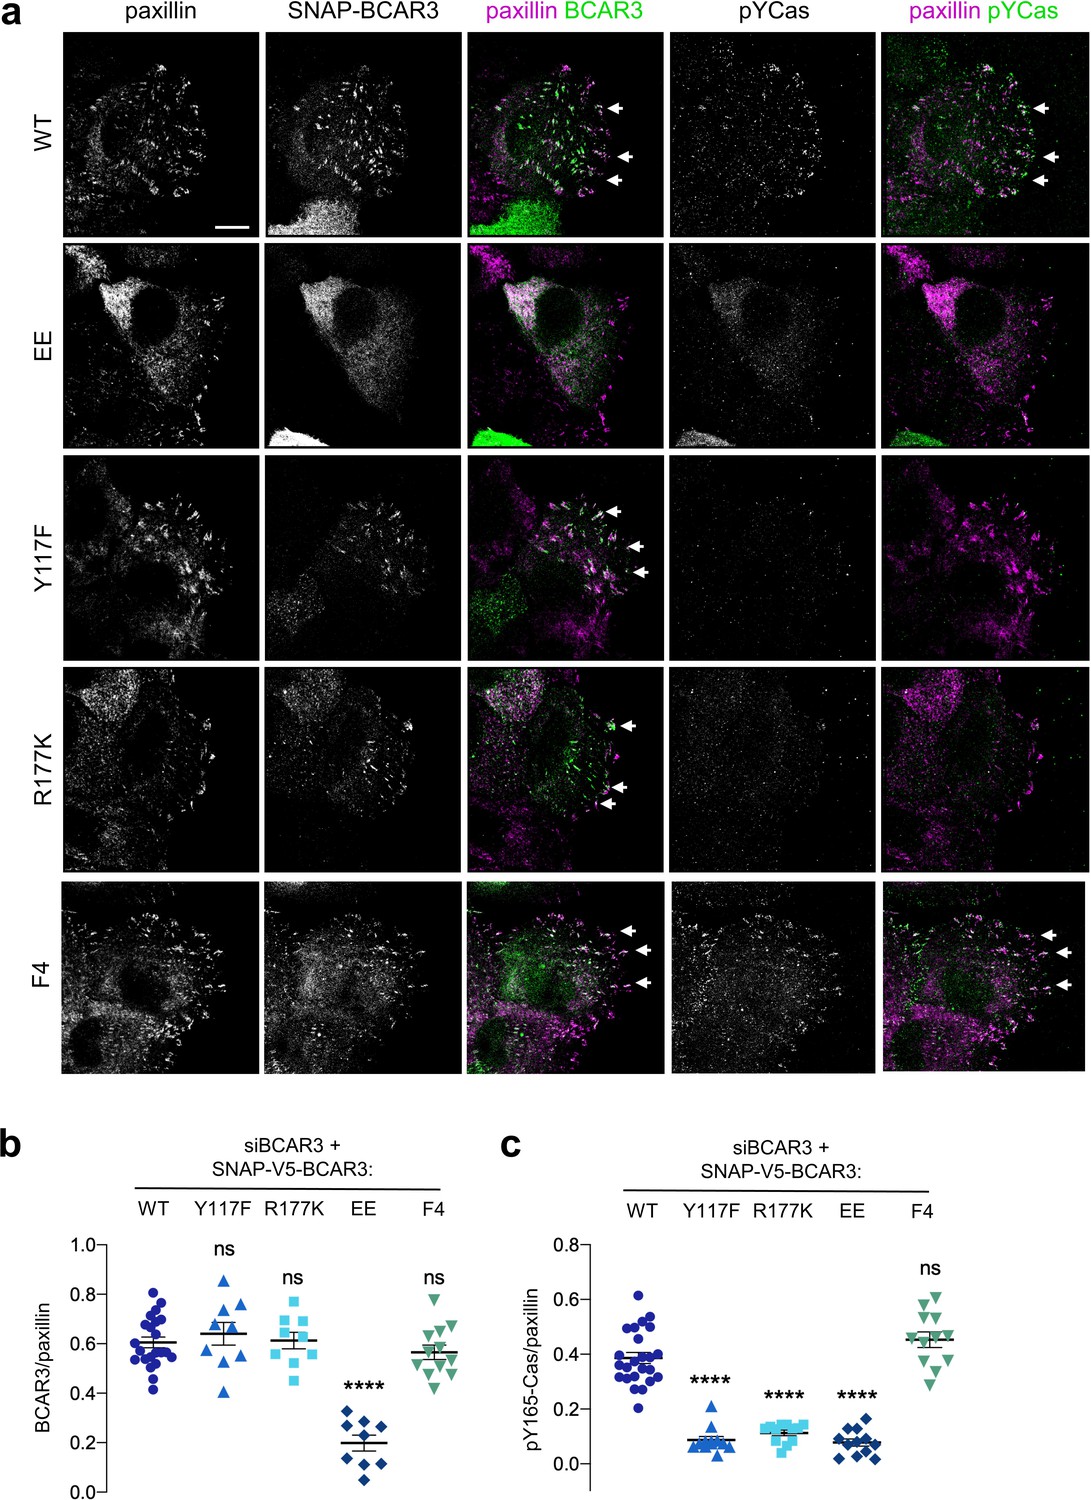
BCAR3 stimulates Cas phosphorylation in adhesions, dependent on BCAR3 Y117 and SH2 interactions.
(a) Wildtype or mutant SNAP-V5-BCAR3 MCF10A cells were treated with control or BCAR3 siRNA and induced with 10 ng/mL dox. Scratch wound were stained for SNAP, pY165-Cas and paxillin. Maximum intensity projection. Scale bar = 10 µm. (b) Mean fluorescence intensity of SNAP-V5-BCAR3 relative to paxillin in adhesion sites at the leading edge. Mean ± SEM. ****p<0.0001 (One-way ANOVA). (c) Mean fluorescence intensity of pY165-Cas relative to paxillin in adhesion sites at the leading edge. Mean ± SEM. ****p<0.0001 (One-way ANOVA).
Figure 8—figure supplement 1
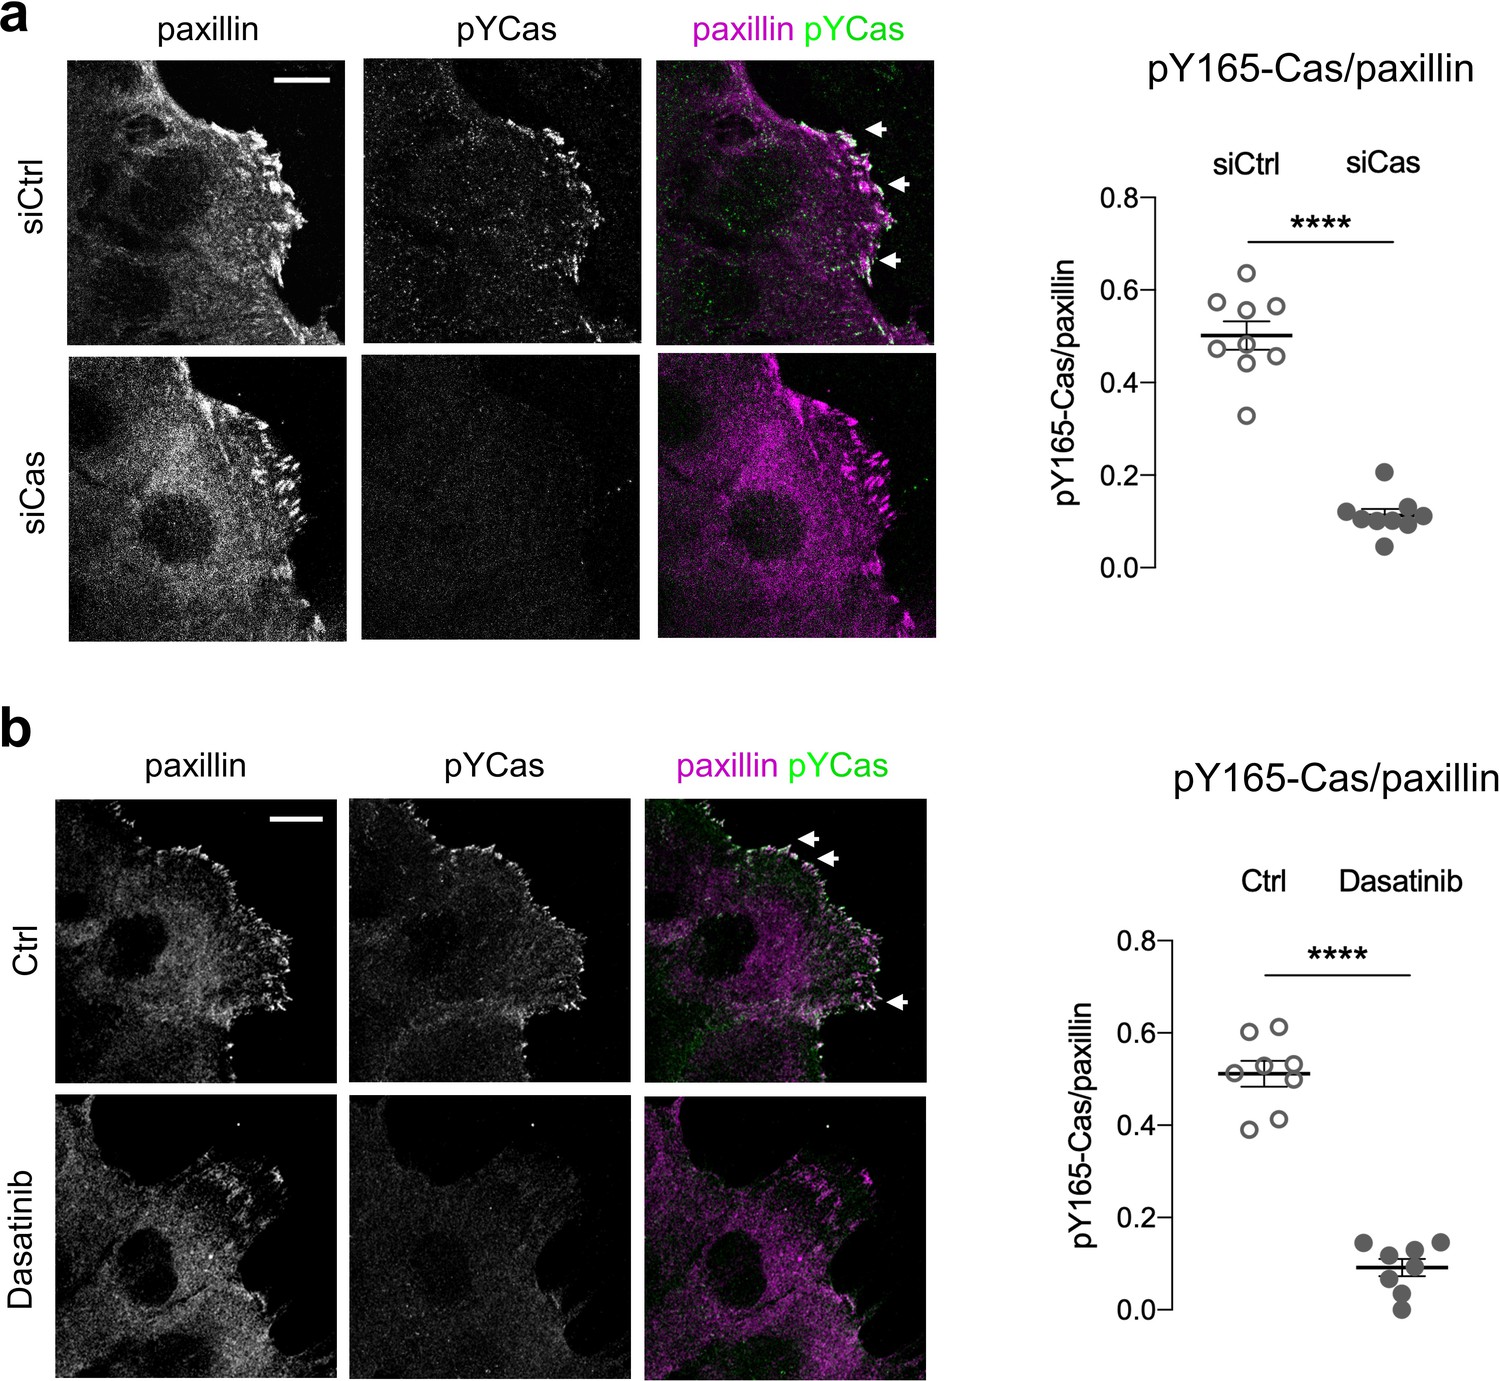
The pY165-Cas antibody is specific for pYCas.
MCF10A scratch wounds were stained for pY165-Cas and paxillin. (a) Cas siRNA inhibits pY165-Cas immunofluorescence. (b) Dasatinib inhibits pY-165-Cas immunofluorescence. (Left) Maximum intensity projection images. Scale bar = 10 µm. (Right) Mean fluorescence intensity of pY165-Cas relative to paxillin in adhesion sites at the leading edge. Mean ± SEM; n=8–9 cells from one experiment. ****p<0.0001 unpaired t-test.
Figure 8—figure supplement 2
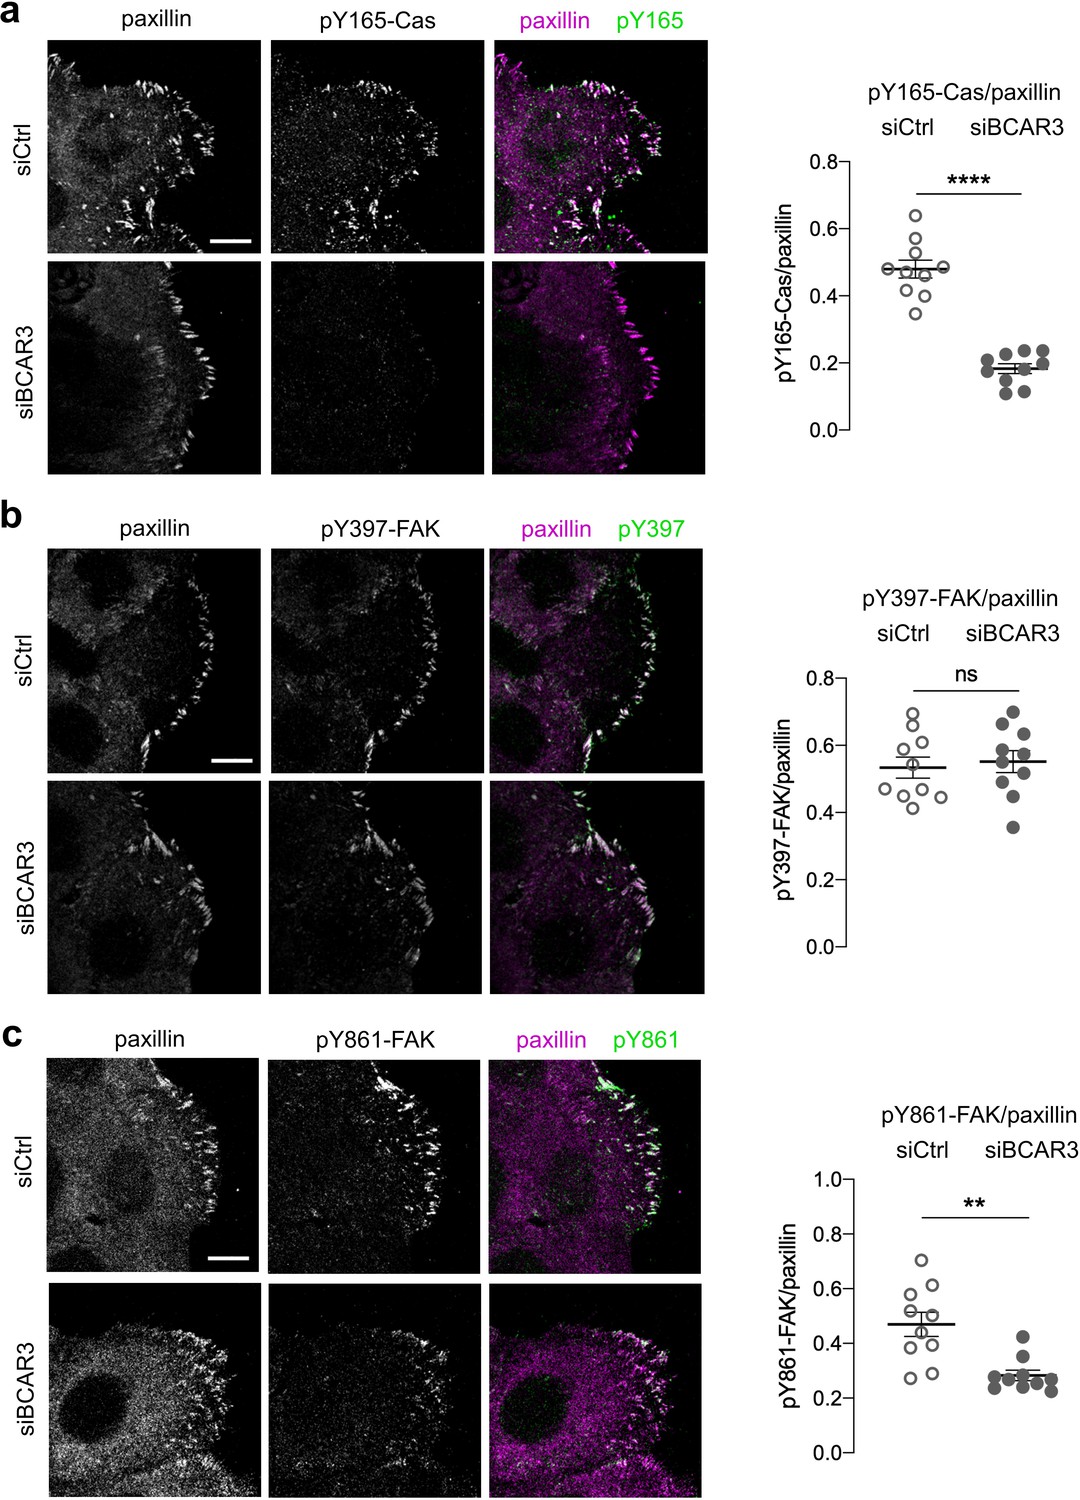
BCAR3 is required for pY165-Cas and pY861-FAK, but not pY397-FAK.
Control or BCAR3-depleted MCF10A scratch wounds were stained for paxillin and (a) pY165-Cas, (b) pY397-FAK or (c) pY861-FAK. (Left) Maximum intensity projection images. Scale bar = 10 µm. (Right) Mean fluorescence intensity of (a) pY165-Cas, (b) pY397-FAK or (c) pY861-FAK relative to paxillin in adhesion sites at the leading edge. Mean ± SEM; n=10 cells from one experiment. **p<0.01, ****p<0.0001 and p>0.05 by unpaired t-test.
Figure 8—figure supplement 3
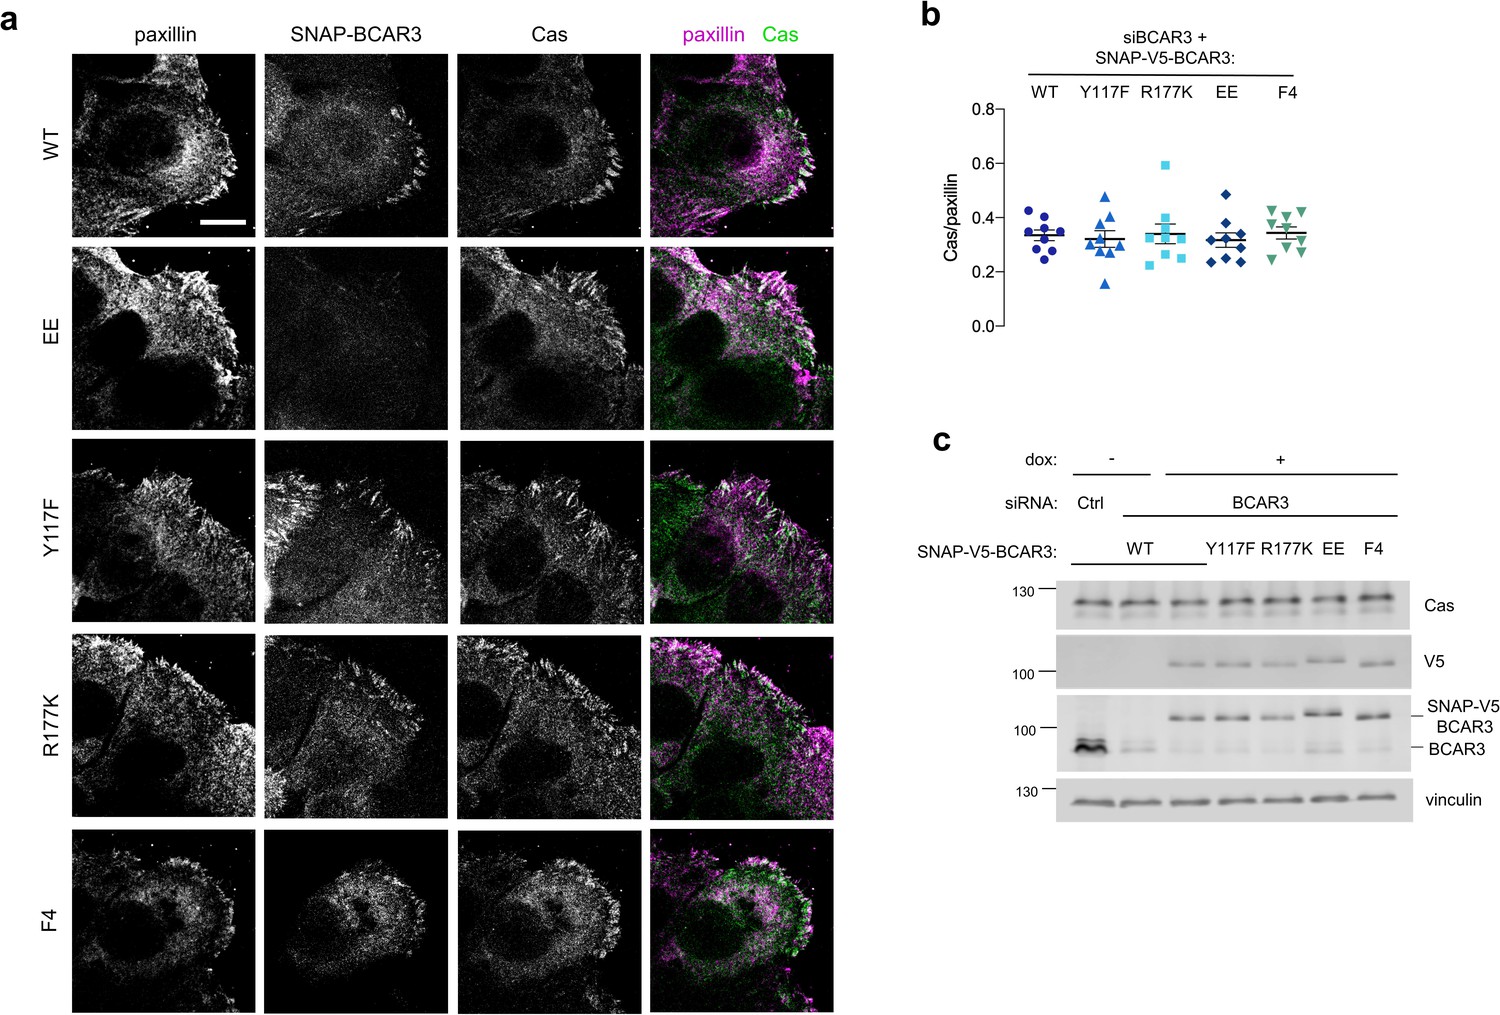
Cas levels are not altered when BCAR3WT and mutants are expressed.
(a) Wildtype or mutant SNAP-V5-BCAR3 MCF10A cell scratch wounds were stained for Cas and paxillin. Maximum intensity projection. Scale bar = 10 μm. (b) Mean fluorescence intensity of Cas relative to paxillin in adhesion sites at the leading edge. Mean ± SEM. P>0.05 (One-way ANOVA). (c) Immunoblot of Cas and BCAR3 in siRNA-treated, dox-induced SNAP-V5-BCAR3WT and mutant cells.
Figure 9
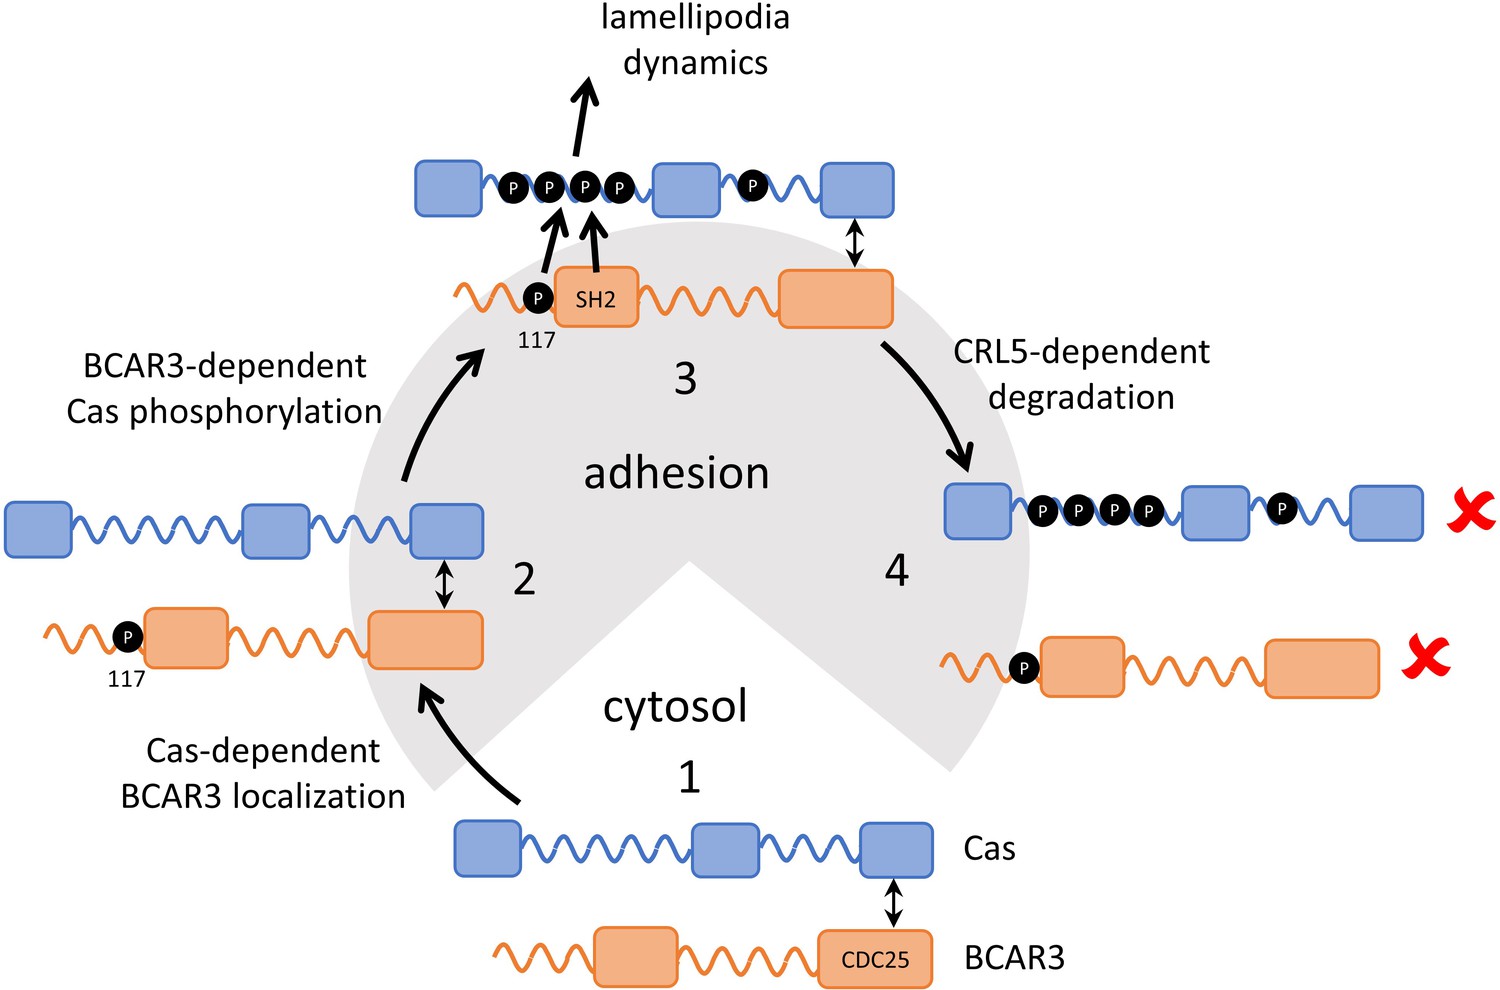
Model showing inter-dependence of Cas and BCAR3 for localization and activation.
Step 1: A pre-formed BCAR3-Cas complex translocates to integrin adhesions through localization signals in the N and C terminal domains of Cas. Step 2: BCAR3, phosphorylated at Y117 by an unknown kinase, stimulates Cas phosphorylation in a process that also requires the SH2 domain, leading to activation of signaling pathways that stimulate lamellipodial protrusion and ruffling. Step 3: Signaling is terminated by the CRL5SOCS6-dependent ubiquitination and degradation of BCAR3 and Cas, phosphorylated in their respective phosphodegrons. Remaining questions include the identity of the kinase that phosphorylates BCAR3 Y117, the timing of Y117 phosphorylation, and the mechanism by which BCAR3 pY117 and SH2 domain stimulate Cas phosphorylation.
Tables
Table 1
Phosphotyrosine peptides increased in Cul5-deficient cells.
Protein names, tyrosine positions, Uniprot accession numbers, peptide sequences, and quantification of phosphotyrosine peptides that were significantly increased in two independent experiments, each performed in triplicate, comparing Cul5-deficient and control MCF10A cells. In Experiment 1, the triplicate samples were obtained from cells starved for EGF for 0, 24, or 72 hr. In Experiment 2, the triplicate samples were all from unstarved cells. a Ratio shCul5/Ctrl. b p value, t-test (two-tailed, paired); n=3.
| Protein | Position | Uniprot | Sequence | Experiment 1 | Experiment 2 | ||
|---|---|---|---|---|---|---|---|
| Folda | pb | Folda | pb | ||||
| KRT6A | Y62 | Q92625 | sLyGLGGSk | 3.21 | 0.012 | 1.85 | 0.011 |
| ABL1 | Y393 | P00519 | lMTGDTyTAHAGAk | 2.90 | 0.010 | 1.77 | 0.001 |
| ANKS1A | Y455 | Q92625 | eEDEHPyELLLTAETk | 2.58 | 0.004 | 1.41 | 0.009 |
| ARHGAP35 | Y1105 | Q9NRY4 | nEEENIYsVPHDSTQGk | 2.49 | 0.008 | 1.67 | 0.005 |
| RIN1 | Y36 | Q13671 | ekPAQDPLyDVPNASGGQAGGPQRPGR | 2.02 | 0.018 | 1.45 | 0.018 |
| BCAR3 | Y117 | O75815 | dPHLLDPTVEyVk | 1.96 | 0.011 | 1.34 | 0.049 |
| MPZL1 | Y263 | O95297 | sESVVyADIR | 1.90 | 0.026 | 1.54 | 0.027 |
| BCAR3 | Y266 | O75815 | cLEEHyGTSPGQAR | 1.81 | 0.000 | 1.50 | 0.012 |
| BCAR1 | Y128 | P56945 | aQQGLyQVPGPSPQFQSPPAk | 1.80 | 0.003 | 1.28 | 0.036 |
| SGK223 | Y413 | Q86YV5 | eATQPEPIyAESTk | 1.74 | 0.024 | 1.26 | 0.032 |
| ENO1 | Y44 | P06733 | aAVPSGASTGIyEALELR | 1.64 | 0.004 | 1.18 | 0.032 |
| ITGB4 | Y1207 | P16144 | vcAYGAQGEGPySSLVScR | 1.59 | 0.010 | 1.19 | 0.043 |
| ANXA2 | Y30 | A6NMY6 | ayTNFDAER | 1.58 | 0.018 | 1.31 | 0.014 |
| IGF1R | Y1165 | P08069 | dIYETDyYR | 1.53 | 0.030 | 1.69 | 0.001 |
| PTPRA | Y798 | P18433 | vVQEYIDAFSDyANFk | 1.50 | 0.006 | 1.23 | 0.019 |
| TLN1 | Y26 | Q9Y480 | tMQFEPSTMVyDAcR | 1.22 | 0.022 | 1.25 | 0.014 |
Table 2
Sequence alignment of SOCS6-binding sites.
| Protein | Residue | Sequence* | Evidence (reference) | ||
|---|---|---|---|---|---|
| peptide† | mutant‡ | biology§ | |||
| Kit | pY568 | gnnYVYIdptq | (1,2) | (1) | |
| PDGFR | pY579 | gheYIYVdpmq | (2) | ||
| Flt3 | pY591 | eyfYVdFreye | (3) | (3) | (3) |
| Flt3 | pY919 | eeiYIiMqscw | (3) | (3) | (3) |
| Cas | pY664 | medYdYVhlqg | (4) | (4) | |
| Dab1 | pY198 | dpvYqYIvfea | (5) | (5-6) | |
| BCAR3 | pY117 | tveYVkFsker | (7) | (7) | |
| Spot array¶ | xxxYVYIxxxx xxxYIFFxxxx xxxYMWMxxxx xxxYWVVxxxx | (8) | |||
-
* Local sequence aligned to phosphotyrosine (Y). Capital letters indicate residues at +1 to +3 positions that fit the consensus from the spot array.
† Phosphopeptide binds to SH2 domain in vitro.
-
‡ Decreased binding of Y to F mutant protein in cells.
§ Y to F mutant is stabilized or gains function in cells.
-
¶ A library of phosphopeptides randomized at positions +one to +three was selected by binding to the SOCS6 SH2 domain. Bound peptides were sequenced. Residues selected at each position are shown in decreasing order of preference. References: (1) (Bayle et al., 2004) (2) (Zadjali et al., 2011) (3) (Kazi et al., 2012) (4) (Teckchandani et al., 2014) (5) (Feng and Cooper, 2009) (6) (Simó and Cooper, 2013) (7) this work, (8) (Krebs et al., 2002).
Additional files
-
Source data 1
Source data for cropped images of gel blots.
Except where noted, blots were probed with anti-rabbit 800 and anti-mouse 700 and scanned on a Odyssey Infrared Imaging System. Individual files include lane designation and a brief explanation of antibodies used. Rb, rabbit. Ms, mouse.
- https://cdn.elifesciences.org/articles/67078/elife-67078-data1-v2.zip
-
Supplementary file 1
Quantification of phosphotyrosine peptides in control and Cul5-deficient MCF10A cells.
Phosphopeptides whose abundance significantly differed between control and Cul5-deficient MCF10A cells in two separate experiments. Sheet 1: Experimental conditions, numbers of phosphopeptides quantified, and number of significant changes. Sheet 2: Phosphopeptides that increased significantly in Experiment 1. Sheet 3: Phosphopeptides that increased significantly in Experiment 2. Sheet 4: Phosphopeptides that increased significantly in both Experiments (see also Table 1).Source data (.raw files and Excel files with ratios and statistics) are available at https://doi.org/10.5061/dryad.tmpg4f4zn
- https://cdn.elifesciences.org/articles/67078/elife-67078-supp1-v2.xlsx
-
Transparent reporting form
- https://cdn.elifesciences.org/articles/67078/elife-67078-transrepform-v2.docx
Download links
A two-part list of links to download the article, or parts of the article, in various formats.
Downloads (link to download the article as PDF)
Open citations (links to open the citations from this article in various online reference manager services)
Cite this article (links to download the citations from this article in formats compatible with various reference manager tools)
A Cas-BCAR3 co-regulatory circuit controls lamellipodia dynamics
eLife 10:e67078.
https://doi.org/10.7554/eLife.67078


