Human immunocompetent Organ-on-Chip platforms allow safety profiling of tumor-targeted T-cell bispecific antibodies
- Emulate Inc, United States
- Department of Biomedical Engineering, University of Cincinnati, United States
- Roche Pharma Research & Early Development, Roche Innovation Center Zurich, Switzerland
- Roche Pharma Research & Early Development, Roche Innovation Center Munich, Germany
- Roche Pharma Research & Early Development, Roche Innovation Center Basel, Switzerland
Figures
Figure 1 with 1 supplement

FOLR1 expression in the alveolar epithelium of cynomolgus and humans underlies on-target off-tumor toxicities of FOLR1-TCB and can be recreated in a human alveolus lung-chip.
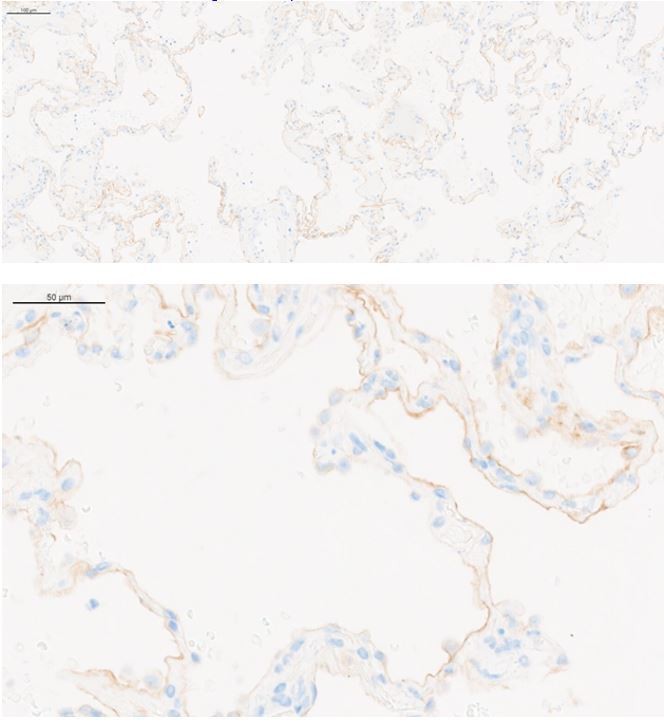
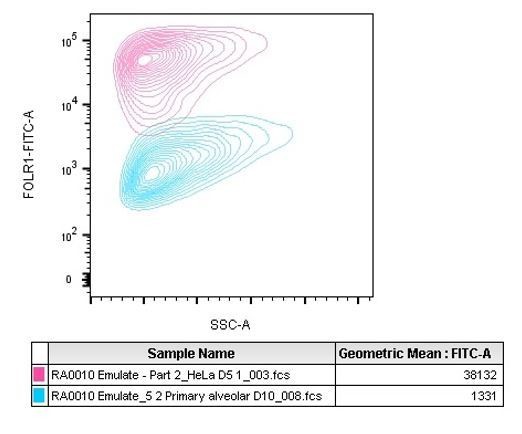
(A) IHC of pre-clinical, cynomolgus lung tissue 24 hr after intravenous single-dose administration of high-affinity FOLR1-TCB (FOLR1(Hi), 10 µg/kg), demonstrating leukocytic infiltration (dark purple cells) and inflammation. (B) Expression of FOLR1 protein in healthy cynomolgus lung tissue stained with antibody targeting FOLR1. (C, F) Isotype controls of FOLR1 staining in healthy cynomolgus and human lung tissues, respectively. (D) High FOLR1 expression displayed in human ovarian carcinoma HeLa cell line for comparison to (E) histopathological staining of primary healthy human lung tissue for FOLR1. (G) Schematic of Alveolus Lung-Chip to model human FOLR1 on-target toxicities. Alveolus Lung-Chip design is composed of a top microfluidic channel (Waldman et al., 2020) seeded with primary adult human alveolar cells (Yang, 2015) cultured to maturity with air–liquid interface (ALI). The top, epithelial channel is separated with a flexible, porous membrane (Hodi et al., 2010) from a bottom, vascular channel seeded with primary lung microvascular cells (Schadendorf et al., 2015; Wolchok et al., 2017). Mechanical stretching is applied via pneumatic actuation of parallel vacuum channels (Gong et al., 2018). (H) RNAseq expression levels of FOLR1 gene in cultured alveolar epithelial cells on day 0 (before seeding), 5, or 10 after seeding and differentiation on the Alveolus Lung-Chip (n=3, ± SEM). (I) Representative immunofluorescent staining of chip epithelium (Nuclei, blue) at day 10 of culture expressing the tight junction marker E-cadherin (green) and FOLR1 target antigen (red). Images taken at 40× magnification. (J) Estimation of surface FOLR1 binding site expression via flow cytometry of harvested chip epithelial cells at days 0 (before seeding), 5, and 10 (n=2–4, ± SEM).
Figure 1—figure supplement 1
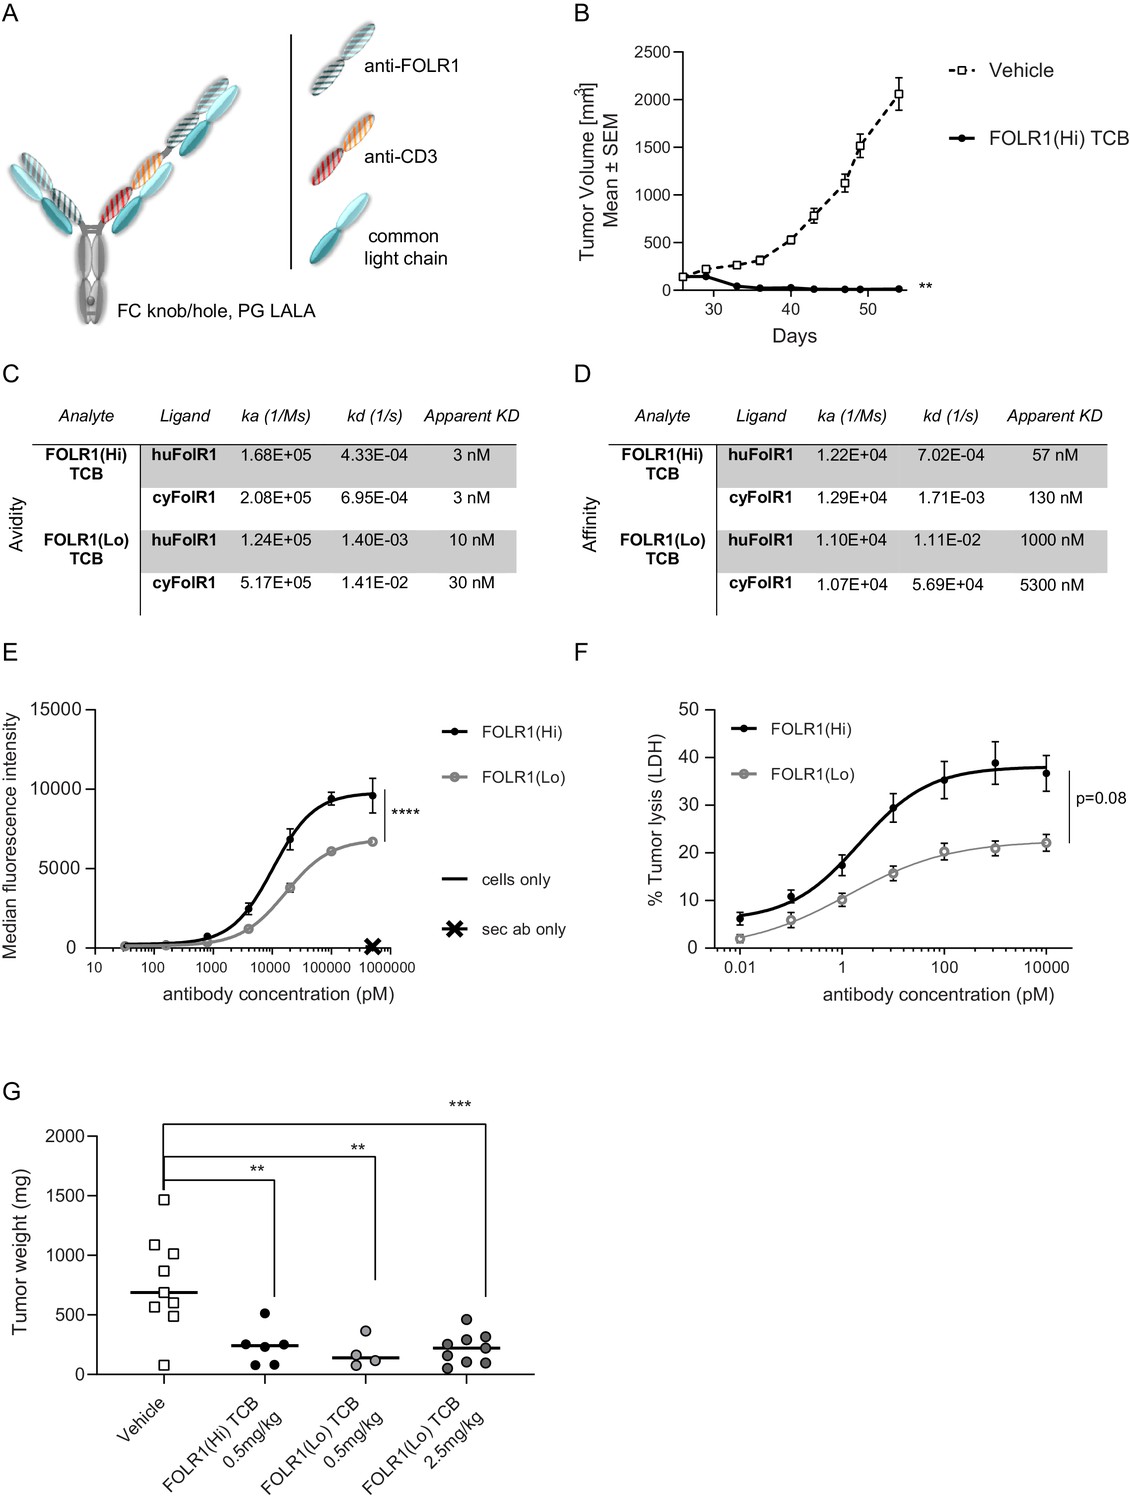
Anti-tumor potency and efficacy of FOLR1-targeted TCBs.
(A) ‘Knobs-into-holes’ technology was used for the generation of heterodimeric molecules and PG LALA mutations were inserted to prevent FcγR binding. The resulting FOLR1-specific asymmetric 2:1 T-cell bispecific antibody with a molecular format that incorporates bivalent binding to FOLR1 and monovalent binding to CD3e is described thereafter as FOLR1-TCB. (B) Tumor growth inhibition curves of breast PDX BC004 model in CD34+ HSC humanized NSG mice (HSC-NSG). Humanized mice (n = nine per group) were weekly intravenously injected with FOLR1-TCBs (0.5 mg/kg) or vehicle once the tumor size reached 150 mm3 (day 26). Each dot represents the mean tumor volume ± SEM. Efficacy was evaluated by measuring the reduction of the mean tumor volume at day 62 relative to vehicle control. Statistical analysis was done using an unpaired t-test. (C) Bivalent binding (avidity with apparent KD) of FOLR1-TCBs on human and cynomolgus FOLR1 as determined by SPR. (D) Monovalent binding (affinity) of FOLR1-TCBs on human and cynomolgus FOLR1 as determined by SPR. (E) Binding of FOLR1-TCBs to human FOLR1 expressed on HeLa cells revealed the higher binding of FOLR1(Hi) TCB compared to FOLR1(Lo) TCB, consistent with the observed higher affinity for FOLR1. (F) Treatment of HeLa cells with both TCBs in presence of PBMC led to a concentration-dependent HeLa cell killing. Statistical analysis was done using an unpaired t-test. (G) FOLR1(Hi) TCB and FOLR1(Lo) TCB were administered once per week to HeLa cell injected human PBMC engrafted NOG mice starting from day 32 post-HeLa injection and day 2 post-PBMC injection. Mice were terminated at day 53 and tumors weighted. Animals with low T-cell engraftment (<5%) were excluded from analysis. Each dot represents the mean tumor volume ± SEM. Statistical analysis was done using a one-way ANOVA test.
Figure 2 with 2 supplements

The immunocompetent Alveolus Lung-Chip recapitulates TCB-mediated on-target off-tumor toxicity.
Isolated PBMCs were pre-incubated for 1 hr with high-affinity FOLR1 TCB (FOLR1(Hi)) or non-targeting TCB control (NT) and introduced to the epithelial channel of differentiated Alveolus Lung-Chips and rested for 3 hr prior to initiation of media perfusion. The established co-culture with immune cells was then maintained for 48 hr under flow with fresh media. (A) Representative brightfield (top) and immunofluorescent images (bottom) of Alveolar Lung-Chip epithelium (nuclei, blue) 48 hr after addition of PBMC (cyan). The control group did not have PBMC administered. The FOLR1(Hi) group showed higher levels of PBMC attachment and caspase-3/7-positive, apoptotic cells (magenta) (B) Quantification of apoptotic caspase-3/7-positive cells collected on live chips (n=4). (C) Flow cytometry analysis of PBMC harvested from chips or plates for percentage of live, CD69+ activated CD8+ T cells (n=4 approx. 10,000 cells per chip) after 48 hr (n=4). PBMC cultured on plates after 48 hr incubation showed overall low activation levels without attachment to epithelium. (D) Multiplex cytokine analysis of epithelial channel supernatants at 24 and 48 hr after PBMC introduction (n=4). (E) Immunofluorescent staining of FOLR1 target expression (blue) in epithelium of chips administered with NT control (left) and FOLR1(Hi)-treated (right) PBMC (green). Increased accumulation of PBMC and co-localization with FOLR1 signal was observed in FOLR1(Hi) group. (F) Quantification of immunofluorescent images confirmed increased PBMC attachment (including T cells) in the FOLR1(Hi) group (n=4). Statistical analysis was conducted by one-way ANOVA (B, C, D, F) and was defined as *p<0.05, **p<0.01, and ***p<0.001. Errors bars represent ± SEM.
Figure 2—figure supplement 1
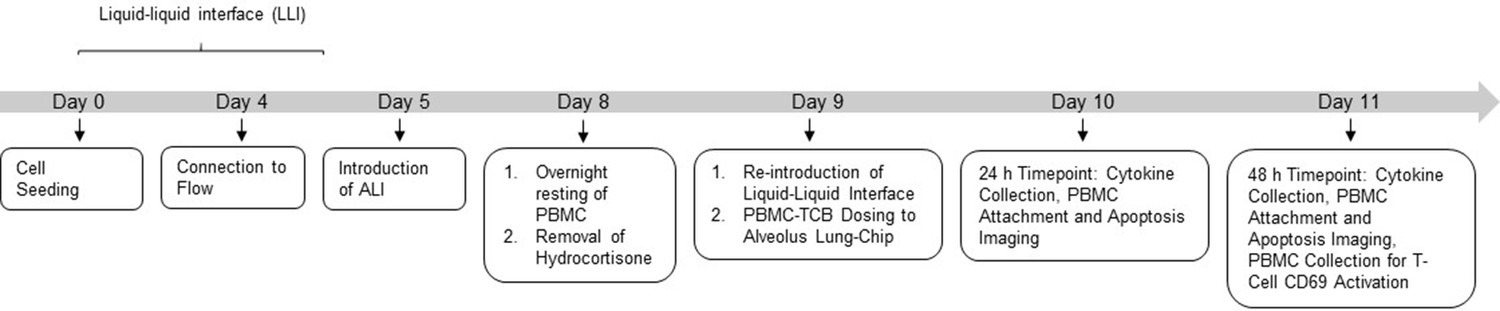
Experimental outline of Alveolus-Chip model.
Alveolus Lung-Chips were cultured following the organ-chip protocol till day 7 of culture. On day 8, frozen PBMCs were thawed and rested overnight at 37°C prior to introduction on chip. The same day, hydrocortisone-free medium was introduced in chips 24 hr before TCB-PBMC introduction. After 4 days of culture under ALI (air–liquid interface), culture medium was re-introduced in the epithelial channel after which PBMC-TCB was introduced to the epithelial channel. Apical and basal outflow collection, PBMC (Cell Tracker) and Epithelial Apoptosis (Caspase3/7+) live imaging was performed at 24 hr and 48 hr post-PBMC-TCB dosing. At the 48 hr terminal time point, PBMCs were collected from chips for T-Cell CD69 analysis using flow cytometry. Chips were later fixed with 4% PFA and stored for further immunofluorescence imaging.
Figure 2—figure supplement 2
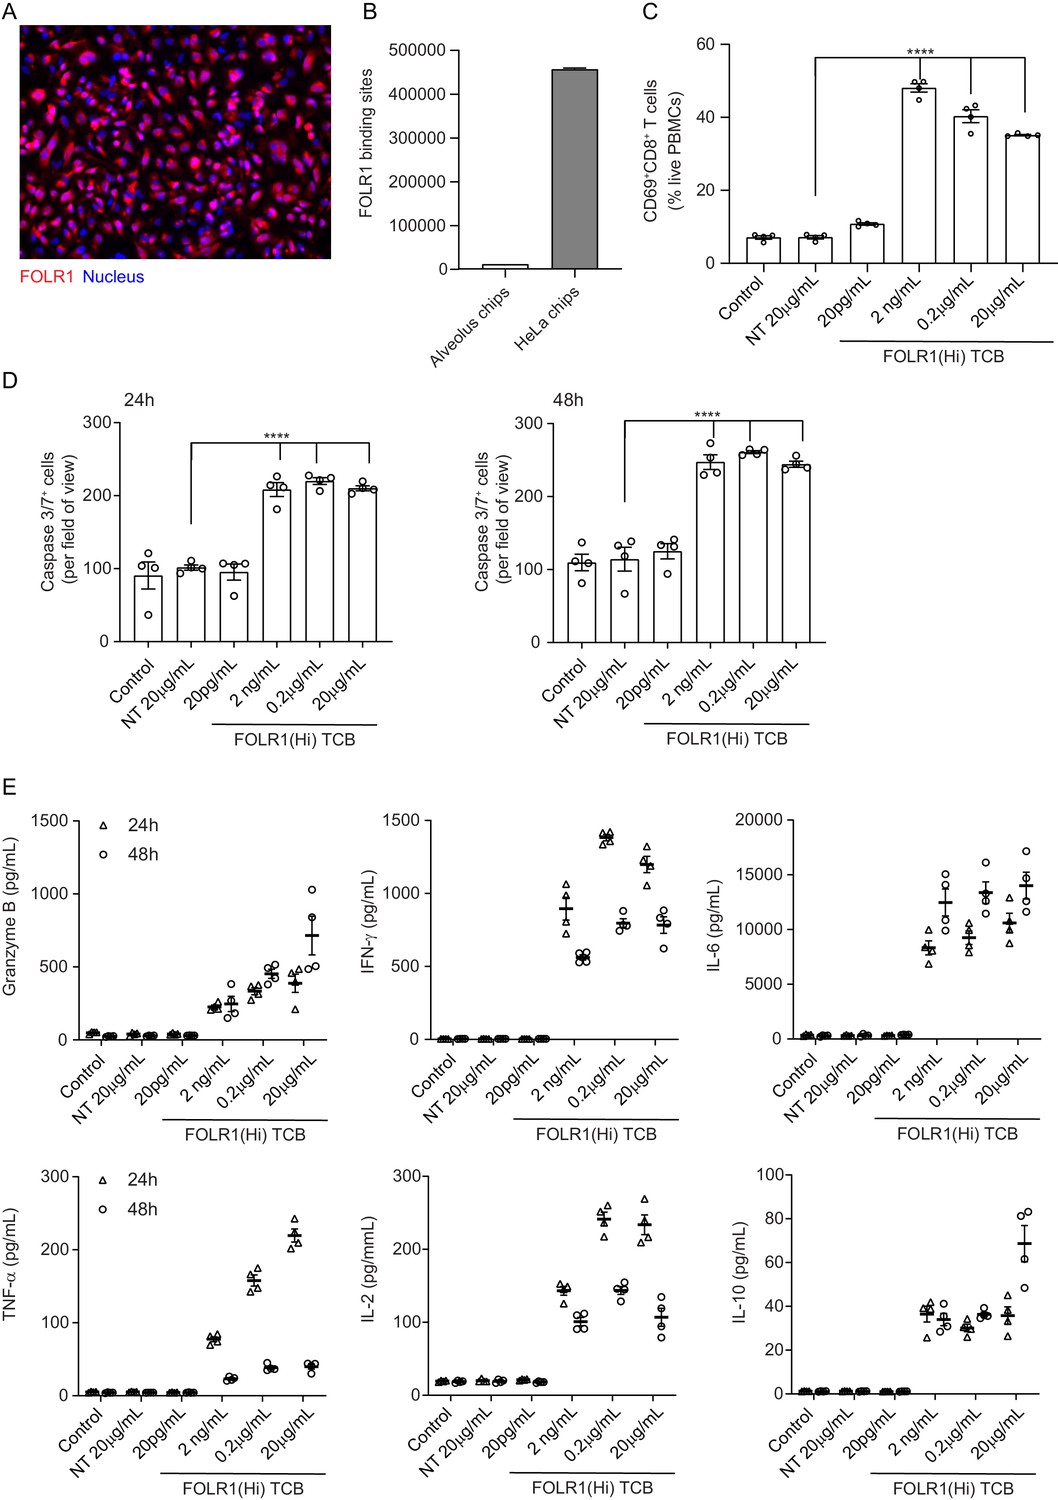
HeLa Lung-Chip Produces On-Target T-cell Killing Response.
Ovarian carcinoma HeLa cells were seeded into epithelial channels of chips, with lung microvascular cells in vascular channels, and cultured under liquid–liquid interface (LLI) to confluency. (A) Representative microscopy picture of immunostaining of FOLR1 (red) in mature HeLa chips and Dapi nuclear counterstain in blue (B) Flow cytometry quantification of FOLR1 target sites on alveolar epithelial cells or HeLa cells after culture on chips for 5 days (n=2, ± SEM). (C) Chips were administered with PBMC with high-affinity FOLR1(Hi) TCB at 20 pg/mL–20 µg/mL concentration or non-targeting (NT) TCB (20 µg/mL) (also included PBMC-deficient control). T-cell activation (CD69+/CD8+) was measured on harvested PBMC from epithelial channels through flow cytometry on live cells (n=4). (D) Analysis of apoptotic, caspase-3/7+ epithelial cell signal from live imaging at 24 (left) and 48 hr (right) post PBMC administration (n=4). (E) Multiplex cytokine analysis from supernatants collected from epithelial channels at 24- and 48 hr (n=4). Statistical analysis was conducted by one-way ANOVA (B, C) and was defined as ****p<0.0001. Errors bars represent ± SEM.
Figure 3 with 2 supplements
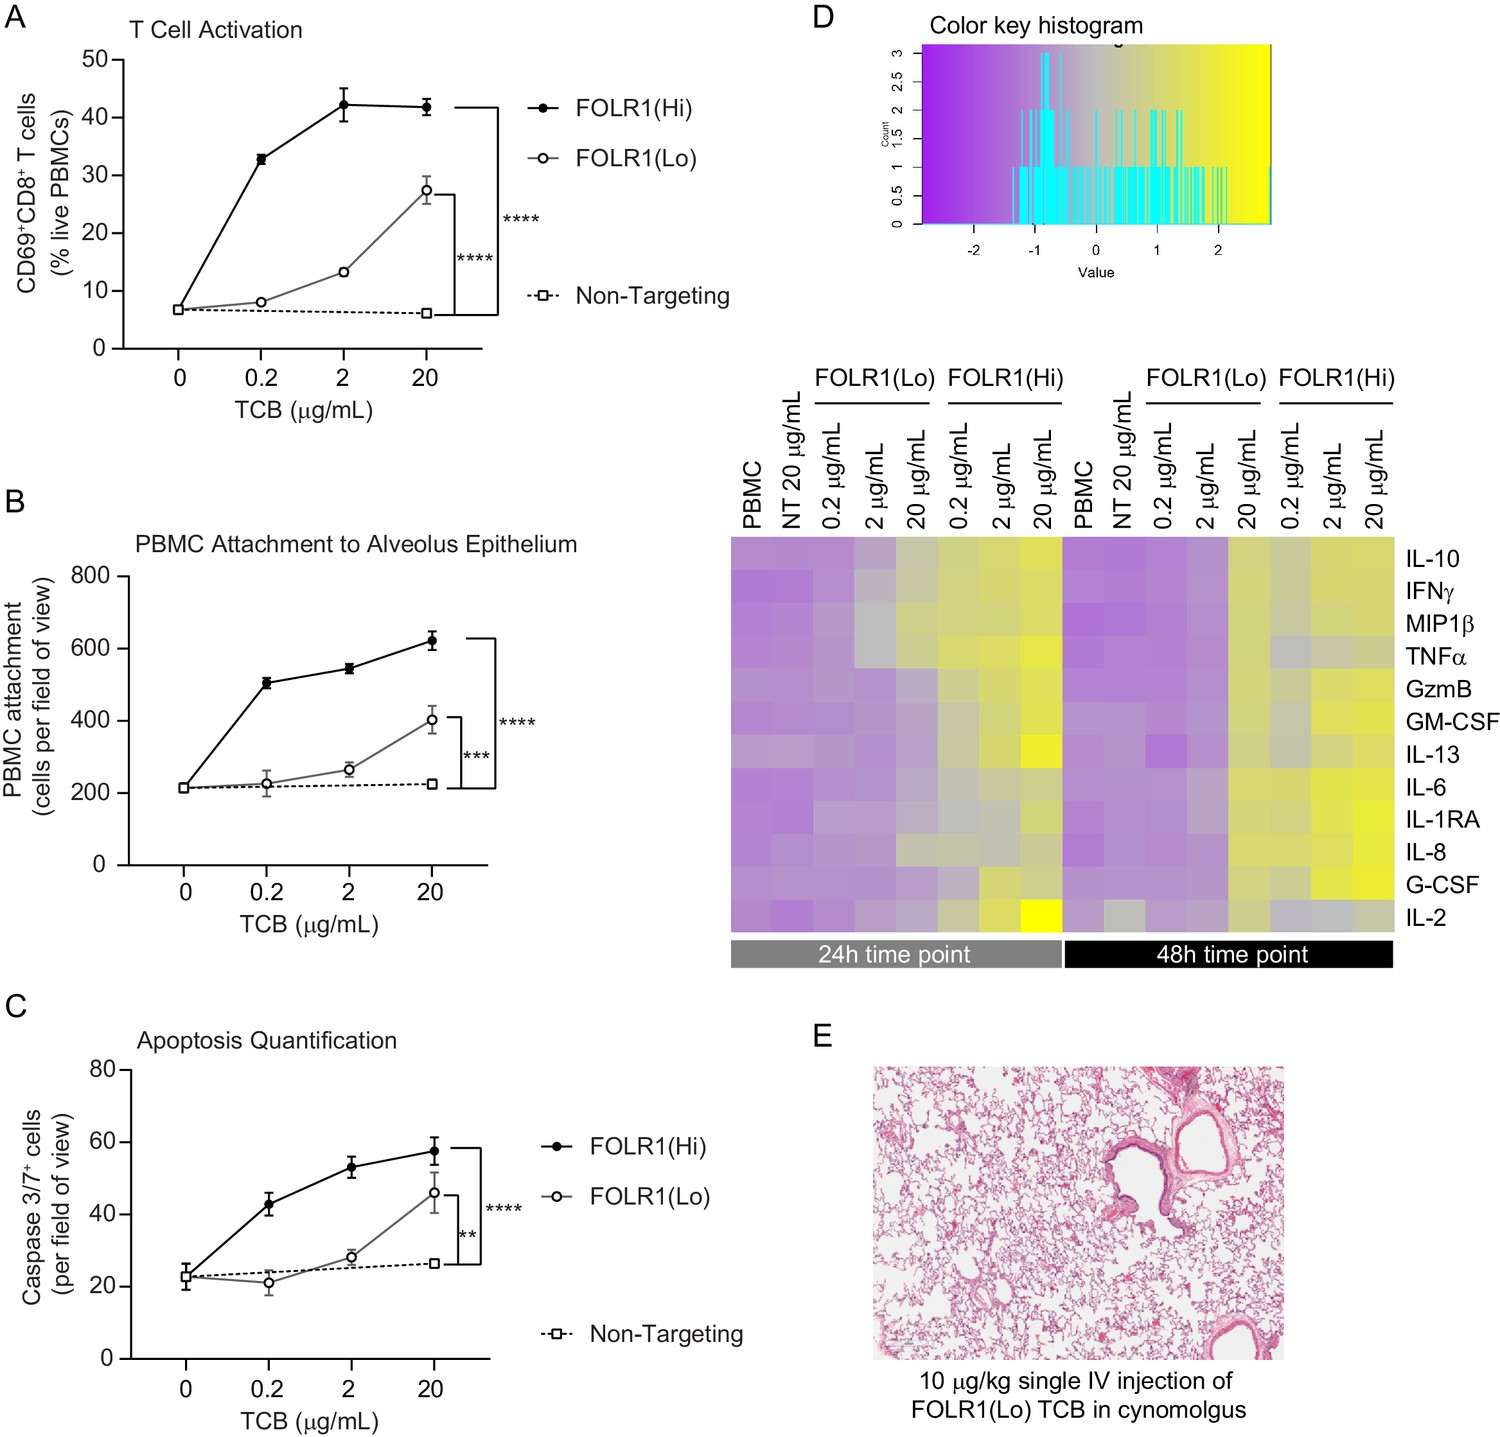
Dose–response and TCB affinity-dependent effects displayed in immunocompetent Alveolus Lung-Chips.
(A) Flow cytometry analysis of PBMC harvested from epithelial channel and assessed for CD69+ activated CD8+ T cells (n=4 approx. 10,000 cells per chip). (B) Quantification of immunofluorescent images of prelabelled (PBMC that remained attached after harvest from chip epithelium) (n=4). (C) Immunofluorescent image quantification of caspase-3/7+ apoptotic epithelial cells at 48 hr time point. The NT control group displayed no increase in T-cell activation, PBMC attachment, or apoptotic cells with increasing dose, while the FOLR1(Lo) group showed a significant increase at 20 µg/mL and the FOLR1(Hi) group displayed an increase from 0.2 µg/mL in a dose-dependent manner (n=4). (D) Heat map displaying multiplex cytokine analysis of chip epithelial channel supernatant at 24 and 48 hr post-treatment. (E) Histological lung tissue section from pre-clinical cynomolgus study of intravenous FOLR1(Lo) (10 µg/kg), 24 hr after administration. Statistical analysis was conducted by one-way ANOVA (A, B, C) and was defined as **p<0.01, ***p<0.001, and ****p<0.0001. Errors bars represent ± SEM.
Figure 3—figure supplement 1
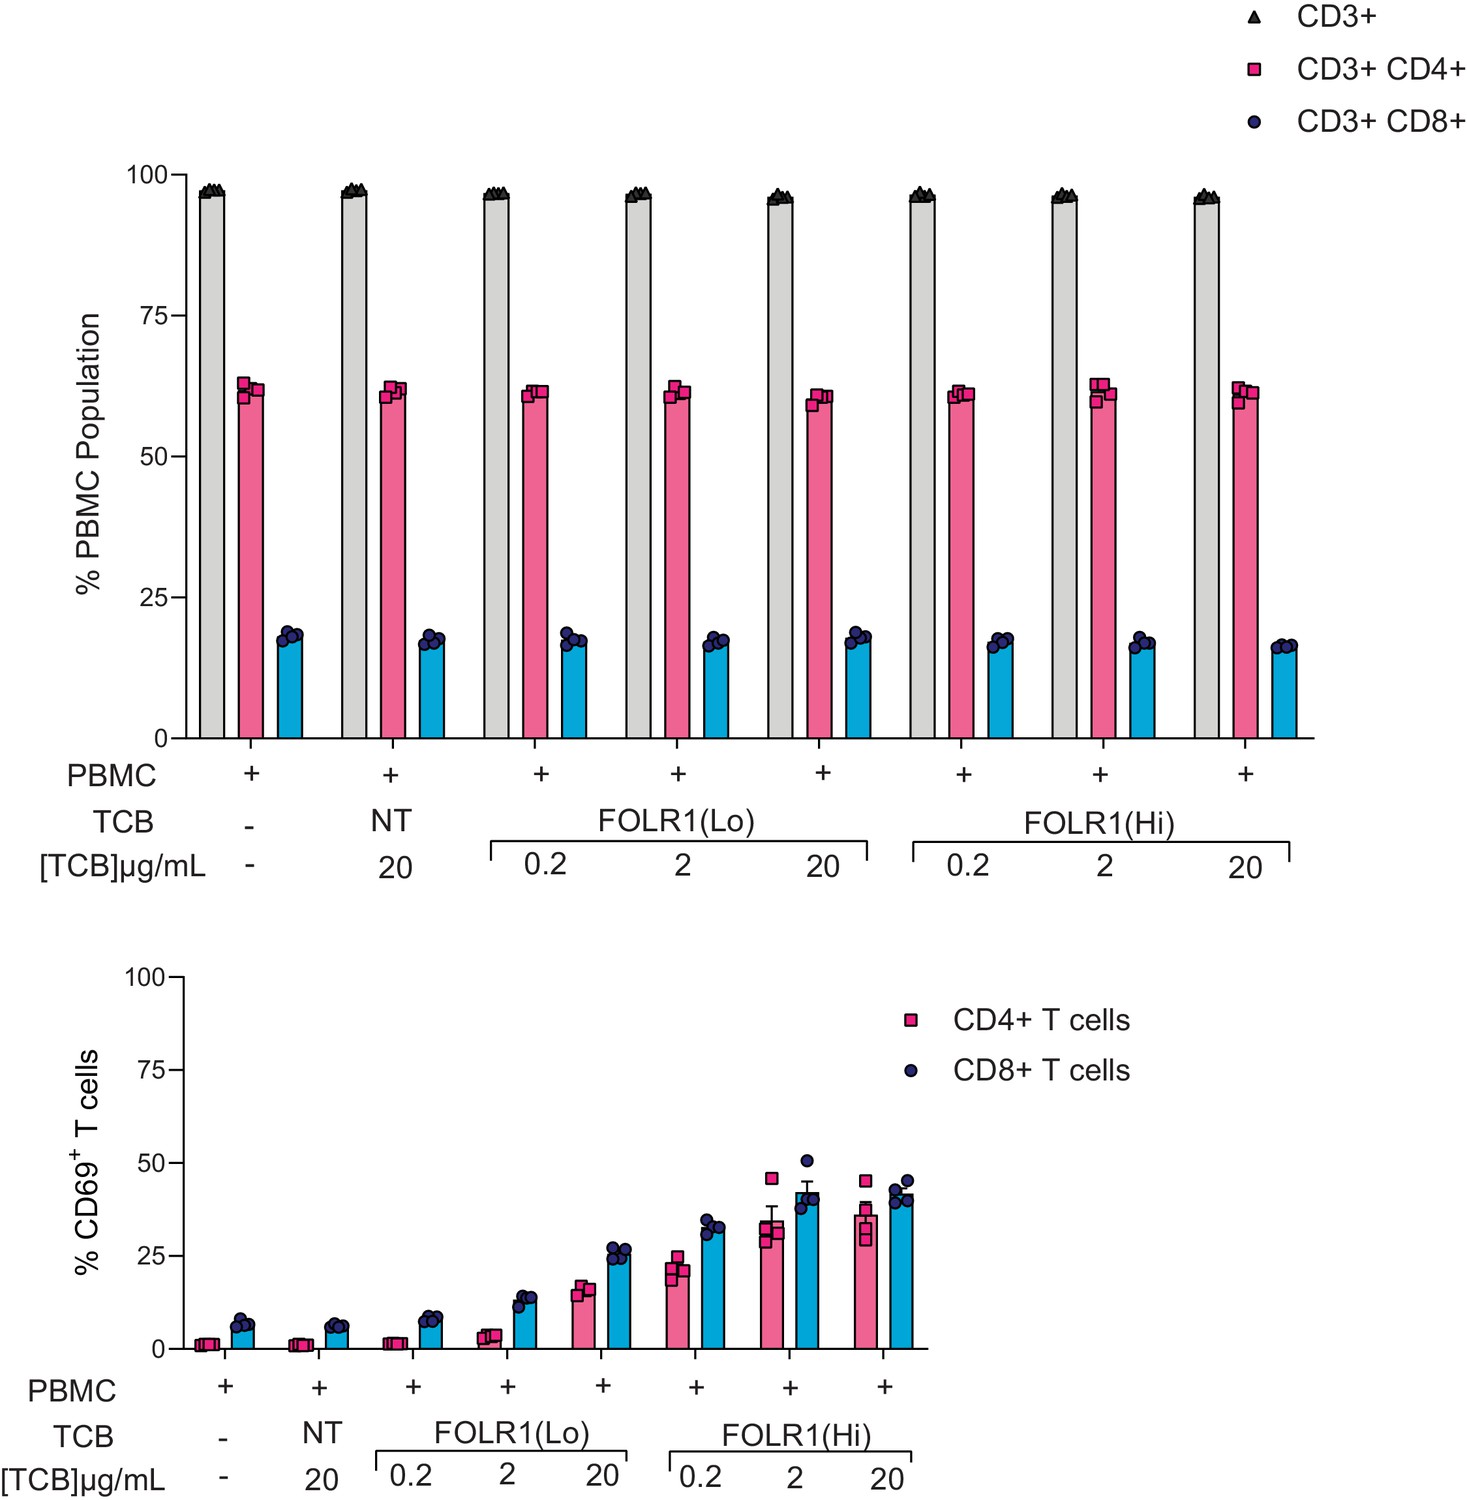
Proportions of T-cell subsets harvested from the Alveolus Lung-Chip platform.
Mature chips were administered with PBMC and treated with FOLR1(Hi) TCB and FOLR1(Lo) TCB in a dose-response fashion over the course of two days as described in Figure 2. Total/CD4+/CD8+ T cells percentages and T-cell activation (CD69+CD4+ or CD8+ T cells) were calculated on PBMC harvested from epithelial channels through flow cytometry on live cells at 48 hr time point (n=4).
Figure 3—figure supplement 2
Comparison of T-cell killing response of transwell culture to alveolus lung-chip.
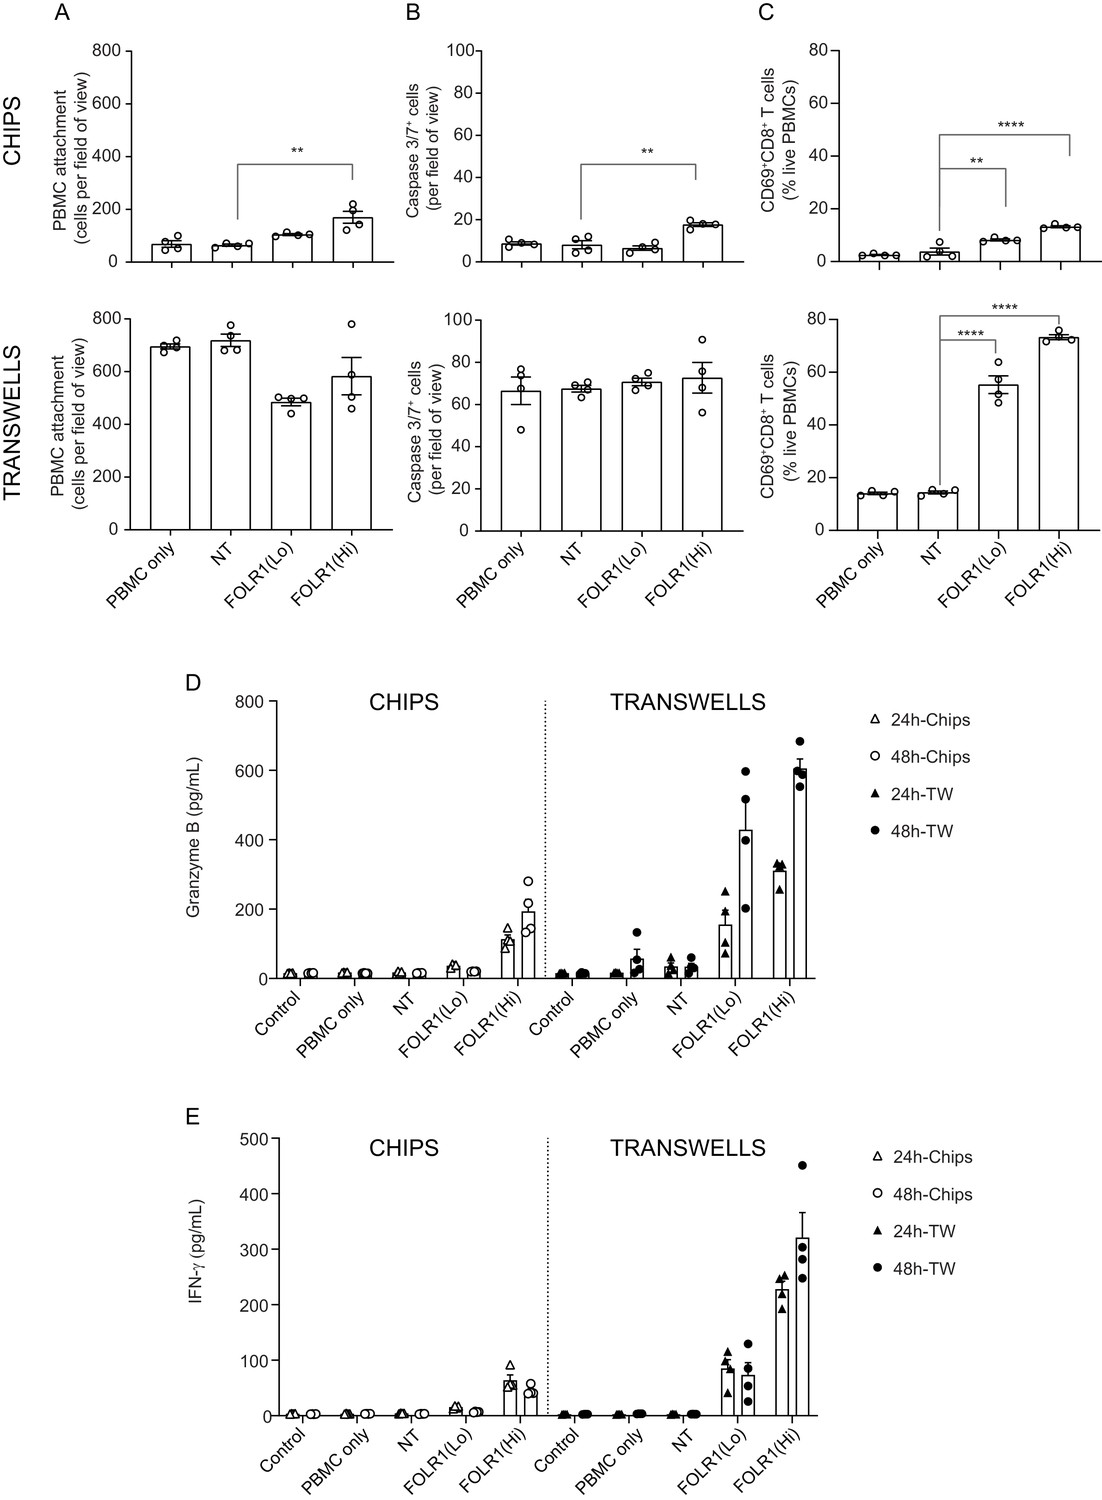
Transwells were cultured in parallel to Alveolus Lung-Chips and both were introduced to PBMC with/without low-affinity (FOLR1(Lo)) and high-affinity (FOLR1(Hi)) TCB or Non-targeting (NT) control. (A–C) Comparison of chips (top graphs) and transwells (bottom graphs): (A) live imaging analysis of PBMC attachment to epithelium, (B) live imaging analysis of apoptotic caspase-3/7+ epithelial cells, and (C) flow cytometry analysis of live harvested PBMC for T cell activation CD69+ and killer CD8+ surface markers. Data from 48 hr after PBMC administration (n=4). (D, E) Multiplex cytokine analysis of (D) Granzyme (B, E) IFN-ɣ from supernatant collected from epithelial channels 24 and 48 hr after PBMC administration (TW, transwells). Statistical analysis was conducted by one-way ANOVA (A–C) and was defined as **p<0.01 and ****p<0.0001. Errors bars represent ± SEM.
Figure 4 with 3 supplements
Application of colon intestine-Chip as model of CEA-TCB-mediated adverse effects.
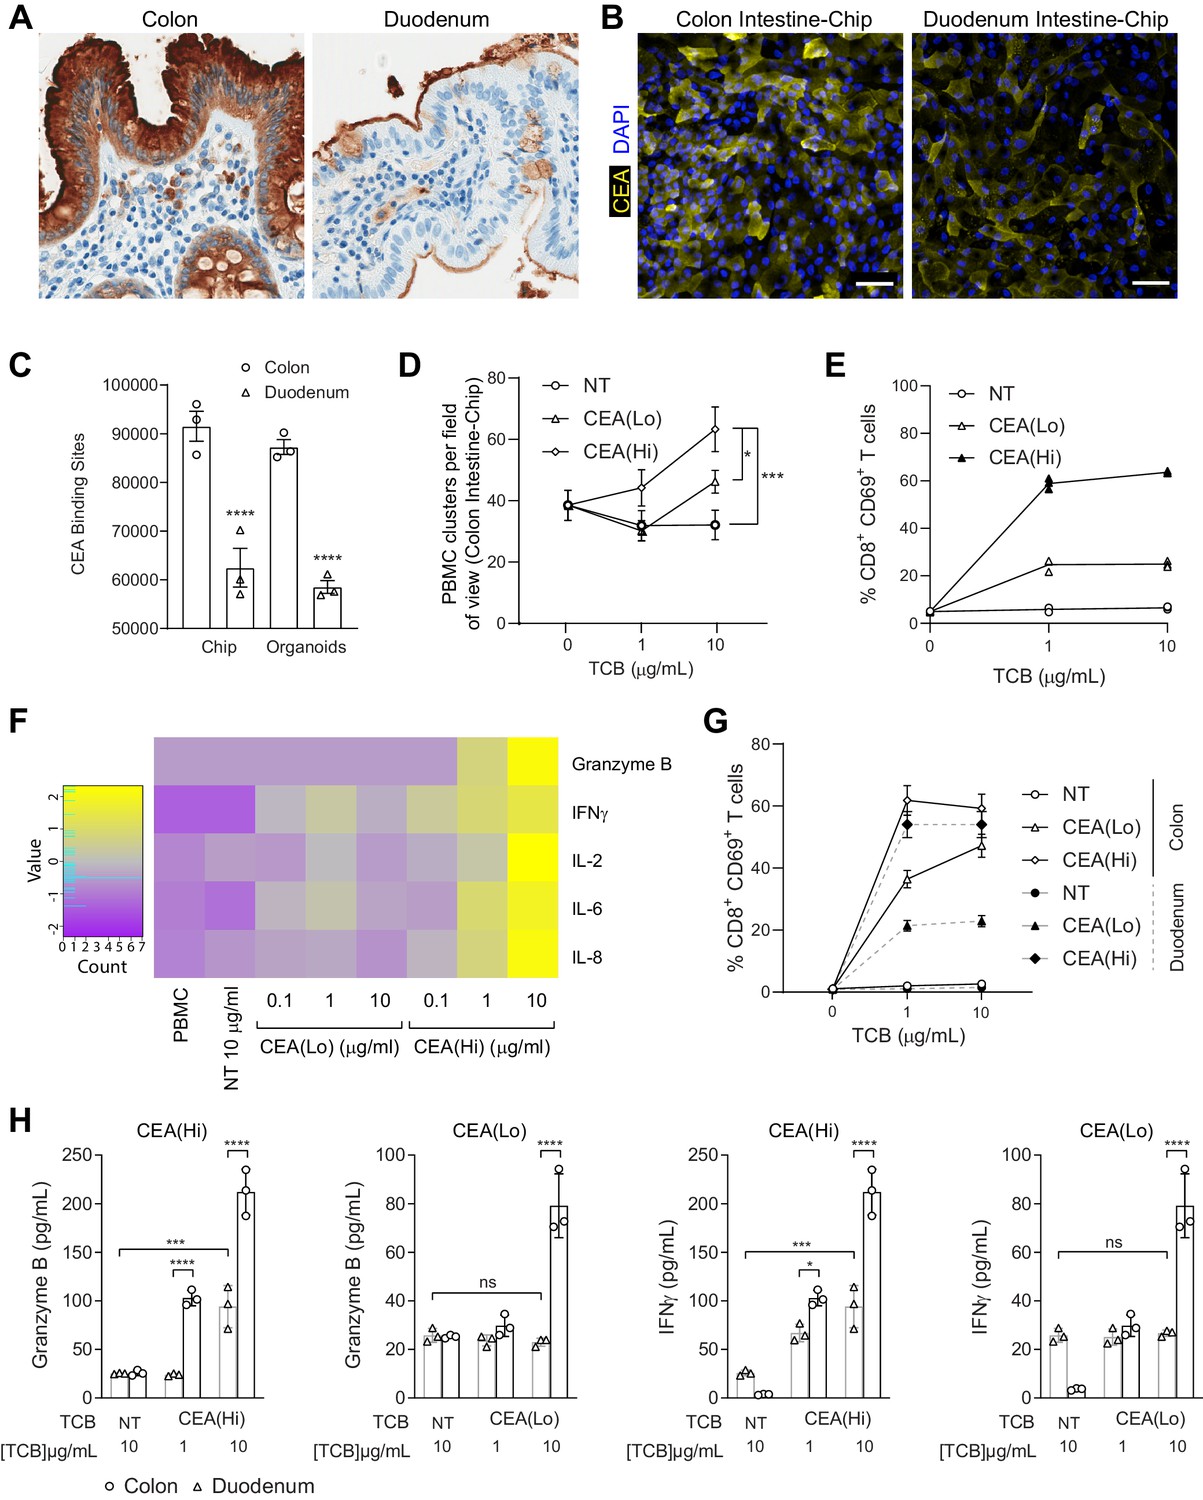
(A) IHC of human colon and duodenum tissue stained with anti-CEA (brown coloration) demonstrating difference in regional expression. (B) Representative immunofluorescent micrograph depicting CEA expression in the epithelial compartment of the Colon Intestine-Chip and Duodenum Intestine-Chip. (C) Average cell surface expression of CEA within 3D organoids and chips at day 8 of culture (n=3). (D) Colon-Chip epithelial channels were administered with PBMC treated with/without low and high-affinity (CEA(Lo) and CEA(Hi)) TCB (0.1–10 µg/mL), or Non-targeting (NT) TCB (10 µg/mL). Co-culture was maintained under flow for 72 hr. Quantification of immunofluorescent images collected live indicate multiple clusters of PBMC settled throughout epithelial structures. Statistical analysis was conducted by one-way ANOVA and was defined as *p<0.05 and ***p<0.001. Errors bars represent ± SEM. (E) CD69+ Activation of CD8+ T cells of harvested PBMC measured by flow-cytometry (n=3± SEM). (F) Heat map of multiplex cytokine panel from epithelial channel supernatants. Data (D–F) from terminal endpoint 72 hr after administration (n=3). (G) Colon- and Duodenum-Chips were administered with PBMC with low and high-affinity (CEA(Lo) and CEA(Hi)) TCB treatment from 0 to 10 µg/mL, along with Non-targeting (NT) control. Flow cytometry analysis of harvested PBMC from chips 72 hr post-treatment to measure levels of activated CD69+CD8+ T cells (n=3± SEM). (H) Multiplex cytokine analysis of supernatant collected from epithelial channels of Colon and Duodenum-Chips after 72 hr of treatment (n=3± SEM).
Figure 4—figure supplement 1
Anti-tumor potency and animal cross-reactivity of CEA-targeted TCBs.
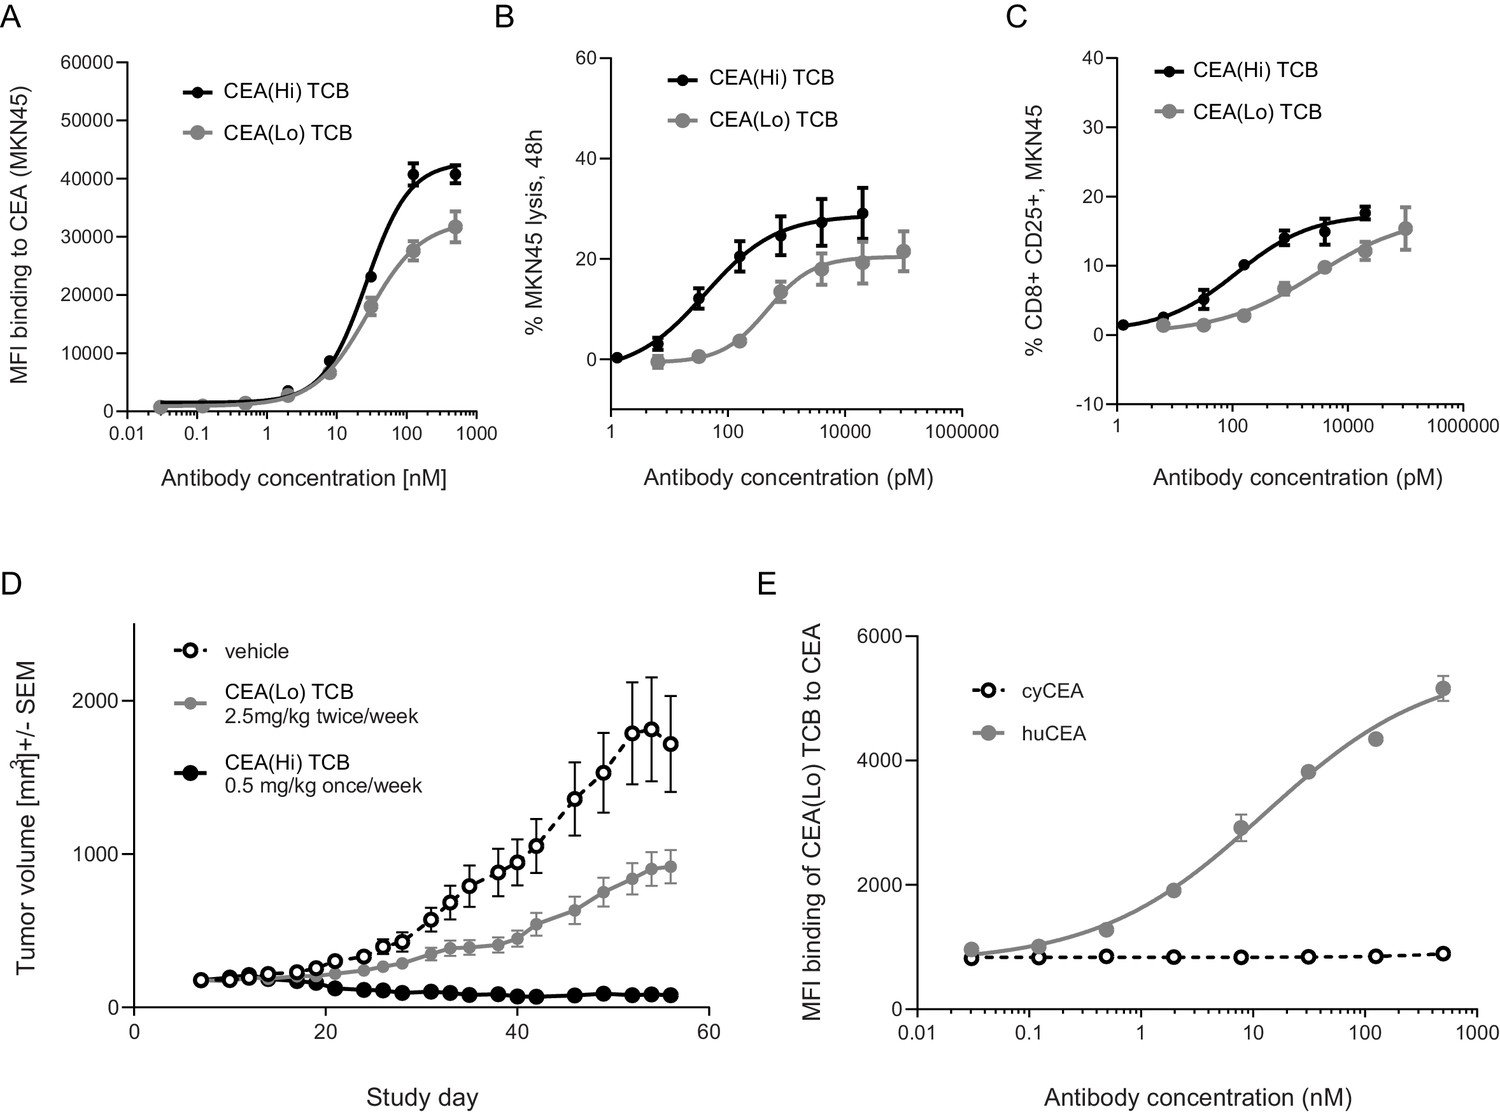
(A) Both TCB molecules displayed concentration-dependent binding to human CEA-expressing gastric cancer cell line MKN45. CEA(Hi) TCB showed stronger binding, consistently with its higher affinity for CEA. Treatment with both TCBs led to concentration-dependent (B) MKN45 cancer cell killing and (C) T-cell activation, with the higher affinity molecule producing a stronger effect. (D) Effect of CEA-targeted TCBs on tumor progression in CD34+ HSC humanized NSG mice (HSC-NSG mice), engrafted with tumor-forming MKN45 cells. (E) Assessment of binding of CEA(Lo) TCB to CEA derived from humans or cynomolgus monkeys. Data are represented as mean values, with SEM.
Figure 4—figure supplement 2
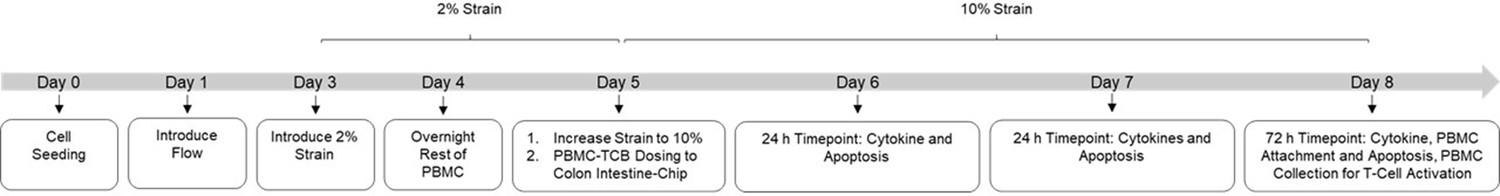
Experimental outline of Intestine-Chip model.
Colon Intestine-Chips were cultured following the organ-chip protocol until day 4. On day 4, frozen PBMCs were thawed and rested overnight at 37°C prior to introduction to the chip. On day 5, PBMC-TCB dosing solutions were prepared and administered to the epithelial channel of the chips. For days 6–8, the epithelial channel was administered with media containing TCB but without additional PBMC. Apical and basal outflow collection and PBMC (Cell Tracker) live imaging was performed at 24 hr, 48 hr, and 72 hr post PBMC-TCB dosing. At the 72 hr terminal time point PBMCs were collected from chips for T-Cell analysis using flow cytometry. Chips were later fixed with 4% PFA and stored for further immunofluorescence imaging.
Figure 4—figure supplement 3
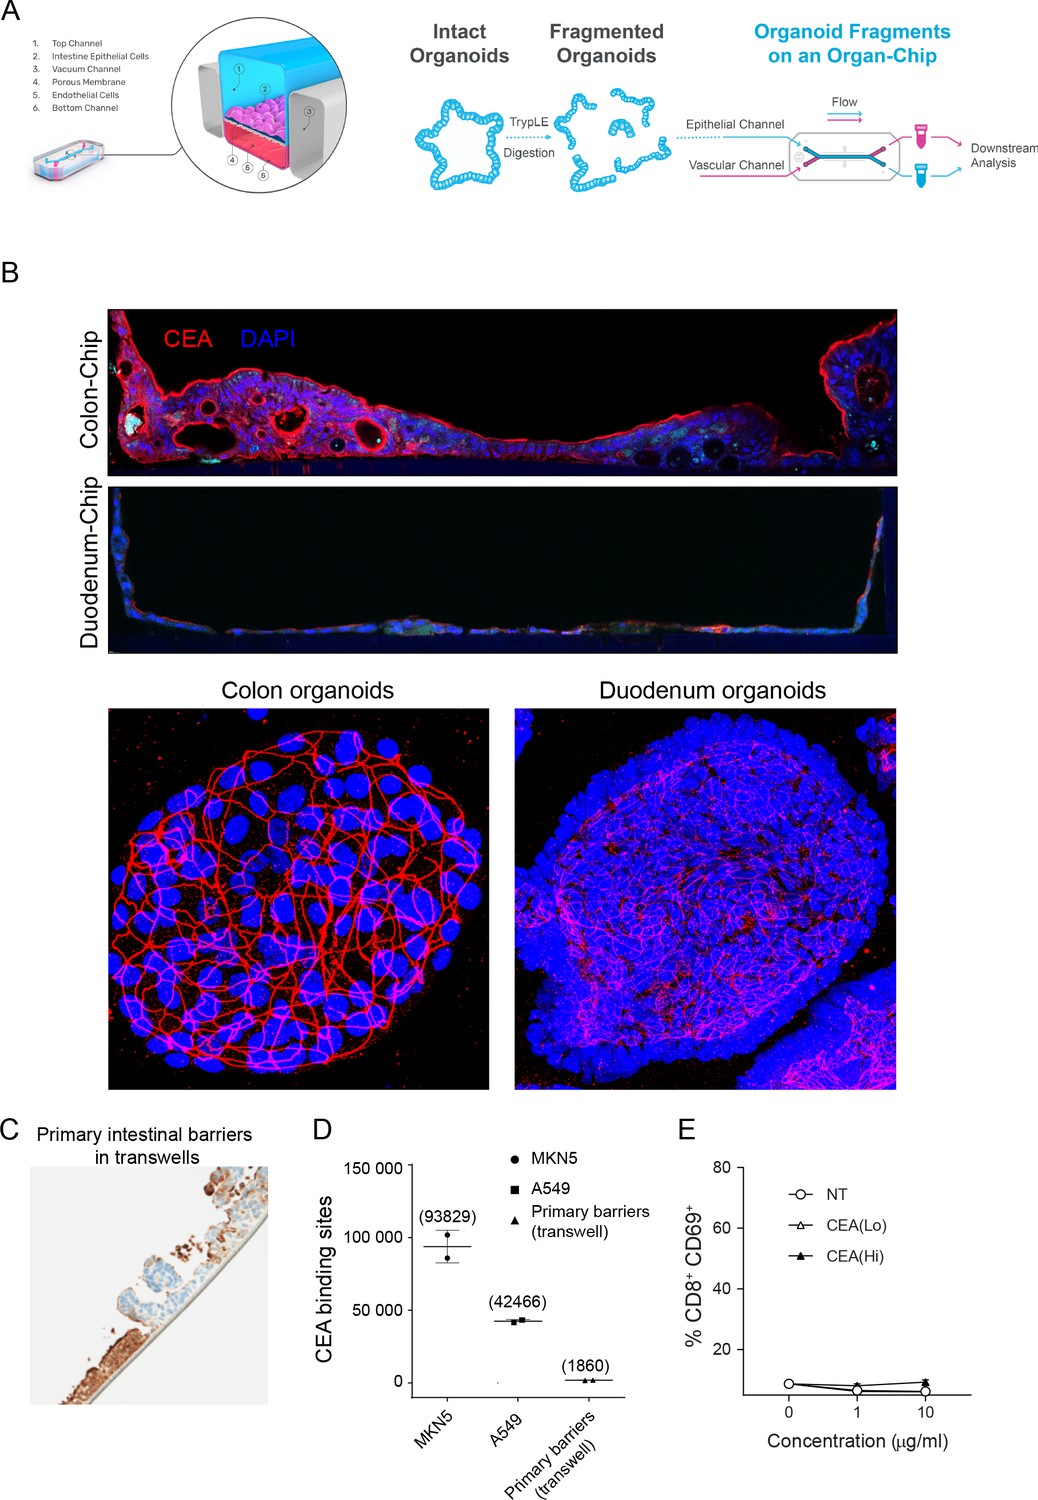
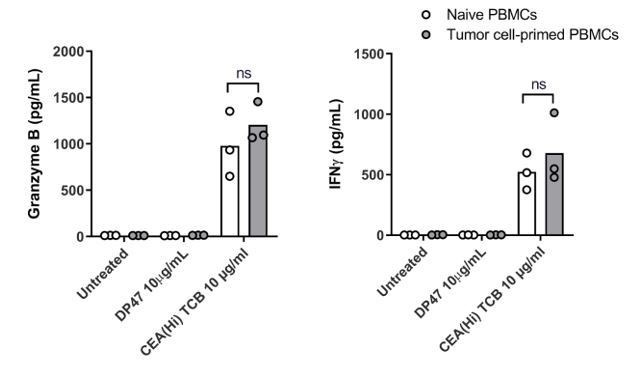
Intestine-Chip CEA expression, comparison to conventional models and target-independent PBMC activation of CEA-targeted TCBs.
(A) Diagram of Colon and Duodenum-Intestine chip seeding, beginning with fragmented primary human organoids seeded into the epithelial channel of the chip. Primary intestinal endothelial cells, either colon or small-intestinal depending on corresponding epithelial tissue, are seeded into the vascular channel and the chip is cultured to maturity under flow and mechanical deformations. (B) Immunofluorescence staining of CEA and nuclei in colon or dudodenum chips versus matched colon or duodenum organoids. (C) Immunohistochemistry analysis of CEA (brown coloration) in a conventional, static model of the intestinal barrier: organoid-derived intestinal cell seeded on ECM-coated transwell membranes. (D) Flow cytometry-based quantification of CEA binding sites expressed by intestinal barriers cultured in transwells. High CEA-expressing cancer cell lines MKN5 and A549 serve as positive controls. (E) Treatment of PBMC with CEA-targeted TCBs in the absence of target does not induce activation, confirming target-dependent mode of toxicity observed in the Intestine-Chips.
Author response image 1
Author response image 2
Author response image 3
Author response image 4

Tables
Key resources table
| Reagent type (species) or resource | Designation | Source or reference | Identifiers | Additional information |
|---|---|---|---|---|
| Biological sample (Homo sapiens) | Human Primary Alveolar Epithelial Cells | CellBiologics | Cat# H-6053 | |
| Biological sample (Homo sapiens) | Human Pulmonary Alveolar Epithelial Cells | Accegen | Cat# ABC-TC3770 | |
| Biological sample (Homo sapiens) | Human Lung Microvascular Endothelial Cells | Lonza | Cat# CC-2527 | |
| Biological sample (Homo sapiens) | Human Large Intestine Microvascular Endothelial Cells | Cell Systems | Cat# ACBRI 666 | |
| Cell line (Homo sapiens) | HeLa | ATCC | Cat# CCL-2, RRID:CVCL_0030 | |
| Cell line (Homo sapiens) | MKN45 | DSMZ | Cat# ACC-409, RRID:CVCL_0434 | |
| Cell line (Homo sapiens) | HEK293T | ATCC | Cat# CRL-11268, RRID:CVCL_1926 | |
| Commercial assay or kit | QIFIKIT | Agilent | Cat# K007811-8 | |
| Commercial assay or kit | Cell Tracker green | ThermoFisher | Cat# C7025 | |
| Commercial assay or kit | NucView405 Caspase-3 Enzyme | Biotium | Cat# 10407 | |
| Commercial assay or kit | ProcartaPlex multiplex immunoassays | Invitrogen | Cat# PPX-12-MXNKRV6 | |
| Software, algorithm | Prism | GraphPad | ||
| Software, algorithm | Fiji | RRID:SCR_002285 |
Additional files
Download links
A two-part list of links to download the article, or parts of the article, in various formats.
Downloads (link to download the article as PDF)
Open citations (links to open the citations from this article in various online reference manager services)
Cite this article (links to download the citations from this article in formats compatible with various reference manager tools)
Human immunocompetent Organ-on-Chip platforms allow safety profiling of tumor-targeted T-cell bispecific antibodies
eLife 10:e67106.
https://doi.org/10.7554/eLife.67106


