The role of interspecies recombination in the evolution of antibiotic-resistant pneumococci
- MRC Centre for Global Infectious Disease Analysis, Department of Infectious Disease Epidemiology, Imperial College London, United Kingdom
- Institute for Medical Microbiology, National Reference Center for Streptococci, University Hospital RWTH Aachen, Germany
- Respiratory Diseases Branch, Centers for Disease Control and Prevention, United States
- Laboratory of Molecular Genetics, Instituto de Tecnologia Química e Biológica, Universidade Nova de Lisboa, Portugal
- Laboratory of Microbiology and Infectious Diseases, The Rockefeller University, United States
- Cambodia Oxford Medical Research Unit, Angkor Hospital for Children, Cambodia
- Centre for Tropical Medicine and Global Health, Nuffield Department of Medicine, University of Oxford, United Kingdom
- Department of Molecular Cell Biology, Sungkyunkwan University School of Medicine, Republic of Korea
- Parasites & Microbes, Wellcome Sanger Institute, Wellcome Genome Campus, United Kingdom
- Laboratory of Molecular Microbiology of Human Pathogens, Instituto de Tecnologia Química e Biológica, Universidade Nova de Lisboa, Portugal
- Center for Communicable Disease Dynamics, Harvard T.H. Chan School of Public Health, United States
- Department of Global Health, Rollins School of Public Health, Emory University, United States
Figures
Figure 1 with 2 supplements

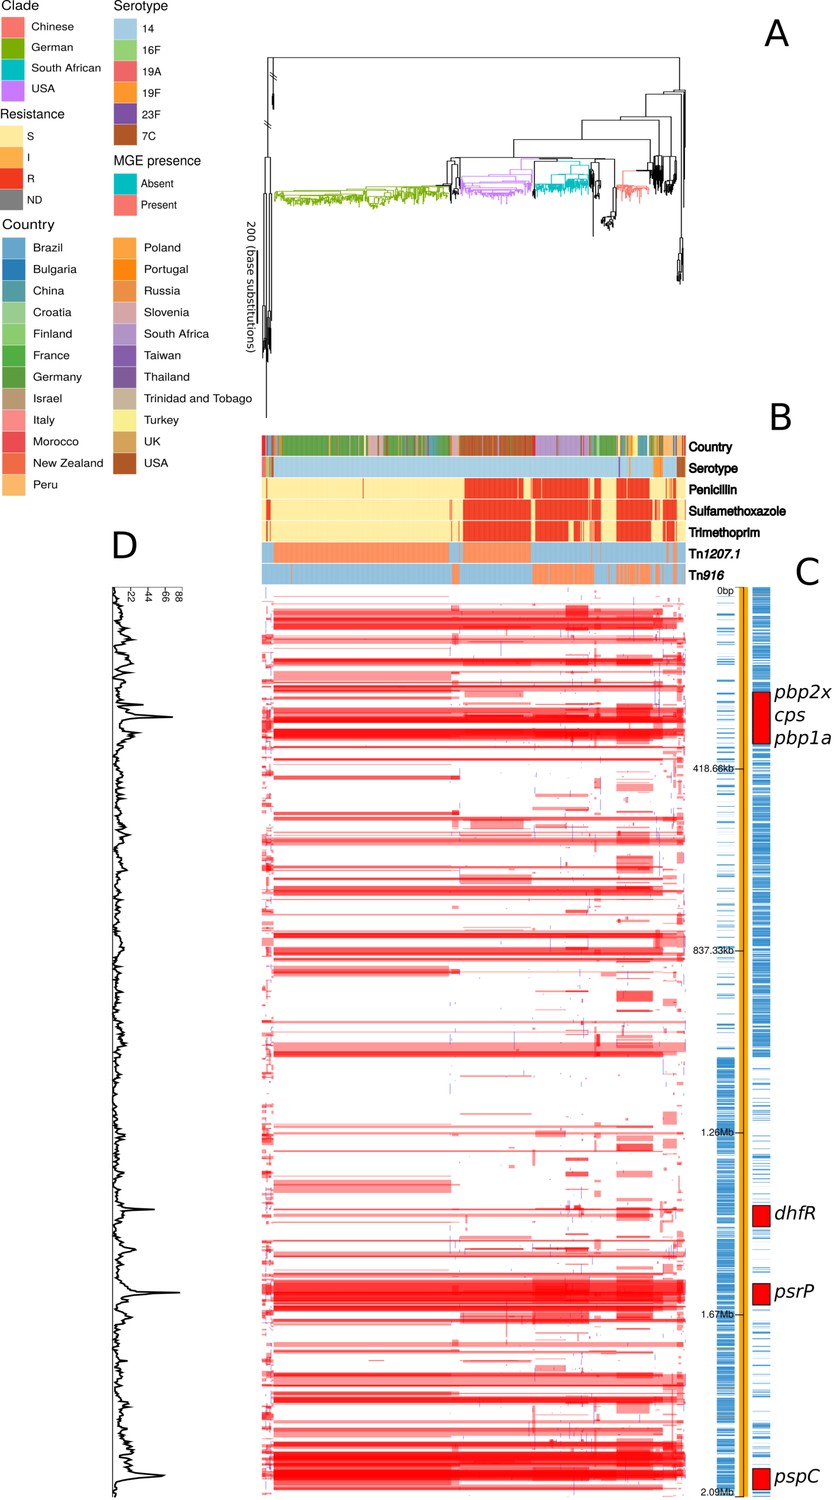
Phylogenomic analysis of PMEN3 lineage.
(A) Maximum likelihood phylogeny generated from the nonrecombinant regions of the whole-genome alignment of 669 isolates from the PMEN3 lineage. Branches are colored by clade, as identified in the key. Units for the scale bar are the number of point mutations along a branch. (B) Bars highlighting the country of origin; serotype; resistance to penicillin, trimethoprim and sulfamethoxazole, and the presence of the mobile genetic elements (MGEs) Tn1207.1 and Tn916 among isolates. The abbreviated resistance phenotypes are resistant (R), intermediate-level resistant (I), and susceptible (S). Bars map across to isolates on the phylogeny. (C) Simplified genome annotation of the PMEN3 reference isolate RMV4. The highlighted regions correspond to peaks of recombination event frequency. Blue bars represent individual genes annotated within the assembly. (D) Distribution of recombination events across the PMEN3 lineage. In the upper half of the graph, red bars indicate recombination events occurring on internal nodes in the tree, which were subsequently inherited by multiple descendant isolates. These bars align with isolates in the phylogeny in section A and map to regions in the genome annotated in section C. Blue bars indicate recombination events on terminal branches of the tree, identified in only one isolate. In the bottom half of the graph, the line represents the frequency of recombination events along the genome’s length.
-
Figure 1—source data 1
Sequence and epidemiological data for S. pneumoniae samples.
For each S. pneumoniae isolate sequenced as part of this study, accession codes are provided for the samples, sequence reads, and annotated assemblies. The same data are amalgamated for all previously published sequences analyzed in this study, where available. Where possible, the assembled data were used to assign isolates to a multi-locus sequence type and a global pneumococcal sequence cluster (GPSC). Resistance to trimethoprim, sulfamethoxazole, and penicillin, and the presence of the Tn1207.1-type and Tn916-type elements, were inferred for all isolates using the approaches described in the Materials and methods.
- https://cdn.elifesciences.org/articles/67113/elife-67113-fig1-data1-v3.xlsx
Figure 1—figure supplement 1
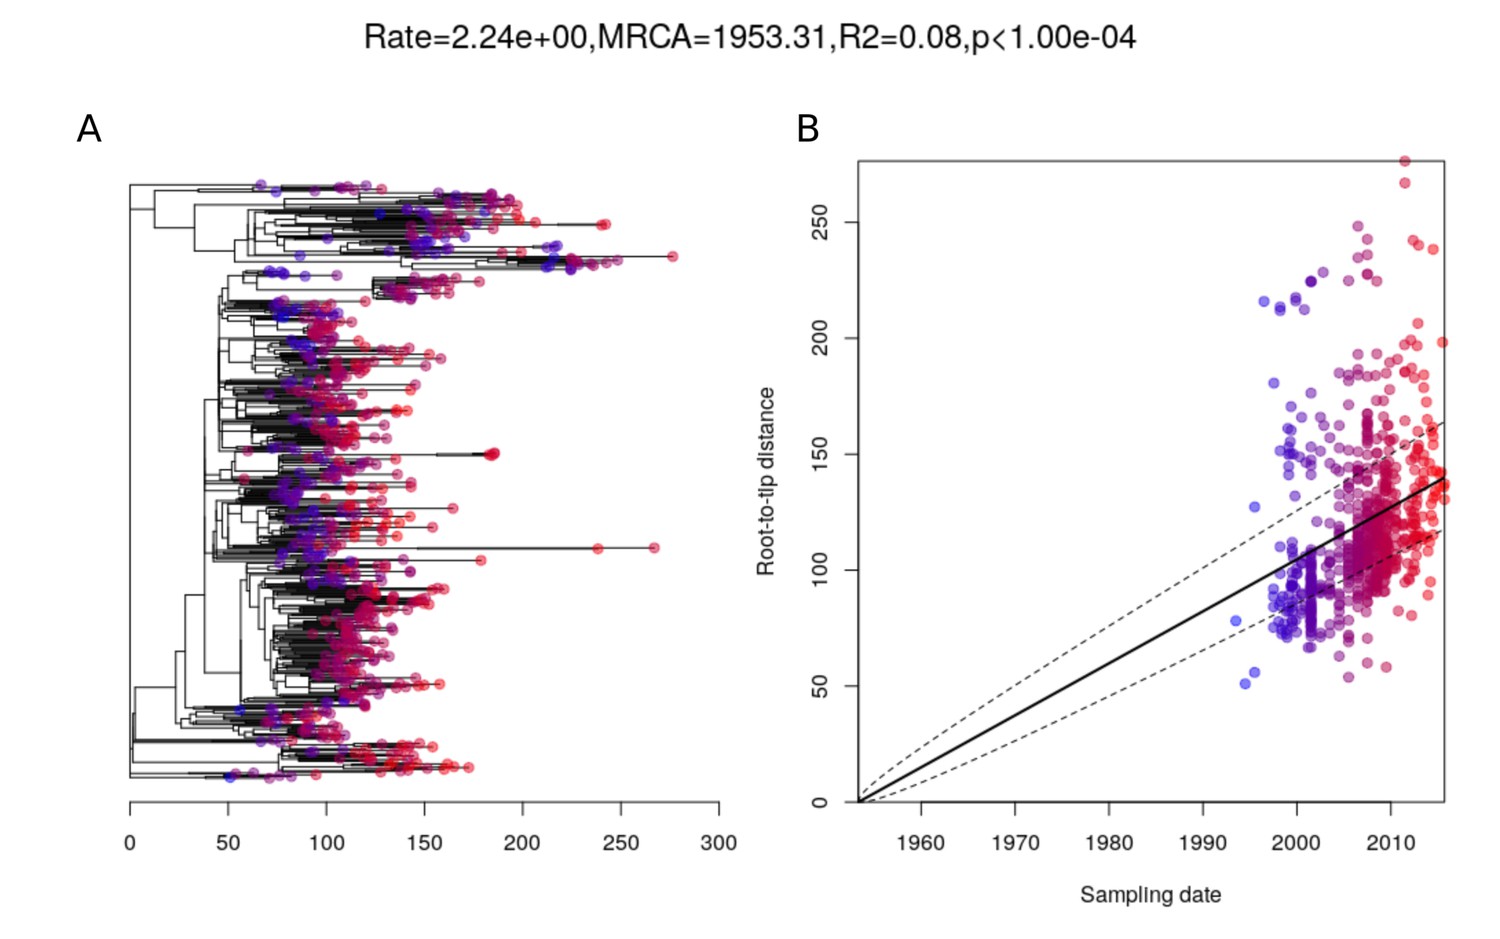
Root-to-tip analysis of PMEN3 lineage.
(A) The 663-isolate phylogeny of PMEN3 with node tips colored by date of isolation. The tree is topologically identical to that in Figure 1, except that six isolates for which the dates of isolation were unknown were omitted. (B) Linear regression of root-to-tip distance against sampling date for isolates.
Figure 1—figure supplement 2
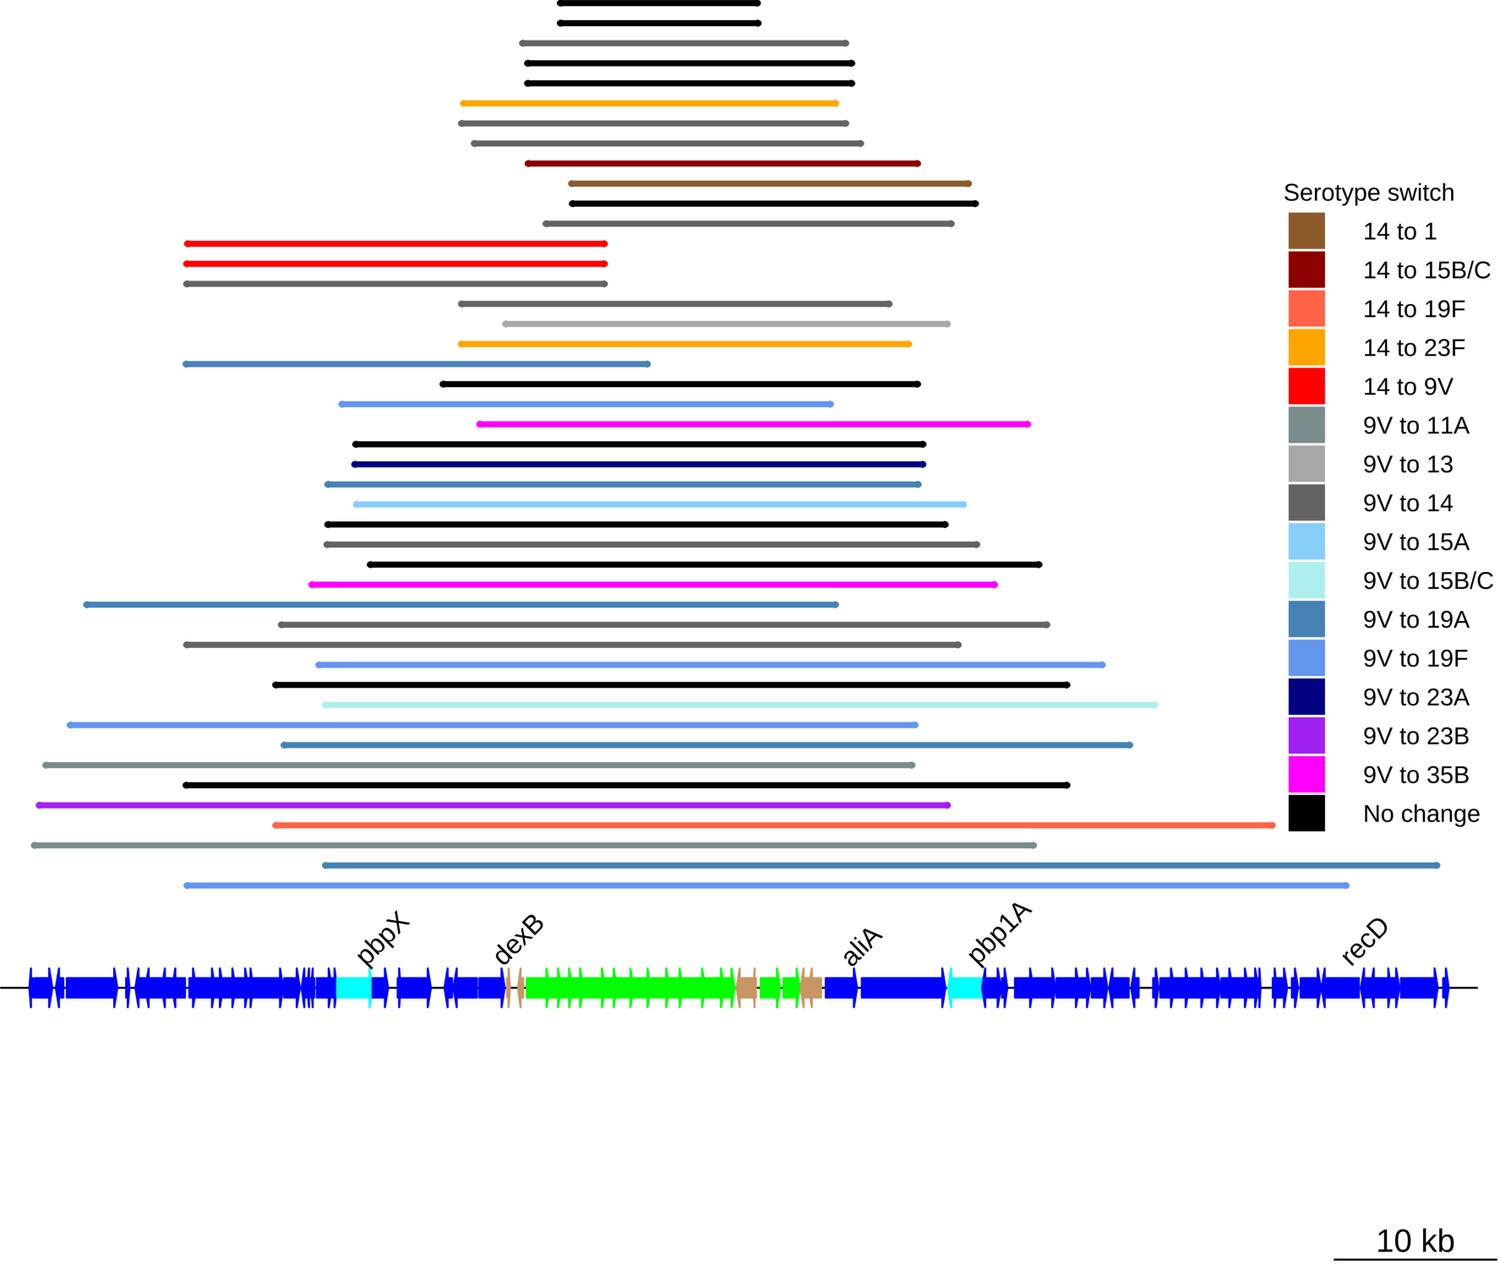
Serotype switching events across the PMEN3 lineage.
Colored bars represent the recombination events associated with switches in serotype inferred from the phylogeny. The bars map to the genome annotation below, with the length of the bar indicating the size of the recombination event. The cps and surrounding loci are annotated at the bottom. Some recombination events span the pbp1a and pbp2x genes, as well as the cps locus itself. The black bars represent recombinations across the cps loci that were not associated with a serotype switch.
Figure 2 with 2 supplements
Phylogenomic analysis of PMEN9 lineage.
(A) Maximum likelihood phylogeny generated from the nonrecombinant regions of a whole-genome alignment of 575 isolates from the PMEN9 lineage. Branches are colored by clade, as identified in the key. Units for the scale bar are the number of point mutations along a branch. (B) Bars highlighting the country of origin; serotype; resistance to penicillin, trimethoprim, and sulfamethoxazole, and the presence of the mobile genetic elements (MGEs) Tn1207.1 and Tn916 among isolates. The abbreviated resistance phenotypes are resistant (R), intermediate-level resistant (I), and susceptible (S). Bars map across to isolates on the phylogeny. (C) Simplified annotated genome of the PMEN9 reference isolate INV200. The highlighted regions correspond to peaks of recombination event frequency. Blue bars represent individual genes annotated within the assembly. (D) Distribution of recombination events across the PMEN9 lineage. In the upper half of the graph, red bars indicate recombination events occurring on internal nodes in the tree, which were subsequently inherited by multiple descendant isolates. These bars are aligned with isolates in the phylogeny in section A and map to regions in the genome annotated in section C. Blue bars indicate recombination events on terminal nodes of the tree, occurring in only one isolate. In the bottom half of the graph, the line represents the frequency of recombination events along the genome’s length.
Figure 2—figure supplement 1
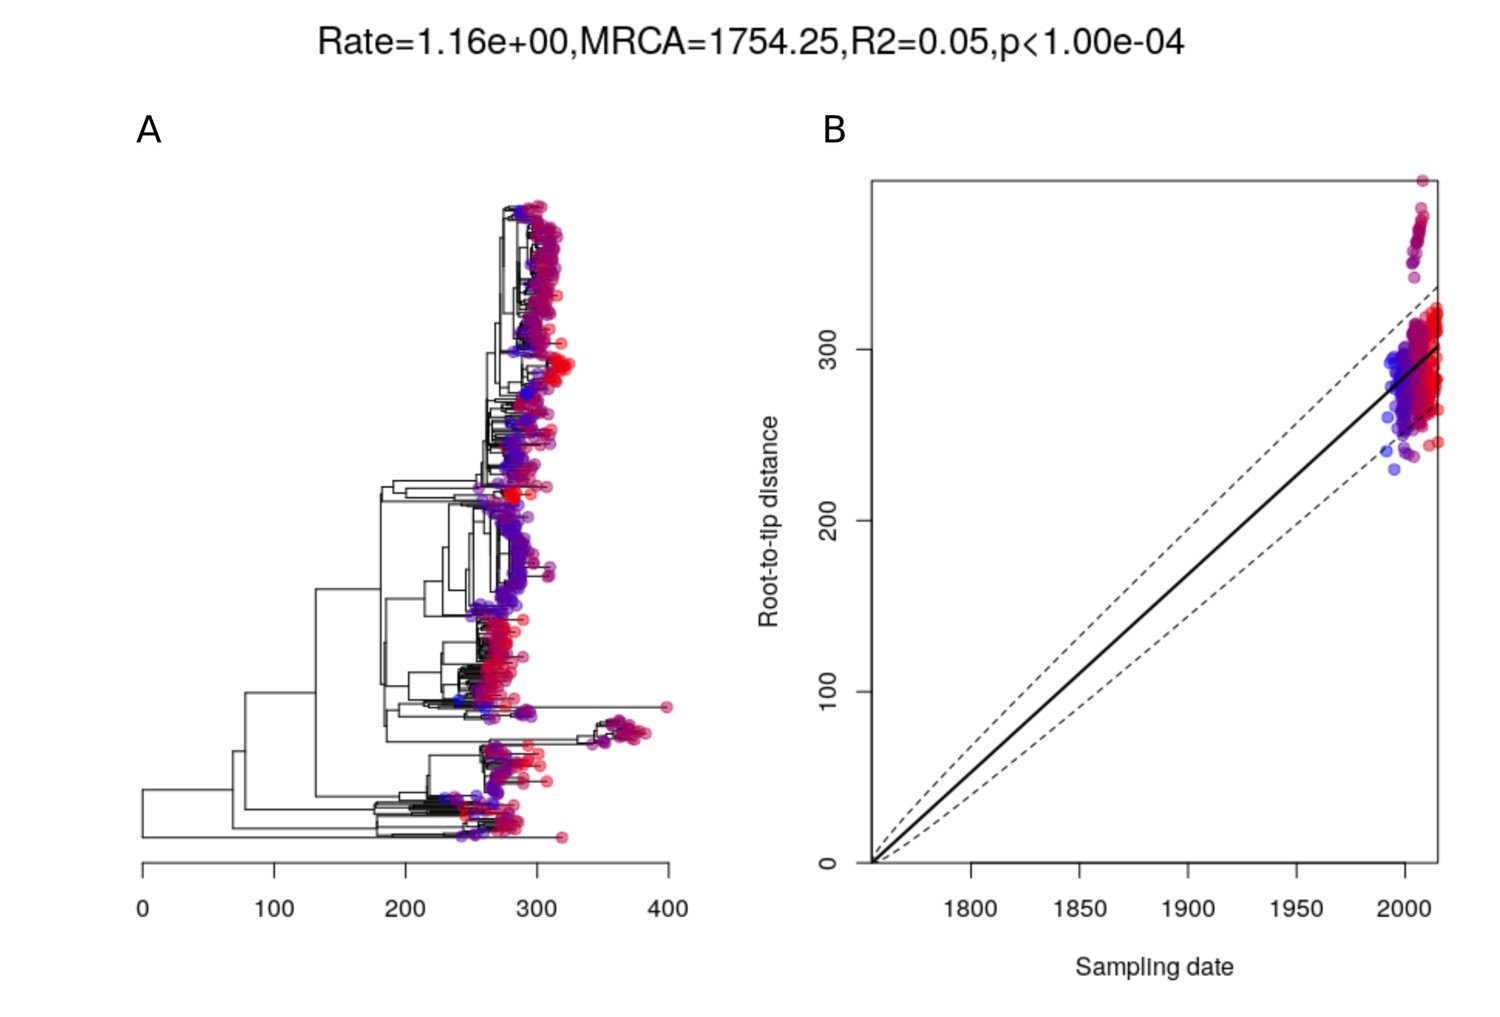
Root-to-tip analysis of PMEN9 lineage.
(A) The 529-isolate phylogeny of PMEN9, with node tips colored by date of isolation. The tree is topologically identical to that in Figure 2, except that isolates for which the dates of isolate were unknown, and a divergent clade of isolates of serotype 7C and 19A, were omitted. (B) Linear regression of root-to-tip distance against sampling date for isolates.
Figure 2—figure supplement 2
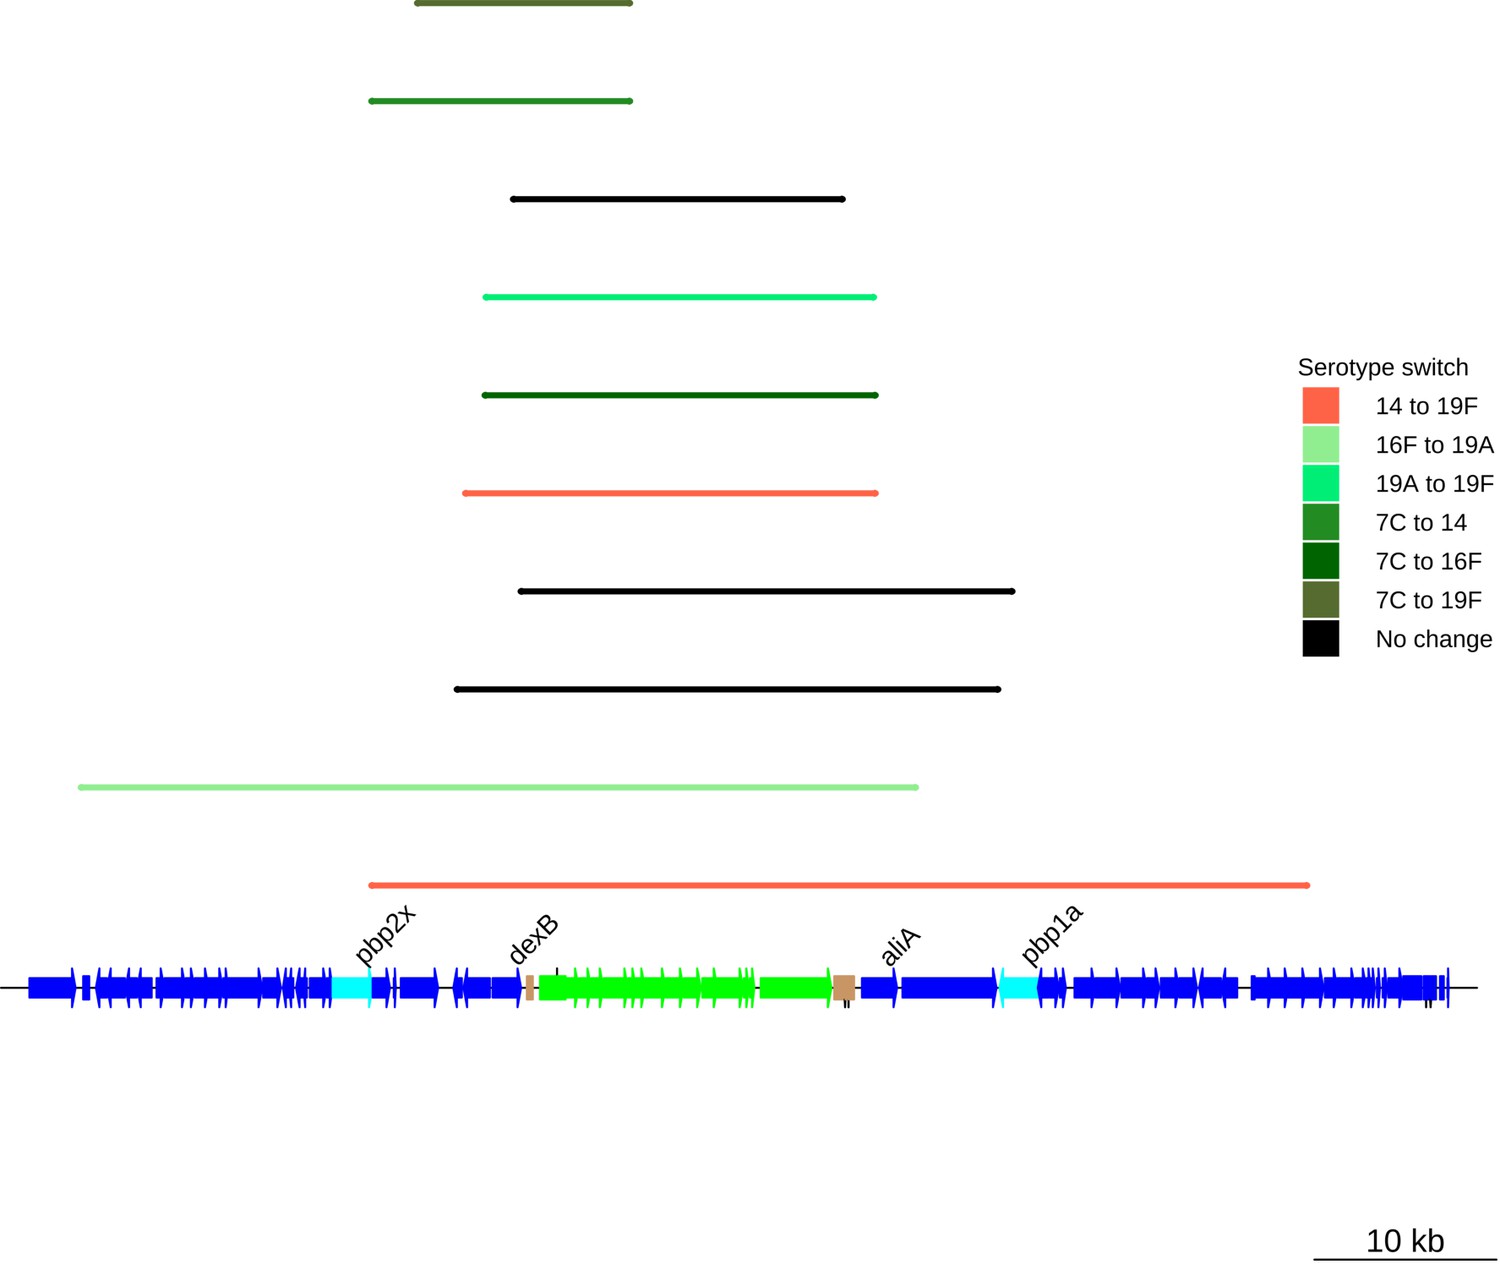
Serotype switching events across the PMEN9 lineage.
Colored bars represent the recombination events associated with switches in serotype. The bars map to the genome annotation below, with the length of the bar indicating the size of the recombination event. The cps and surrounding loci are annotated at the bottom. Some recombination events span the pbp1a and pbp2x genes, as well as the cps locus itself. The black bars represent recombinations across the cps locus that were not associated with a serotype switch.
Figure 3
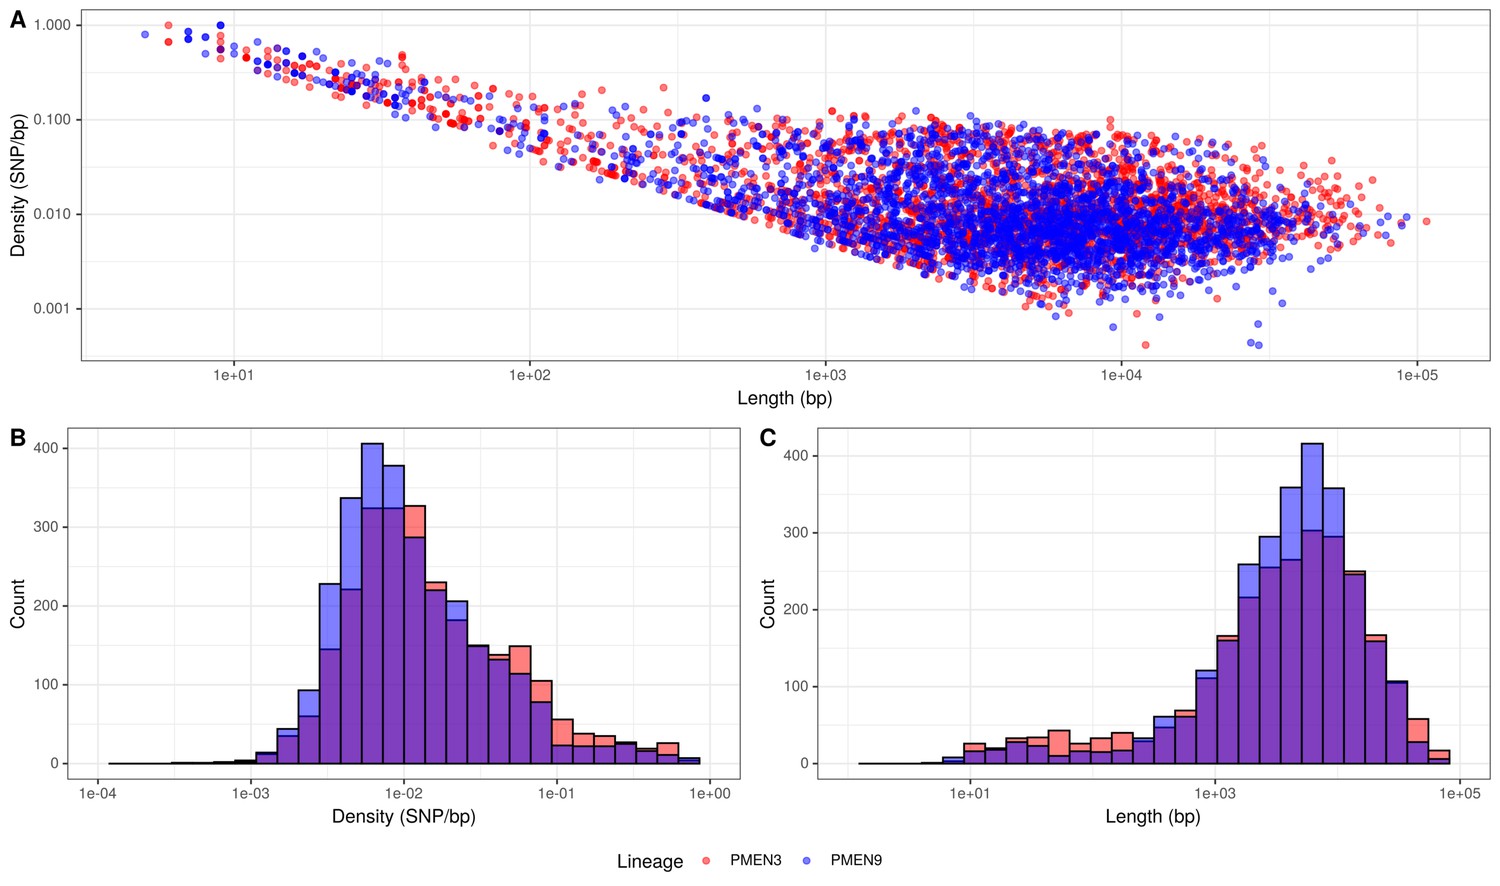
Summary of recombination differences between the PMEN3 and PMEN9 lineages.
(A) Plotting the SNP density of recombination events relative to their length across both lineages. Dots represent individual recombination events and are colored by the lineage in which they were inferred. (B) Overlaid histograms of the SNP densities of recombination events across PMEN3 and PMEN9. (C) Overlaid histograms of the length, in bases, of each recombination event across PMEN3 and PMEN9.
Figure 4 with 4 supplements
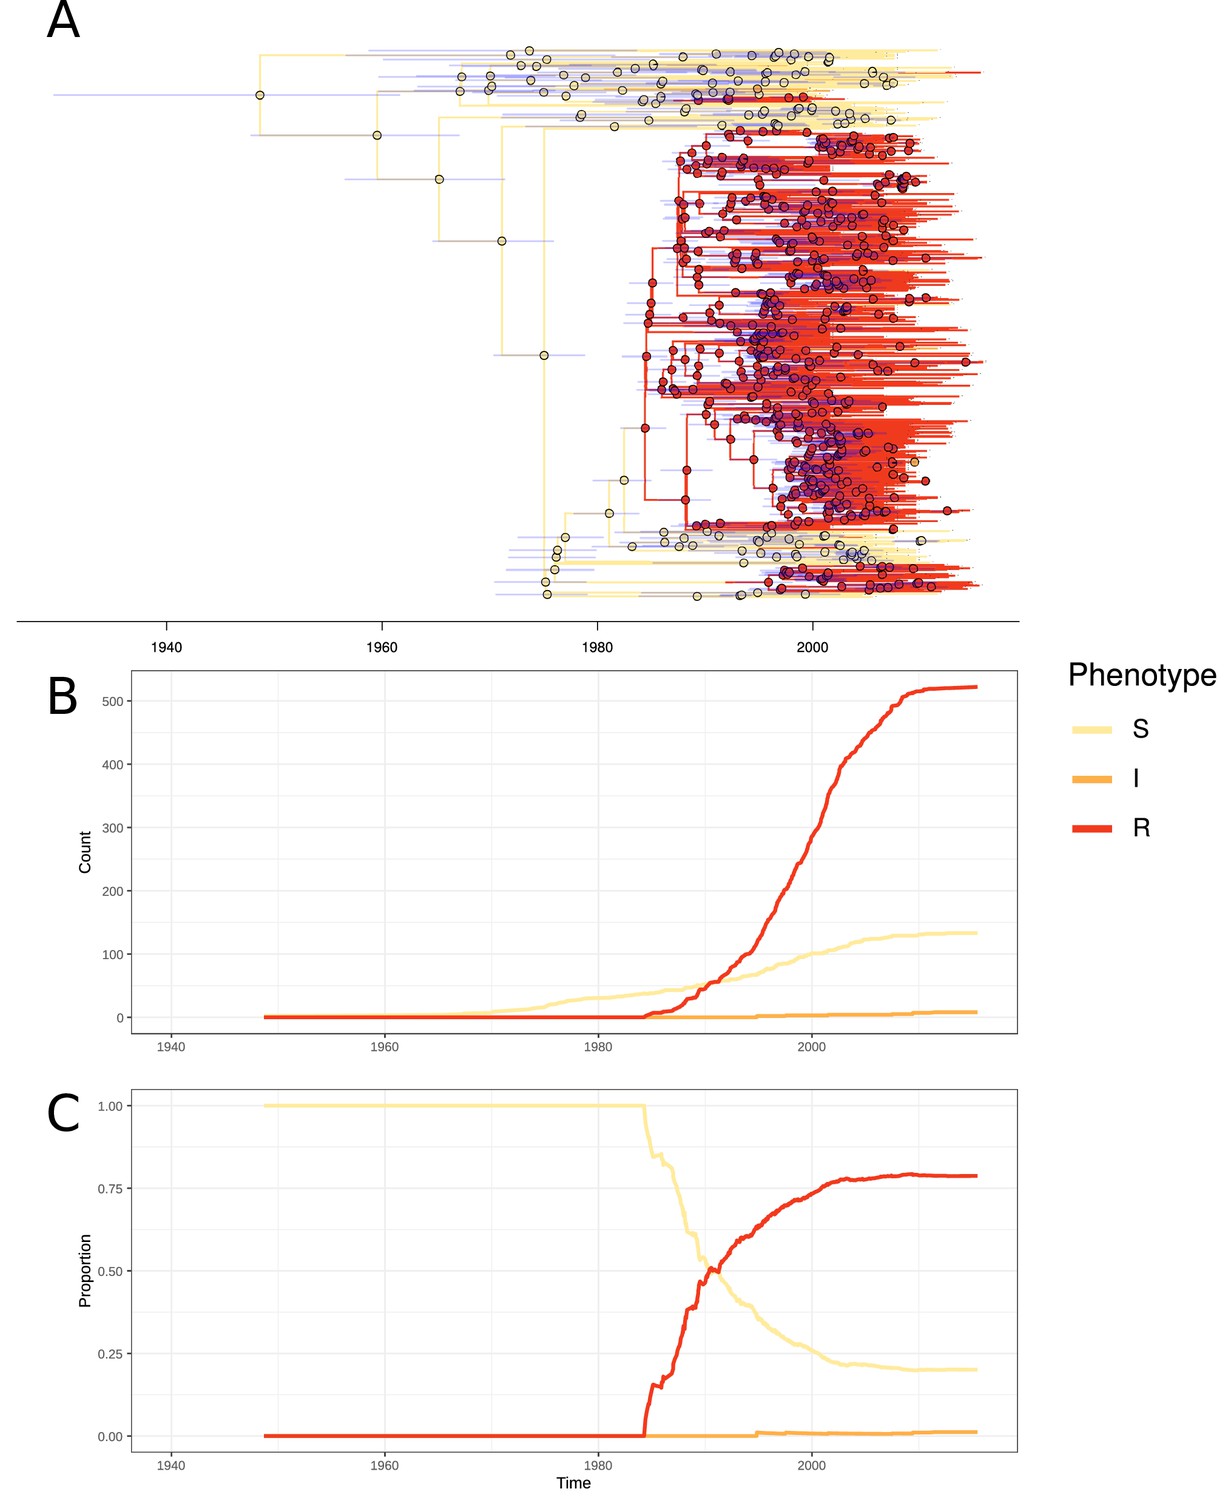
Emergence of resistant lineages within PMEN3 through time.
(A) Time-calibrated phylogeny of PMEN3. Branches are colored by inferred resistance phenotype. Pie charts present at nodes represent the inferred probability of each phenotype by an ancestral reconstruction. Blue bars across the nodes represent the 95% credible interval for the age of the node. (B) The reconstructed absolute number of branches per resistant phenotype through time. (C) The proportion of total branches over time reconstructed as having each of the resistance phenotypes.
Figure 4—figure supplement 1
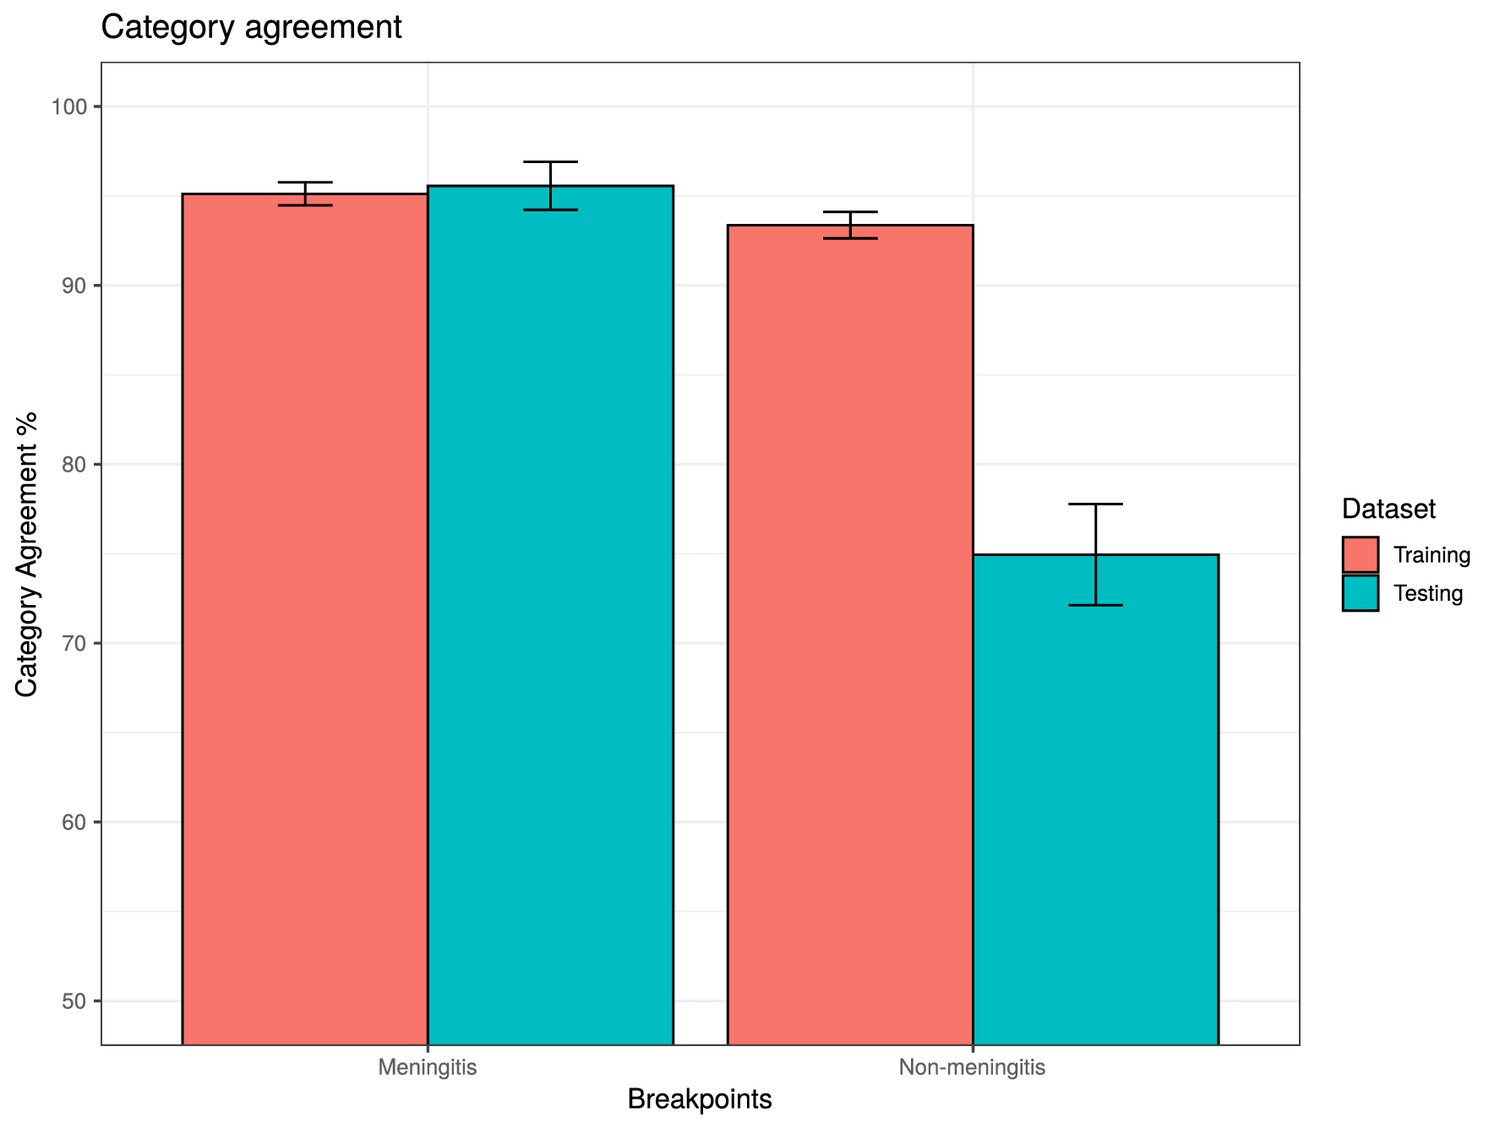
Comparisons of category agreement across different penicillin resistance breakpoints.
The minimum inhibitory concentrations (MICs) of each isolate in the PMEN collection were predicted using a random forest (RF) model trained on a 4342-isolate CDC dataset. These MICs were then assigned to resistance phenotypes using two different sets of breakpoints. The 903 PMEN lineage isolates with available MIC data were used as a test dataset to validate the predictions. Bars represent the category agreement (the number of categories correctly predicted across the testing or training dataset) for the two breakpoint sets.
Figure 4—figure supplement 2
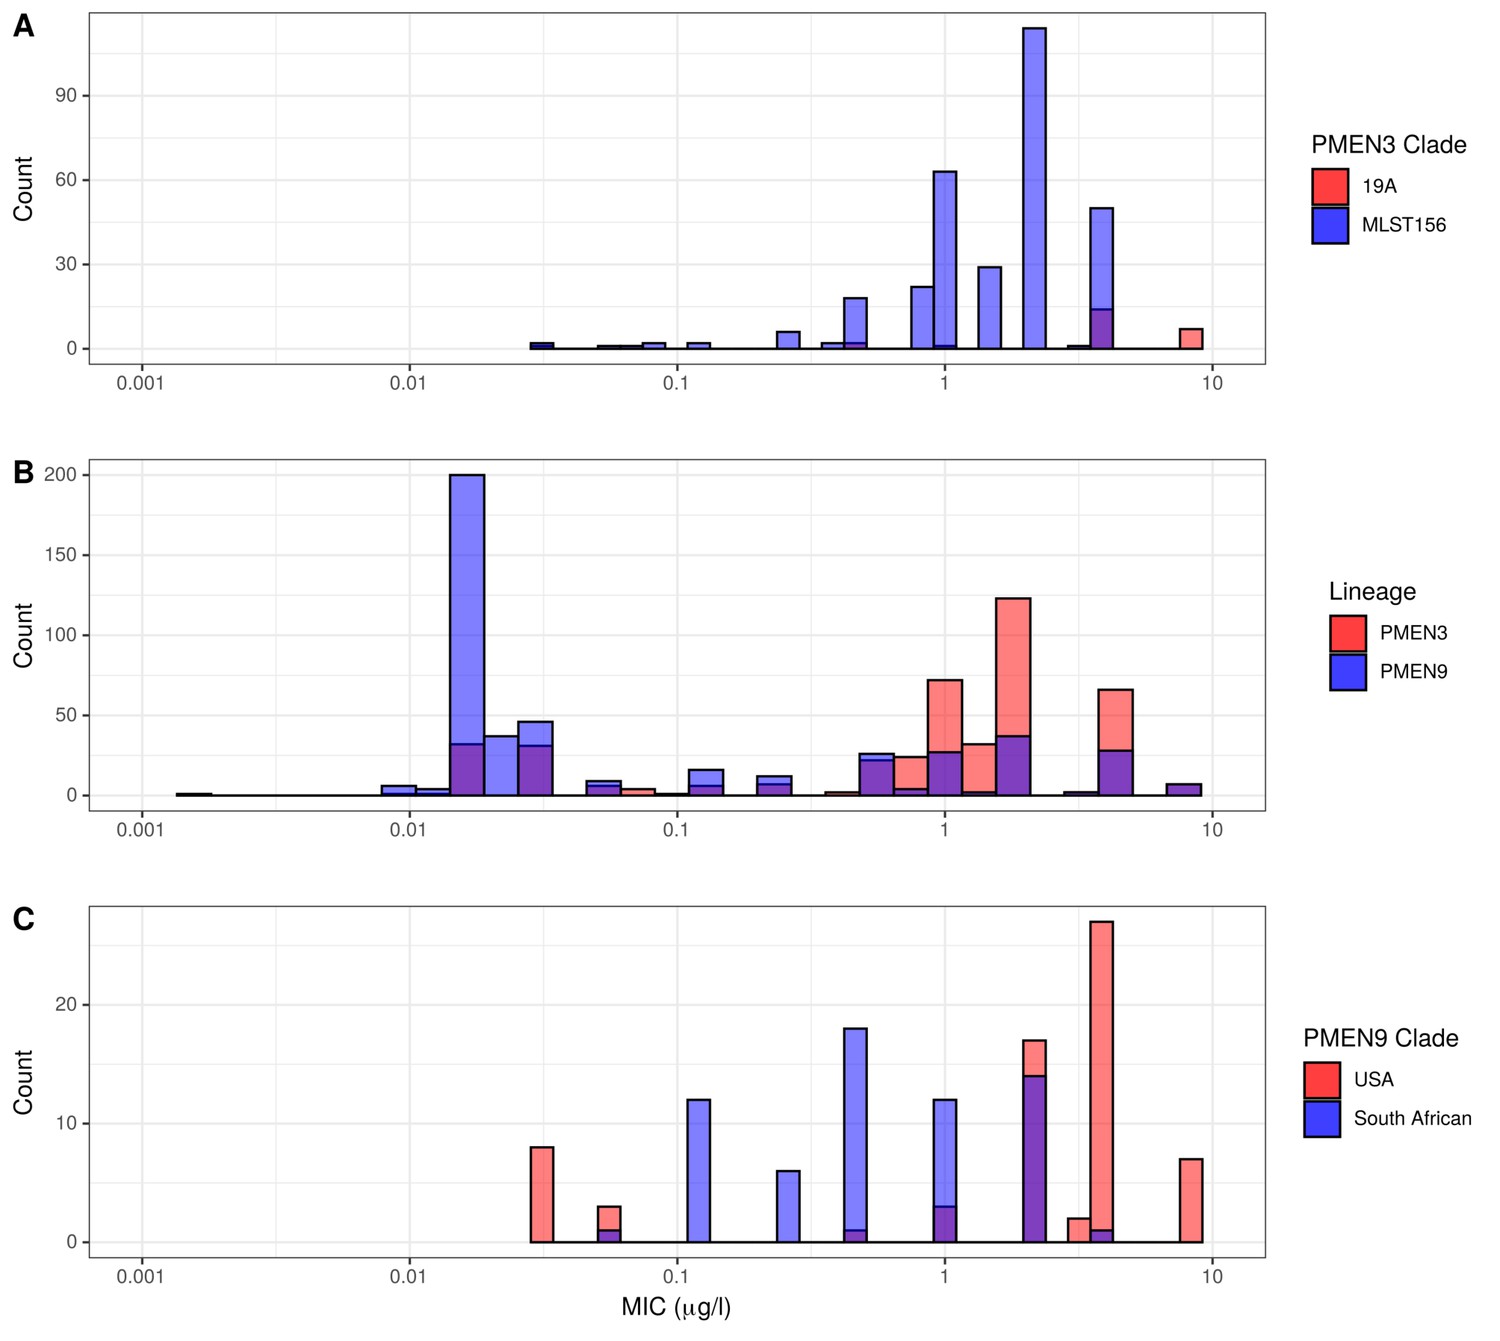
Histograms of recorded minimum inhibitory concentration (MIC) values for penicillin across the PMEN3 and PMEN9 lineages.
(A) MIC values for penicillin for the primarily-resistant clades ST156 and 19A within the PMEN3 lineage (N = 313 for the ST156 clade and N = 25 for the 19A clade). (B) MIC for penicillin across both PMEN3 and PMEN9 (N = 438 for PMEN3 and N = 465 for PMEN9). (C) MIC values for penicillin for the primarily resistant USA and South African clades within the PMEN9 lineage (N = 68 for the USA clade and N = 64 for the South African clade).
Figure 4—figure supplement 3
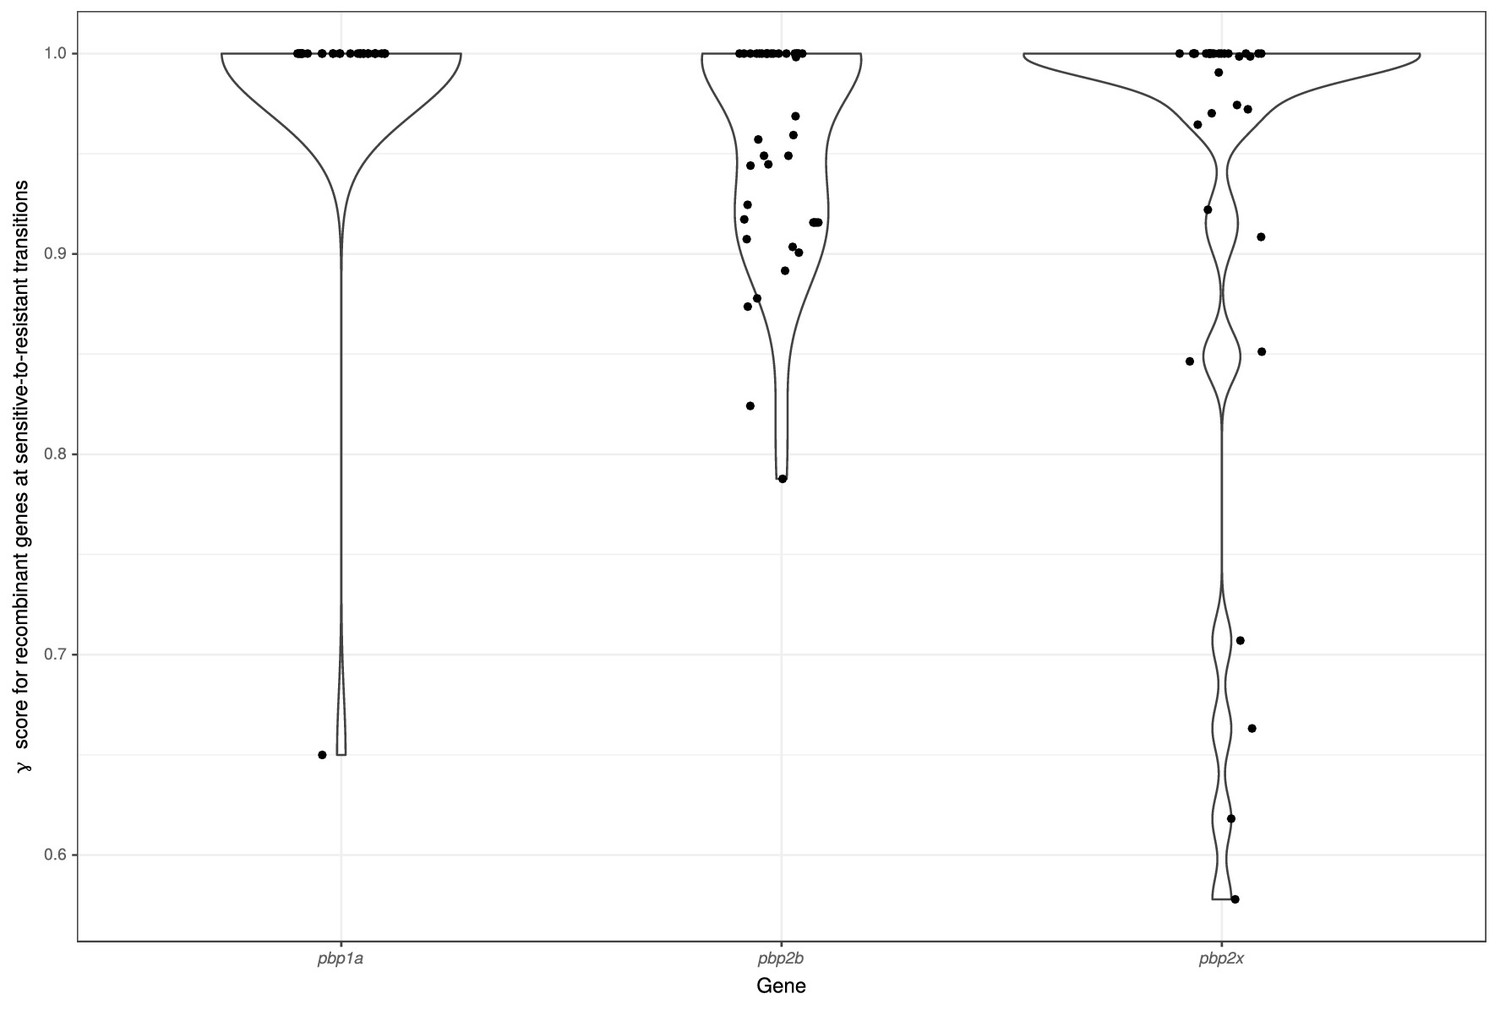
Origin of pbp genes for penicillin-resistant isolates.
Scatterplot and violin plot depicting the distribution of γ scores for pbp gene sequences within the GPS collection, where these genes were present within an homologous recombination associated with a gain of resistance to penicillin. Dots represent the individual observations of γ scores, and the violin plot summarizes their overall distribution.
Figure 4—figure supplement 4
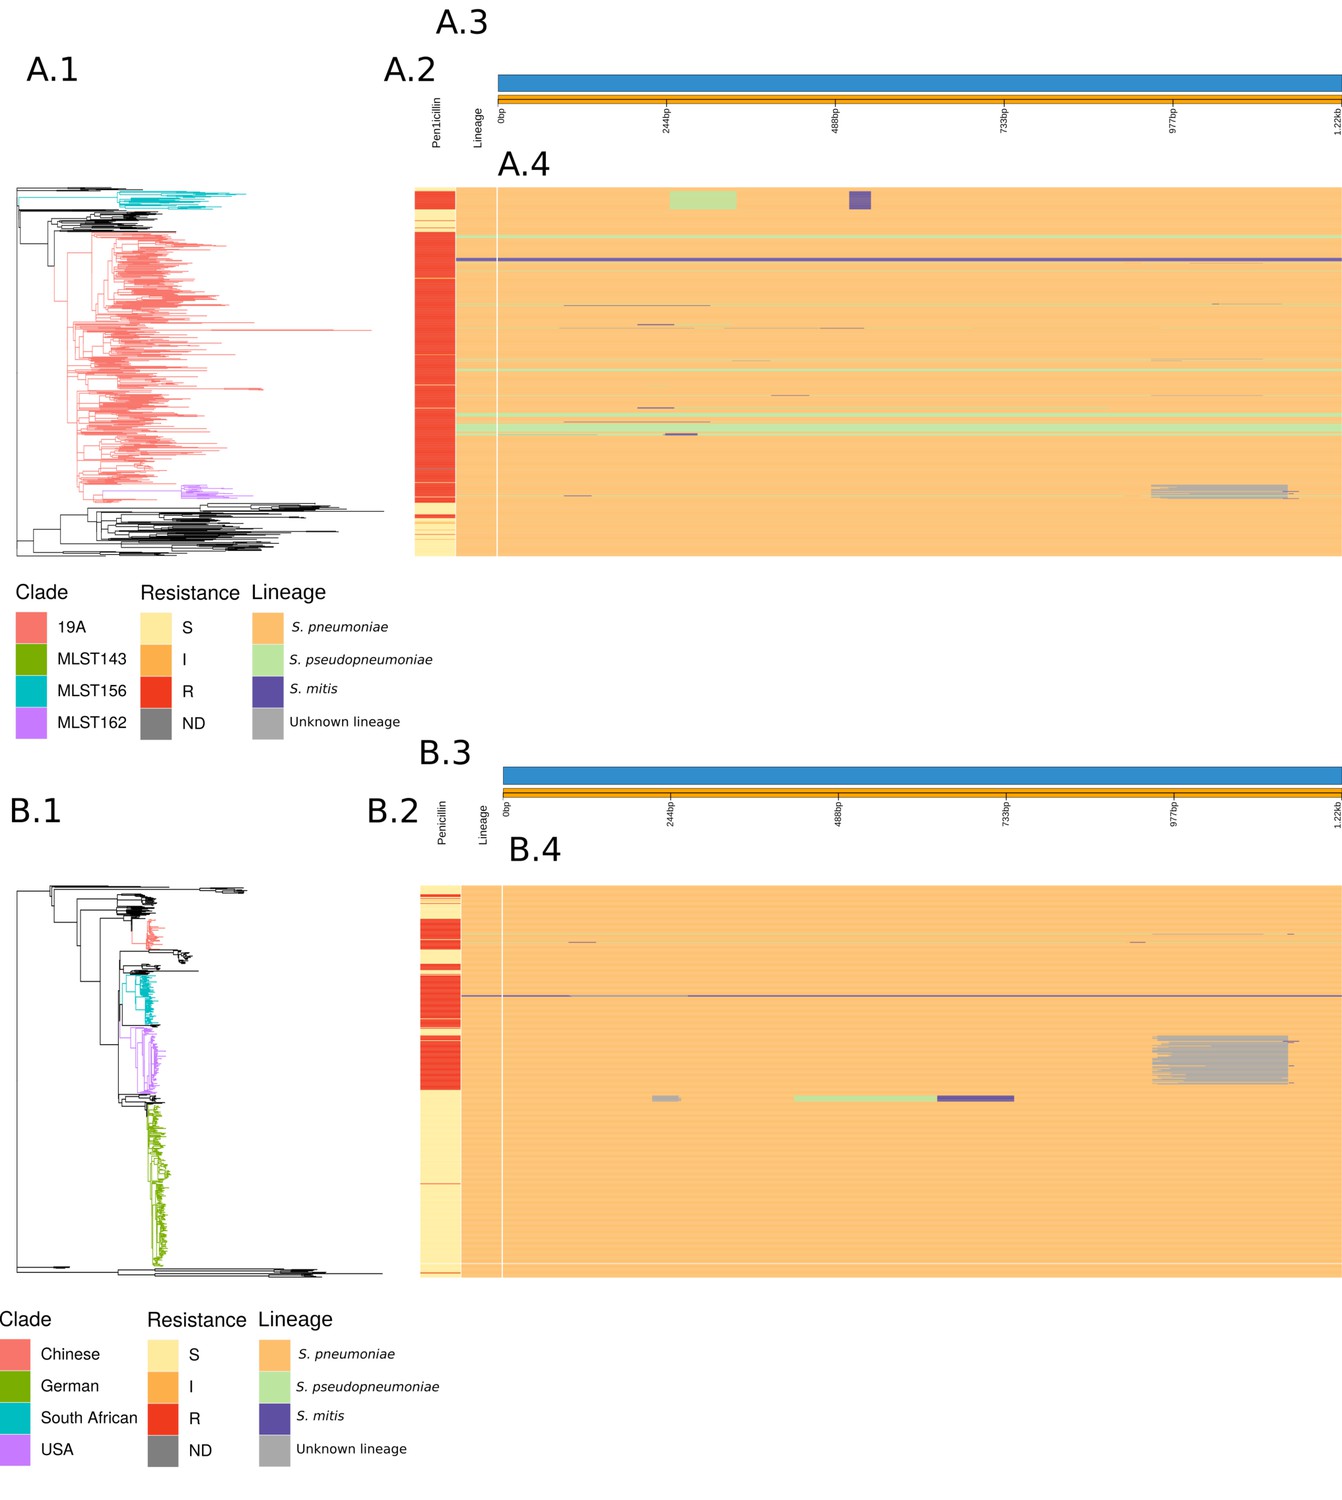
Analysis of the origin of the murM gene across the PMEN3 and PMEN9 lineages.
(A.1) The whole-genome phylogeny of the PMEN3 lineage, as shown in Figure 1, with branches colored by clade of interest, as described in the main text. (A.2) Bars indicating the penicillin resistance category of isolates, and the lineage inferred for the murM gene of each isolate. (A.3) Representation of the murM gene. (A.4) This panel shows the inferred lineage for each base of the murM sequence across the PMEN3 phylogeny. Solid unbroken horizontal bars indicate sequences belonging to a particular lineage, as indicated by the color. Changes in colour across a bar indicate different murM segments were inferred to originate in different lineages, suggesting a mosaic allele generated by recombination. (B.1) Recombination-corrected whole-genome phylogeny of the PMEN9 lineage, as shown in Figure 2, with branches colored by clade of interest. (B.2) Bars indicating the penicillin resistance category of isolates and the overall lineage inferred for the murM gene of each isolate. (B.3) Representation of the murM gene. (B.4) This panel shows the inferred lineage for each base of each murM sequence across the PMEN9 phylogeny, as in panel (A.4).
Figure 5 with 5 supplements
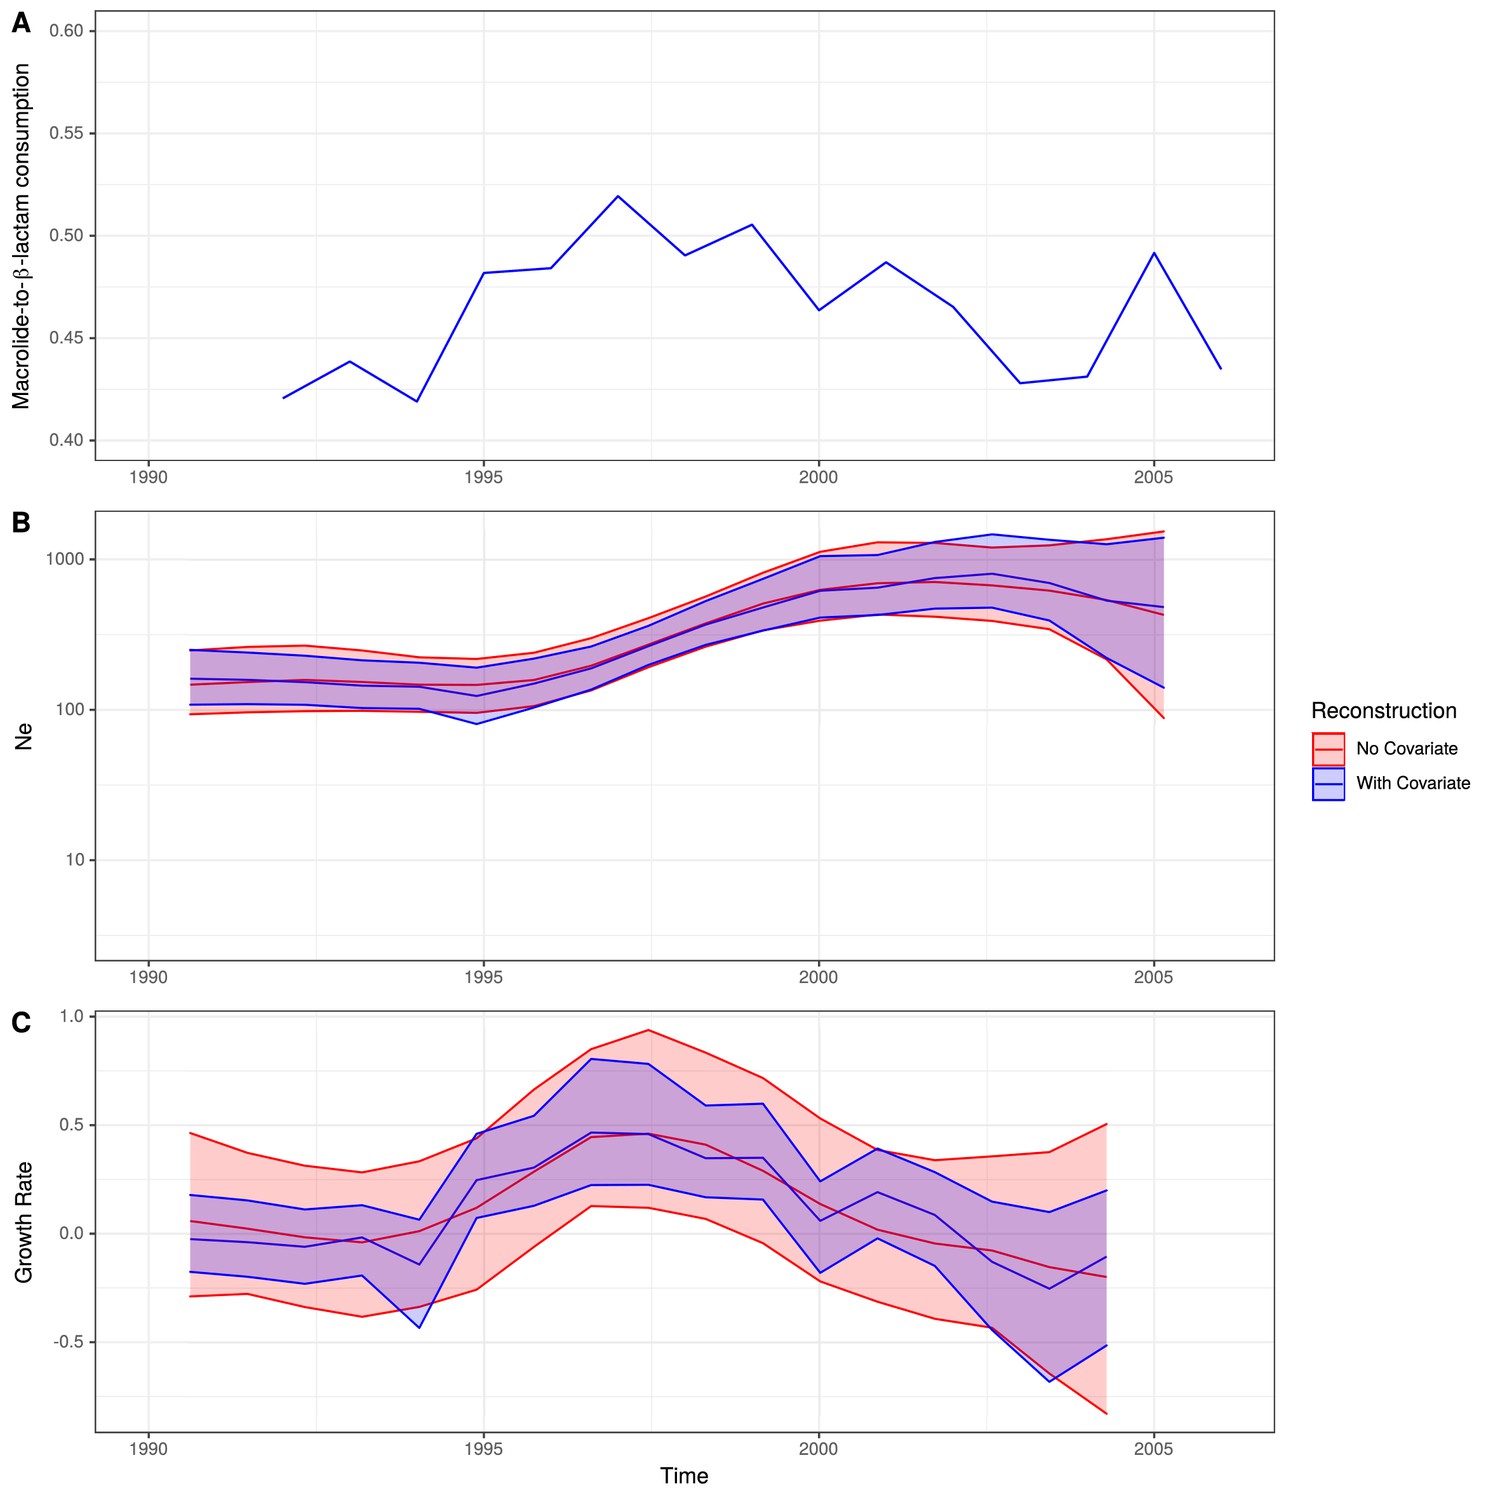
Expansion of a macrolide-resistant clade in Germany prior to vaccine introduction.
(A) The ratio of macrolide-to-β-lactam consumption in Germany. (B) The change in Ne through time inferred by Skygrowth, with the red line showing the results of the analysis that did not include covariates, and the blue line showing the results of the analysis that incorporated the macrolide-to-β-lactam ratio into the phylodynamic reconstruction. Shaded regions represent the 95% credible intervals. (C) The reconstruction of the growth rate of Ne through time. The red line represents the result of model fitting without covariates, and the blue line when the macrolide-to-β-lactam ratio data were incorporated. Shaded regions represent the 95% credible interval for the reconstruction.
Figure 5—figure supplement 1
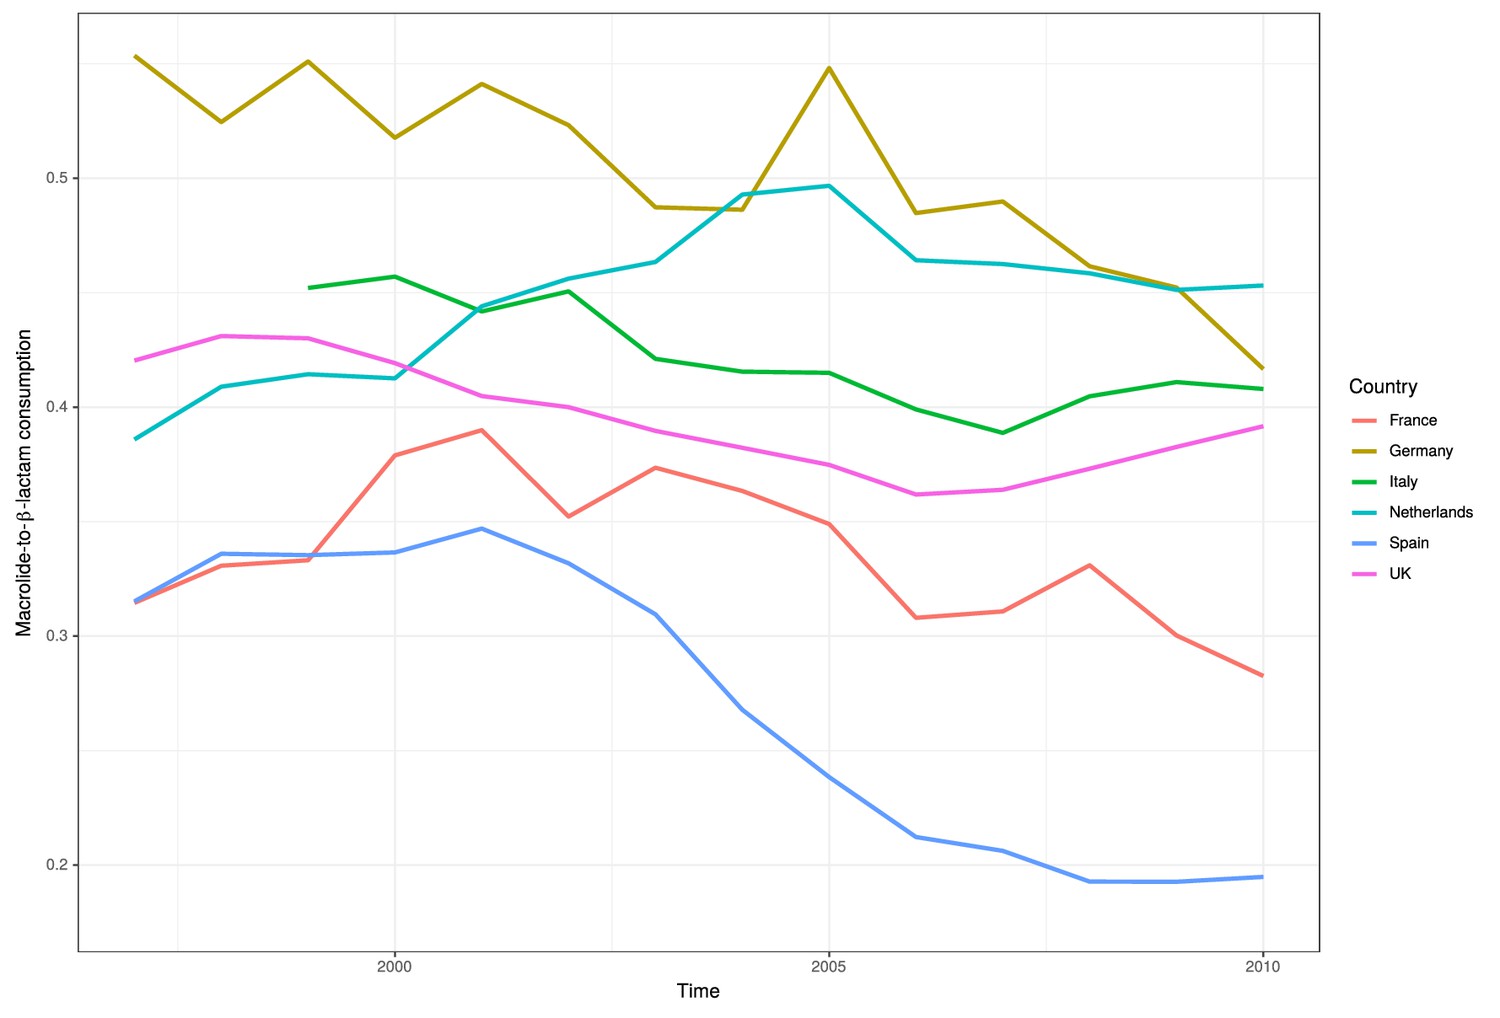
Ratio of macrolide-to-β-lactam consumption in Europe.
The ratios of macrolide use, in DDD, for β-lactam use for six major European countries between 1997 and 2010.
Figure 5—figure supplement 2
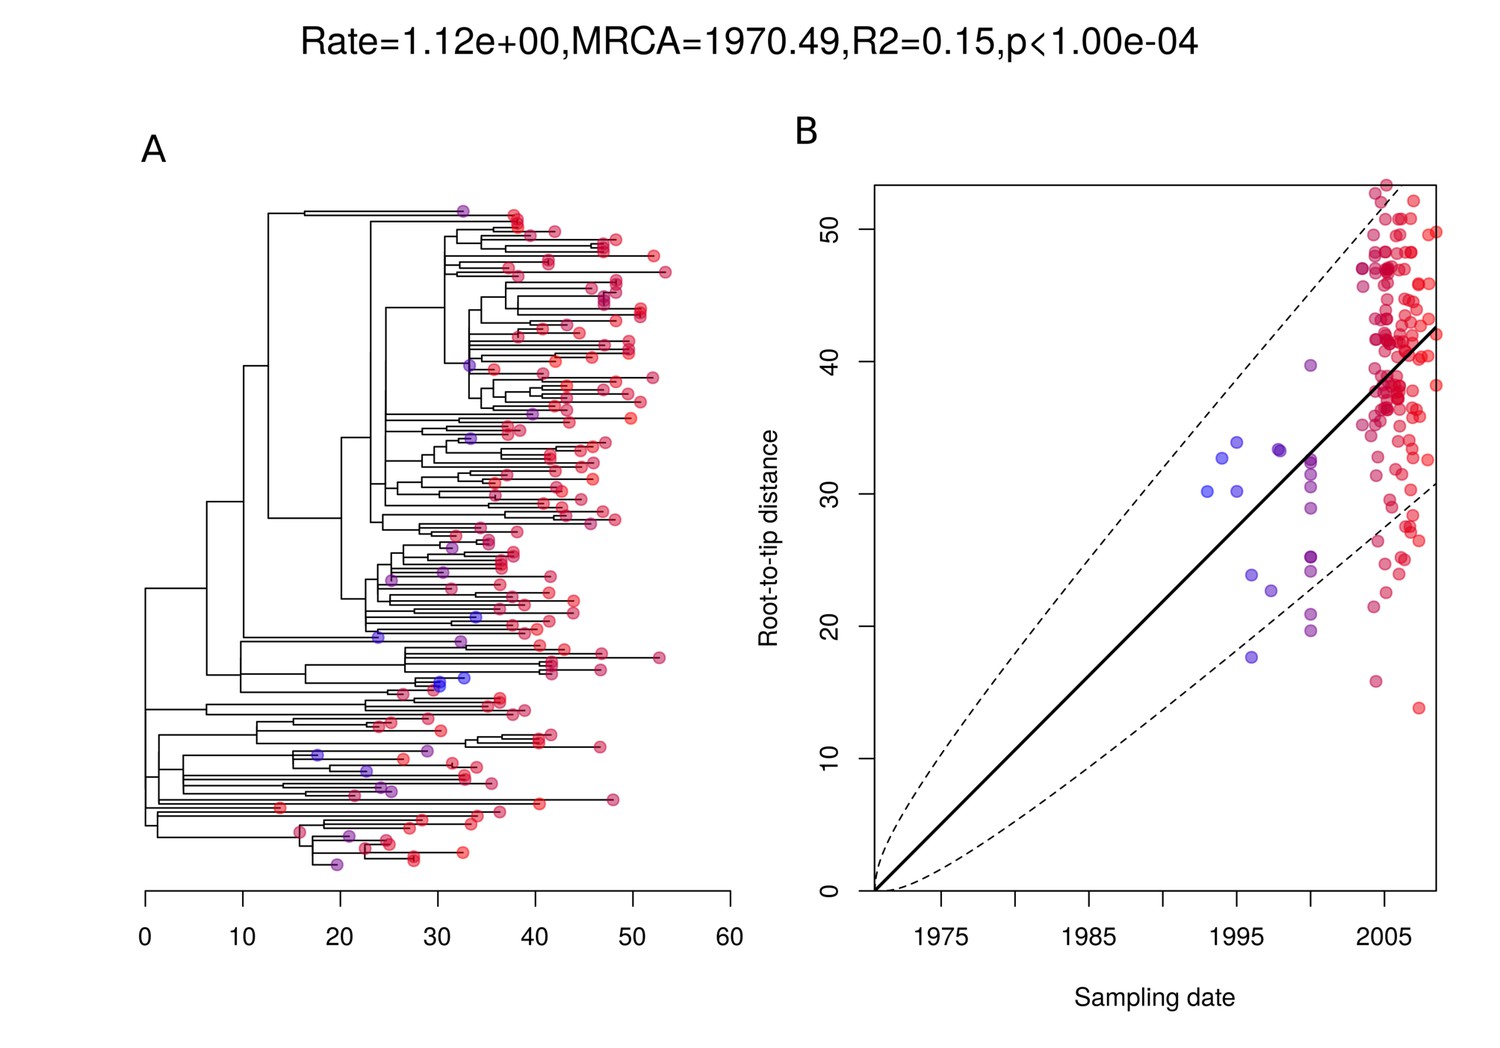
Root-to-tip analysis of 162 German isolates within PMEN9.
(A) The 162-isolate phylogeny with node tips colored by date of isolation. (B) Linear regression of root-to-tip distance against sampling date for isolates.
Figure 5—figure supplement 3
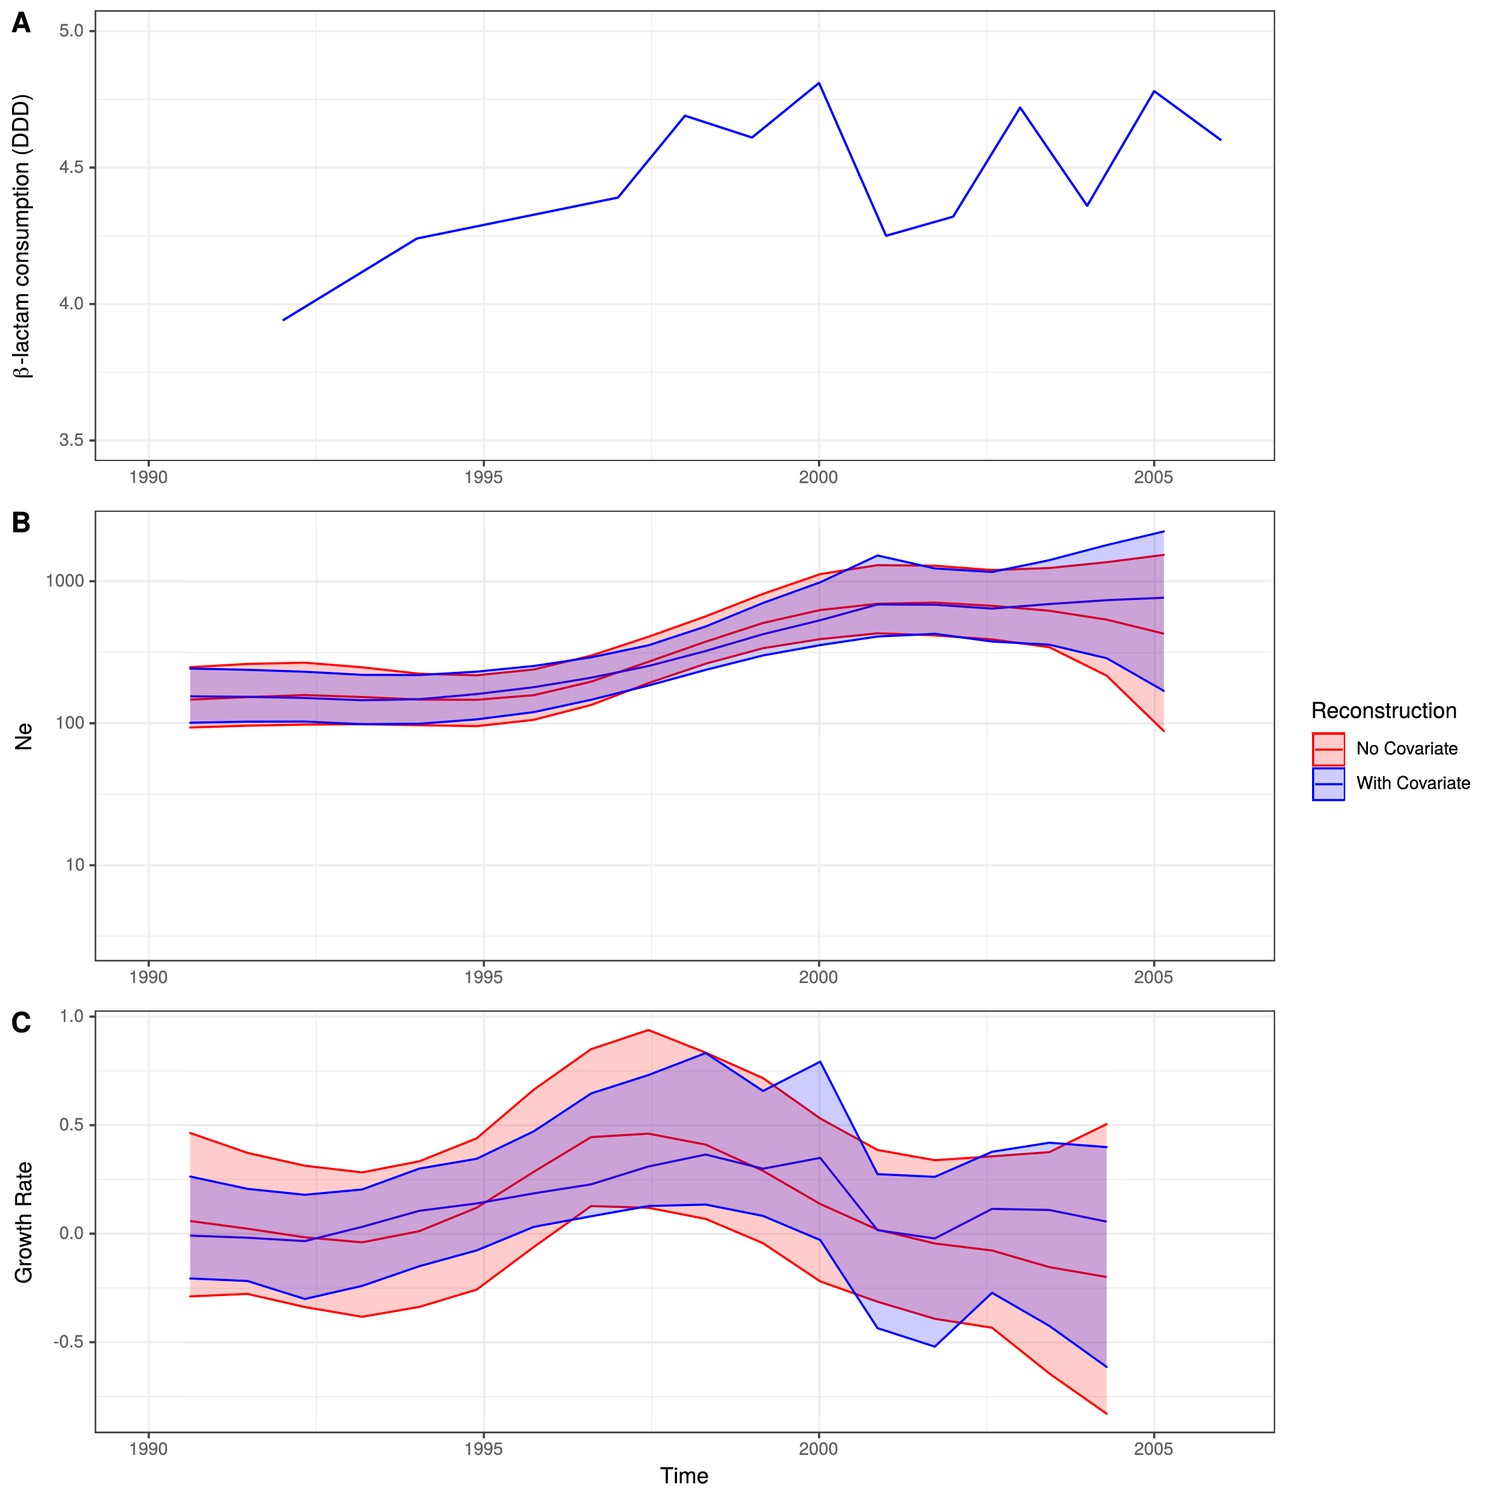
Skygrowth analysis incorporating β-lactam consumption data.
(A) The rate of β-lactam consumption in Germany in DDD. (B) The change in Ne through time inferred by Sygrowth, with the red line showing the results when no covariates were incorporated, and the blue line showing the equivalent results when β-lactam consumption data were incorporated into the reconstruction. Shaded regions represent the 95% credible intervals. (C) The reconstruction of the growth rate of Ne through time. The red line represents the result of model fitting without covariates, and the blue line shows the results when β-lactam consumption data were incorporated. Shaded regions represent the 95% credible intervals for the reconstructions.
Figure 5—figure supplement 4
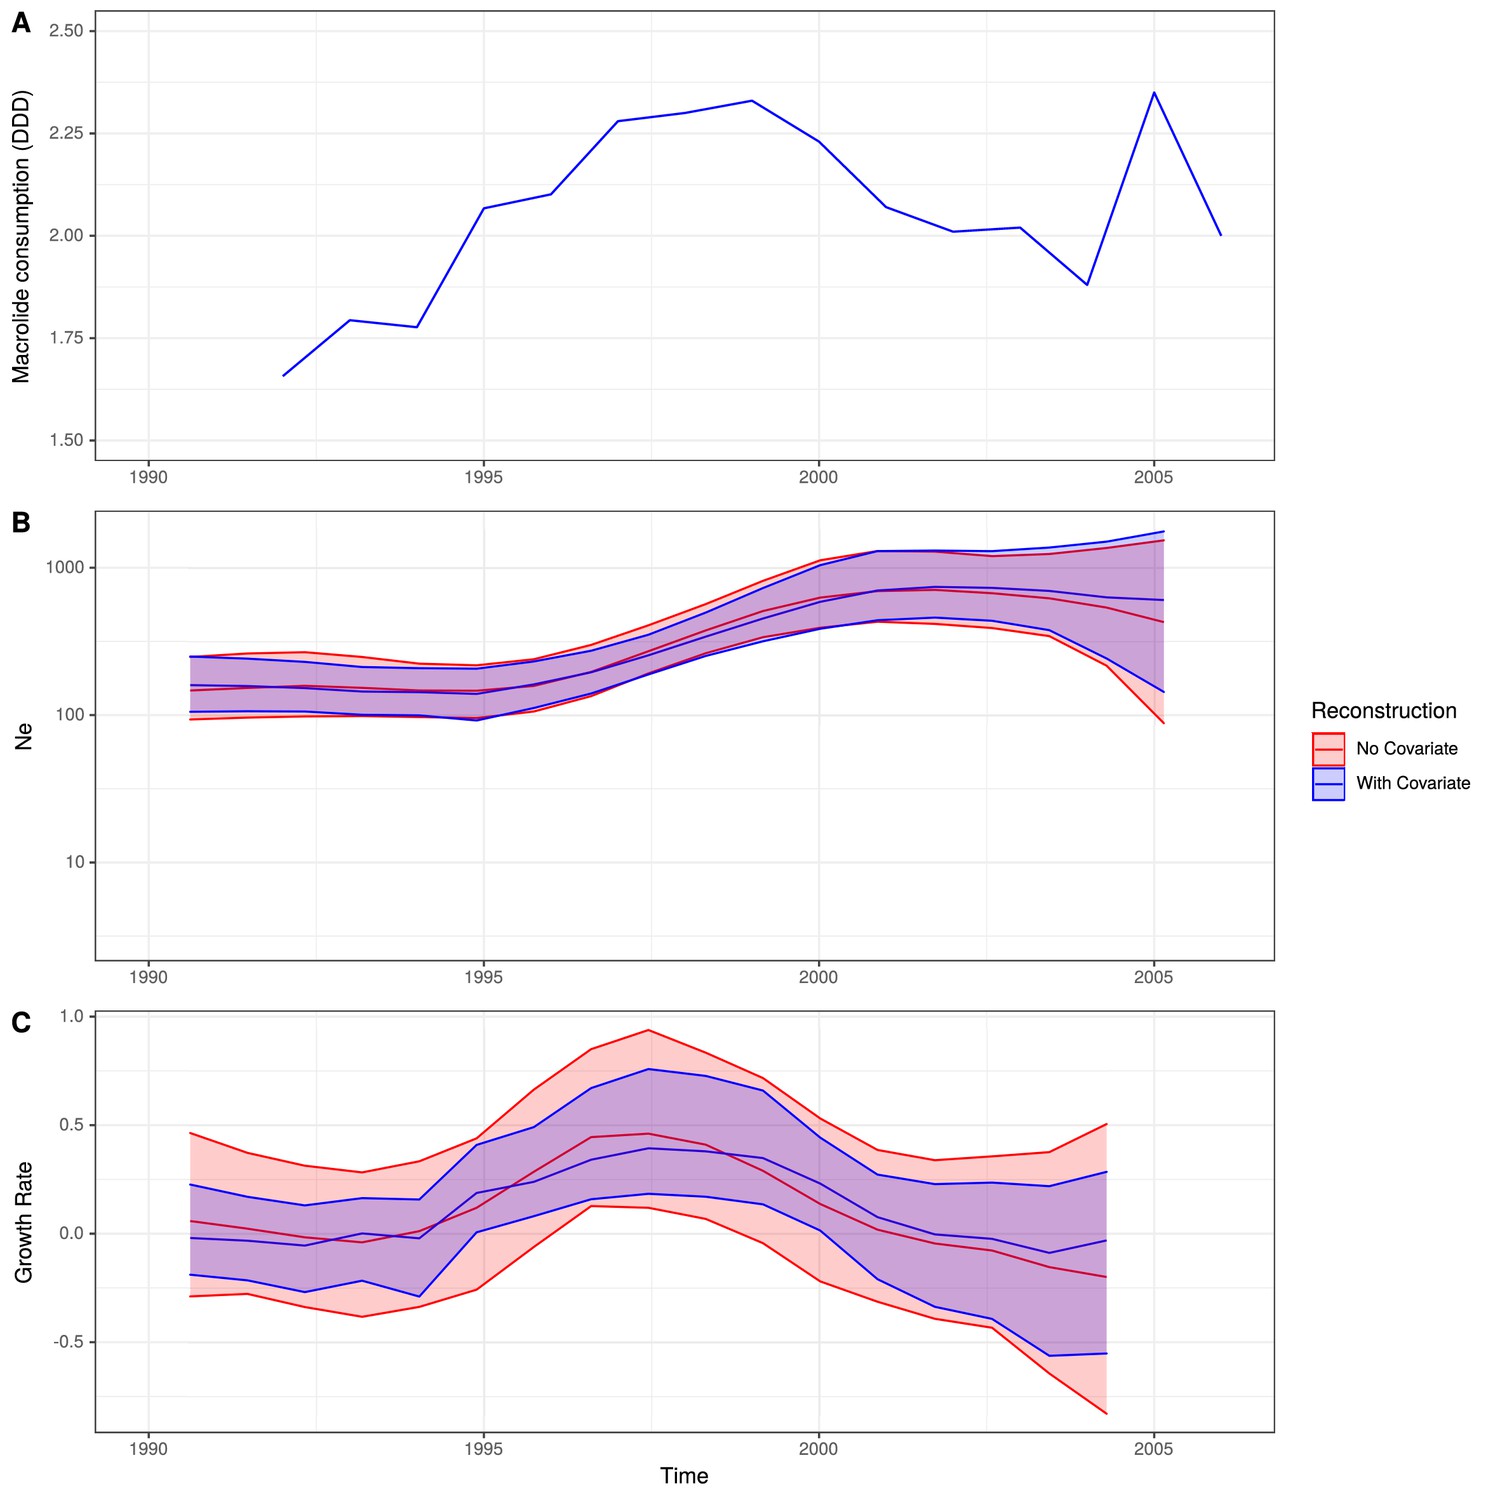
Skygrowth analysis incorporating macrolide consumption data.
(A) The rate of macrolide consumption in Germany in DDD. (B) The change in Ne through time inferred by Skygrowth, with the red line representative of when no covariates were incorporated into the reconstruction and the blue line when the macrolide conusmption data were incorporated into the reconstruction. Shaded regions represent the 95% credible intervals. (C) The reconstruction of the growth rate of Ne through time. The red line represents the result of model fitting without covariates, and the blue line shows the results when the macrolide consumption data were incorporated. Shaded regions represents the 95% credible interval for the reconstructions.
Figure 5—figure supplement 5
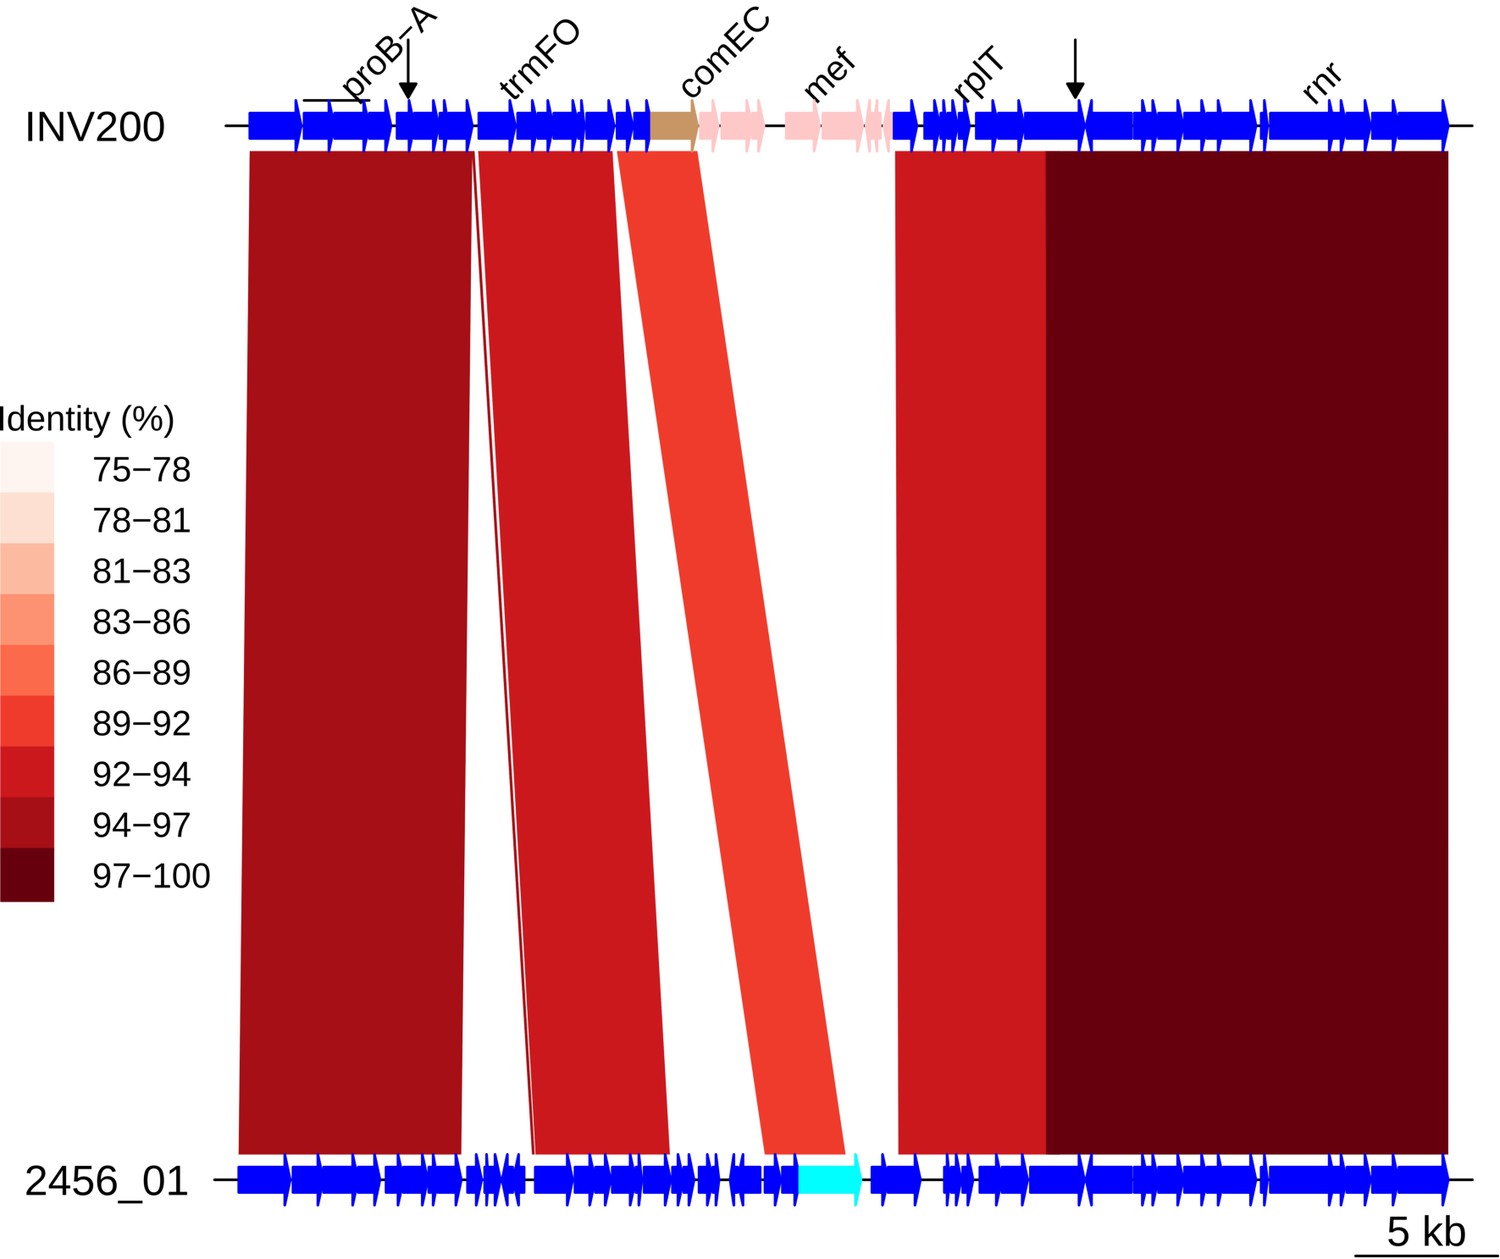
Insertion of Tn1207.1 within PMEN9 reference genome.
Comparison of the Tn1207.1 element insertion, highlighted in pink within the INV200 genome, with the orthologous unmodified locus in sample 2456_01. The red bands between the genomes represent sequence matches identified by BLASTN. These bars are shaded by the percentage identity between the sequences. The intact comEC gene is colored cyan within 2456_01, where the fragments of this gene generated by the Tn1207.1 insertion are colored brown in INV200. Arrows along the INV200 genome mark the start and end of the recombination event inferred to have imported Tn1207.1 by the phylogenetic analyses.
Figure 6 with 1 supplement
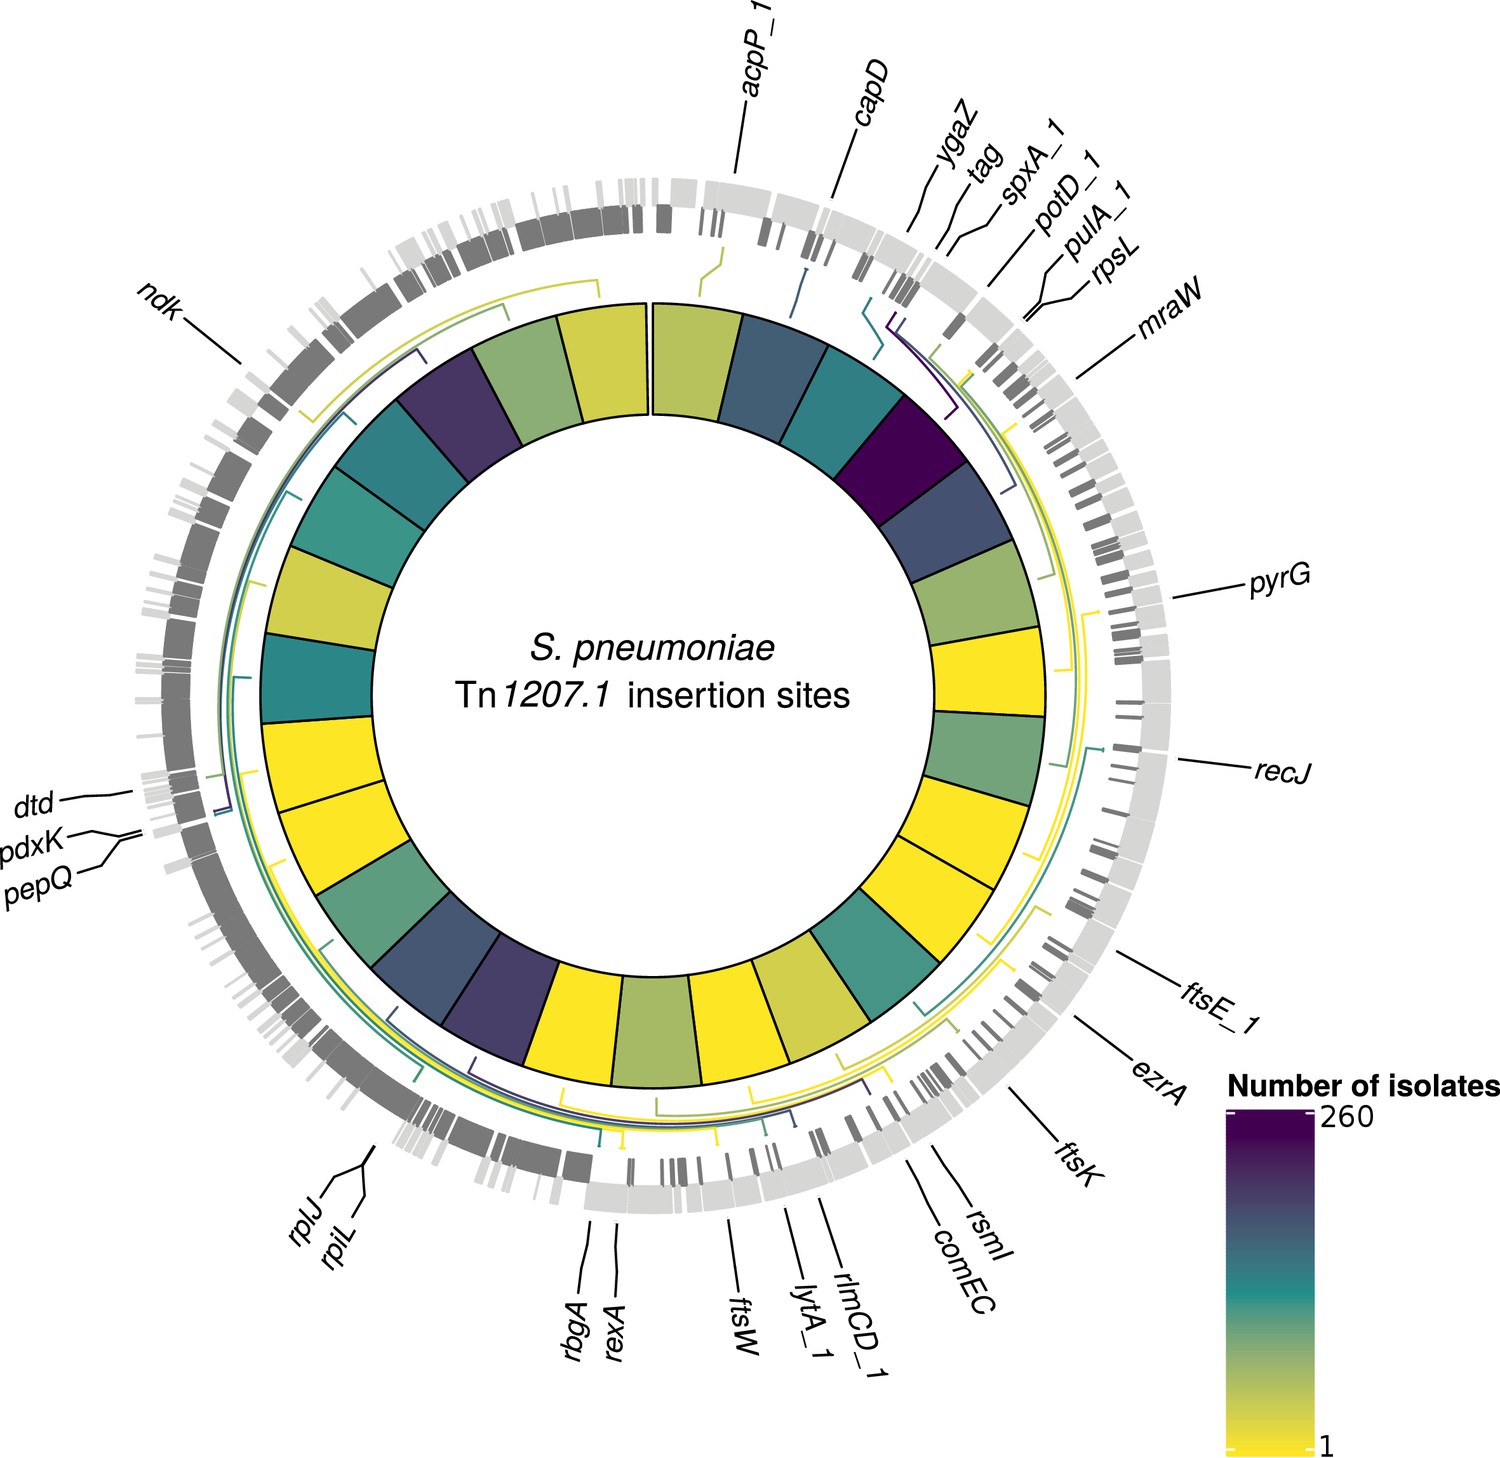
Detected insertion points of Tn1207.1-type elements within S. pneumoniae.
Genome of the reference S. pneumoniae RMV4 isolate (ENA accession code: ERS1681526) annotated with genes that Tn1207.1-type elements have inserted either into, or adjacent to, among the collection. Only genes present within this mobile genetic element (MGE)-free reference are annotated. Gray bars represent coding sequences (CDS): lighter gray bars represent CDS annotated on the forward strand of the genome, darker gray bars represent those on the reverse strand of the genome. The inner heat map represents the number of isolates that have hits inserted into, or adjacent to, the annotated genes. The color scale is logarithmically transformed.
Figure 6—figure supplement 1
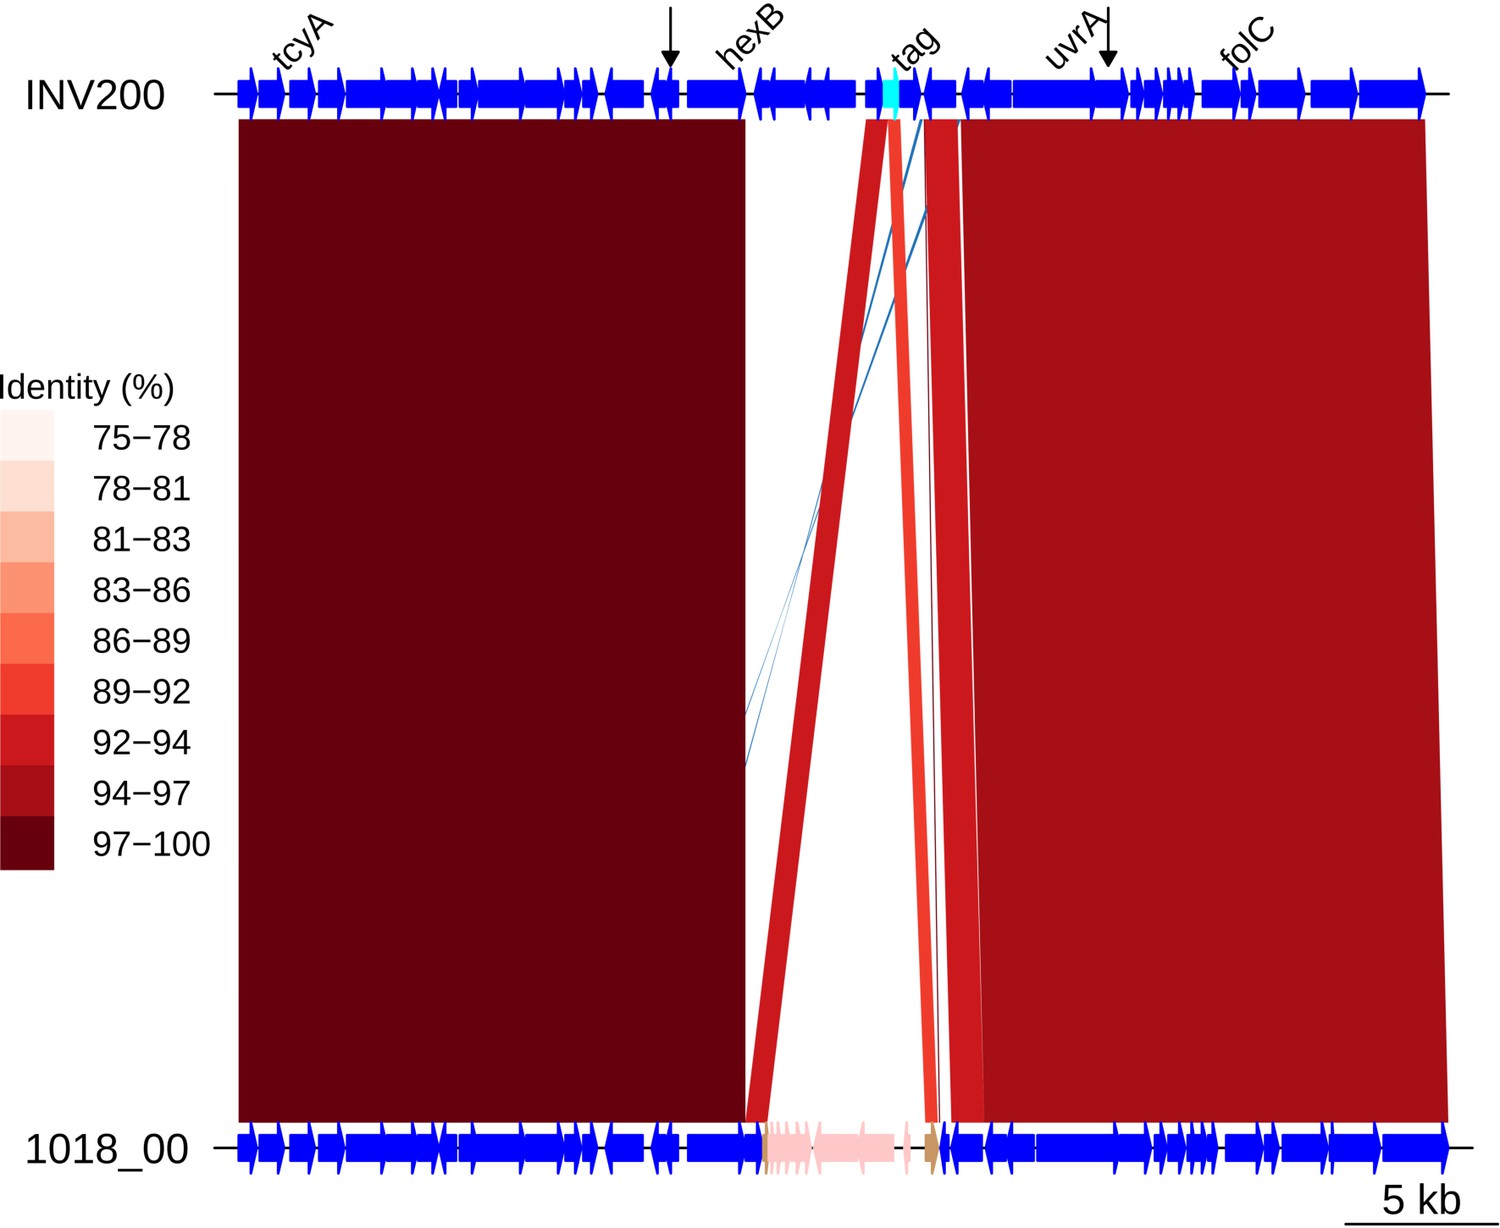
Insertion of a Tn1207.1-type element as Mega within tag.
Comparison of a Tn1207.1-type element, a Mega cassette, highlighted in pink within the 1018_00 genome, with the orthologous unmodified locus in INV200. Data are shown as described in Figure 5—figure supplement 5.
Figure 7 with 6 supplements
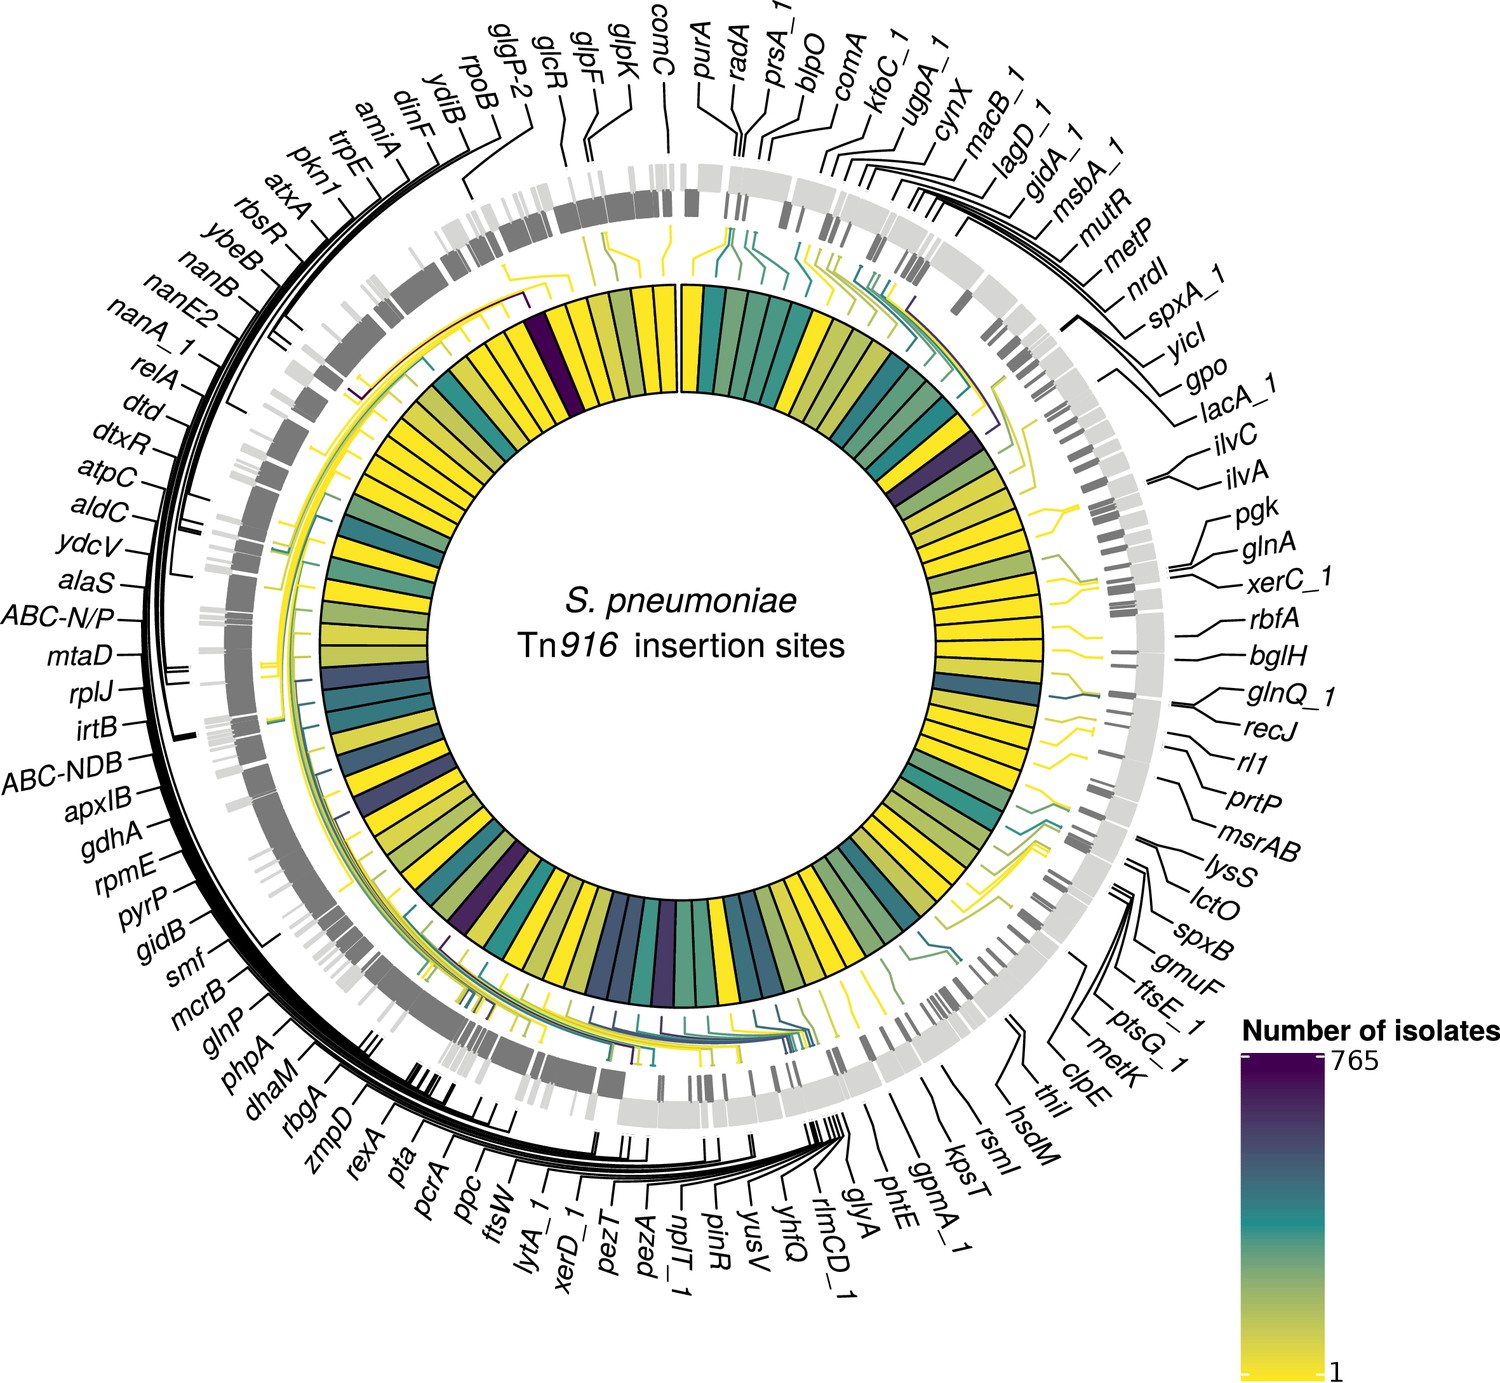
Detected insertion points of Tn916-type elements within S. pneumoniae.
Annotated genome of the reference S. pneumoniae RMV4 isolate (ENA accession number: ERS1681526) with genes where Tn916-type elements have inserted either into, or adjacent to, among the collection. Only genes present within this mobile genetic element (MGE)-free reference are annotated. Gray bars represent coding sequences (CDS): lighter gray bars indicate CDS encoded by the forward strand of the genome, darker gray bars indicate CDS encoded by the reverse strand of the genome. The inner heat map represents the number of isolates that have hits inserted into, or adjacent to, each of the annotated genes. The color scale is logarithmically transformed.
Figure 7—figure supplement 1
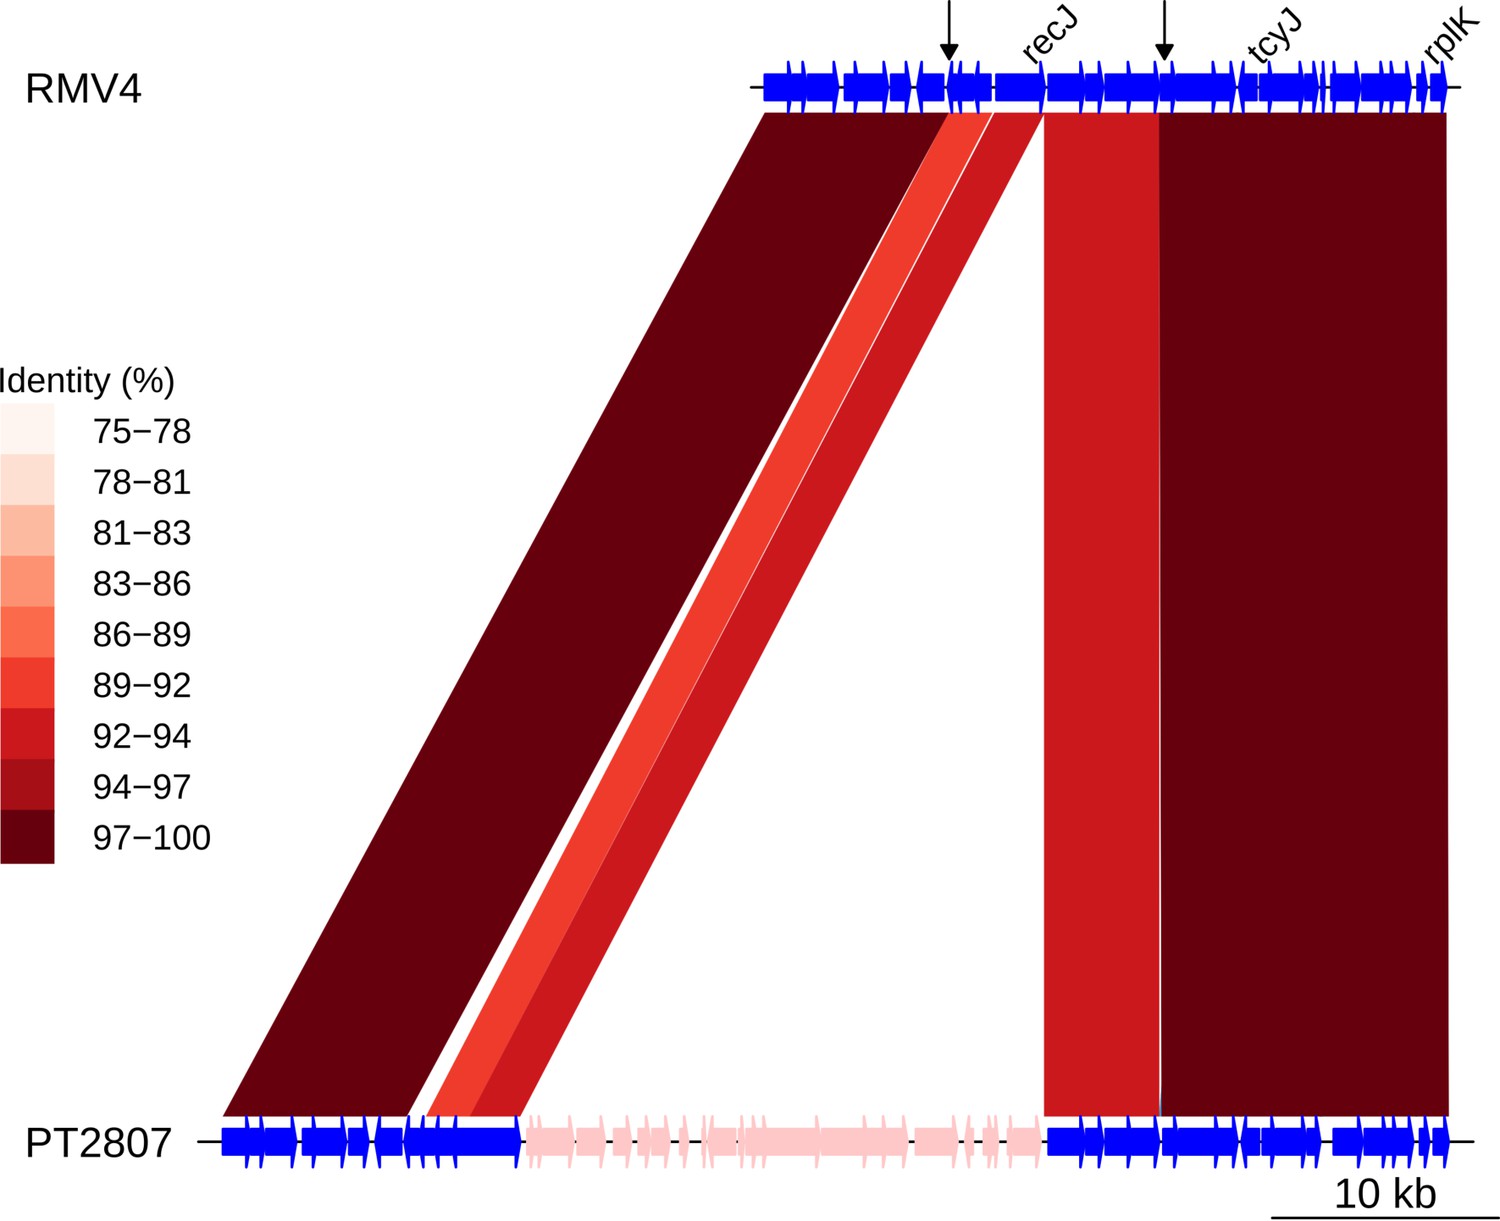
Insertion of a Tn916-type element downstream of recJ.
Comparison of the Tn916-type element insertion, highlighted in pink within the PT2807 genome, with the orthologous unmodified locus in the RMV4 sample. Data shown are as described in Figure 5—figure supplement 5.
Figure 7—figure supplement 2
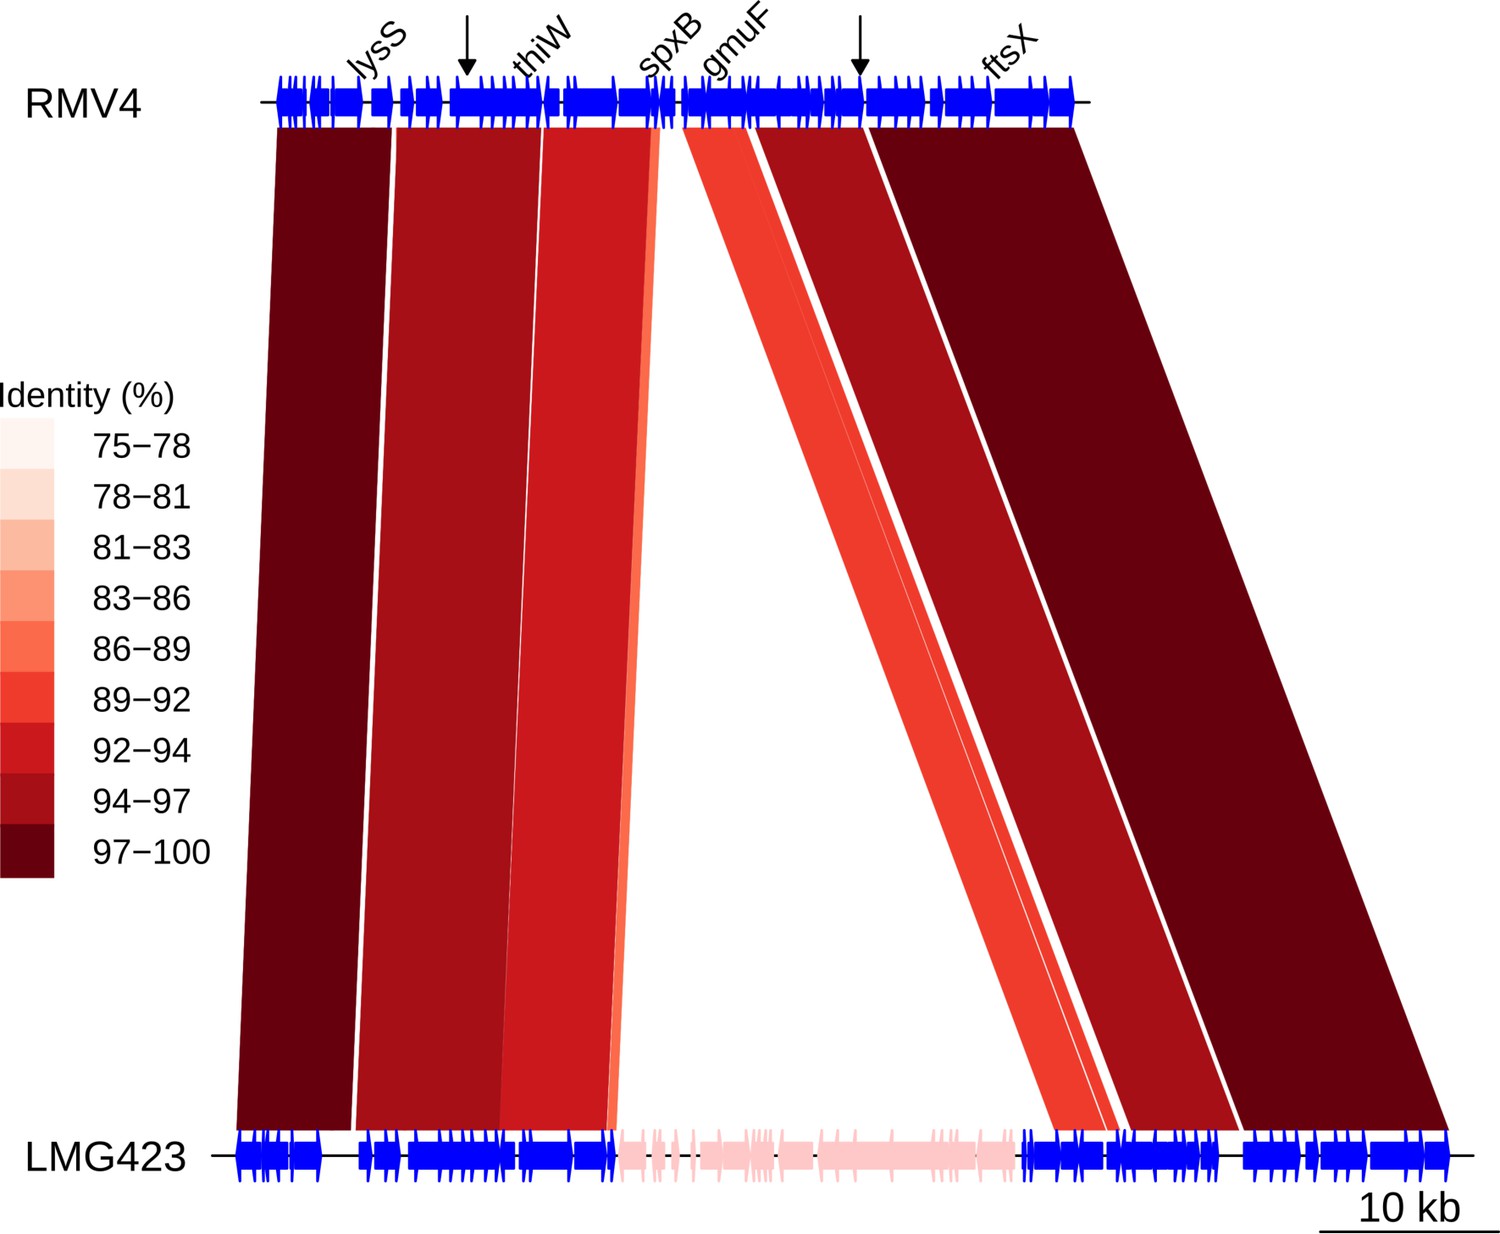
Insertion of a Tn916-type element downstream of gmuF.
Comparison of the Tn916-type element insertion, highlighted in pink within the LMG423 genome, with the orthologous unmodified locus in the RMV4 sample. Data shown are as described in Figure 5—figure supplement 5.
Figure 7—figure supplement 3
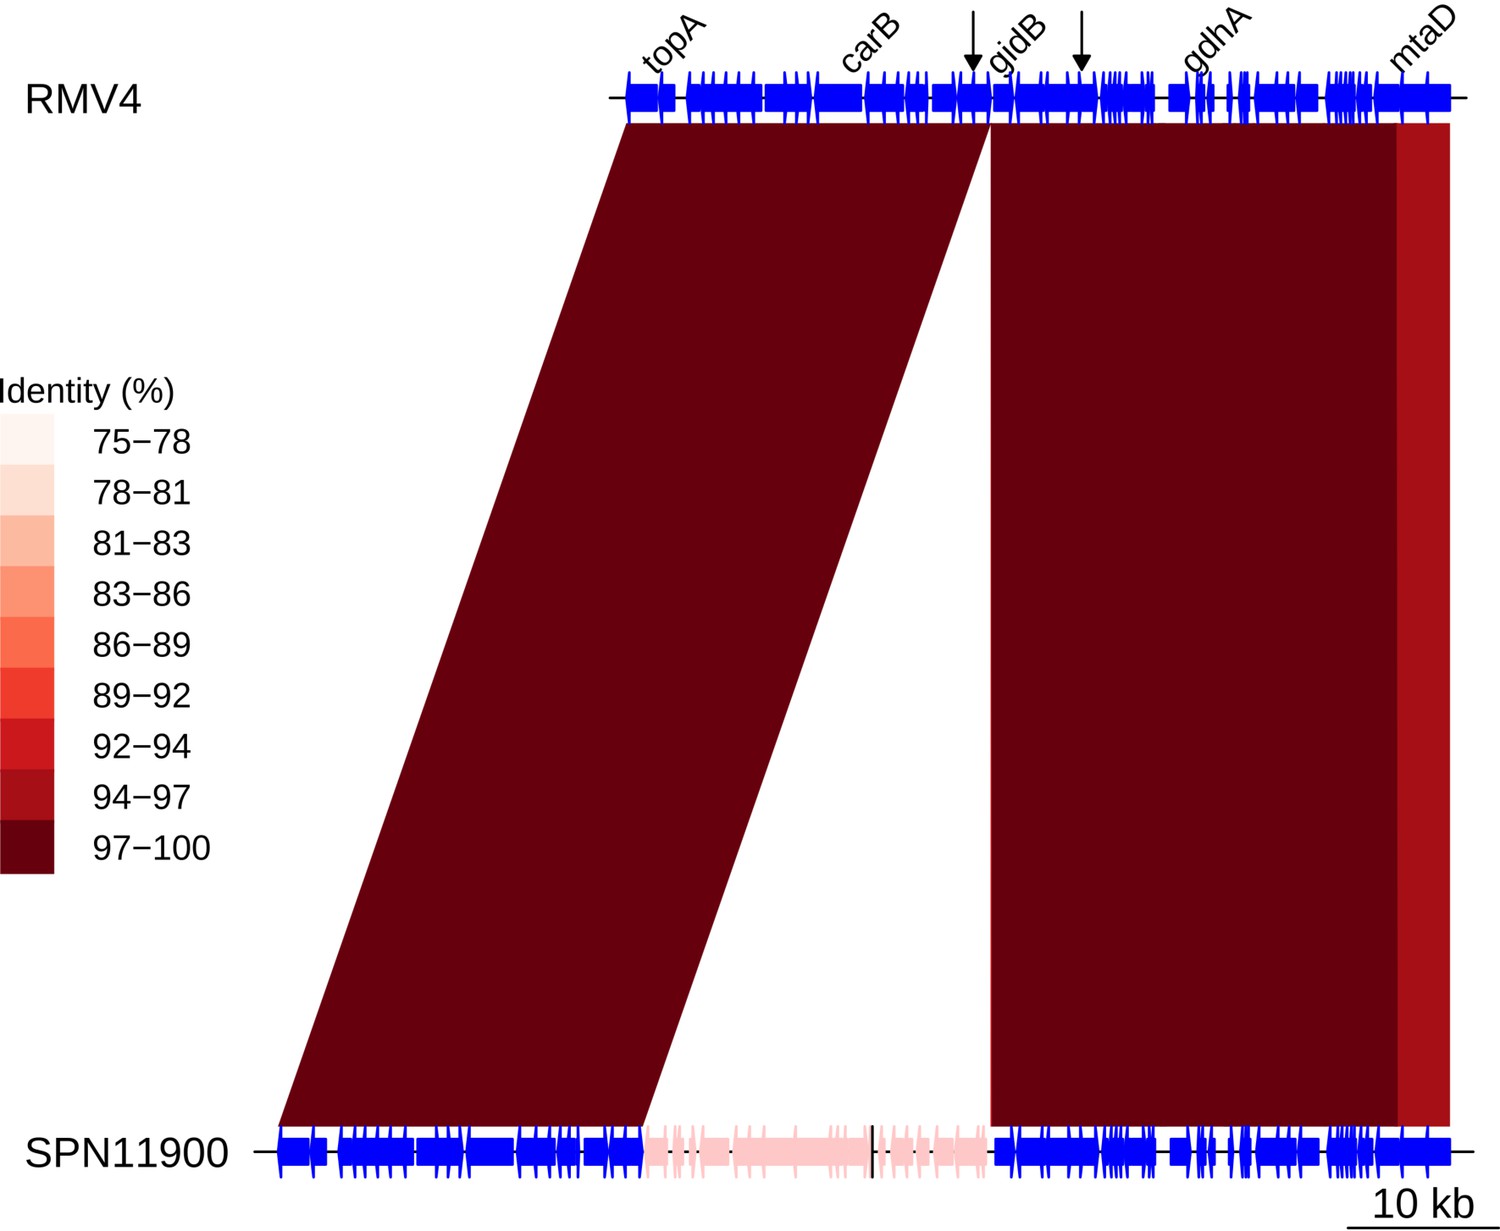
Insertion of a Tn916-type element upstream of gidB.
Comparison of the Tn916-type element insertion, highlighted in pink within the SPN11900 genome, with the orthologous unmodified locus in the RMV4 sample. Data shown are as described in Figure 5—figure supplement 5.
Figure 7—figure supplement 4
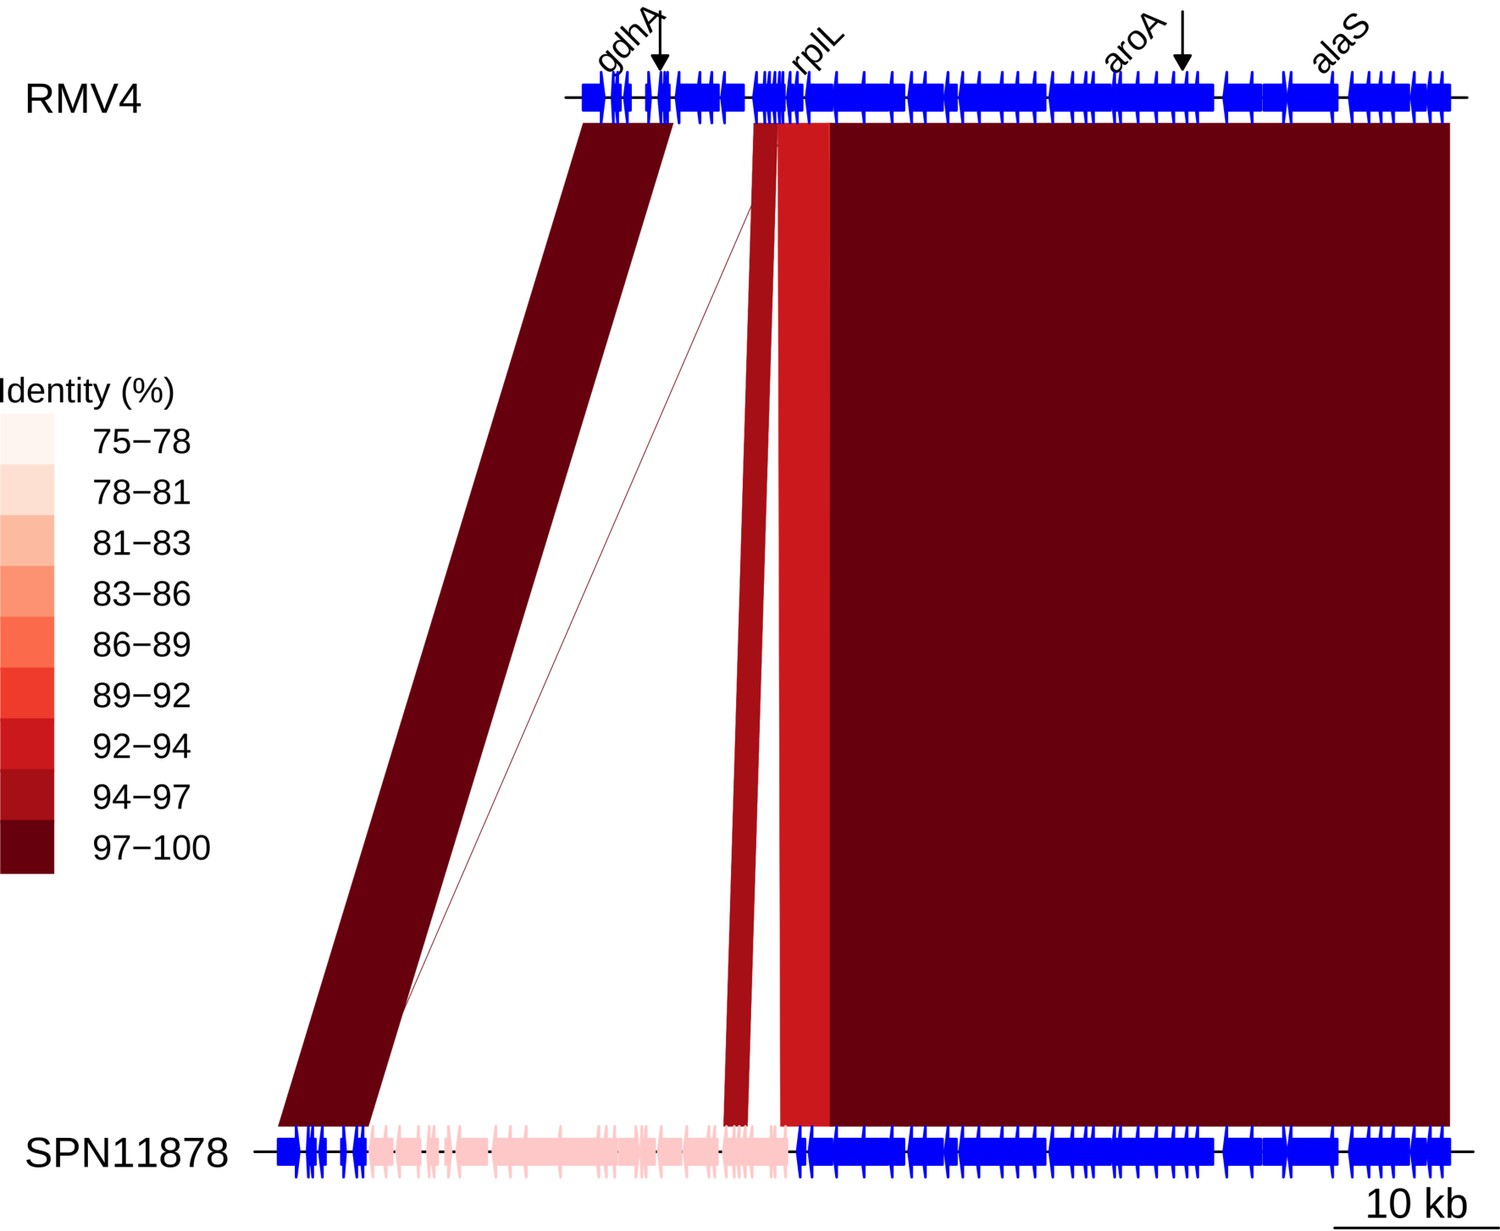
Insertion of a Tn916-type element upstream of rplL.
Comparison of the Tn916-type element insertion, highlighted in pink within the SPN11878 genome, with the orthologous unmodified locus in the RMV4 sample. Data shown are as described in Figure 5—figure supplement 5.
Figure 7—figure supplement 5
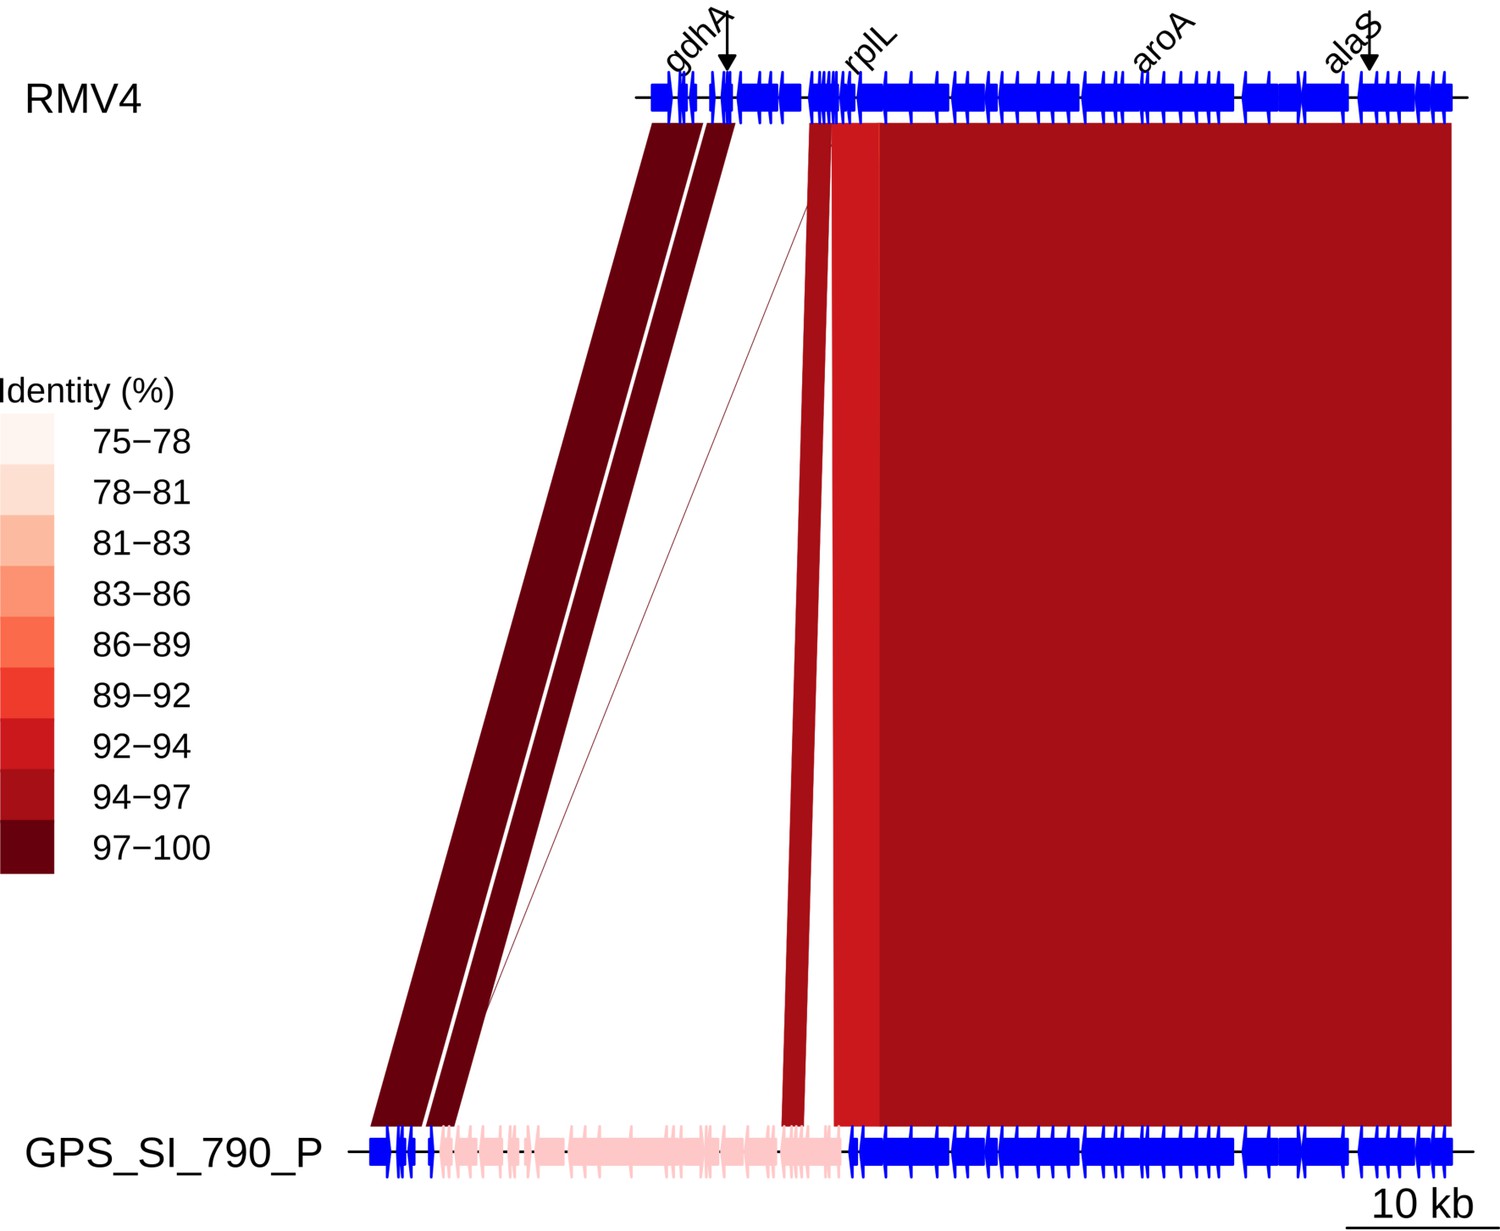
Insertion of a Tn916-type element upstream of rplL.
Comparison of the Tn916-type element insertion, highlighted in pink within the GPS_SI_790_P genome, and the orthologous unmodified locus in the RMV4 sample with no insertion. Data are as described in Figure 5—figure supplement 5.
Figure 7—figure supplement 6
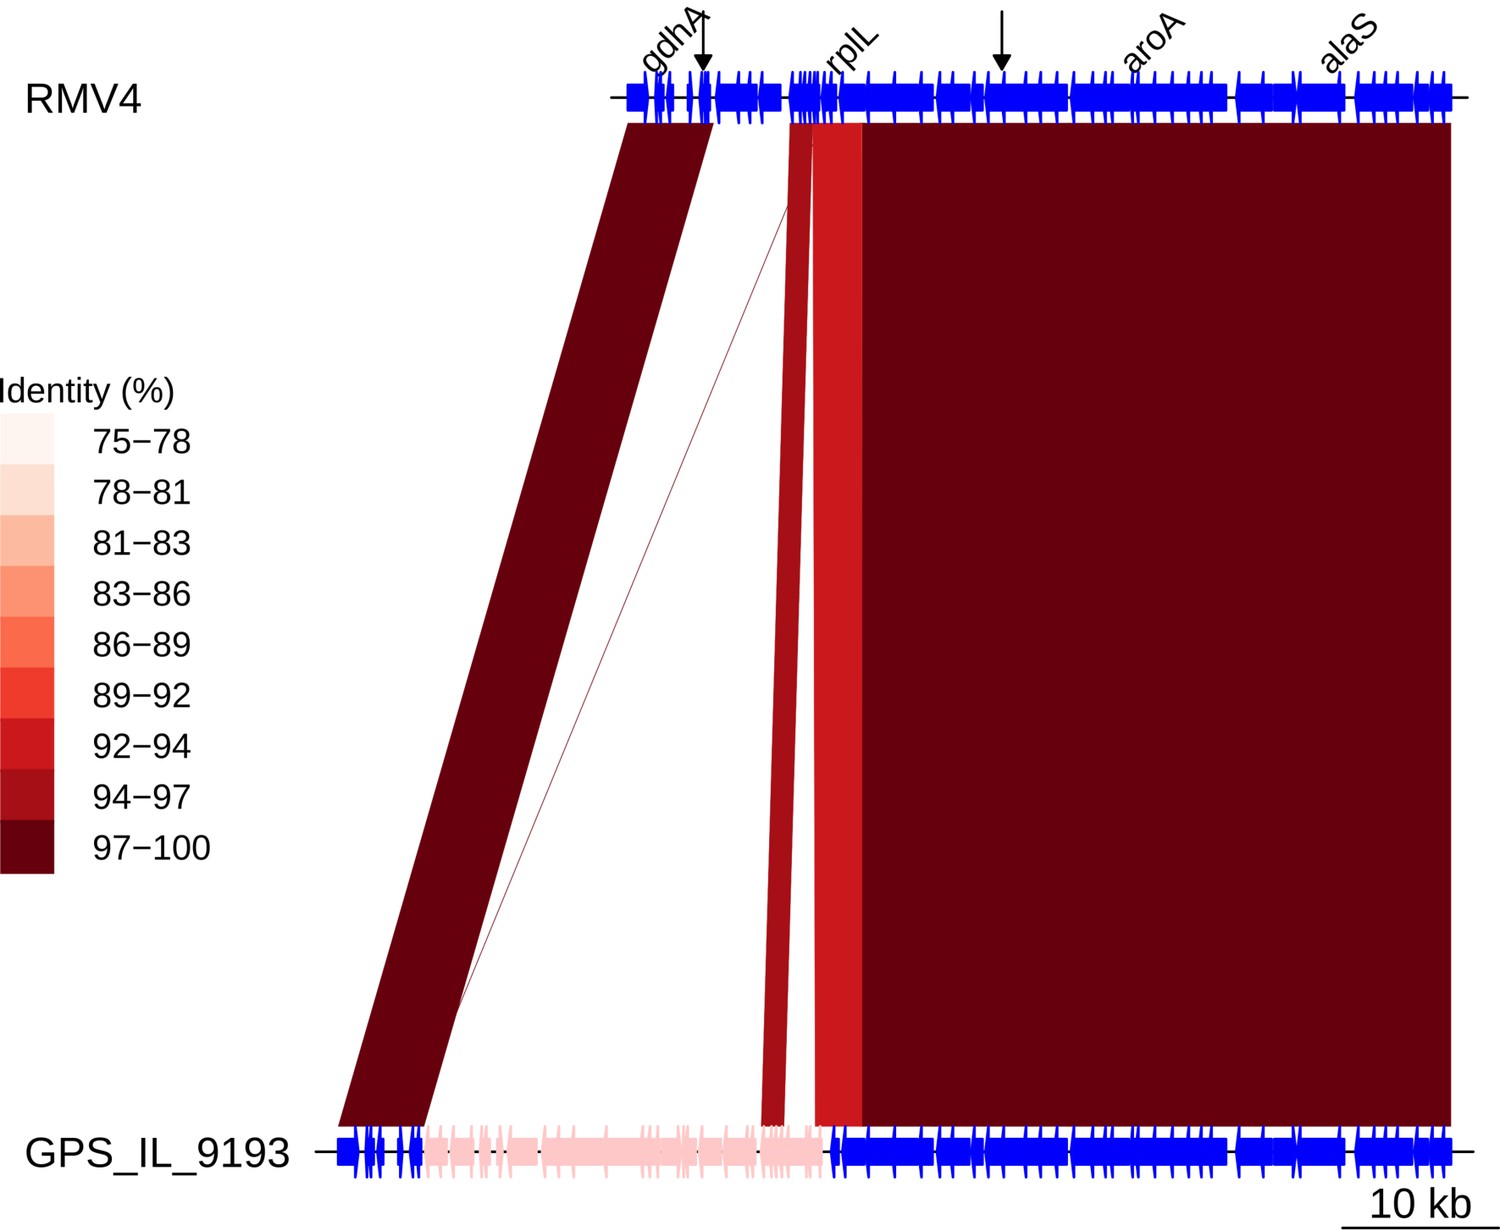
Insertion of a Tn916-type element upstream of rplL.
Comparison of the Tn916-type element insertion, highlighted in pink within the GPS_IL_9193 genome, with the orthologous unmodified locus in the RMV4 sample with no insertion. Data are as described in Figure 5—figure supplement 5.
Figure 8
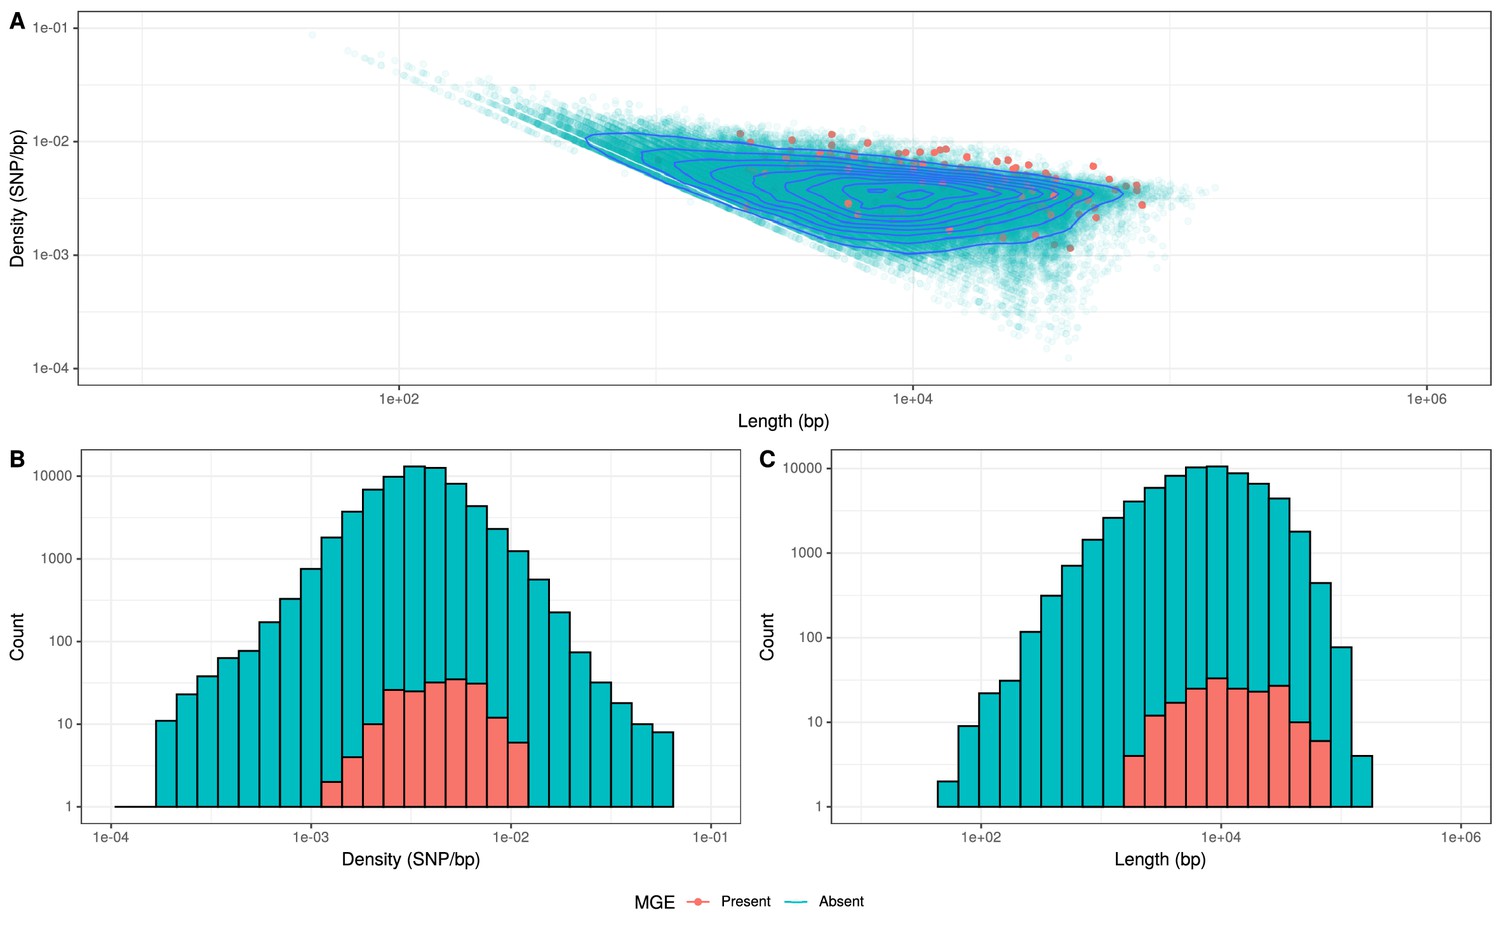
Comparison of length and SNP density of recombination events.
(A) Scatter plot of the SNP density and size of homologous recombinations, with events classified based on whether they imported Tn916-type or Tn1207.10-type mobile genetic elements (MGEs). Blue contour lines summarize the density of all points. (B) Overlaid histogram comparing the SNP density of recombination events that imported MGEs relative to those that did not. (C) Overlaid histogram comparing the length of recombinations that imported MGEs relative to those that did not.
Figure 9 with 1 supplement
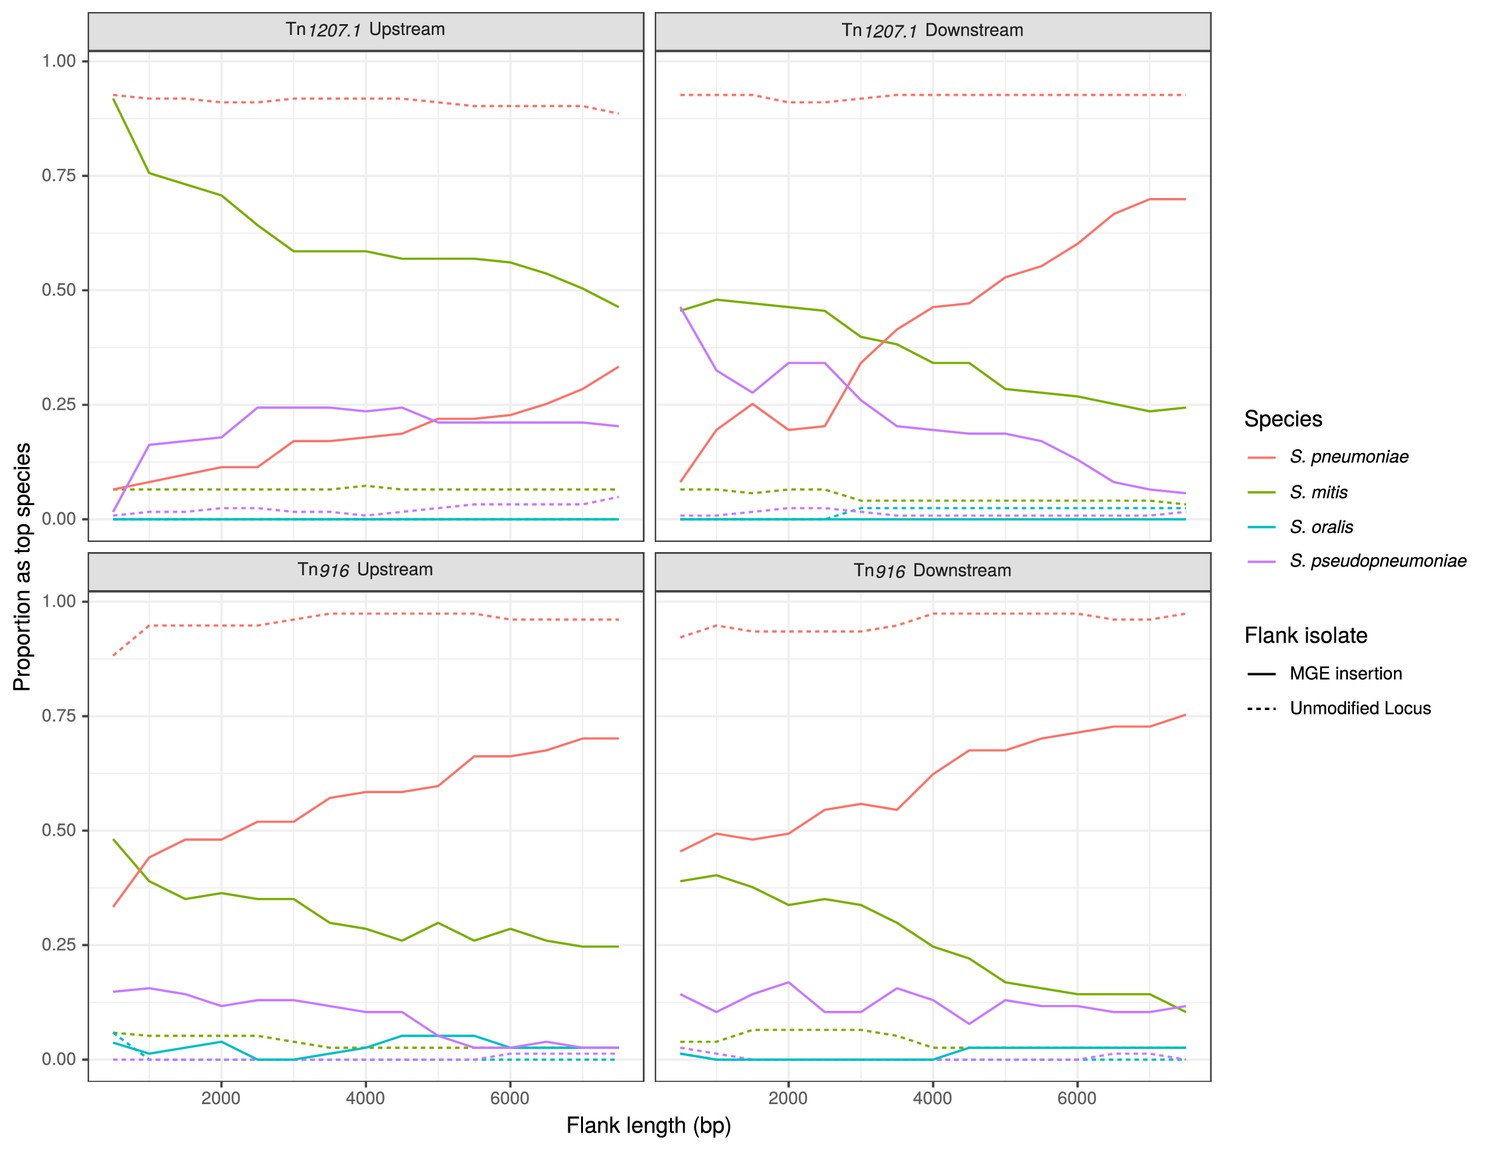
Identification of likely sources of Tn916-type and Tn1207.1-type elements.
Flanking regions upstream and downstream from mobile genetic element (MGE) insertion sites were compared to a reference streptococcal database. Lines represent the proportion of matches, across all element acquisitions reconstructed as having occurred through homologous recombination, that correspond to the four species present in the reference streptococcal database. The dashed unmodified locus lines represent data from the orthologous regions of isolates without the MGE insertion. These proportions were calculated at 500 bp increments over 7.5 kb-long flanking regions either side of the insertion site.
-
Figure 9—source data 1
Closest species match to the 500 bp region upstream of tag-disrupting Tn1207.1 insertions.
The species, ENA accession codes, and frequencies of the matches to the 500 bp region upstream of the 66 Tn1207.1-type element insertions into tag that were reconstructed as having occurred within inferred homologous recombination events.
- https://cdn.elifesciences.org/articles/67113/elife-67113-fig9-data1-v3.docx
Figure 9—figure supplement 1
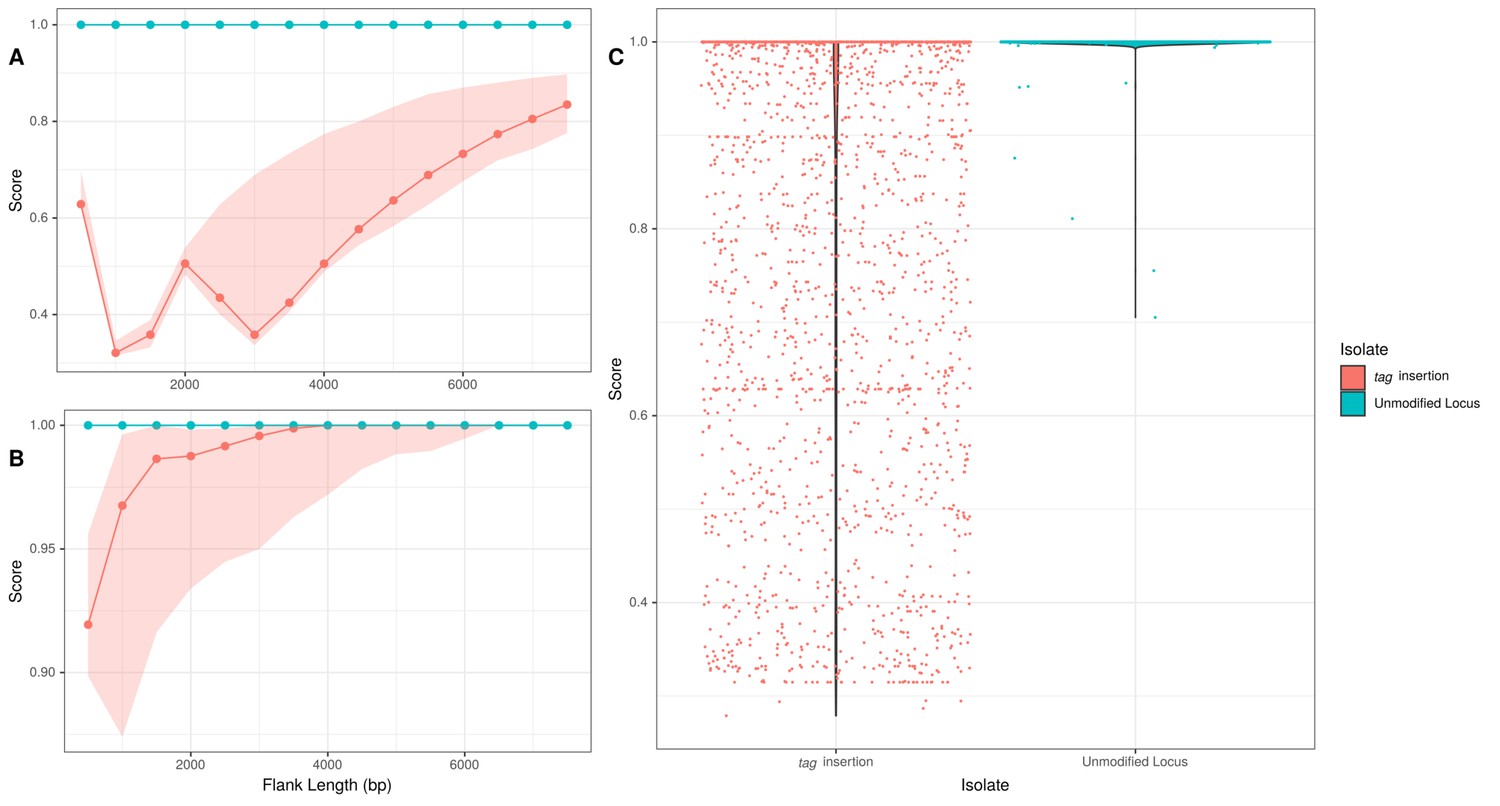
Flanking region origin for Tn1207.1-type element tag insertions.
(A) The median γ score of upstream flanking regions of the Tn1207.1-type element insertions into the tag gene, highlighted in coral. The median γ score for the orthologous regions in isolates without the mobile genetic element (MGE), not expected to be modified by homologous recombination, are highlighted in cyan. Shaded regions represent the interquartile range (IQR) of the γ score. (B) The γ score for regions extracted downstream of the insertion. Shaded regions represent the IQR of the γ score. (C) The distribution of γ scores across both flanks, upstream and downstream, of the Tn1207.1-type element tag insertions. Data are shown separately for isolates with this particular insert, and those without Tn1207.1-type elements integrated in this orthologous region.
Figure 10

Overview of pipeline used to analyze the acquisition of Tn916-type and Tn1207.1-type elements.
Red boxes represent data input into the pipeline, blue boxes the individual analysis steps within the pipeline, and purple the pipeline’s output.
Additional files
Download links
A two-part list of links to download the article, or parts of the article, in various formats.
Downloads (link to download the article as PDF)
Open citations (links to open the citations from this article in various online reference manager services)
Cite this article (links to download the citations from this article in formats compatible with various reference manager tools)
The role of interspecies recombination in the evolution of antibiotic-resistant pneumococci
eLife 10:e67113.
https://doi.org/10.7554/eLife.67113


