Genetic integration of behavioural and endocrine components of the stress response
- Centre for Ecology and Conservation, University of Exeter (Penryn Campus), United Kingdom
- Department of Biological Sciences, University of Alabama, United States
Figures
Figure 1
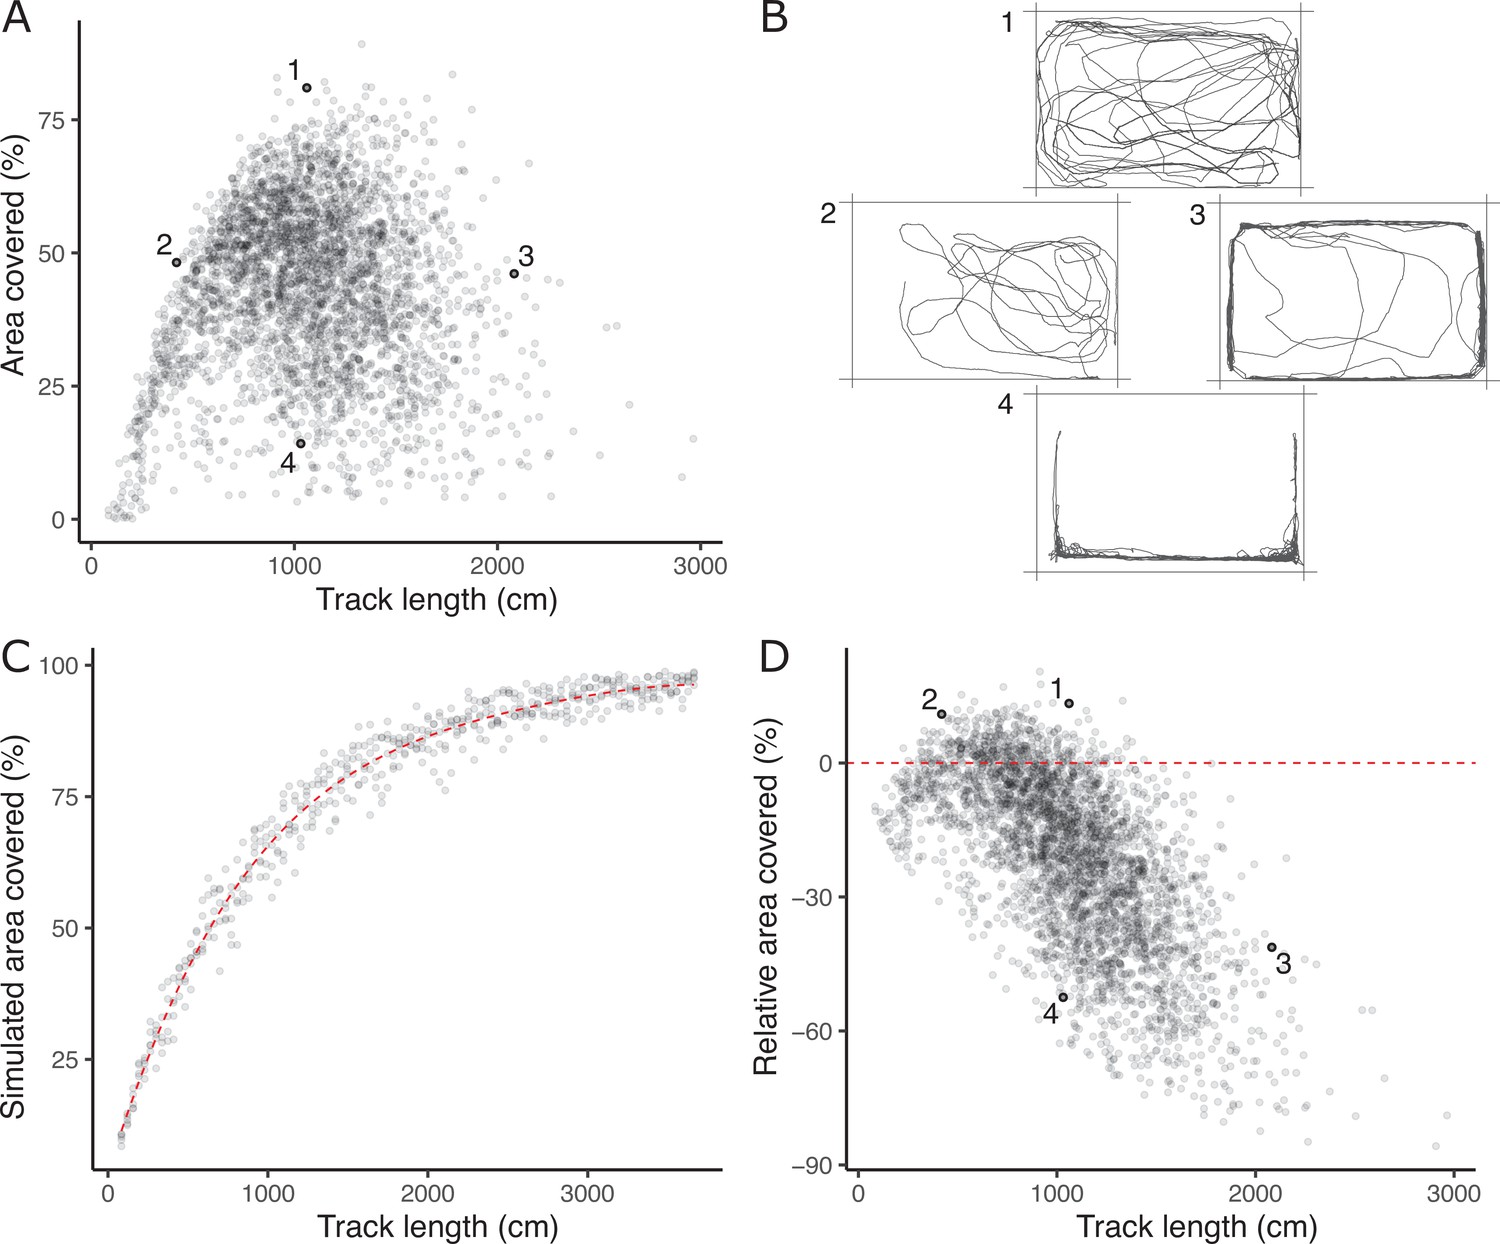
The lack of a strong positive relationship between observed track length and area covered (panel A), is initially puzzling given expected autocorrelation and that both are used as positive indicators of exploratory (or ‘bold’) behaviour.
Inset examples of OFT tracks from four individuals (panel B) shed light on this. Fish 1 and 2 appear to be exploring the tank, while 3 and 4 are engaging in stereotypical ‘flight’ behaviour characterised by strong thigmotaxis (remaining close to tank walls) and/or rapid movement along tank walls. As a consequence, individuals 2 and 3 have similar area covered during the OFT, but very different track lengths. We simulated random movements to define an expected null relationship between area covered and track length (panel C; dashed red line shows the fourth order polynomial model fit; see Materials and methods). The polynomial regression was then used to predict the expected area covered under random movement for each trial’s observed track length, and the ‘relative area covered’ was calculated as the observation minus this prediction. Panel D shows the resultant relative area covered plotted against track length for all trials (dashed red line at relative area covered = 0, shows where individuals of any track length are expected to lie if they move randomly with respect to direction). From this it is apparent that fish 1 and 2 have high relative area covered, while 3 and 4 do not.
Figure 2
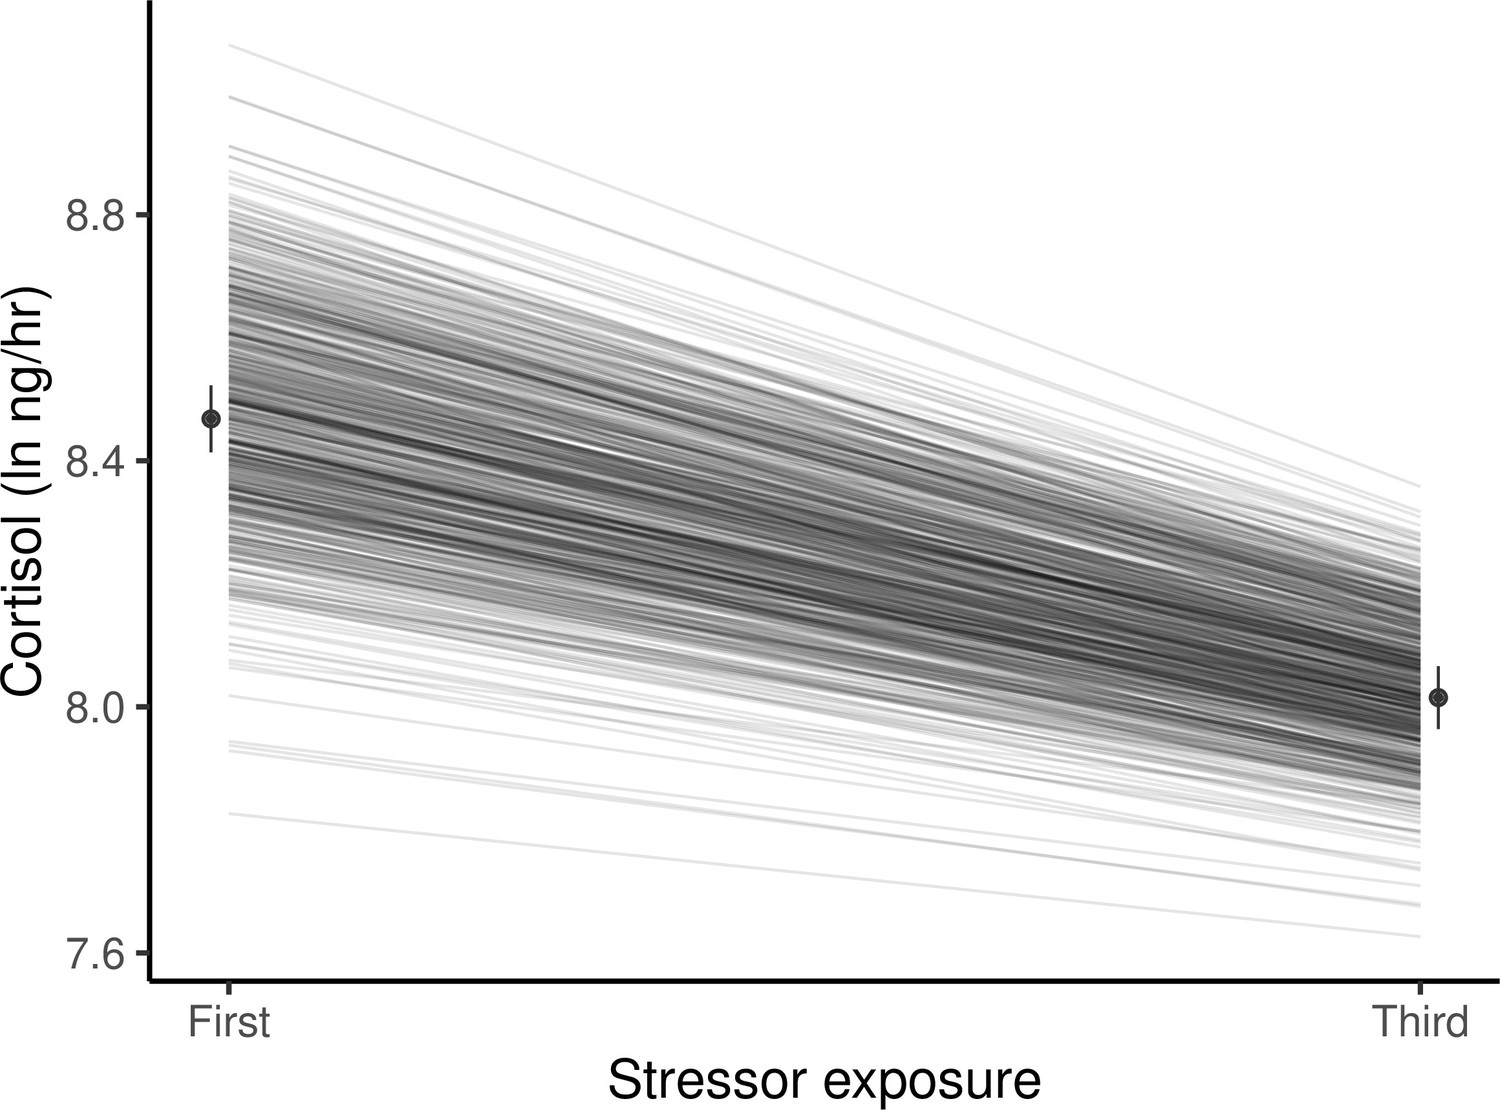
Guppies habituate to the waterborne sampling procedure, as shown by a decline in average ln-transformed cortisol level (ng/hr) following stressor exposure between first and third exposures.
Black circles and associated bars denote predicted population means (± standard error) from mixed model analysis. Gray lines depict the predicted genetic reaction norms across repeated stressor exposure for each individual. Weak, but statistically significant GxE is manifest as variance in the genetic reaction norm slopes (i.e. lack of parallelism) and results in a slight reduction of genetic variance for cortisol at the third exposure relative to the first.
Figure 3
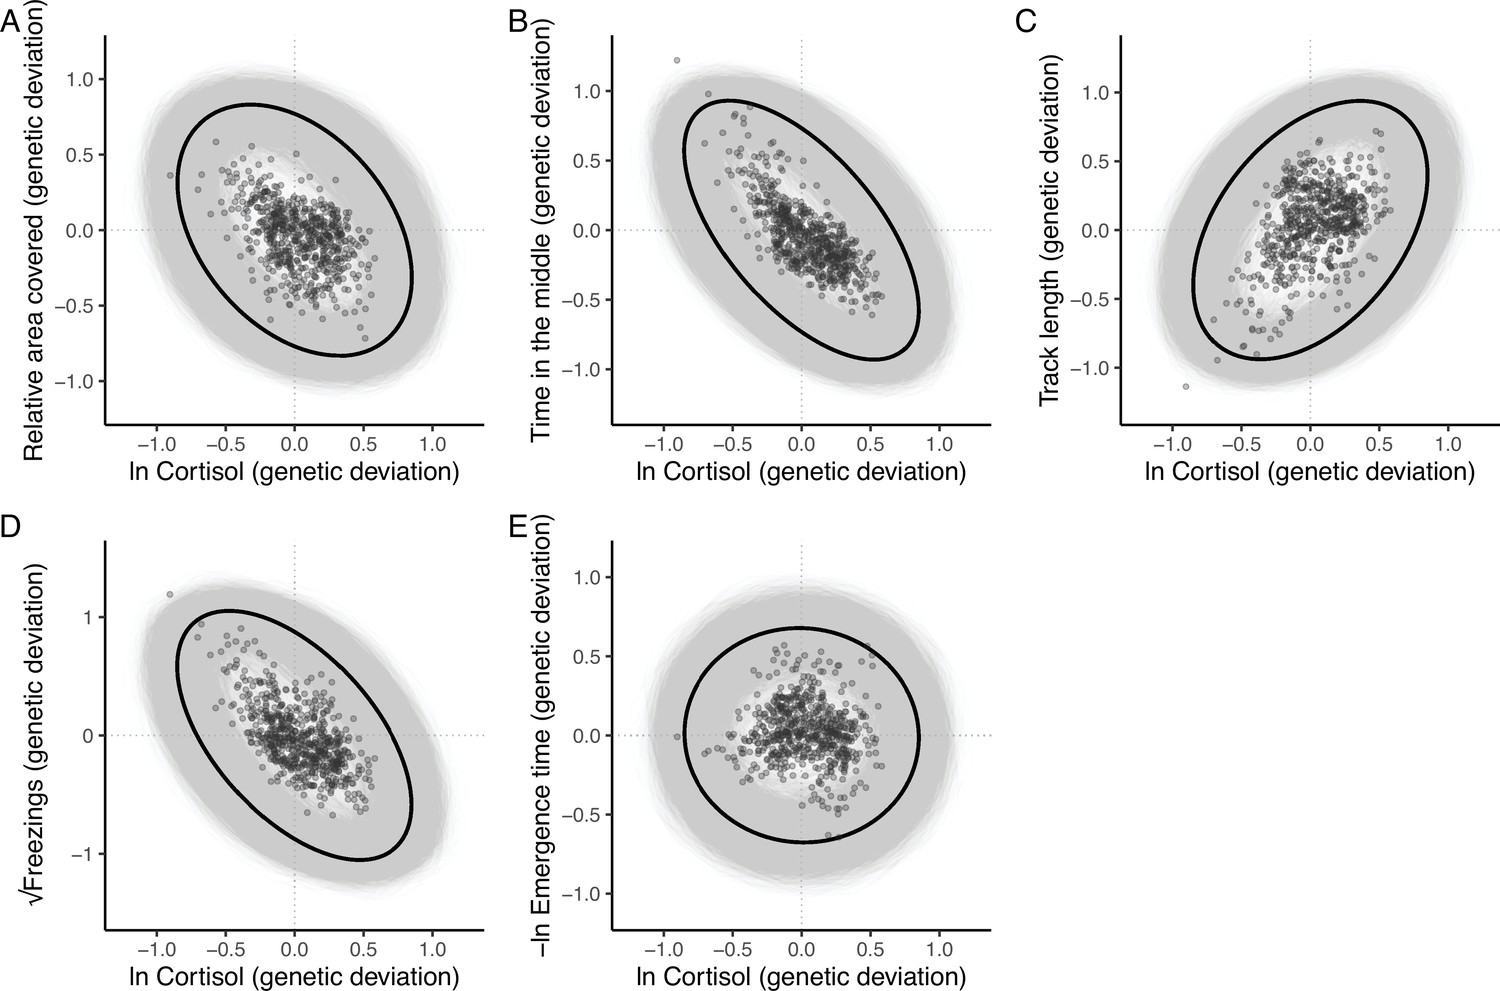
The additive genetic relationship between ln-transformed cortisol (x-axis) and five behaviours (a, relative area covered; b, time in the middle; c, track length; d, √freezings; e, -ln emergence time).
Points show (predicted) bivariate genetic deviations from the population means, plotted for those individuals in the pedigree with cortisol data. In each case the black ellipse depicts the ‘shape’ of the relationship as given by the point estimate of G. Specifically it encompasses the area expected to contain 95% of the bivariate genetic distribution for the population. Grey ellipses denote the corresponding areas defined from 5000 bootstrapped replicates of G, and so highlight the uncertainty around these bivariate distributions.
Figure 4 with 2 supplements
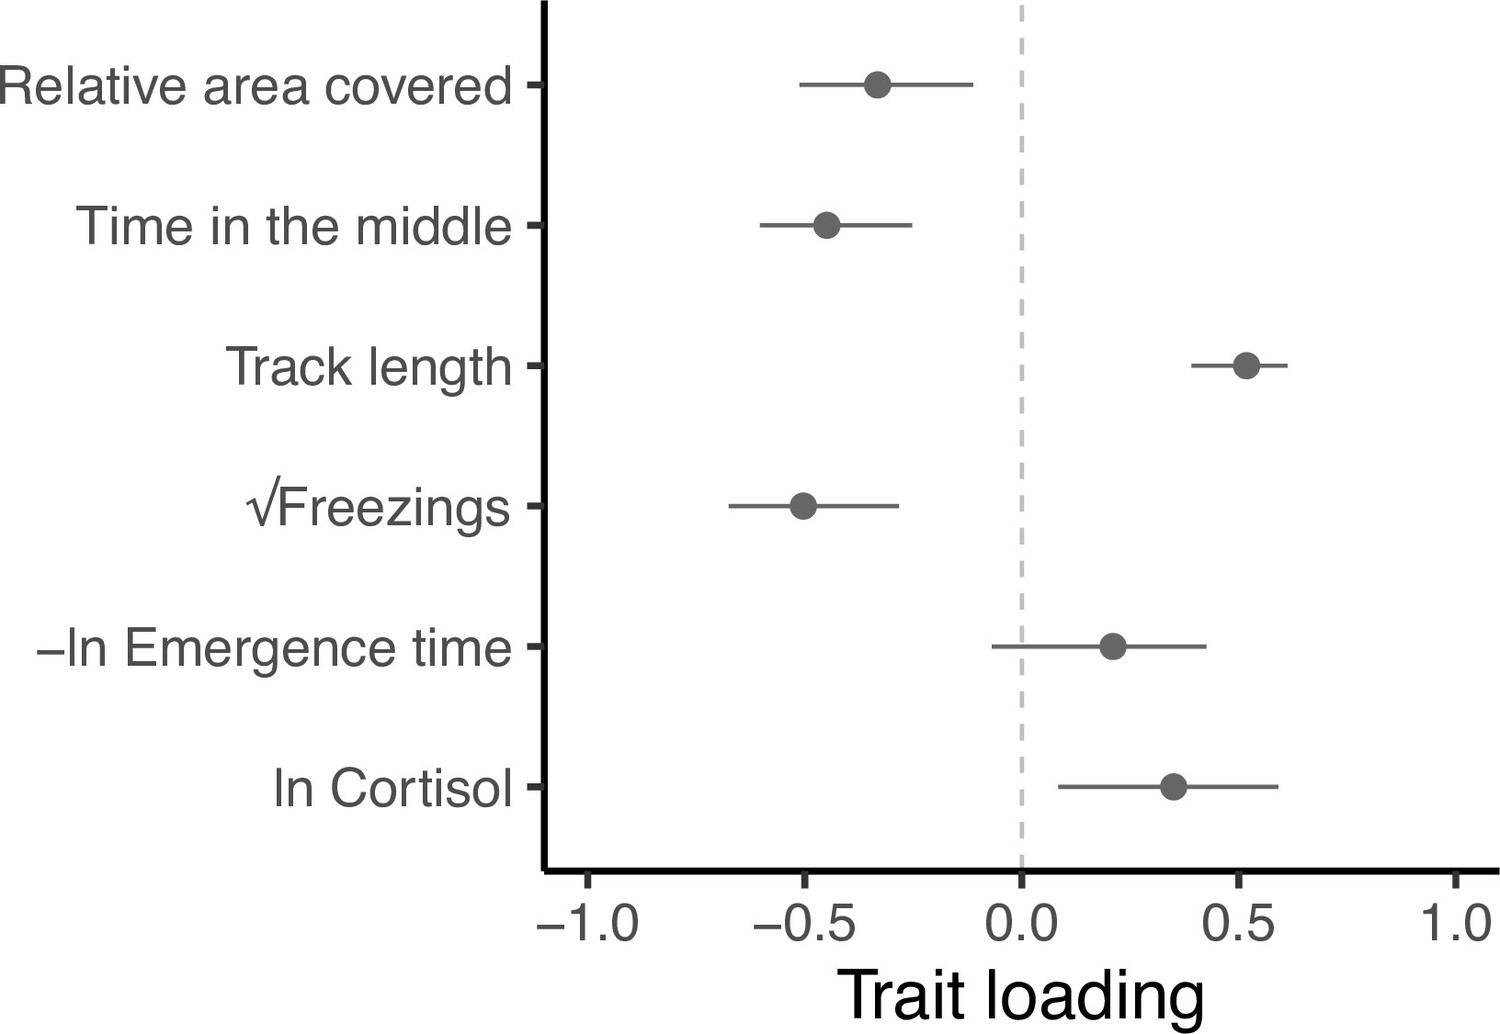
Trait loadings from gmax, the first eigen vector (principal component) of G.
This axis explains 59.5% of the genetic (co)variation found in the focal behavioural and physiological components of the stress response in our guppy population. Points show trait loadings from the first eigen vector of our estimate of G, with bars representing 95% confidence intervals on each loading (calculated from 5000 bootstrapped replicates of the model).
Figure 4—figure supplement 1
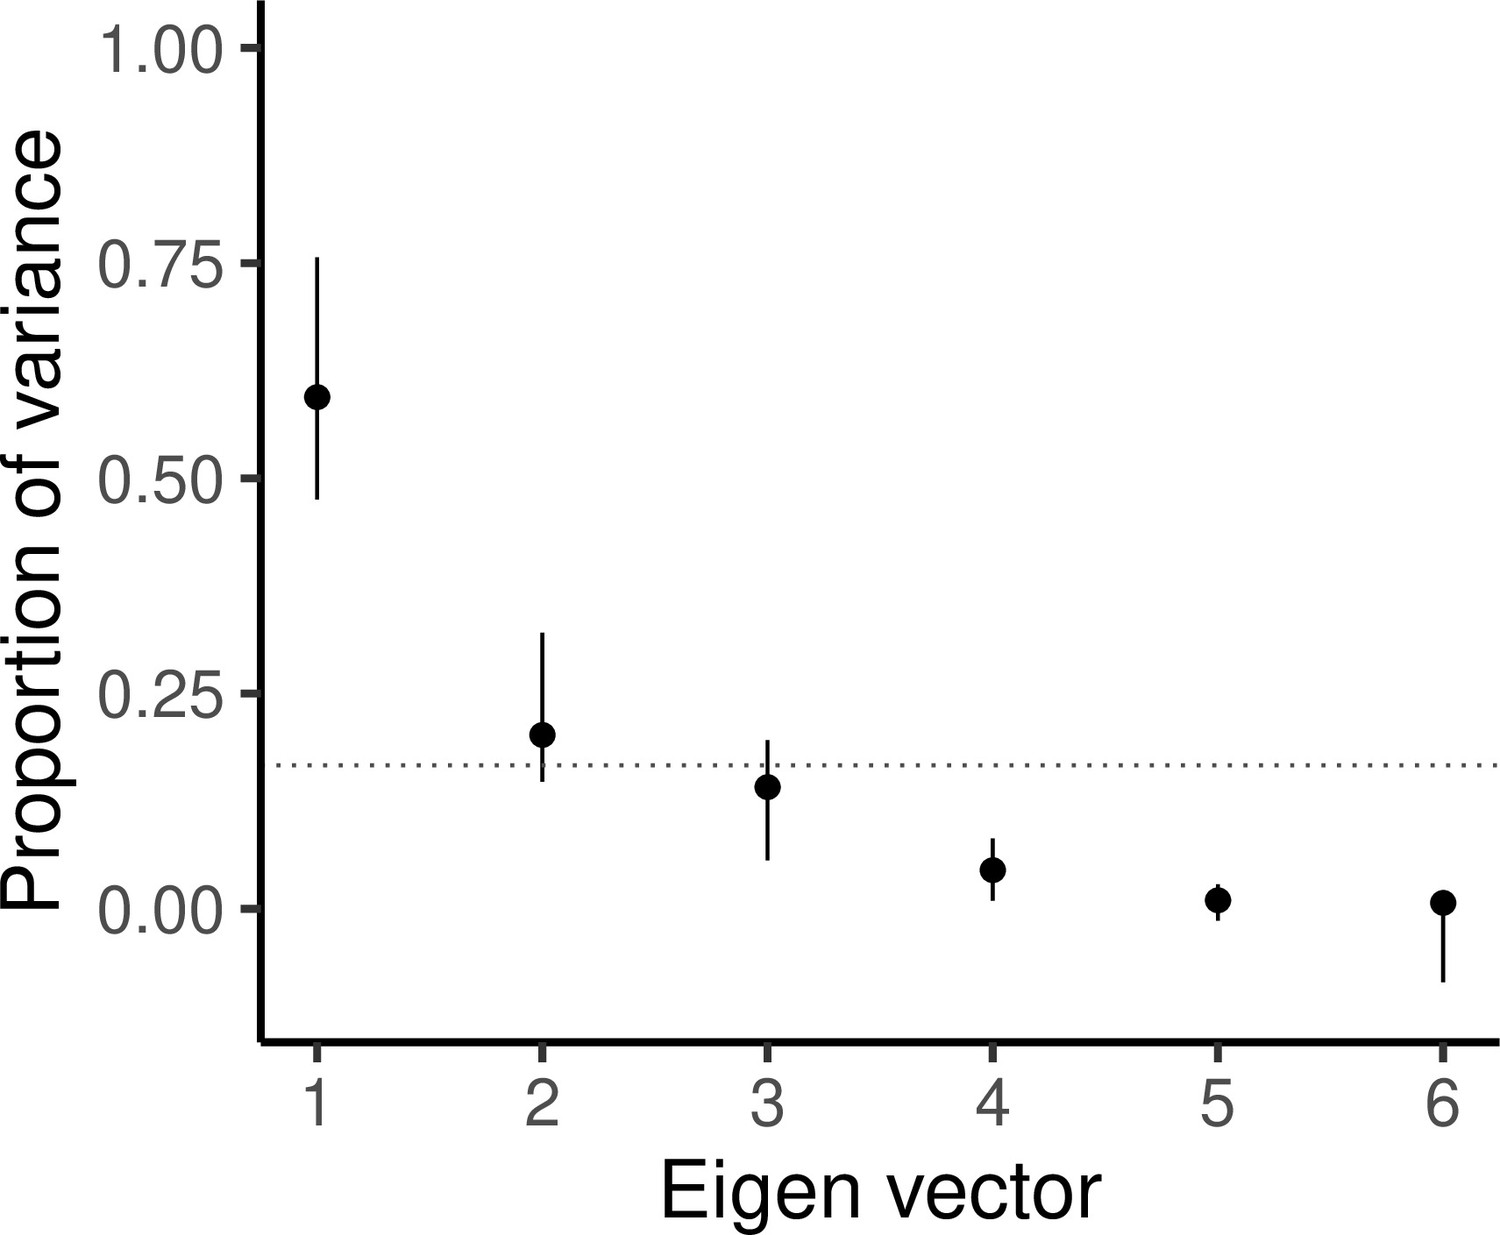
Scree plot showing the proportion of total variance explained by each eigen vector, with vertical bars indicating 95% confidence intervals as estimated from 5000 bootstrapped replicates.
The horizontal dotted line indicates where equal variance across all eigen vectors would lie.
Figure 4—figure supplement 2
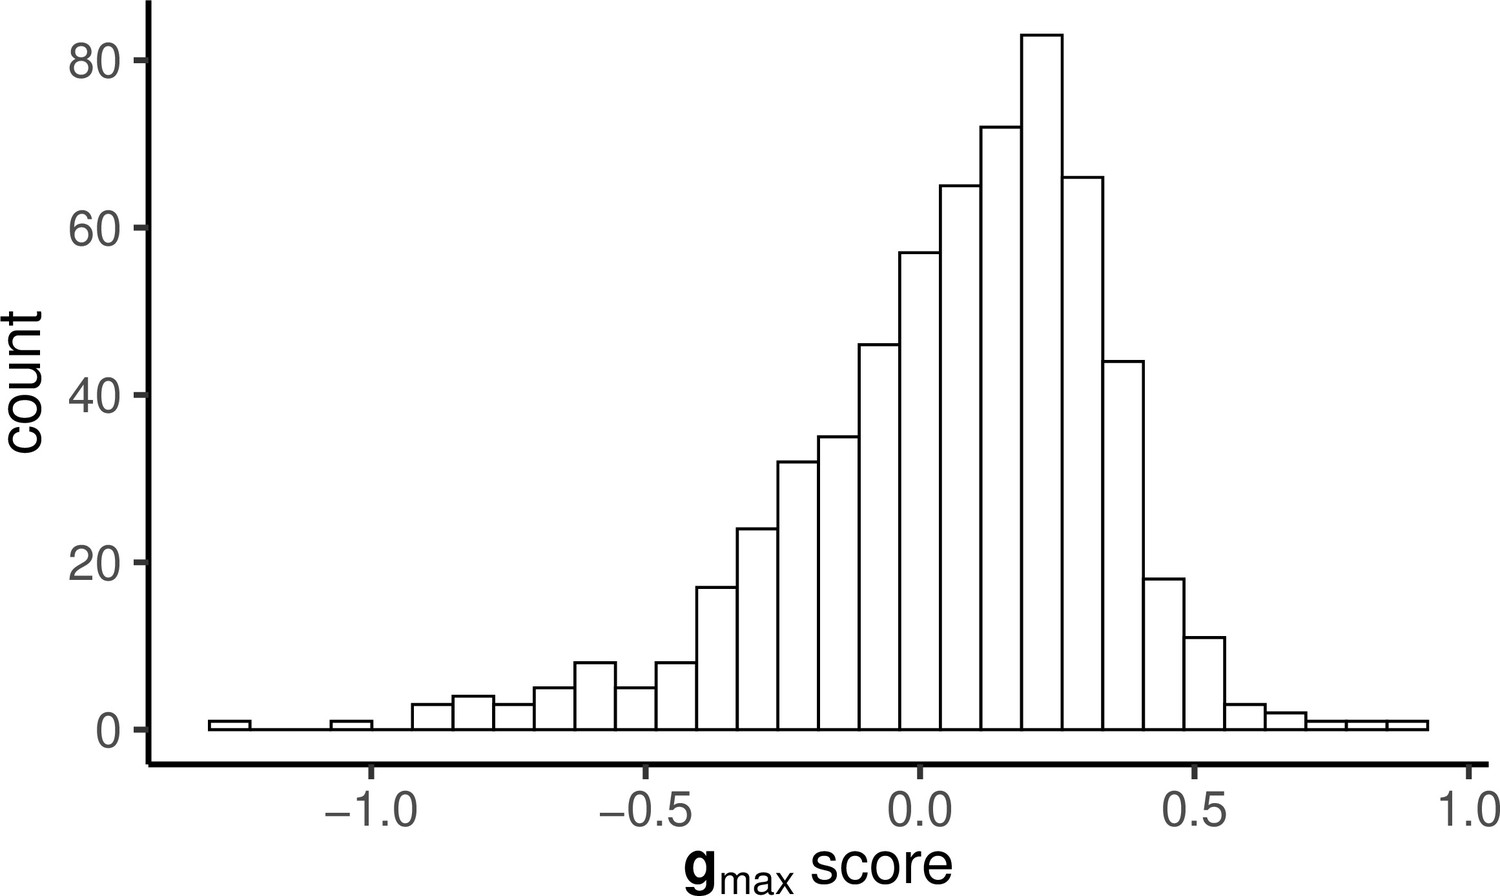
Histogram of PC scores for gmax calculated for each individual that was assayed for both behaviour and endocrine responses.
The distribution is skewed but clearly not bimodal, as is predicted by some verbal models of ‘stress coping style’.
Appendix 1—figure 1
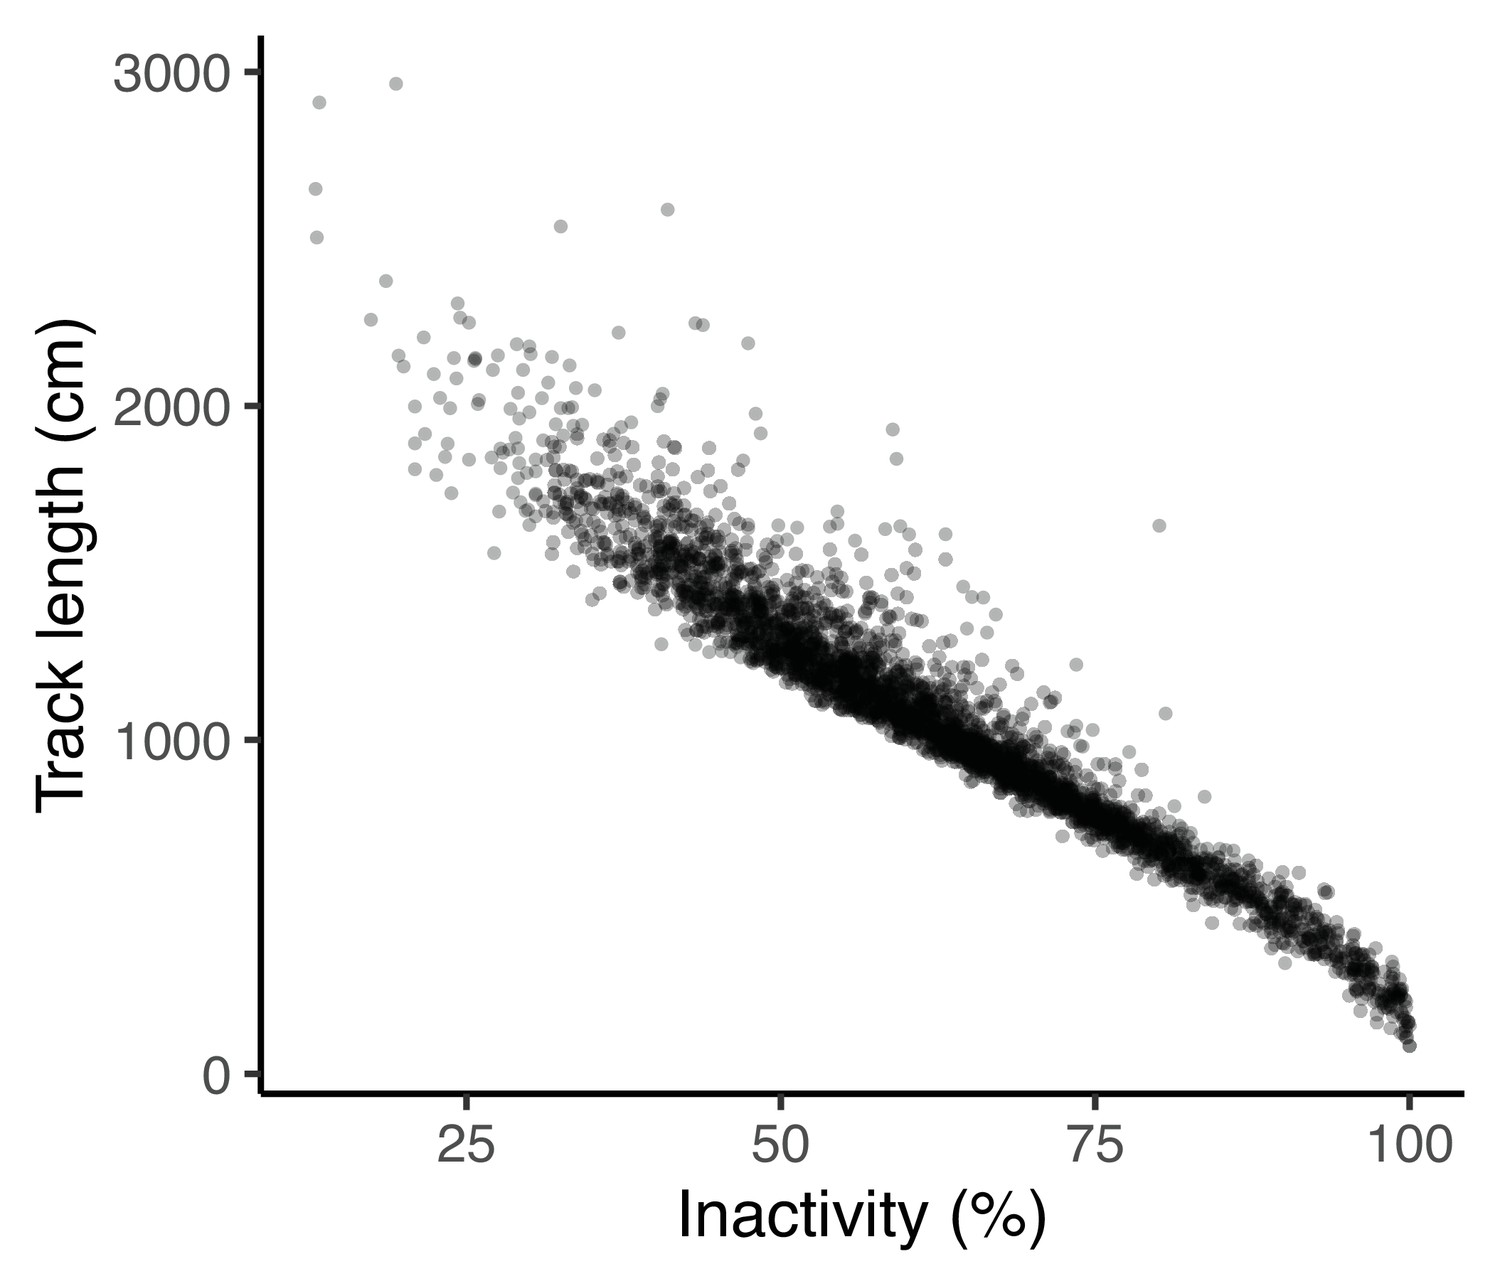
Percentage of time inactive is strongly correlated with track length at the phenotypic level.
Appendix 1—figure 2
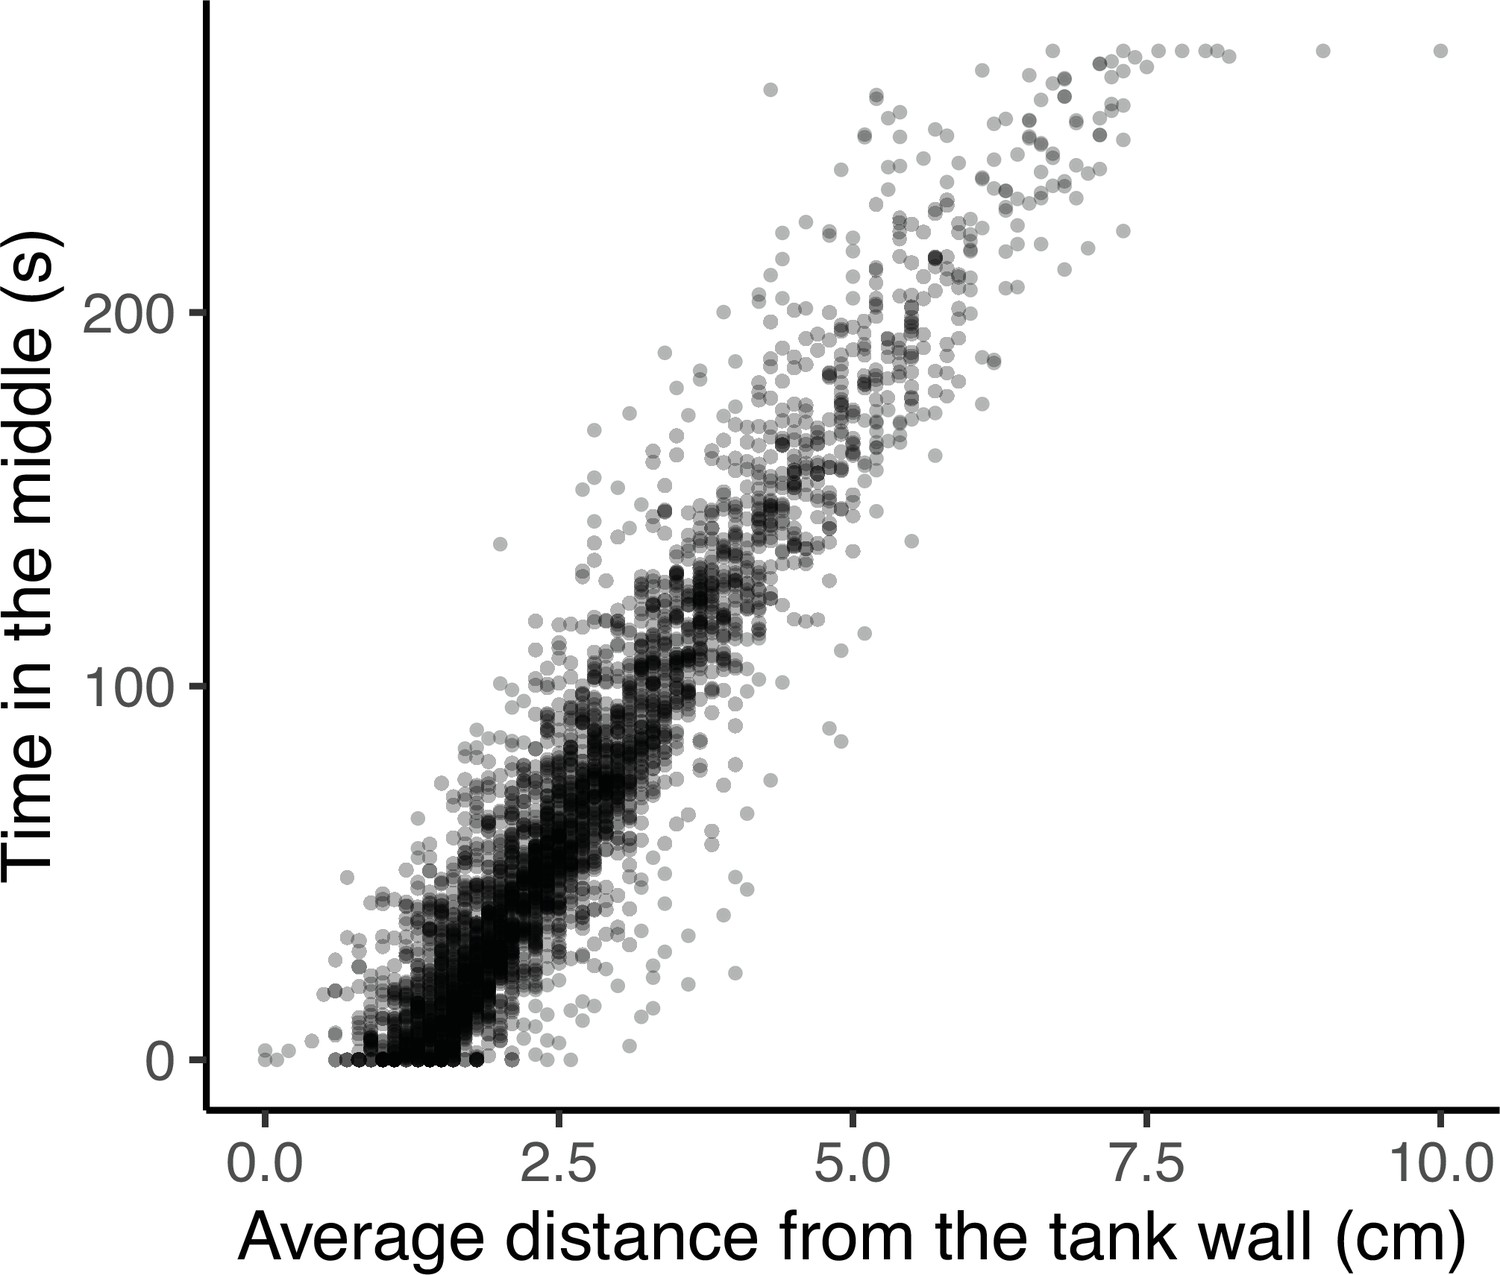
Time in the middle is strongly correlated with average distance from the tank wall at the phenotypic level.
Tables
Table 1
Estimated variance components, along with adjusted heritability, for each trait as estimated in a univariate model (± standard error).
Chi-square test statistics and p-values are provided for the pedigree term, testing for the presence of significant additive genetic variance (Va).
| Trait | Va | Vpe | Vgroup | Vresidual | h2 | χ20,1 | p |
|---|---|---|---|---|---|---|---|
| Relative area covered | 42.87 ± 12.89 | 56.16 ± 10.92 | 19.17 ± 4.92 | 203.17 ± 6.26 | 0.13 ± 0.04 | 31.2 | < 0.001 |
| Time in the middle | 554.78 ± 144.18 | 473.24 ± 114.77 | 196.94 ± 53.54 | 2002.06 ± 62.38 | 0.17 ± 0.04 | 47.2 | < 0.001 |
| Track length | 23584.54 ± 5534.90 | 26587.74 ± 4556.87 | 3173.34 ± 1396.84 | 76140.49 ± 2376.32 | 0.18 ± 0.04 | 88.7 | < 0.001 |
| √Freezings | 0.34 ± 0.08 | 0.18 ± 0.06 | 0.08 ± 0.02 | 1.13 ± 0.04 | 0.20 ± 0.05 | 48.2 | < 0.001 |
| ln Emergence time | 0.12 ± 0.05 | 0.06 ± 0.06 | 0.05 ± 0.02 | 1.07 ± 0.05 | 0.09 ± 0.02 | 22.5 | < 0.001 |
| Shoaling tendency | 0 ± 0 | 2457.36 ± 570.96 | 708.87 ± 316.30 | 9900.95 ± 622.10 | 0 ± 0 | 0 | 0.5 |
| ln Cortisol | 0.08 ± 0.02 | 0.02 ± 0.02 | 0.01 ± 0.01 | 0.15 ± 0.01 | 0.31 ± 0.09 | 24.4 | < 0.001 |
Table 2
Additive genetic covariance-correlation matrix (G) from the full multivariate animal model.
Genetic variances provided on the shaded diagonal, with genetic covariances below and genetic correlations above. 95% confidence intervals in parentheses are estimated from 5000 bootstrapped replicates. Where the confidence intervals for any estimate do not cross zero the estimate is considered statistically significant (at the 0.05 alpha level) and are shown in bold.
| Relative area covered | Time in the middle | Track length | √Freezings | -ln Emergence time | Ln Cortisol | |
|---|---|---|---|---|---|---|
| Relative area covered | 0.115 (0.050,0.182) | 0.795 (0.601,0.952) | –0.549 (-0.789,–0.239) | 0.139 (-0.260,0.511) | –0.438 (-1.305,0.239) | –0.376 (-0.959,0.272) |
| Time in the middle | 0.103 (0.044,0.165) | 0.145 (0.070,0.215) | –0.658 (-0.86,–0.414) | 0.363 (0.024,0.659) | –0.153 (-0.815,0.538) | –0.617 (-1.139,–0.155) |
| Track length | –0.071 (-0.127,–0.017) | –0.096 (-0.154,–0.035) | 0.147 (0.080,0.219) | –0.801 (-0.931,–0.647) | 0.61 (0.064,1.328) | 0.425 (-0.027,0.968) |
| √Freezings | 0.020 (-0.034,0.076) | 0.059 (-0.001,0.120) | –0.132 (-0.200,–0.060) | 0.185 (0.091,0.269) | –0.483 (-1.103,0.146) | –0.556 (-1.069,–0.067) |
| -ln Emergence time | –0.041 (-0.103,0.012) | –0.016 (-0.073,0.041) | 0.065 (0.008,0.121) | –0.057 (-0.126,0.009) | 0.076 (0.009,0.148) | –0.020 (-0.807,0.790) |
| ln Cortisol | –0.044 (-0.105,0.023) | –0.082 (-0.145,–0.018) | 0.057 (-0.002,0.119) | –0.083 (-0.155,–0.01) | –0.002 (-0.058,0.053) | 0.121 (0.036,0.206) |
Additional files
-
Supplementary file 1
Fixed effects estimates from the full multivariate animal model.
- https://cdn.elifesciences.org/articles/67126/elife-67126-supp1-v1.docx
-
Supplementary file 2
Permanent environment (co)variance matrix from the full multivariate animal model.
- https://cdn.elifesciences.org/articles/67126/elife-67126-supp2-v1.docx
-
Supplementary file 3
Group (co)variance matrix from the full multivariate animal model.
- https://cdn.elifesciences.org/articles/67126/elife-67126-supp3-v1.docx
-
Supplementary file 4
Residual variance-correlation matrix from the full multivariate animal model.
- https://cdn.elifesciences.org/articles/67126/elife-67126-supp4-v1.docx
-
Supplementary file 5
Among-individual (co)variance matrix from the multivariate model that excluded genetic effects.
- https://cdn.elifesciences.org/articles/67126/elife-67126-supp5-v1.docx
-
Supplementary file 6
Eigen decomposition of the G matrix.
- https://cdn.elifesciences.org/articles/67126/elife-67126-supp6-v1.docx
-
Transparent reporting form
- https://cdn.elifesciences.org/articles/67126/elife-67126-transrepform1-v1.docx
Download links
A two-part list of links to download the article, or parts of the article, in various formats.
Downloads (link to download the article as PDF)
Open citations (links to open the citations from this article in various online reference manager services)
Cite this article (links to download the citations from this article in formats compatible with various reference manager tools)
Genetic integration of behavioural and endocrine components of the stress response
eLife 11:e67126.
https://doi.org/10.7554/eLife.67126


