FnCas9-based CRISPR diagnostic for rapid and accurate detection of major SARS-CoV-2 variants on a paper strip
- CSIR-Institute of Genomics & Integrative Biology, India
- Academy of Scientific & Innovative Research (AcSIR), India
- CSIR-National Chemical Laboratory, India
Figures
Figure 1
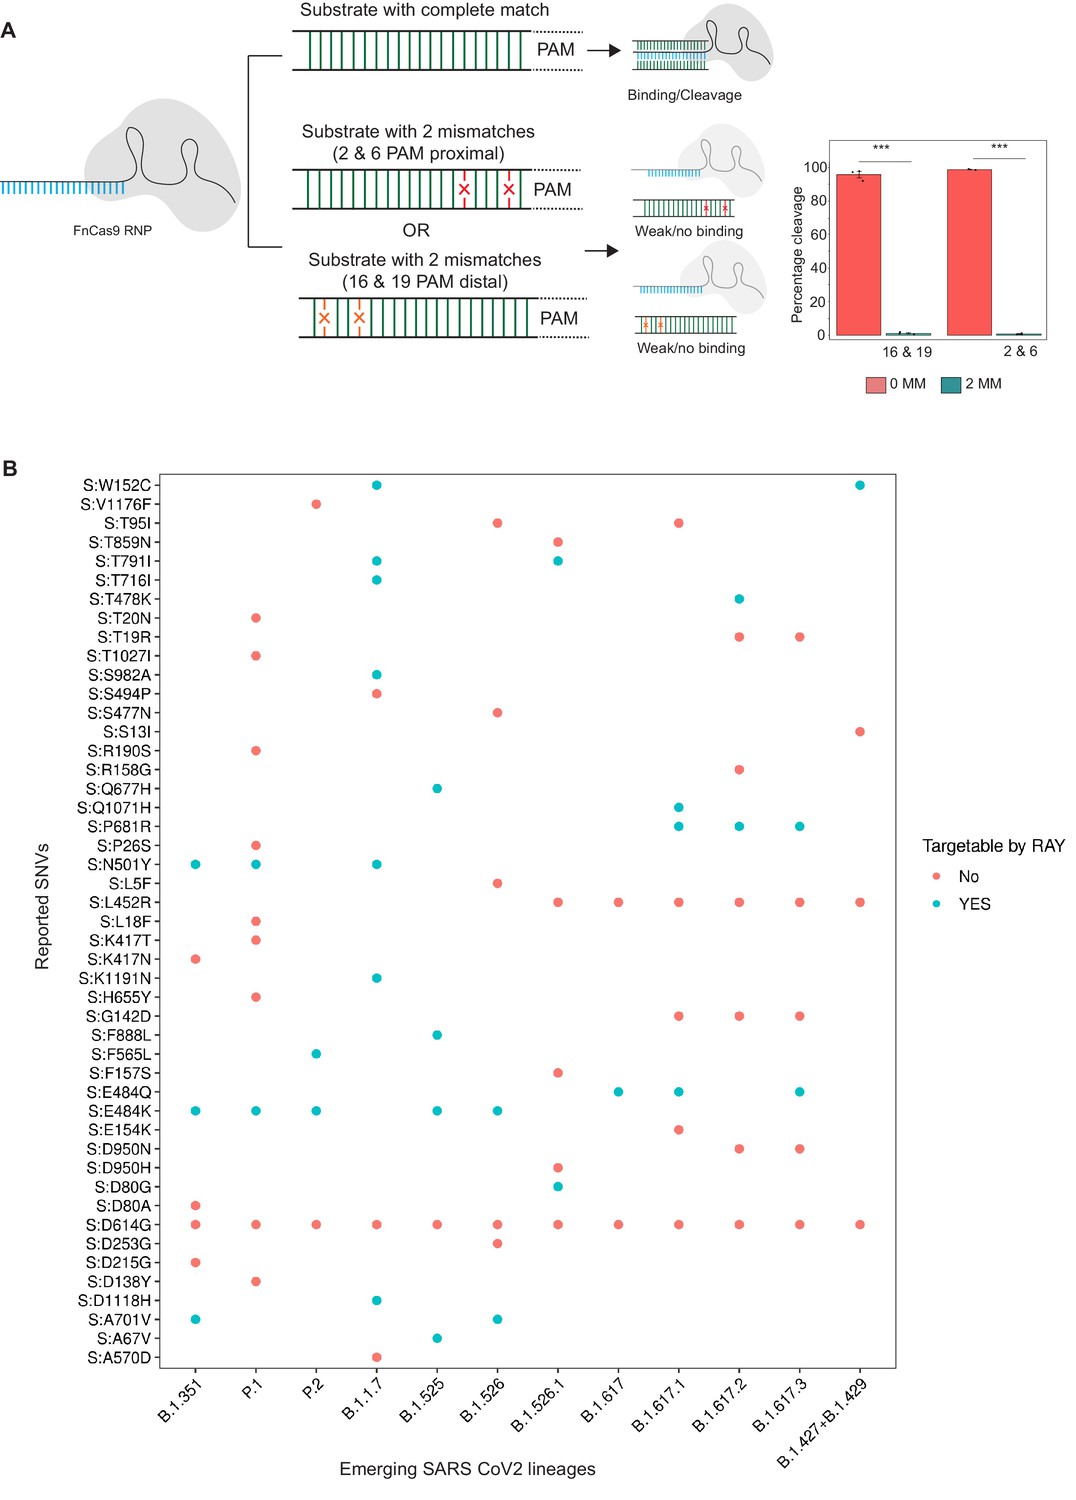
Schematic for RAY.
(A) FnCas9 is unable to bind or cleave targets having two mismatches at the PAM proximal 2nd and 6th or PAM distal 16th and 19th positions as shown (left panel). The quantification of cleavage with a substrate with mismatches at indicated positions is shown (right panel, n = 3 independent experiments, errors s.e.m, student’s paired T-test p values ***<0.001 are shown). (B) Dot plot showing the major SNVs (y-axis) present in the emerging SARS-CoV-2 lineages (x-axis). The status of each SNV as being targetable by RAY is indicated as dots.
Figure 2
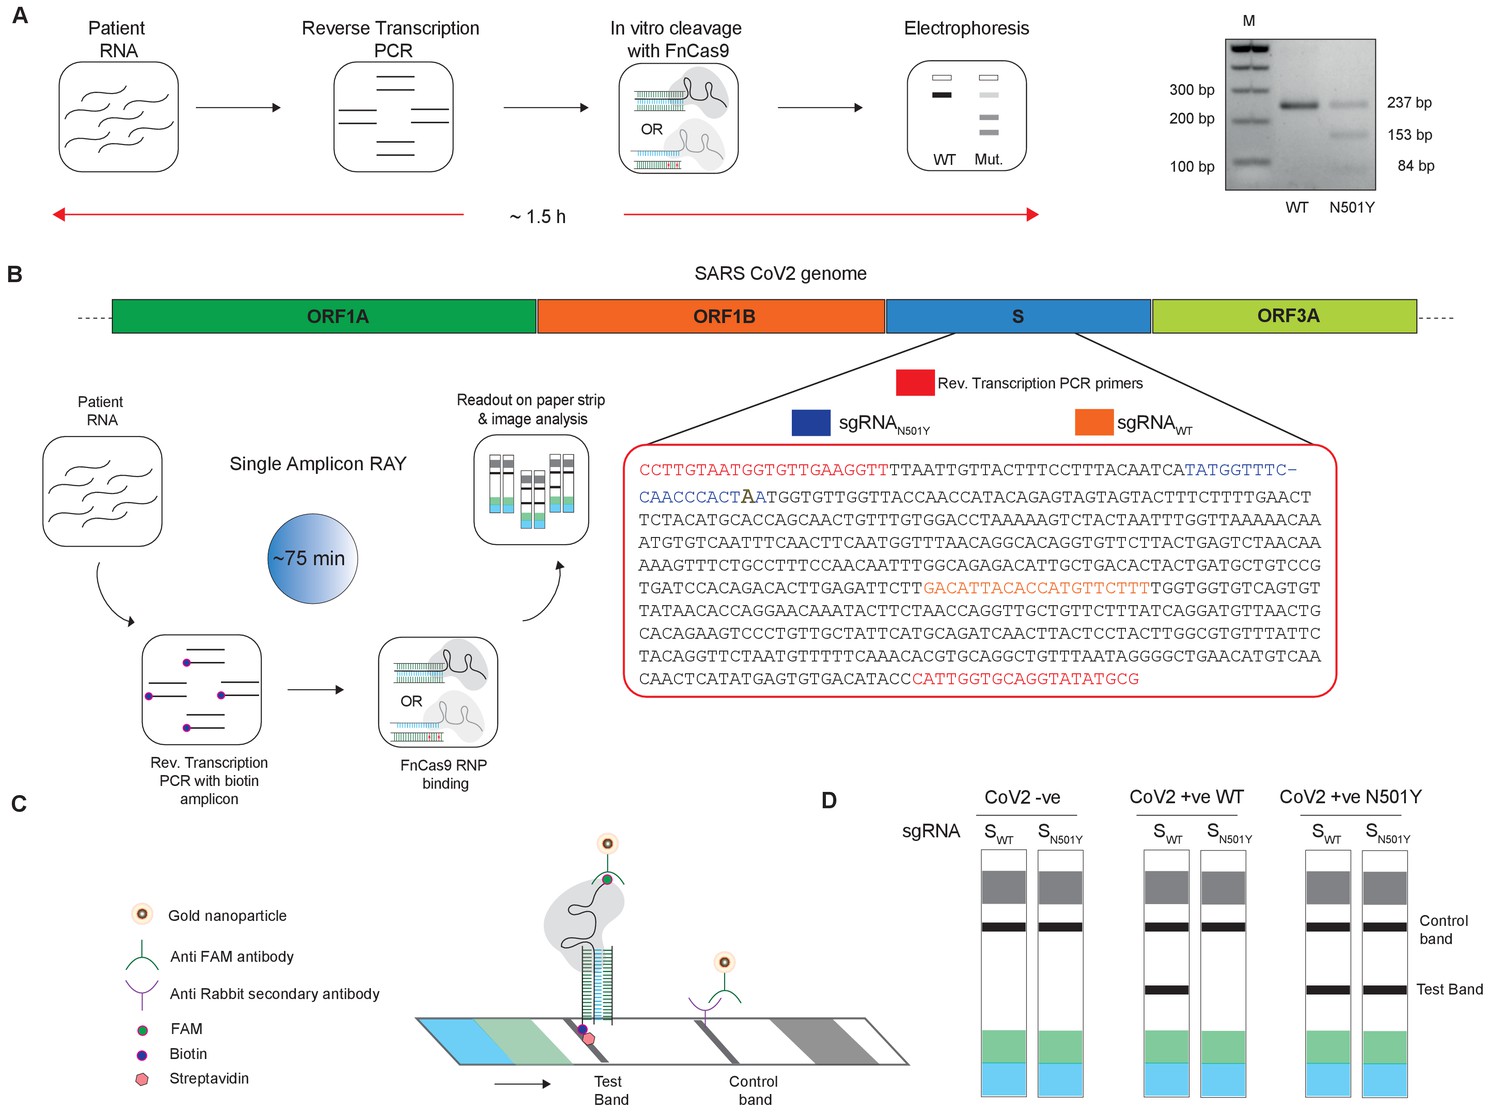
Adaptation of RAY for identification of N501Y mutation.
(A) Schematic showing the application of RAY for distinguishing variants WT and N501Y using electrophoresis, key steps in the process are shown. The uncleaved band represents the amplicon from either the WT or N501Y sample, cleavage occurs only in the N501Y sample. (B) Schematic for detecting the N501Y through a single amplicon RAY on a lateral flow assay is shown. Left panel depicts key steps in the assay. The amplicon sequence and position of primers and sgRNAs are indicated on the right. The N501Y mutation position is shown in raised font. (C) Outcome of the association of FAM-labeled FnCas9 RNP bound to biotin-labeled substrate on the paper strip is shown. Arrow indicates the direction of flow. (D) Different outcomes of RAY on a paper strip based on the starting material. Distinct bands on the streptavidin line (test line) characterize CoV-2 negative, CoV-2 wild type and CoV2 N501Y variants.
Figure 3

Validation of single amplicon RAY on patient samples.
(A) RAY optimization with different size of S gene PCR amplicons. Optimal amplicon length denoted by red dotted box. (B) Reproducibility in output on multiple runs of RAY on the same samples (WT or N501Y) showing high concordance between assays (n = 10 RAY replicates from same sample). (C) RAY outcomes on three groups of patient samples as indicated. The ORF1ab Ct values for every sample is indicated below.
Figure 4
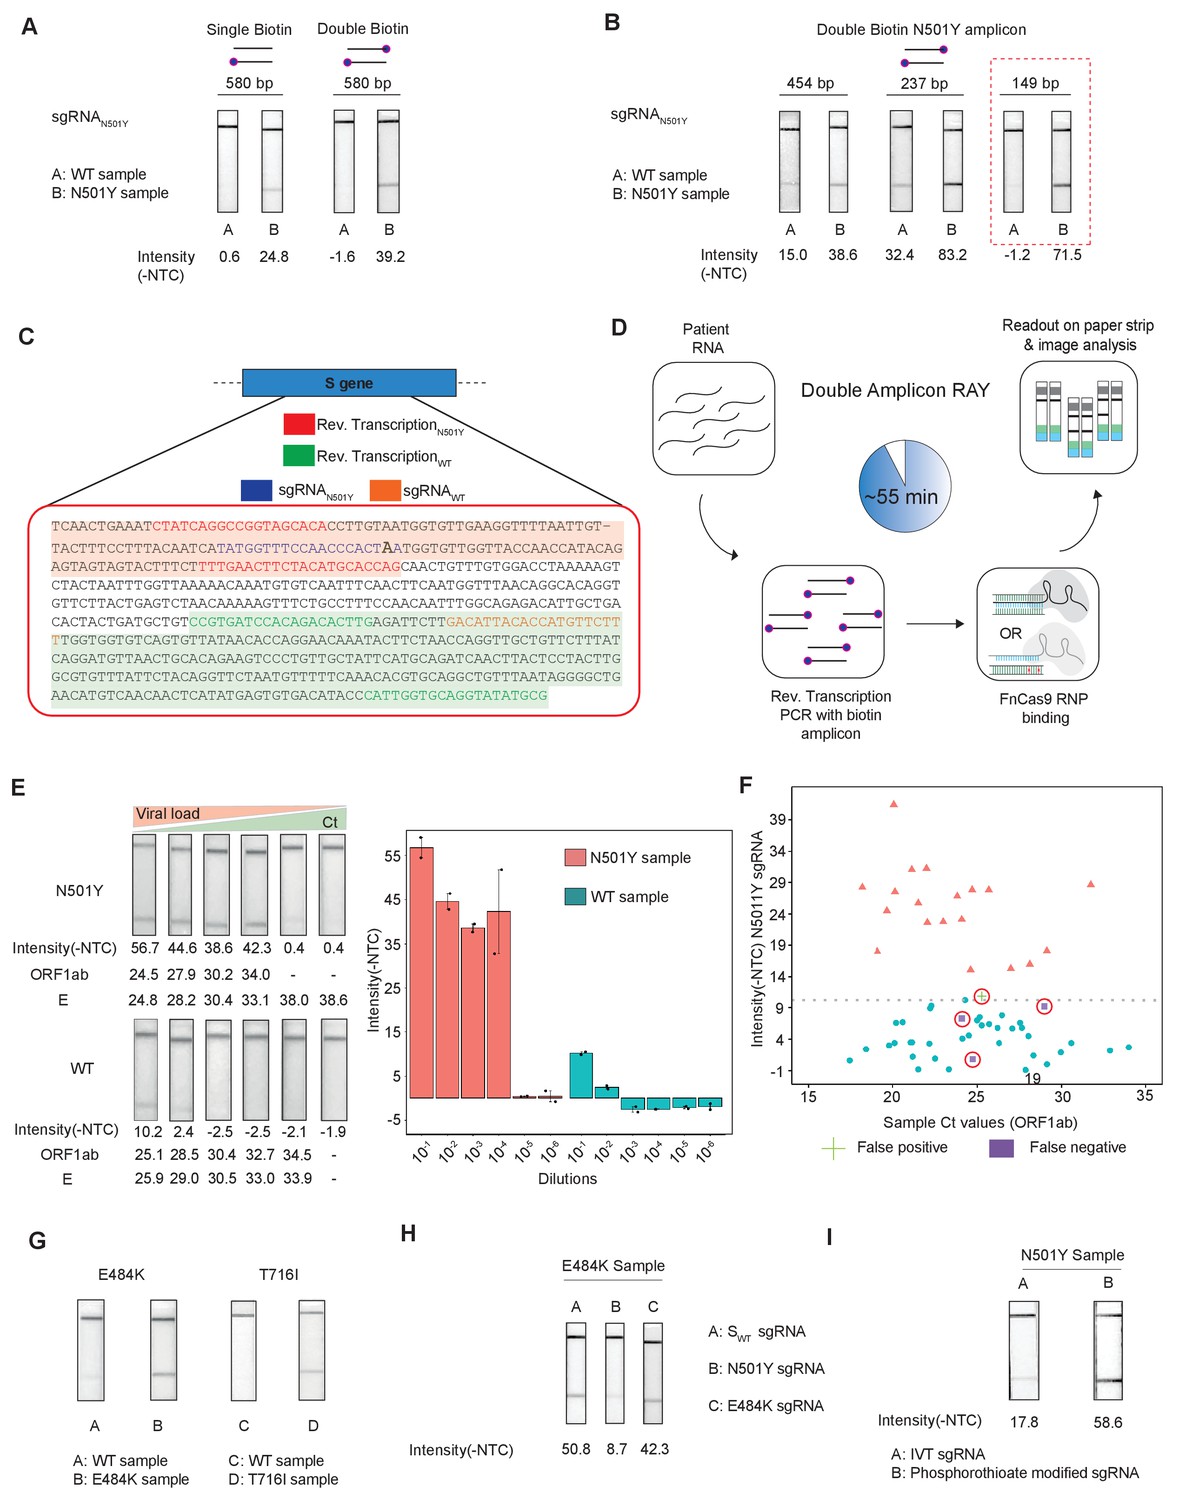
Double amplicon RAY.
(A) Effect of single/double biotin labeling on primers for the 580 bp amplicon. (B) Effect of reduction of amplicon length on RAY outcomes. Red dotted box shows the optimal amplification conditions for successful discrimination of WT and N501Y samples. (C) Schematic for the double amplicon RAY. Positions of primers and sgRNAs for the N501Y sgRNA and WT S-gene sgRNA are shown. The two amplicons are highlighted in green and red. (D) Key steps in the assay and overall time is indicated. (E) Representative image showing the limit of detection of RAY for serial dilutions of patient samples (N501Y or WT as indicated). The corresponding TOPSE and ORF1ab Ct values are shown below. Right panel shows a quantification of the image intensity values (n = 2 RAY replicates per sample). (F) Graph showing the distribution of sequenced confirmed WT (cyan dot) and N501Y (red triangle) containing patient samples detected through RAY. Dotted line depicts the cut-off for N501Y sgRNA. (G) RAY outcomes on E484K and T716I mutations from patient samples. (H) Outcome of RAY showing minimal cross-reactivity of N501Y sgRNA on the E484K amplicon. (I) Increased signal intensity of N501Y RAY on patient samples upon using phosphorothioate modified synthetic sgRNA as compared to in vitro synthesized sgRNA.
Appendix 1—figure 1
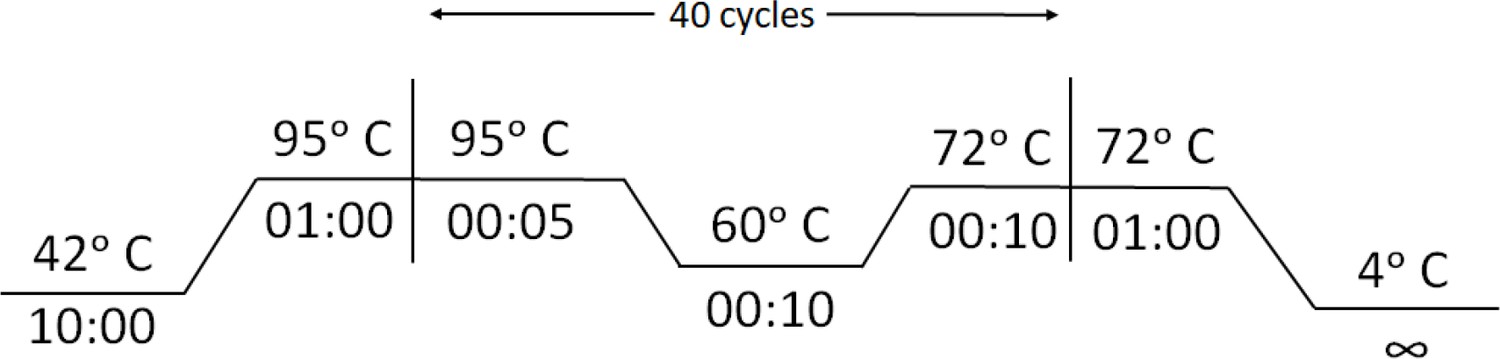
Cycling conditions for Reverse Transcription-PCR for RAY .
Appendix 1—figure 2
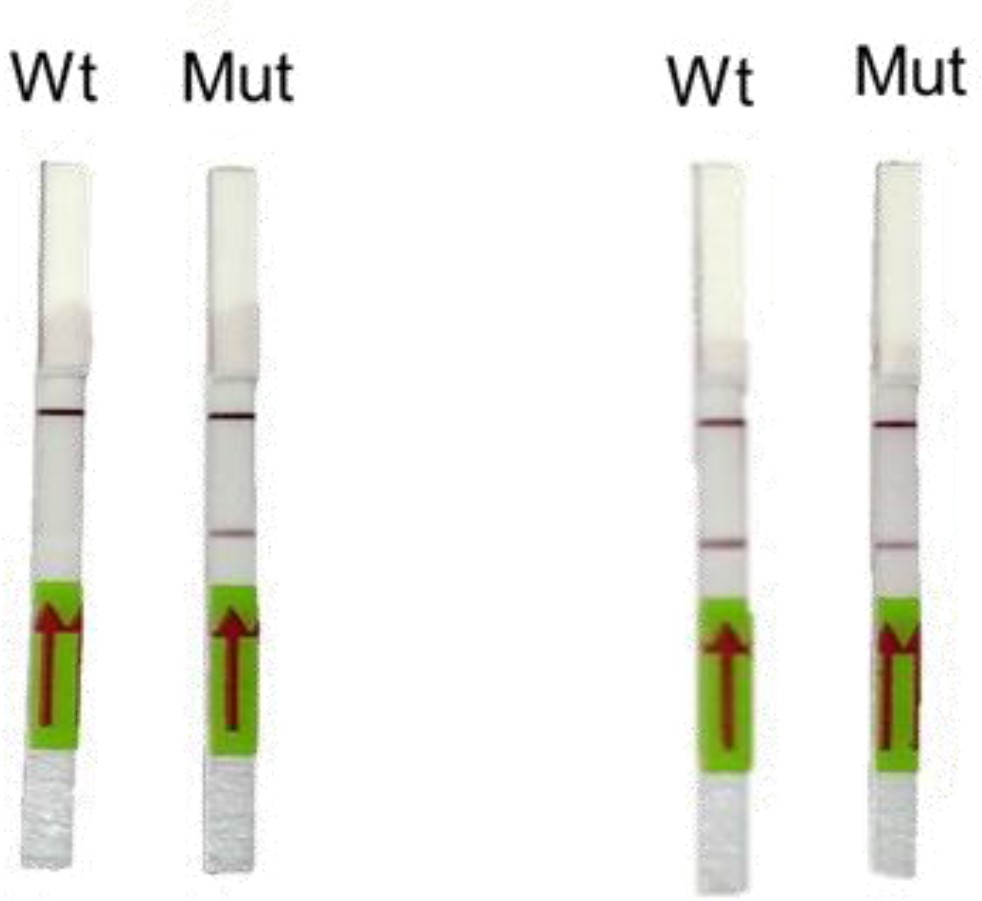
Representative image of RAY outcomes on a paper strip for sample having the N501Y mutation (Mut) or the parent CoV-2 sequence (Wt).
Left panel shows outcome with SN501Y sgRNA and the right panel shows the outcome with SWT sgRNA.
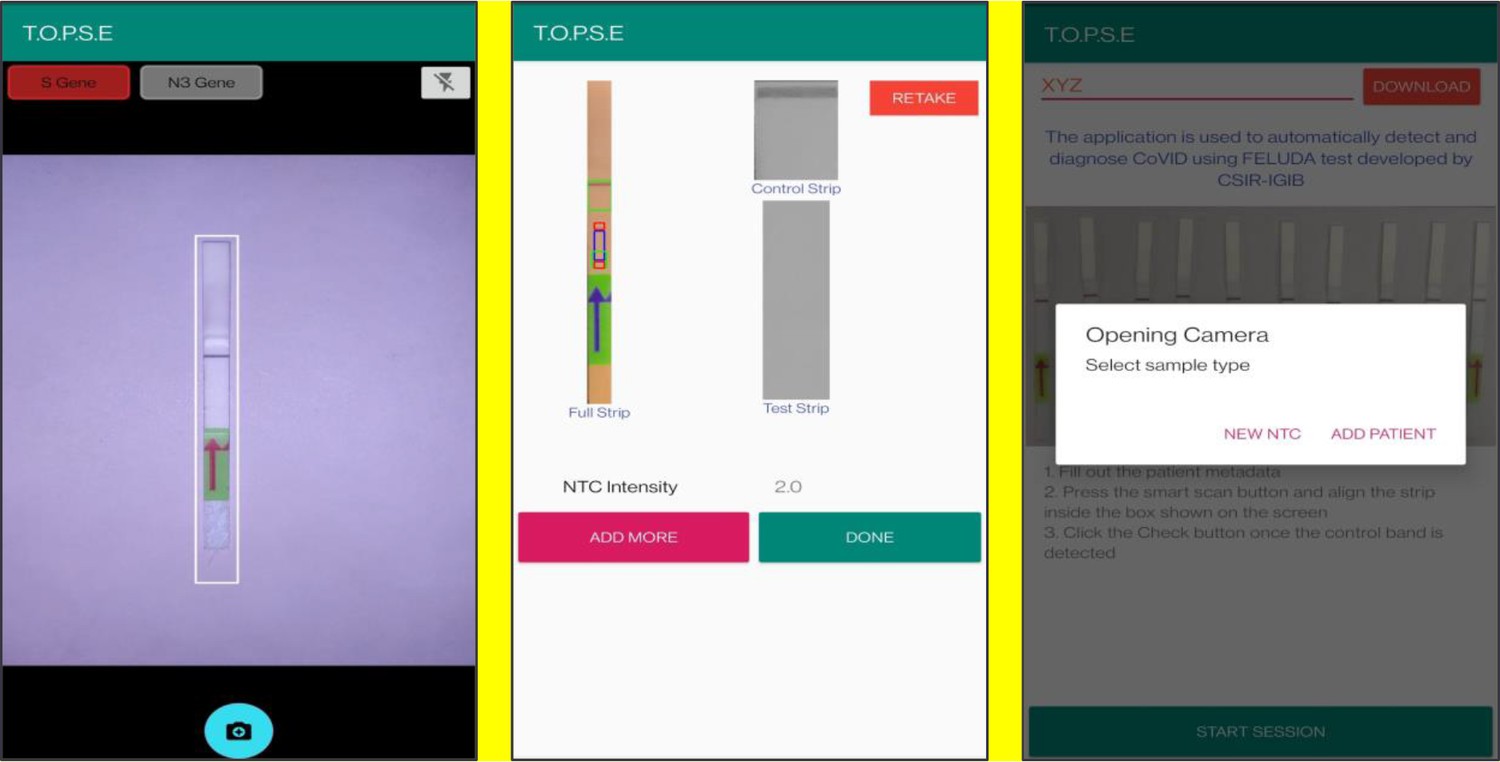
Appendix 1—figure 3

Representative screen-shots showing TOPSE app home page and user interface.
Appendix 1—figure 4
Representative screen-shots showing TOPSE image acquisition for NTC background correction.
Appendix 1—figure 5
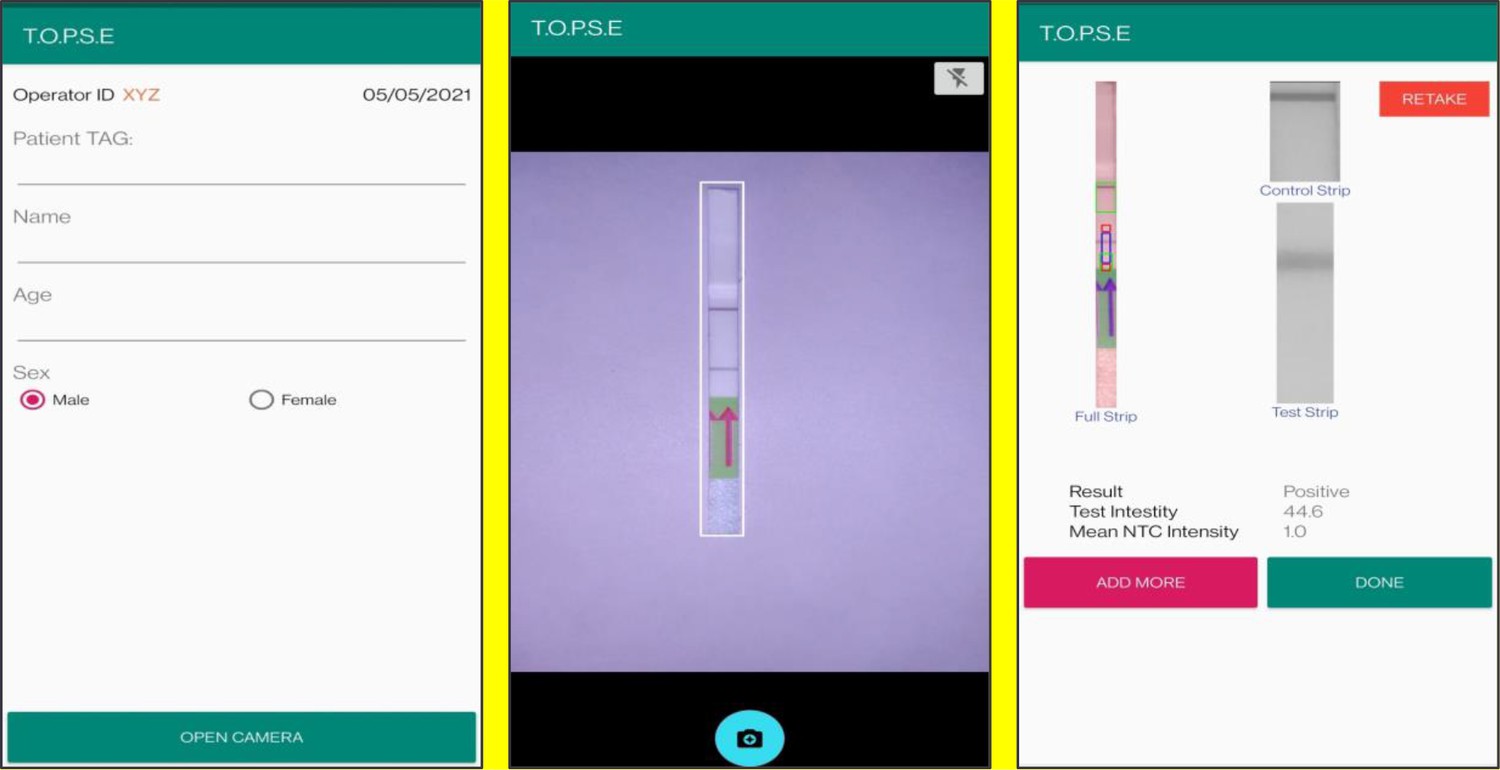
Representative screen-shots showing TOPSE data entry step and image acquisition for a sample identified as ‘’Positive’’.
Appendix 1—figure 6
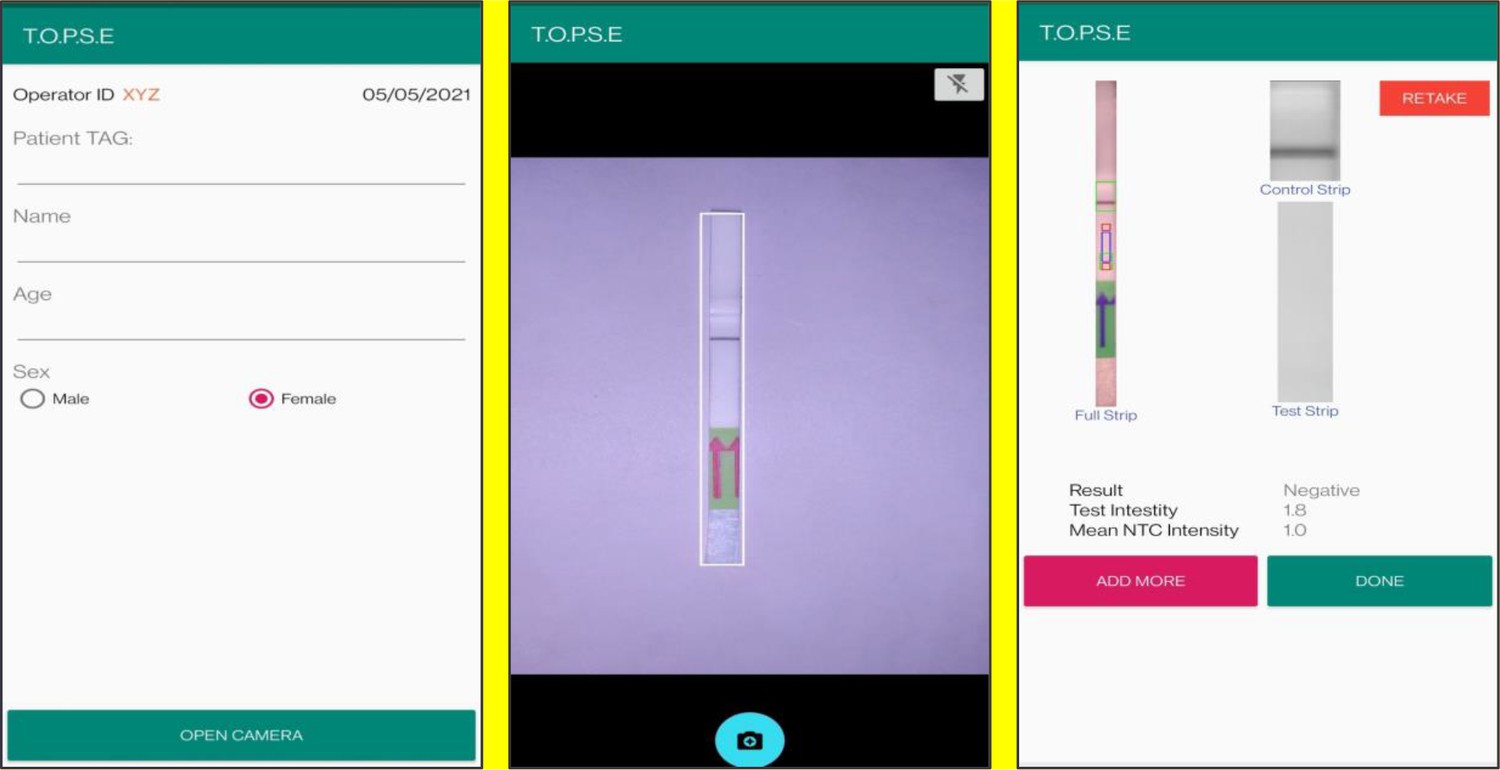
Representative screen-shots showing TOPSE data entry step and image acquisition for a sample identified as “Negative’’.
Additional files
-
Supplementary file 1
Mutations across emerging SARS-CoV-2 lineages showing the possibility of RAY based targetability of VOCs/VOIs.
- https://cdn.elifesciences.org/articles/67130/elife-67130-supp1-v2.xlsx
-
Supplementary file 2
RAY outcomes on patient samples (WT or N501Y).
The cutoff for SWT is 6.7 and SN501Y is 10.2.
- https://cdn.elifesciences.org/articles/67130/elife-67130-supp2-v2.xlsx
-
Supplementary file 3
Price estimate of RAY consumables.
- https://cdn.elifesciences.org/articles/67130/elife-67130-supp3-v2.xlsx
-
Supplementary file 4
List of oligos used in this study.
- https://cdn.elifesciences.org/articles/67130/elife-67130-supp4-v2.xlsx
-
Transparent reporting form
- https://cdn.elifesciences.org/articles/67130/elife-67130-transrepform-v2.pdf
Download links
A two-part list of links to download the article, or parts of the article, in various formats.
Downloads (link to download the article as PDF)
Open citations (links to open the citations from this article in various online reference manager services)
Cite this article (links to download the citations from this article in formats compatible with various reference manager tools)
FnCas9-based CRISPR diagnostic for rapid and accurate detection of major SARS-CoV-2 variants on a paper strip
eLife 10:e67130.
https://doi.org/10.7554/eLife.67130


