7-Dehydrocholesterol-derived oxysterols cause neurogenic defects in Smith-Lemli-Opitz syndrome
- Department of Medicinal Chemistry, University of Washington, United States
Figures
Figure 1 with 1 supplement
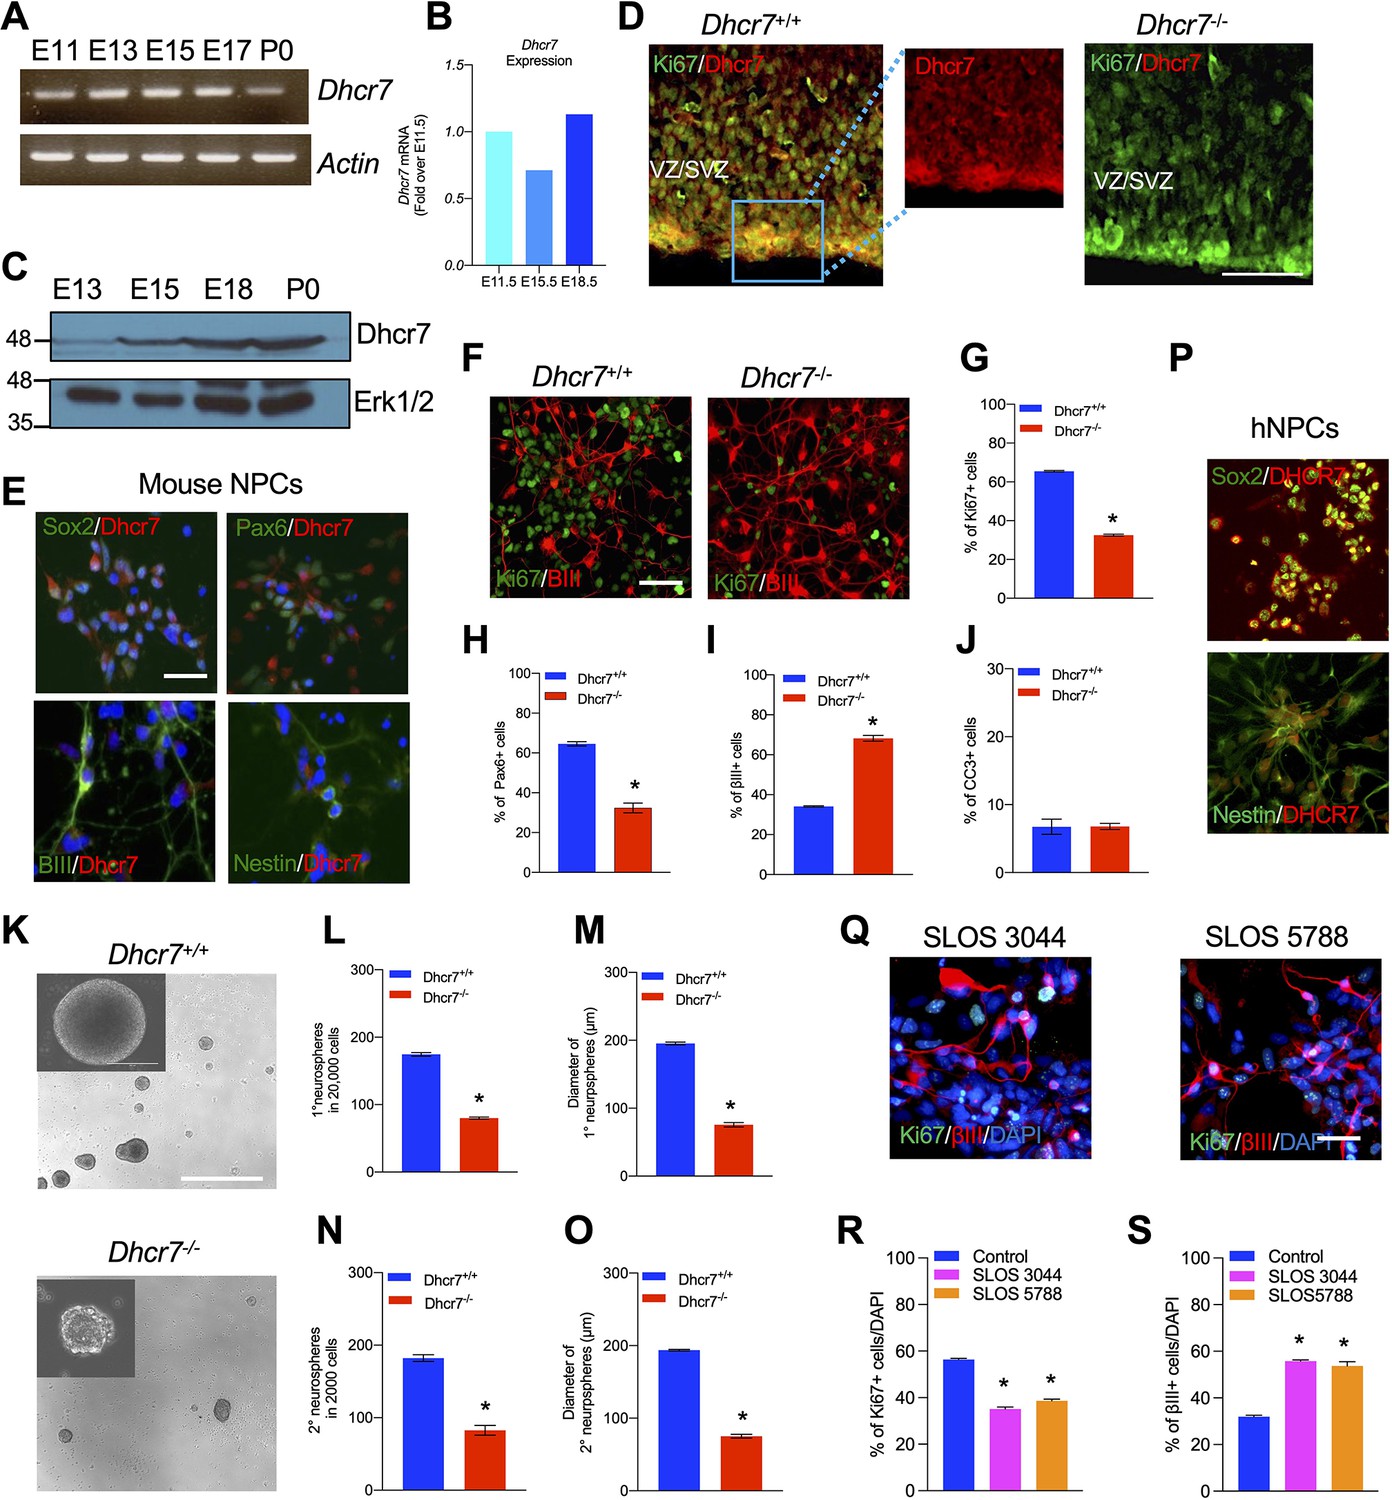
Loss of Dhcr7 alleles causes decreased proliferation and increased neurogenesis in murine and human neural progenitor cells.
(A) RT-PCR for Dhcr7 mRNA in the E11.5 to P0 cortex. β-actin mRNA was used as the loading control. (B) qRT-PCR for Dhcr7 mRNA in the E11.5 to E18.5 cortex. Data is expressed as fold change over E11.5 cortex. (C) Western blot of Dhcr7 in total cortical lysates from E13.5 to P0. The blot was re-probed for Erk1/2 as a loading control. (D) Images of E13.5 Dhcr7+/+ (Dhcr7-WT, left panel) and Dhcr7-/- (Dhcr7-KO, right panel) cortical sections immunostained for Dhcr7 (red). The subventricular/ventricular zone (SVZ/VZ) is denoted. The right panels show the image of the boxed area. Scale bar = 100 μm. (E) Images of cultured mouse cortical precursors immunostained for Dhcr7 (red) and Sox2, Pax6, βIII-tubulin and Nestin (green) and counterstained with DAPI (blue). Scale bar = 50 μm. (F–J) E12.5 cortical precursors from single Dhcr+/+ and Dhcr7-/- embryos were cultured for 3 days and analyzed. (F) Cells were immunostained for Ki67 (green) and βIII-tubulin (red) after 3 days and quantified for the proportions of Ki67 + (G), Pax6+ (H), βIII-tubulin+ (I) and CC3 + cells (J). Scale bar = 50 μm. *, p<0.001; n=3 embryos per genotype. (K–O) E13.5 cortical precursor cells from single Dhcr7+/+ or Dhcr7-/- embryos were cultured as primary neurospheres (K) and the number and diameter of primary neurospheres were quantified 6 days later (L, M). Equal numbers of primary neurospheres were then passaged, and the number and diameter of secondary neurospheres were quantified 6 days later (N, O). Representative images of Dhcr+/+ and Dhcr7-/- neurospheres are shown as inserts in the left corner. *, p<0.001; n=3 embryos per genotype. Scale Bar = 100 μm. (P–S) Loss of DHCR7 alleles causes decreased proliferation and increased neurogenesis in human cortical precursors. (P) Images of cultured human cortical precursors immunostained for Dhcr7 (red) and Sox2 or Nestin (green). (Q–S) Human SLOS patient-derived (SLOS 3044 and SLOS 5788) and unaffected individual (Control)-derived cortical precursors were cultured for 3 days and analyzed. (Q) Cells were immunostained for Ki67 (green) and βIII-tubulin (red) after 3 days and quantified the proportions of Ki67 + (R) and βIII-tubulin + cells (S). Scale Bar = 50 μm. *, p<0.001; n=3 biological replicates per genotype.
-
Figure 1—source data 1
Related to Figure 1A.
RT-PCR for Dhcr7 mRNA in the E11.5 to P0 cortex. β-actin mRNA was used as loading control.
- https://cdn.elifesciences.org/articles/67141/elife-67141-fig1-data1-v2.pdf
-
Figure 1—source data 2
Related to Figure 1C.
Western blot of Dhcr7 in total cortical lysates from E13.5 to P0. The blot was re-probed for Erk1/2 as a loading control.
- https://cdn.elifesciences.org/articles/67141/elife-67141-fig1-data2-v2.pdf
Figure 1—figure supplement 1
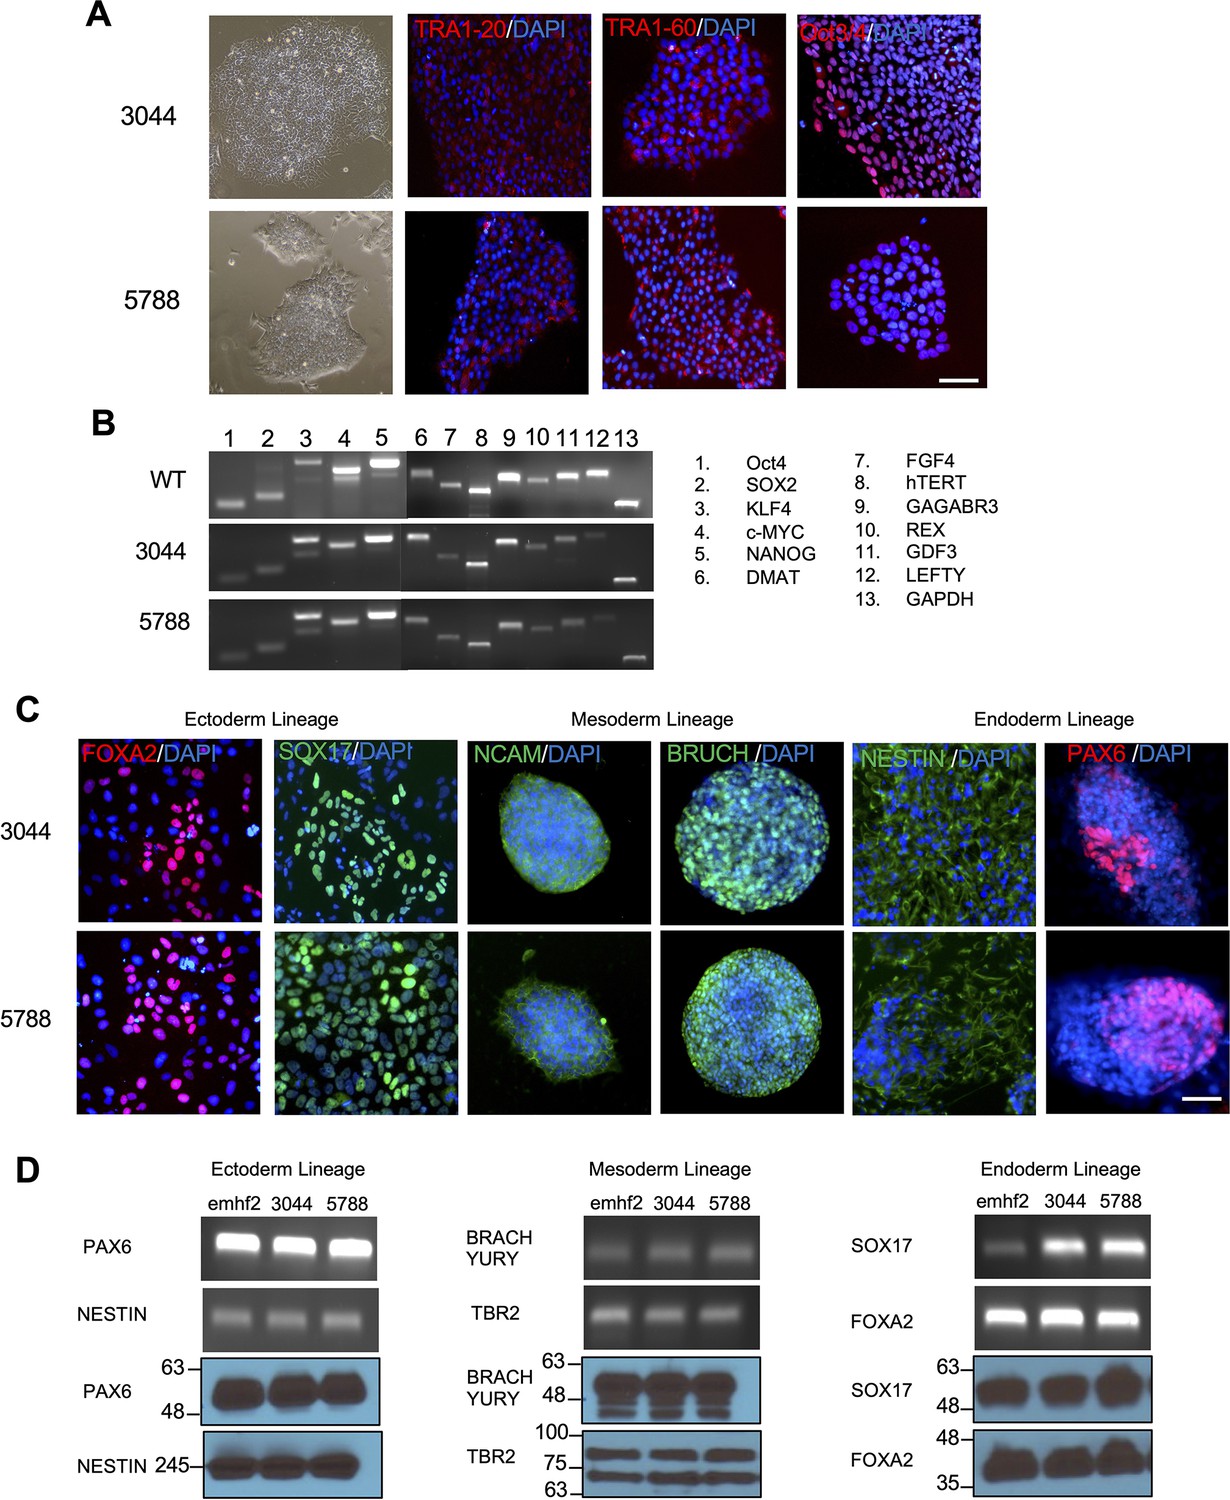
Characterization of the pluripotency of SLOS-derived human iPSCs.
Related to Figure 1. Pluripotency of SLOS patient derived human iPSC lines, 3044 and 5788 were characterized. (A) Representative images of established SLOS patient derived human iPSC lines (3044 and 5788) and human iPSC line from healthy individual (emhf2). (B) RT-PCR analysis of hES cell marker genes in human iPSCs derived from SLOS patients (3044 and 5788) and healthy individual (emhf2). Primers used for Oct3/4, Sox2, Klf4, and c-Myc specifically amplified endogenous transcripts but not transgenic transcripts. (C) Immunostaining confirming in-vitro differentiation of SLOS patient derived human iPSCs (3044 and 5788) into all three germ layers. (D) RT-PCR analyses and western blot analyses of differentiation markers for the three germ layers.
-
Figure 1—figure supplement 1—source data 1
Related to Figure 1—figure supplement 1B.
RT-PCR analysis of hES cell marker genes in human iPSCs derived from SLOS patients (3044 and 5788) and healthy individual (emhf2).
- https://cdn.elifesciences.org/articles/67141/elife-67141-fig1-figsupp1-data1-v2.pdf
-
Figure 1—figure supplement 1—source data 2
Related to Figure 1—figure supplement 1D.
RT-PCR analyses and Western blot analyses of differentiation markers for the three germ layers.
- https://cdn.elifesciences.org/articles/67141/elife-67141-fig1-figsupp1-data2-v2.pdf
Figure 2 with 2 supplements

Cholesterol precursor 7-DHC and 7-DHC-derived Oxysterols are accumulated in Dhcr7-/- mouse embryonic cortex.
(A) Chemical structures of 7-DHC-derived oxysterols. LC-MS/MS analysis of (B) cholesterol and its precursors and (C) 7-DHC and cholesterol-derived oxysterols in Dhcr7+/+ and Dhcr7-/- embryonic cortex during development. Error bars indicate standard deviation. *, p<0.05; **, p<0.005; ***, p<0.001; n=3 biological replicates per group.
Figure 2—figure supplement 1
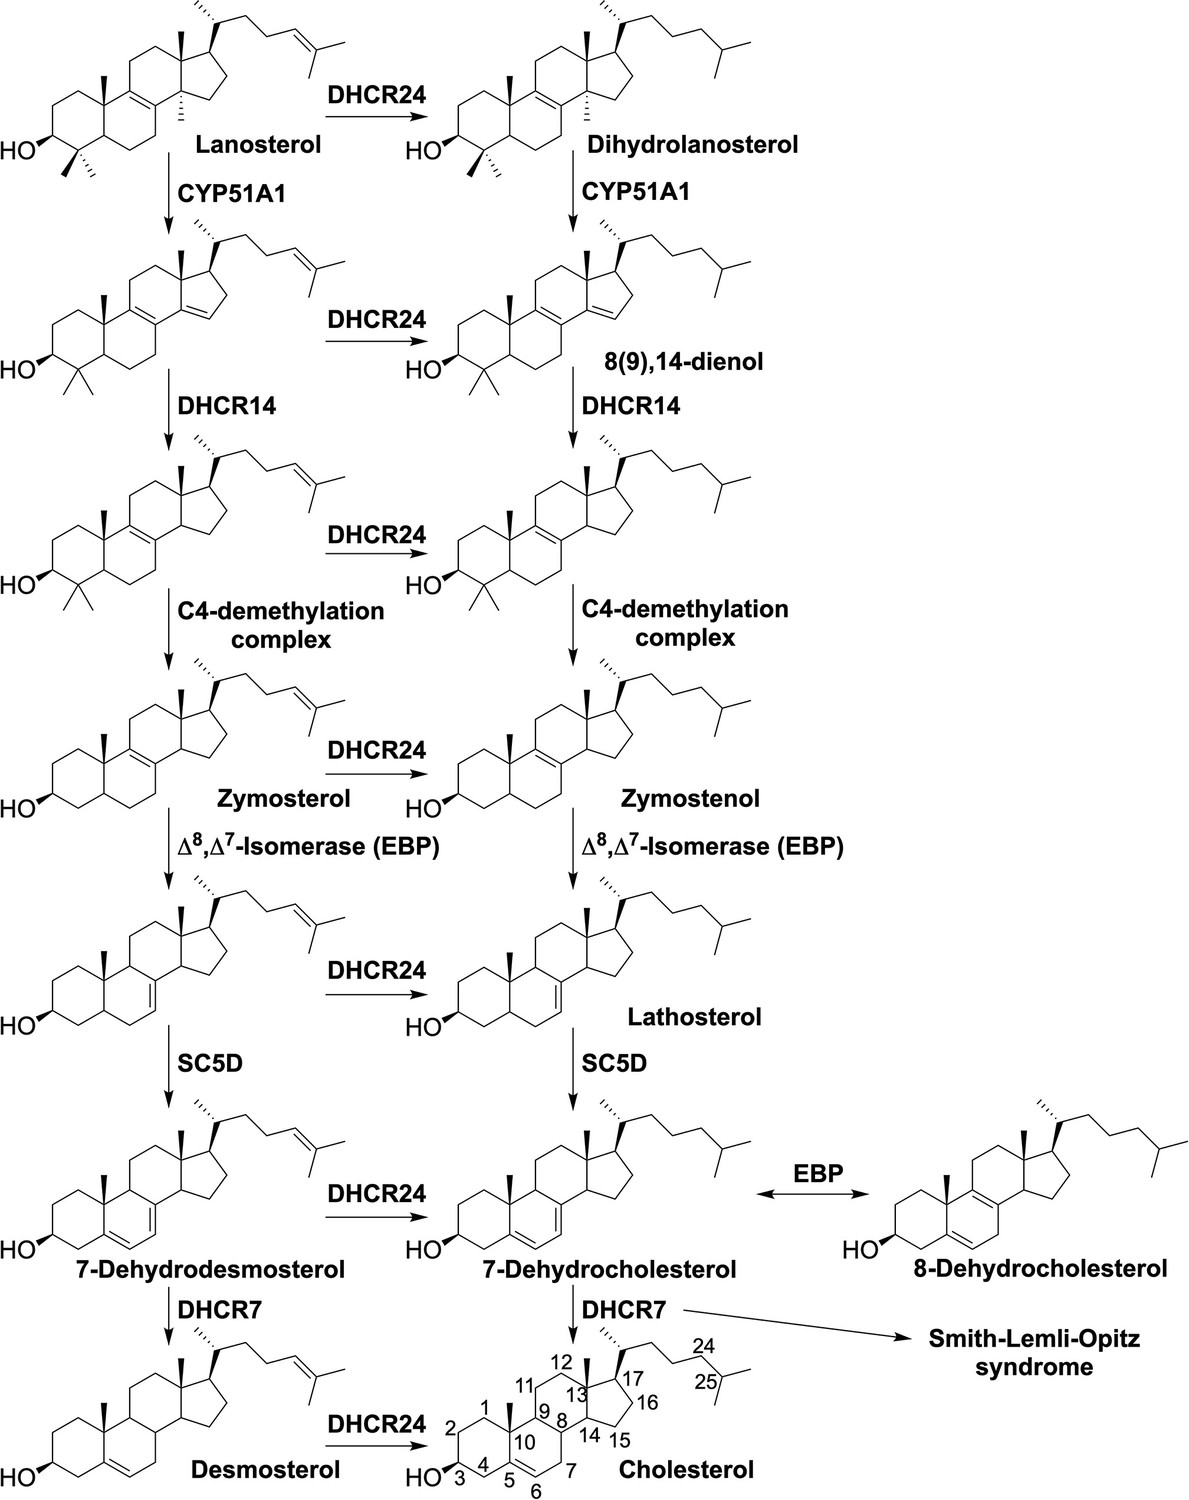
Cholesterol biosynthesis pathway, the enzymes involved in the synthesis and the diseases associated with the defective enzymes.
Related to Figure 2.
Figure 2—figure supplement 2
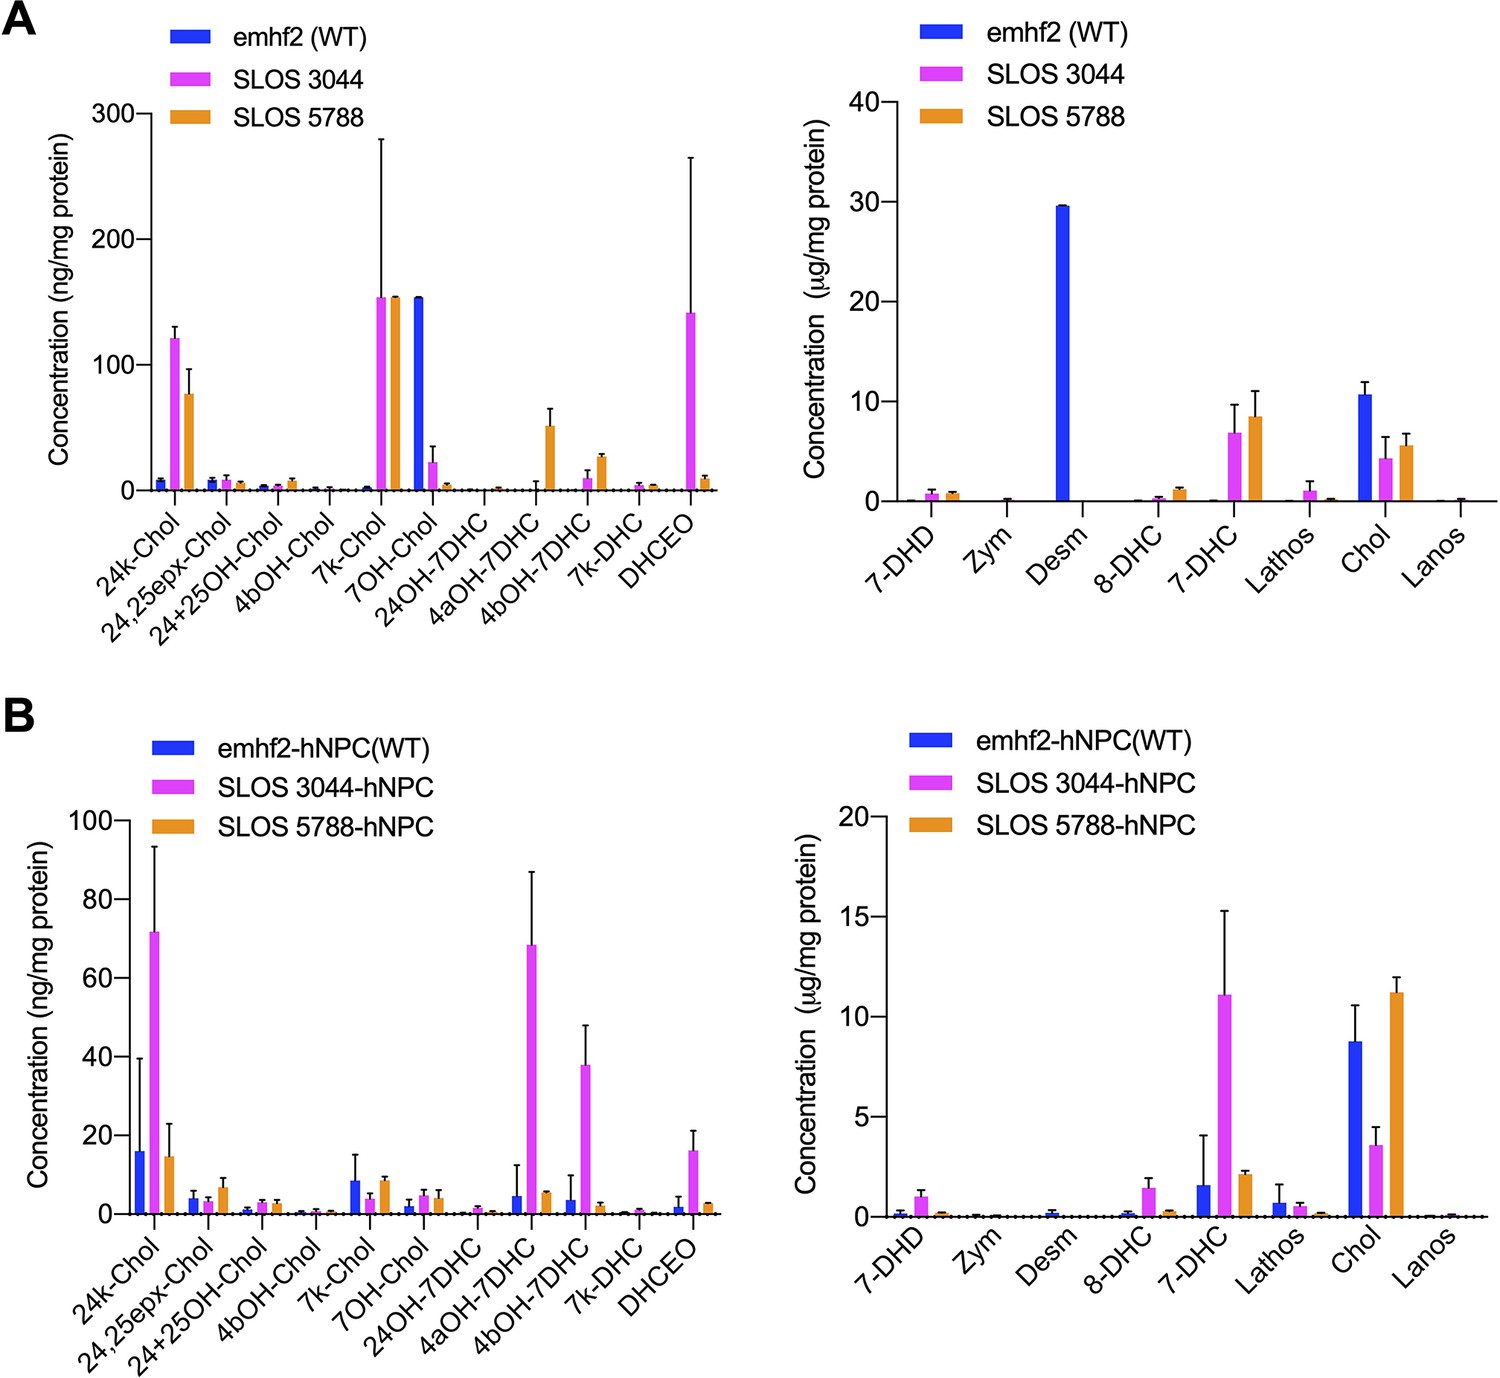
Cholesterol precursor 7-DHC and 7-DHC-derived Oxysterols are accumulated in SLOS-derived human iPSCs and NPCs.
Related to Figure 2. SLOS patient derived hiPSCs and NPCs (3044 and 5788) along hiPSCs and NPC from healthy individual (emhf2) were cultured and used for LC-MS/MS analysis sterols and oxysterols. Quantitation of cholesterol, its precursors and accumulated 7-DHC derived oxysterols in SLOS patient derived hiPSCs and hiPSCs from healthy individuals (A) and in SLOS patient derived NPCs and NPCs from healthy individuals (B).
Figure 3 with 1 supplement
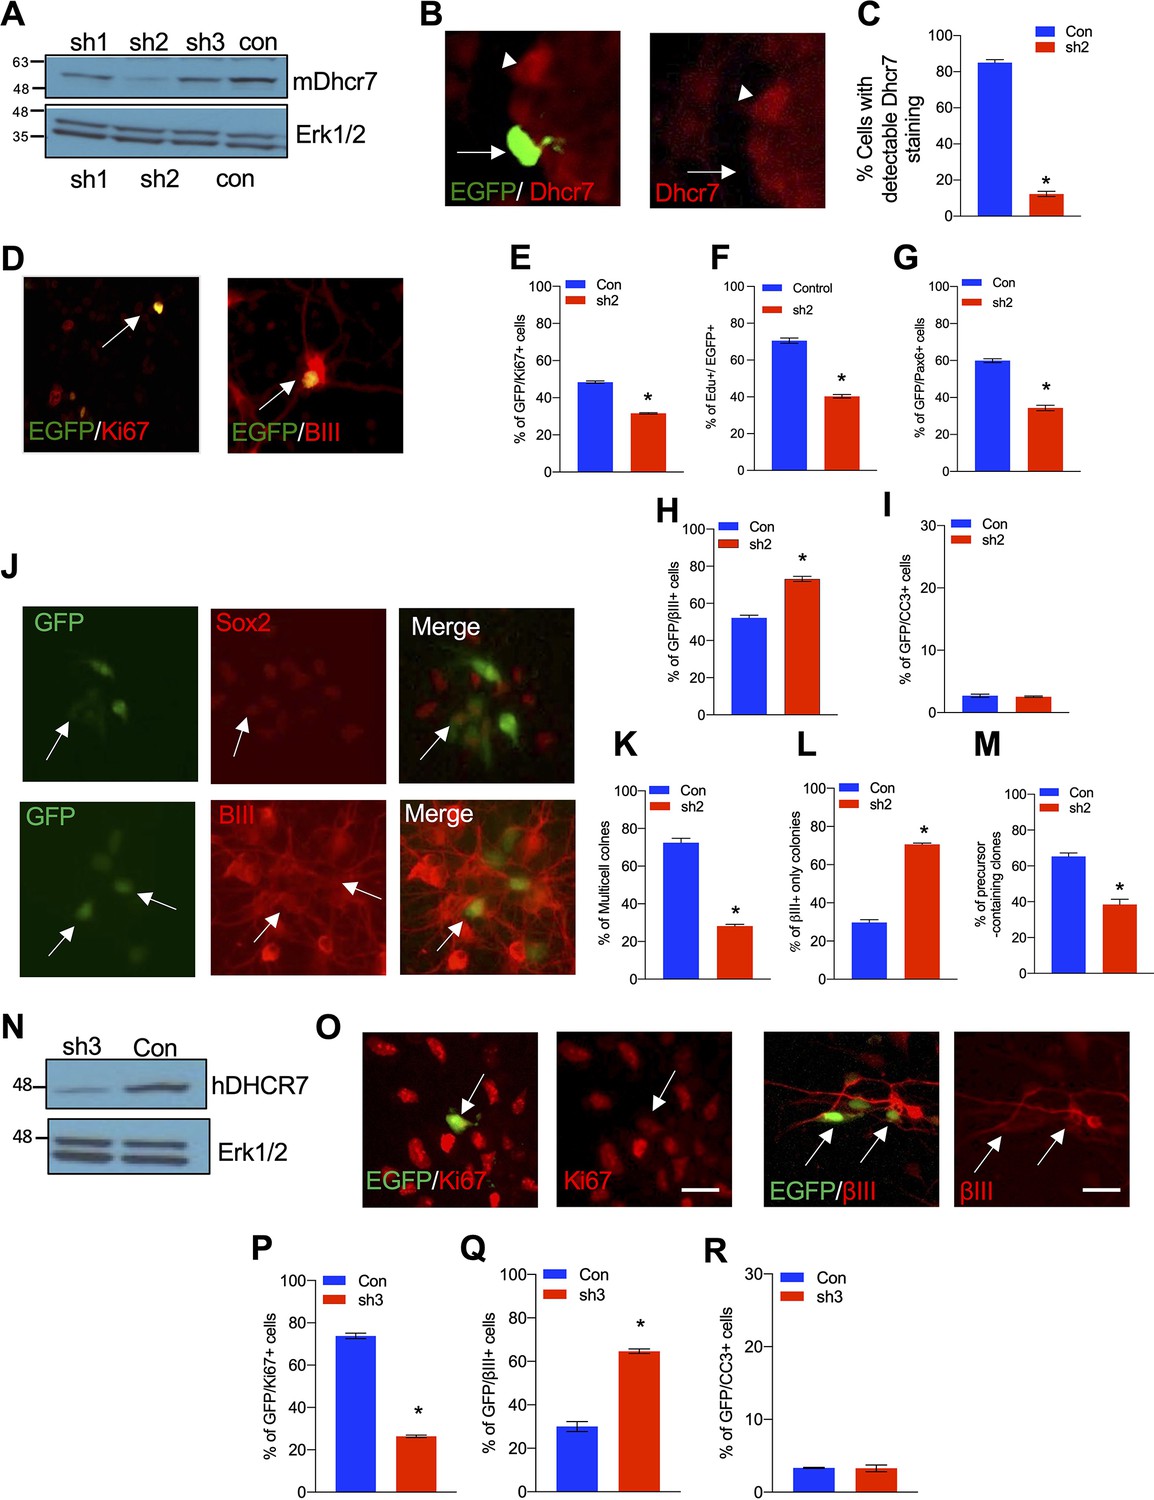
Knockdown of Dhcr7 causes increased neurogenesis and depletion of cycling precursors in murine and human NPC cultures.
(A) Western blot for Dhcr7 in 293T cells transfected with control or individual murine Dhcr7 shRNAs. The blot was re-probed for Erk1/2 as a loading control. (B and C) Mouse cortical precursors were transfected EGFP-Dhcr7 shRNAs (sh2) or EGFP-control (Con) and immunostained for EGFP and Dhcr7 (red) 2 days later and EGFP + cells expressing detectable Dhcr7 were quantified by fluorescence intensity (C). Arrow and arrowhead in (B) denote EGFP+/Dhcr7- and EGFP-/Dhcr7 + cells, respectively. (D–G) E12.5 cortical precursors were transfected with control or Dhcr7 shRNAs and analyzed 3 days later. (D) Cultures were immunostained for EGFP (green) and Ki67 or βIII-tubulin (red; double-labelled cells in orange are indicated with arrows) or CC3. (E–I) The proportion of total EGFP + cells that were also positive for Ki67 (E), EdU 2 days after labeling (F), Pax6 (G), βIII-tubulin (H) or CC3 (I) was quantified. *, p<0.001; n=3. Scale bar = 50 μm. In all cases, error bars denote SEM. (J–M) E12.5 precursors were co-transfected with the PB transposase and PB-EGFP-control (Con) or PB-EGFP-DHCR7 shRNA (sh2). (J) Cultured cells were immunostained for EGFP (green), Sox2 (red) and βIII-tubulin (red) after 3 days and quantified for clones greater than one cell in size (K), neuron-only clones (L), and clones with at least one Sox2 + precursors (M). Arrows in (J) top denote EFGP +/ Sox2 + precursors. Arrows in (J) bottom denote EGFP+/βIII-tubulin + cells. *, p<0.001; n=3. (N) Western blots of DHCR7 in 293T cells transfected with human control (Con) or human-specific DHCR7 shRNA (sh3) plus human DHCR7-expressing plasmid, analyzed after 24 hr. The blot was re-probed for Erk1/2. (O) Human cortical precursors were transfected with EGFP-control (Con) or EGFP-DHCR7 shRNA (sh3). Cells were immunostained 3 days later for EGFP (green) and Ki67 (red), βIII-tubulin (red) or CC3 and the proportion of total EGFP + cells that were also positive for Ki67 (P), βIII-tubulin (Q), or CC3 (R) was quantified. *, p<0.001; n=3. Scale Bar = 50 μm. Allows in (N) denote double-positive cells.
-
Figure 3—source data 1
Related to Figure 3A.
Western blot for Dhcr7 in 293T cells transfected with control or individual murine Dhcr7 shRNAs. The blot was re-probed for Erk1/2 as a loading control.
- https://cdn.elifesciences.org/articles/67141/elife-67141-fig3-data1-v2.pdf
-
Figure 3—source data 2
Related to Figure 3N.
Western blots of DHCR7 in 293T cells transfected with human control (Con) or human-specific DHCR7 shRNA (sh3) plus human DHCR7-expressing plasmid, analyzed after 24 hr. The blot was re-probed for Erk1/2.
- https://cdn.elifesciences.org/articles/67141/elife-67141-fig3-data2-v2.pdf
Figure 3—figure supplement 1
Rescue of the neurogenesis phenotype in Dhcr7-knockdown mouse cortical precursors by human DHCR7 cDNA expression vector.
Related to Figure 3. Human DHCR7 cDNA expressing vectors transfected murine NPCs with either murine Dhcr7 shRNA vector or control shRNA vectors. The transfected cells were cultured for 3 days, immunostained and analyzed for proliferation marker, Ki67 or neuronal marker, βIII tubulin. (A) Potential off-target effects of murine Dhcr7 shRNAs were determined. (B) Cultures were immunostained for EGFP-mDhcr7shRNA and proliferation marker Ki67, the proportion of total EGFP + cells that were also positive for Ki67 was quantified. (C) Cultures were immunostained for EGFP-mDhcr7shRNA and neuronal marker, βIII tubulin, the proportion of total EGFP + cells that were also positive for βIII tubulin was quantified.
Figure 4
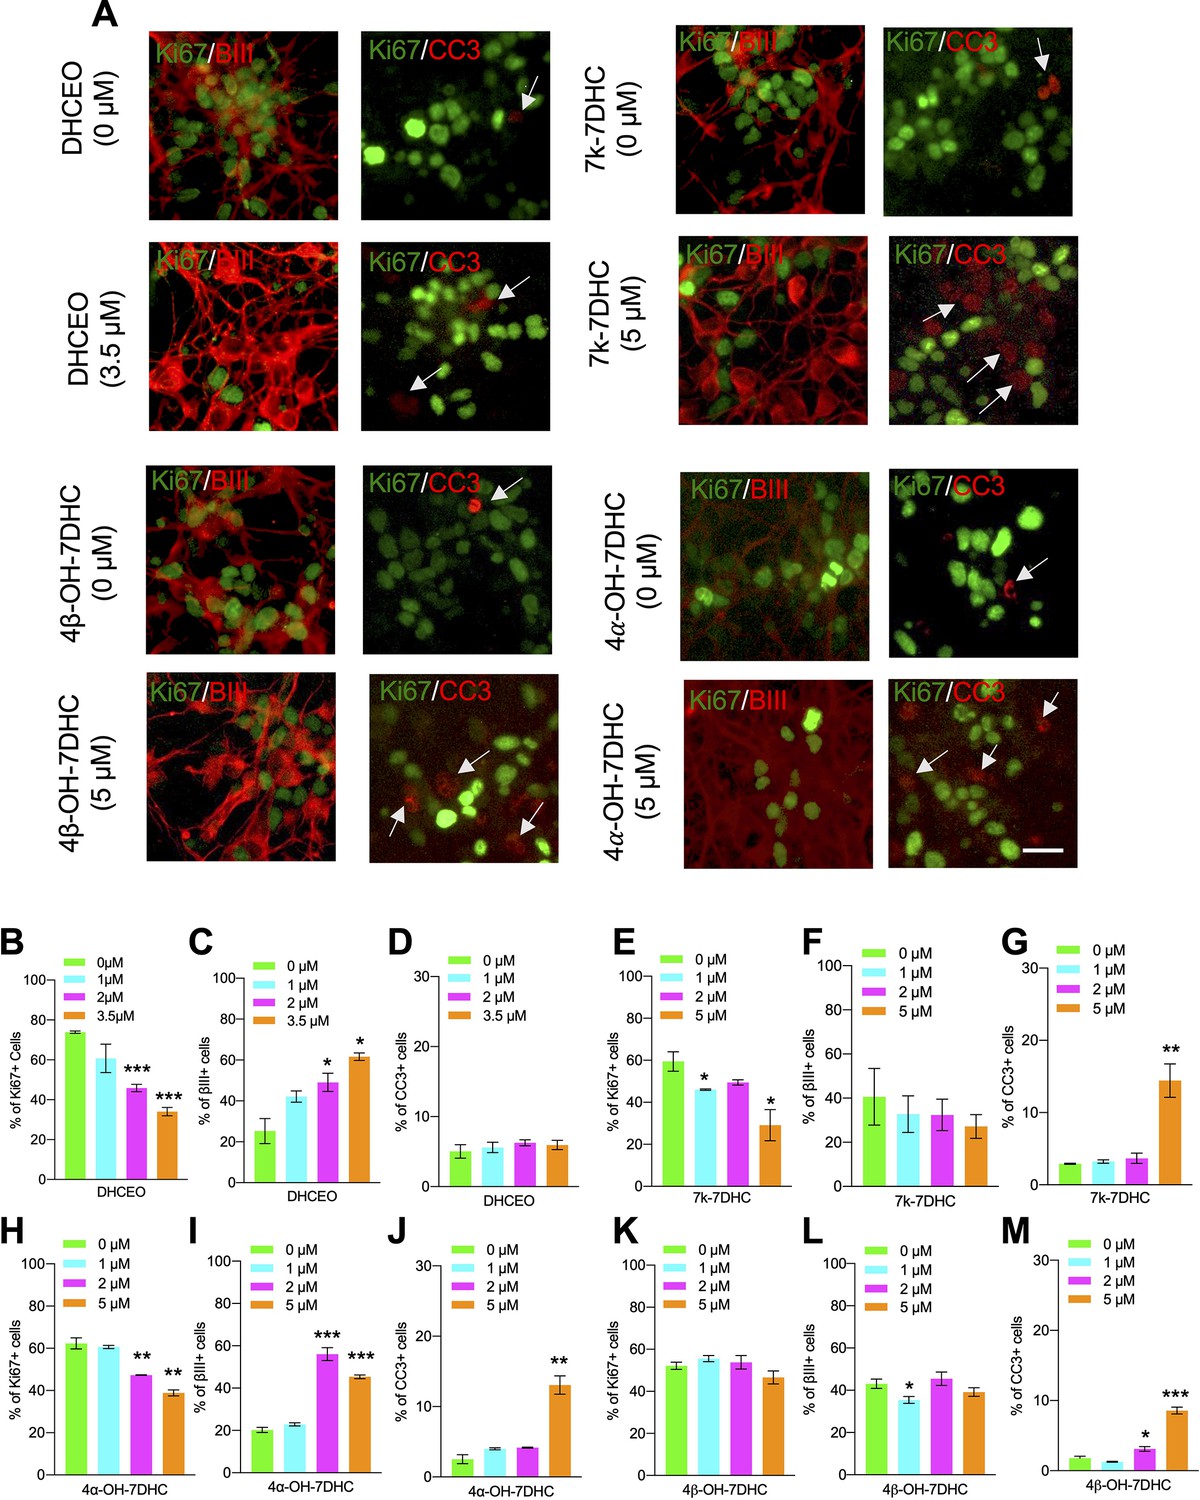
7-DHC derived oxysterols lead to similar neurogenic defects as loss of Dhcr7 in murine cortical precursors in vitro.
(A–M) E12.5 cortical precursors were cultured for 2 days in the presence of different concentrations of 7-DHC-derived oxysterols and quantified. (A) Cell were immunostained for Ki67 (green), βIII-tubulin (red), and CC3 (red, arrow) after 3 days and the proportions of Ki67+ (B,E,H,K), βIII-tubulin+ (C,F,I,L), and CC3+ (D,G,J,M) cells were determined. Error bars indicate SEM. *, p<0.05; **, p<0.005; ***, p<0.001. n=3 per experiment. Scale Bar = 50 μm.
Figure 5
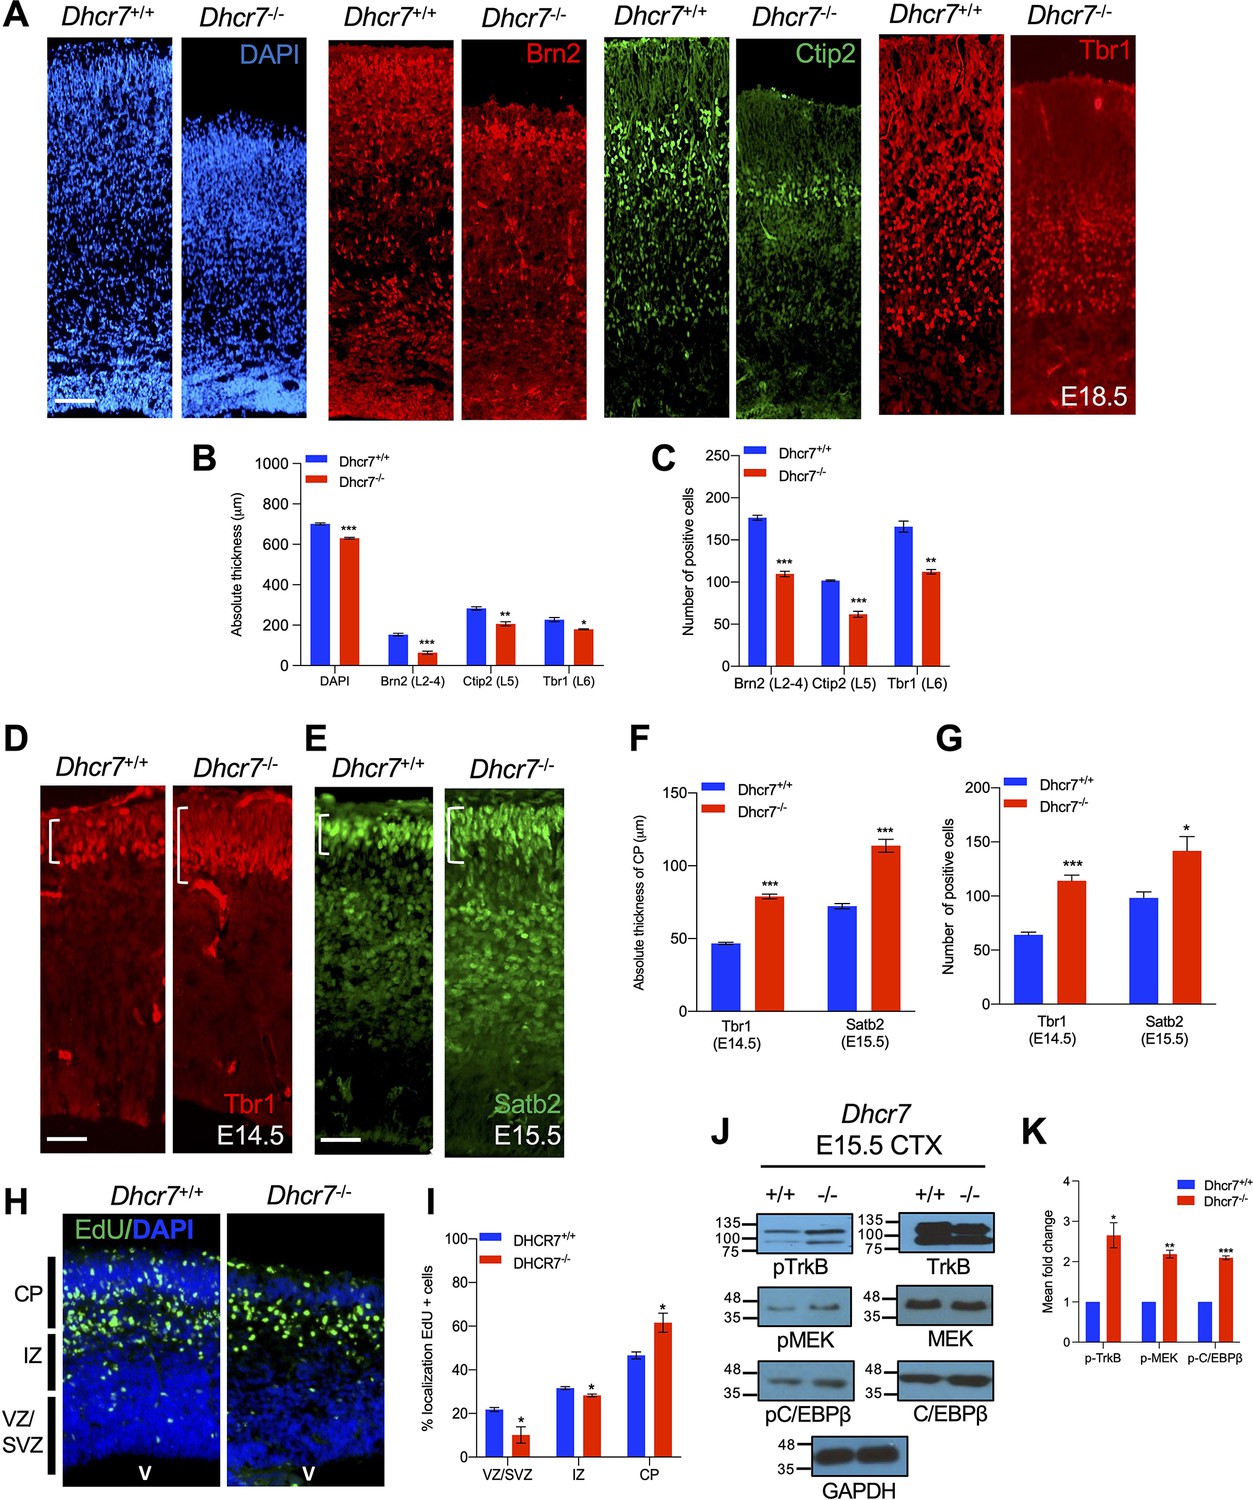
Dhcr7-/- mice display premature neurogenesis and increased activity of the TrkB neurogenic signaling pathway in vivo.
(A) E18.5 cortical sections from Dhcr7+/+ and Dhcr7-/- were immunostained for Tbr1 (red), Ctip2 (green) and counterstained with DAPI (blue). (B and C) Quantifications of the absolute thickness (B) and the number of positive cells (C). (D–G) Cortical sections from E15.5 Dhcr7+/+ and Dhcr7-/- mice were immunostained for Satb2 (D, green) and Tbr1 (E, red). Quantifications of the absolute thickness (F) and the number of positive cells (G) for Satb2 and Tbr1. (H) E15.5 cortical sections from Dhcr7+/+ and Dhcr7-/- embryos EdU-labeled at E12.5 were immunostained for EdU (green) and counterstained with DAPI (blue). (I) Quantification of the relative location of EdU + cells in cortical sections. (J) E15.5 cortices were isolated from Dhcr7+/+ and Dhcr7-/- embryos and analyzed by western blot for phospho-TrkB, phospho-MEK, or phospho-C/EBPβ. Blots were re-probed with antibodies for total GR, TrkB, MEK, C/EBPβ and GAPDH as loading controls. (K) Quantification of phospho-TrkB, phospho-MEK, and phospho-C/EBPβ expression in E15.5 cortices were isolated from Dhcr7+/+ and Dhcr7-/- embryos. The relative levels of the phosphorylated proteins are normalized to GAPDH levels for each independent sample and expressed as fold increase. Error bars indicate SEM. *, p<0.05; **, p<0.005; ***, p<0.001. n=3 per experiment. Scale Bar = 50 μm.
-
Figure 5—source data 1
Related to Figure 5J.
E15.5 cortices were isolated from Dhcr7+/+ and Dhcr7-/- embryos and analyzed by western blot for phospho-TrkB, phospho-MEK, or phospho-C/EBPβ. Blots were re-probed with antibodies for total GR, TrkB, MEK, C/EBPβ, and GAPDH as loading controls.
- https://cdn.elifesciences.org/articles/67141/elife-67141-fig5-data1-v2.pdf
Figure 6
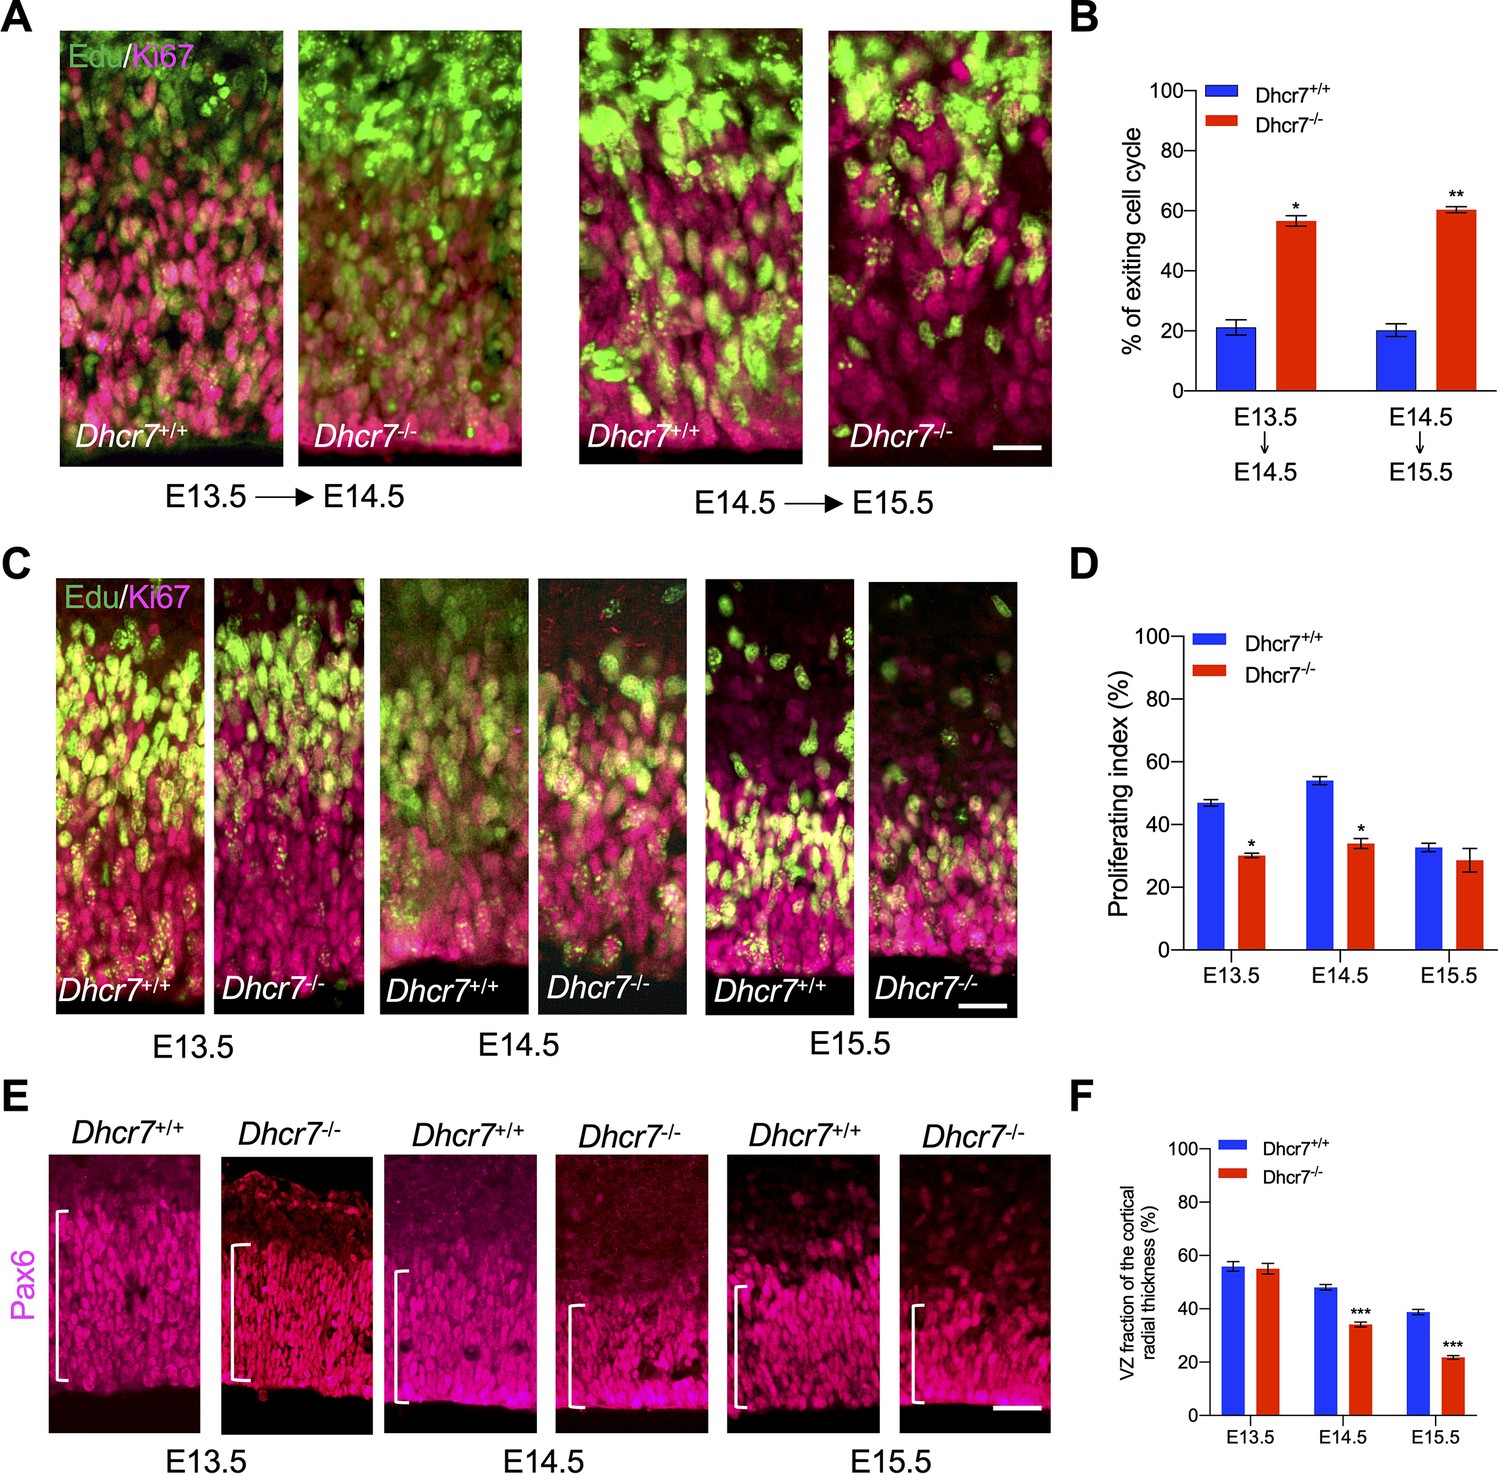
Dhcr7-/- mice show accelerated cell cycle exiting and depletion of cortical precursor cells in vivo.
(A) Cortical sections from Dhcr7-/- and Dhcr7+/+ embryos labeled by Edu at different developmental stages were immunostained 18 hr later for Edu (green) and Ki67 (Magenta). (B) Quantification of cell-cycle exit index of Dhcr7-/- cortices compared with Dhcr7+/+ cortices. (C) Cortical sections from Dhcr7-/- and Dhcr7+/+ embryos labeled by Edu injection at different developmental stages were immunostained 2 hr later for Edu (green) and Ki67 (Magenta). (D) Quantification of proliferation index of Dhcr7-/- cortices compared with Dhcr7+/+ cortices. (E) Coronal cortical sections immunostained for Pax6 cortical precursor marker at different developmental stages. (F) Quantification of the relative size of the Pax6 +region shown as fractions of the whole cortical radial thickness. Error bars indicate SEM. *, p<0.05; **, p<0.005; ***, p<0.001. n=3 per experiment. Scale Bar = 50 μm.
Figure 7
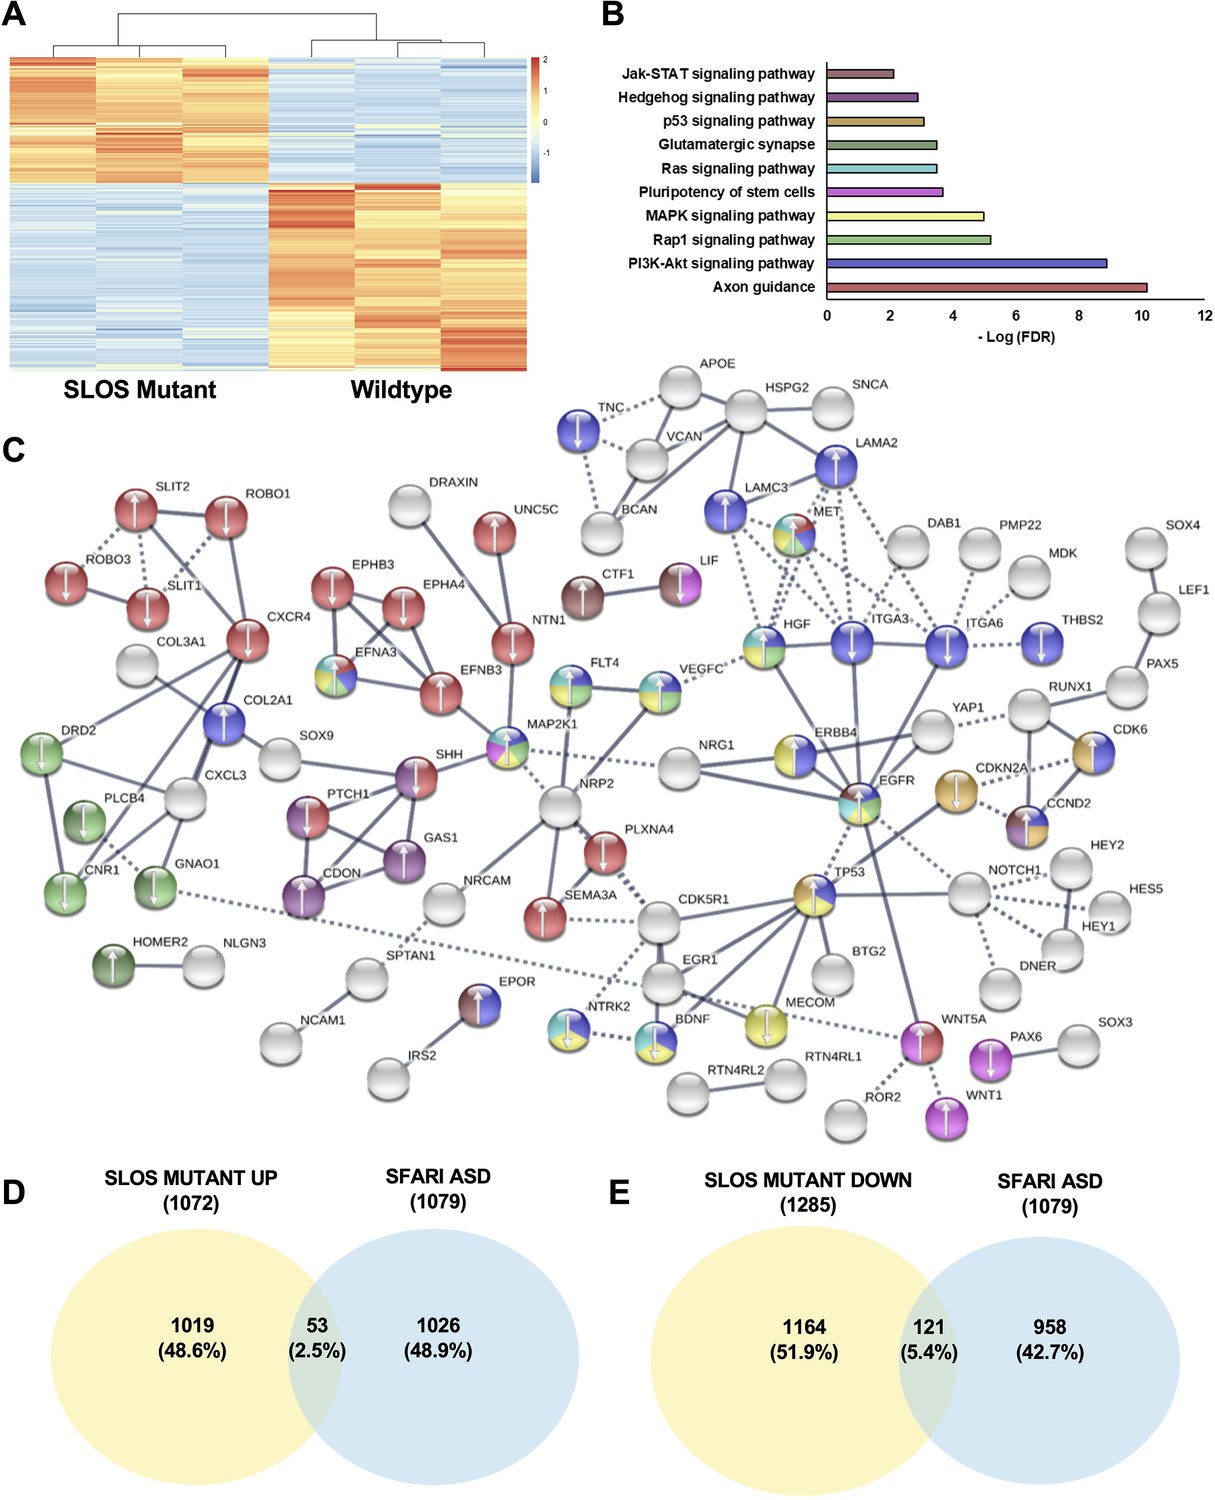
Loss of Dhcr7 alters gene expression in cultured SLOS patient-derived neural progenitors.
(A) Hierarchical clustering heatmap of differentially expressed genes shows distinct expression pattern changes in transcript abundance for SLOS mutant NPCs as compared to Controls. Red color represents an increase in abundance, blue color represents a relative decrease, and white color represents no change. (B) Enriched KEGG pathways identified among DEGs from SLOS mutant NPCs and involved in the Biological Function ‘development of the central nervous system’, identified by Ingenuity Pathway Analysis (see Supplementary file 5). Color of the bar corresponds to DEGs in the STRING network that are in enriched pathways. (C) String analysis of DEGs from SLOS mutant NPCs and involved in the Biological Function ‘Development of the central nervous system’ identified by Ingenuity Pathway Analysis. Parameters of high confidence have been applied and only connected nodes are displayed. Arrows indicate whether the gene was up- or down-regulated. Color of DEG corresponds to enriched KEGG pathway. (D) Venn diagram showing the overlap of autism risk genes in the SFARI database with genes upregulated in SLOS mutant NPCs. (E) Venn diagram showing the overlap of autism risk genes in the SFARI database with genes downregulated in SLOS mutant NPCs. n=3 biological replicates per genotype; DEGs met the criteria of fold-change >1.5 between genotypes and adjusted p-value < 0.05.
Figure 8 with 3 supplements
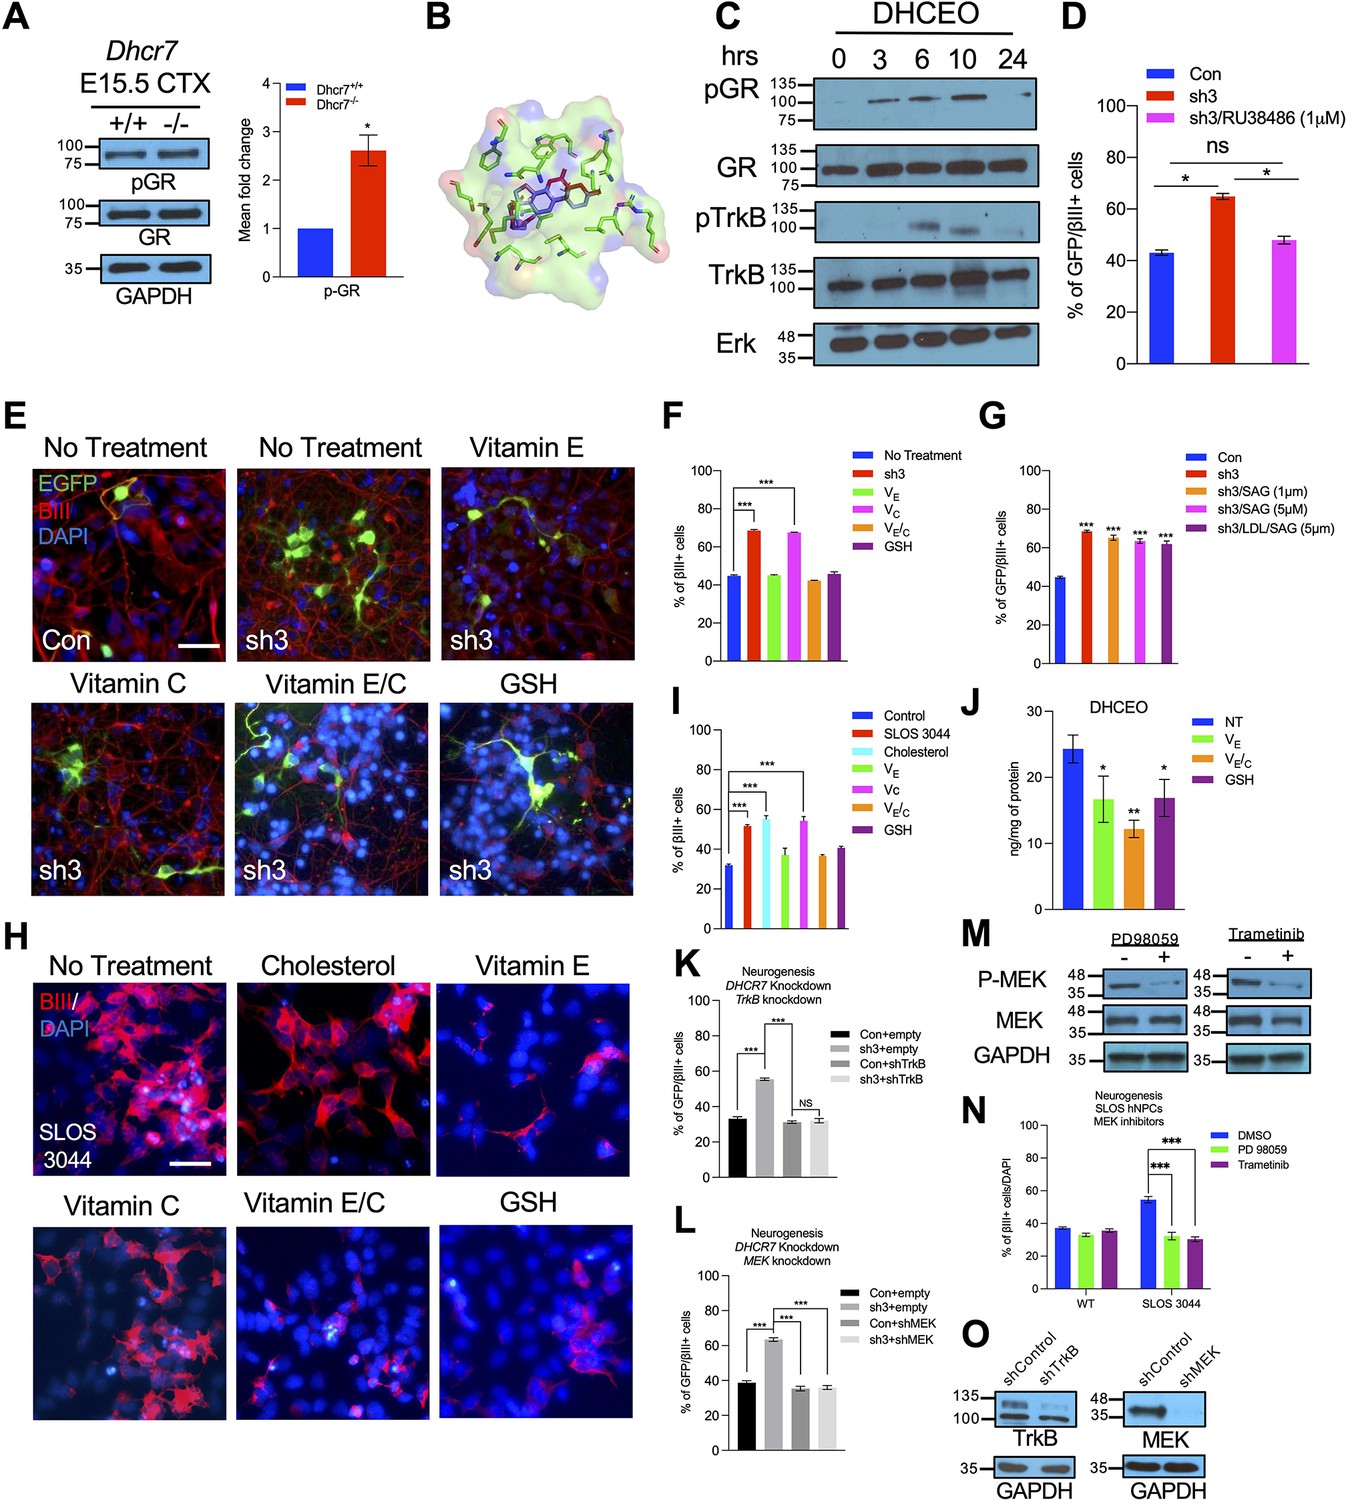
DHCEO activates cortical neurogenesis via activation of glucocorticoid receptor and inhibition of the effect or the formation of DHCEO rescues the neurogenic defects in SLOS NPCs.
(A) Western blot showing increased phospho-GR in E15.5 Dhcr7-/- mouse brain relative to Dhcr7+/+. (B) Image of the docked position of DHCEO (red) and OCDO (blue) in the ligand binding pocket of GR. (C) Human neural progenitors were treated with 3.5 μM DHCEO over the indicated time periods. Lysates were probed with phosphor-GR and phosphor-TrkB and re-probed with antibodies for total GR, total TrkB or total ERK as loading controls. (D) Human NPCs were transfected with EGFP-control (Con) or EGFP-DHCR7 (sh3) shRNA. Cells were treated with 1 μM RU38486, a selective GR antagonist 1 day after transfection. Three days post-transfection, cells were immunostained for EGFP and βIII-tubulin and quantified. (E) Control hNPCs were transfected with EGFP-control (Con) or EGFP-DHCR7 shRNA (sh3), and then treated with vitamin E, vitamin C, vitamin E/C, or glutathione (GSH). Three days post-transfection, cells were immunostained for EGFP and βIII-tubulin. (F,G) Quantification of EGFP and βIII-tubulin + cells in DHCR7-KD Control hNPCs treated with various antioxidants, SAG, or LDL + SAG. (H) SLOS hNPCs were treated with cholesterol or various antioxidants and were immunostained for βIII-tubulin and DAPI. (I) Quantification of the proportion of βIII-tubulin + cells in Control hNPCs, and SLOS hNPCs treated with cholesterol (LDL) or various antioxidants. (J) Quantification of DHCEO by LC-MS/MS in SLOS hiPSCs treated with vitamin E, vitamin E/C, and GSH. (K, L) hNPCs were transfected with EGFP-control (Con) or EGFP-DHCR7 and co-transfected with TrkB shRNA (K) or MEK shRNA (L) vector. Three days later, cultures were immunostained for EGFP and βIII-tubulin and the proportion of transfected newborn neurons was determined. (M) hNPCs were treated or not treated with MEK/ERK inhibitors, trametinib or PD98059. Western blot of phosphor-MEK. The blots were then re-probed with antibodies for total MEK as loading controls. (N) SLOS hNPCs were treated with vehicle control or MEK/ERK inhibitors, trametinib (100 nM; purple column) or PD98059 (50 μM; green column). Three days later, cultures were immunostained for βIII-tubulin, and the proportion of new neurons was determined. (O) Western blots for TrkB or MEK1/2 in the lysate of 293T cells transfected with control or TrkB shRNA or MEK shRNA vector. The blots were re-probed for glyceraldehyde 3-phosphate dehydrogenase (GAPDH). Error bars indicate SEM. *, p<0.05; **, p<0.005; ***, p<0.001. n=3 per experiment. Scale Bar = 50 μm.
-
Figure 8—source data 1
Related to Figure 8A.
Western blot showing increased phospho-GR in E15.5 Dhcr7-/- mouse brain relative to Dhcr7+/+.
- https://cdn.elifesciences.org/articles/67141/elife-67141-fig8-data1-v2.pdf
-
Figure 8—source data 2
Related to Figure 8C.
Human neural progenitors were treated with 3.5 μM DHCEO over the indicated time periods. Lysates were probed with phosphor-GR and phosphor-TrkB and re-probed with antibodies for total GR, total TrkB or total ERK as loading controls.
- https://cdn.elifesciences.org/articles/67141/elife-67141-fig8-data2-v2.pdf
-
Figure 8—source data 3
Related to Figure 8M.
hNPCs were treated or not treated with MEK/ERK inhibitors, trametinib or PD98059. Western blot of phosphor-MEK. The blots were then re-probed with antibodies for total MEK as loading controls.
- https://cdn.elifesciences.org/articles/67141/elife-67141-fig8-data3-v2.pdf
-
Figure 8—source data 4
Related to Figure 8O.
Western blots for TrkB or MEK1/2 in lysate of 293T cells transfected with control or TrkB shRNA or MEK shRNA vector. The blots were re-probed for glyceraldehyde 3-phosphate dehydrogenase (GAPDH).
- https://cdn.elifesciences.org/articles/67141/elife-67141-fig8-data4-v2.pdf
Figure 8—figure supplement 1
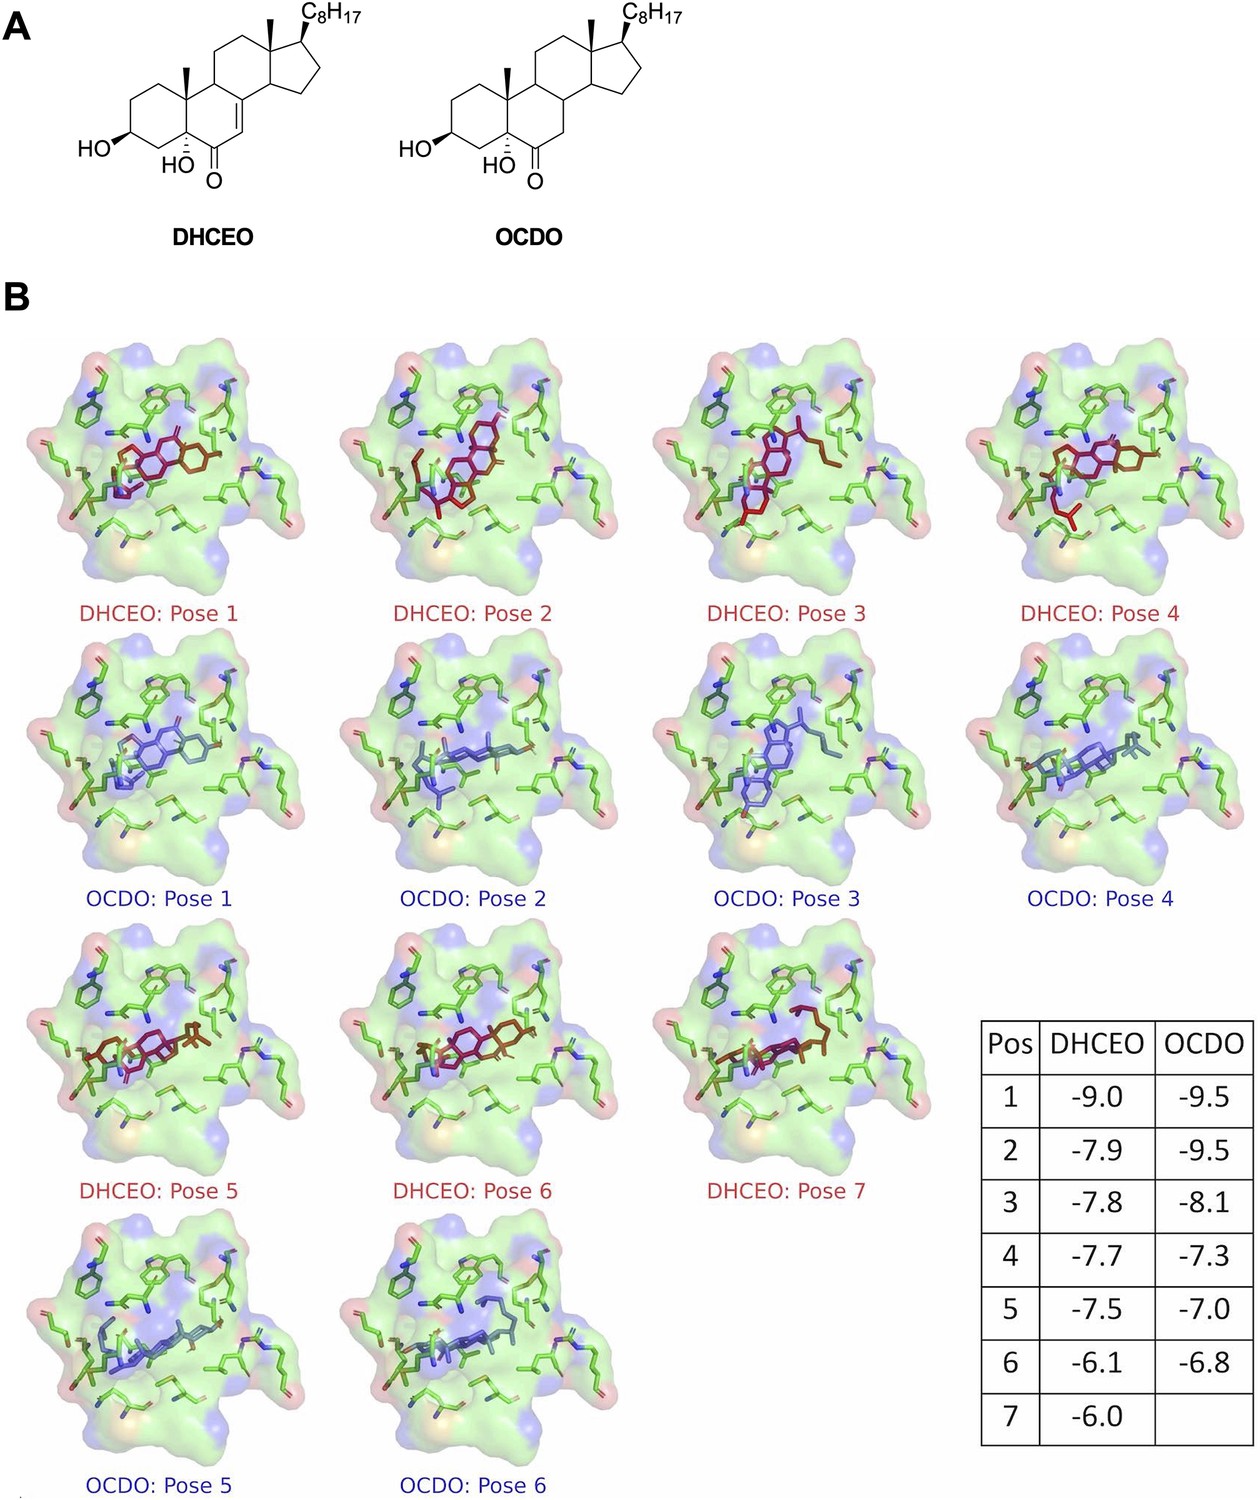
Full docking results of DHCEO and OCDO in the binding pocket of human glucocorticoid receptor.
(A) Structures of DHCEO and OCDO. (B) All generated docking positions of DHCEO (red) and ODCO (blue) along with associated scores.
Figure 8—figure supplement 2

Antioxidant and MEK inhibitors rescued the neurogenic phenotype in human and murine NPCs with Dhcr7 mutations.
Related to Figure 8. (A, D) Another SLOS hNPC line (SLOS 5788) and mNPCs from E12.5 Dhcr7-/- and Dhcr7+/+ embryonic cortices were cultured and treated with cholesterol, vitamin E, vitamin C, vitamin E/C, or glutathione (GSH). The cells were immunostained for βIII-tubulin and DAPI three days after being plated. (B) Quantification of the proportion of βIII-tubulin positive cells in Control hNPCs and SLOS hNPCs treated with cholesterol or antioxidants. (C) Quantification of the proportion of βIII-tubulin positive cells in Control hNPCs and SLOS hNPCs treated with MEK inhibitors (PD 98059 and Trametinib). (E) Quantification of the proportion of βIII-tubulin positive cells in Dhcr7-/- and Dhcr7+/+ NPCs treated with cholesterol or antioxidants. (F) Quantification of the proportion of βIII-tubulin positive cells in mNPCs from E12.5 Dhcr7-/- and Dhcr7+/+ embryonic cortices were cultured and treated with MEK inhibitors (PD 98059 and Trametinib). (G) Proposed mechanisms of actions of vitamin E and GSH during free radical oxidation of 7-DHC. Error bars indicate SEM. *, p<0.001. n=3 per experiment. Scale Bar = 50 μm.
Figure 8—figure supplement 3

Cholesterol depletion did not disrupt the neurogenesis in human and mouse cultured neural precursors.
Related to Figure 8. (A) Cholesterol levels in human neural precursors (hNPC) treated with vehicle control or different concentrations of β-cyclodextrin determined by LC-MS analysis. (B) Human and mouse neural precursors (mNPC) were cultured with β-cyclodextrin (2.5 mM). The cells were immunostained for Ki67 and βIII-tubulin 3 days after plating. (C) Quantification of the proportion of βIII-tubulin-positive cells in hNPCs treated with 2.5 mM β-cyclodextrin. (D) Quantification of the proportion of βIII-tubulin positive cells in mNPCs treated with 2.5 mM β-cyclodextrin. Error bars indicate standard deviation for panel A and SEM for panels C and D. *, p<0.05. n=3 per experiment. Scale Bar = 50 μm.
Additional files
-
Supplementary file 1
Retention times and MS/MS transitions for oxysterol internal standards.
Relate to Figure 2 and Figure 2-Figure Supplement 2.
- https://cdn.elifesciences.org/articles/67141/elife-67141-supp1-v2.docx
-
Supplementary file 2
Retention times and MS/MS transitions for all oxysterol standards.
Relate to Figure 2 and Figure 2—figure supplement 2.
- https://cdn.elifesciences.org/articles/67141/elife-67141-supp2-v2.docx
-
Supplementary file 3
Retention times and MS/MS transitions for sterol internal standards.
Relate to Figure 2 and Figure 2—figure supplement 2.
- https://cdn.elifesciences.org/articles/67141/elife-67141-supp3-v2.docx
-
Supplementary file 4
Retention times and MS/MS transitions for sterol standards.
Relate to Figure 2 and Figure 2—figure supplement 2.
- https://cdn.elifesciences.org/articles/67141/elife-67141-supp4-v2.docx
-
Supplementary file 5
Ingenuity Pathway Analysis (IPA) reveals “development of the central nervous system” as one of the top 10 enriched Diseases and Biological Functions related to the nervous system.
Relate to Figure 7. DEGs were further analyzed with (IPA) to identify the most enriched biological functions related to the nervous system in SLOS mutant NPCs. The table below shows the top ten enriched terms corresponding to Diseases/Bio-functions along with the p-value and overlapping number of genes in the dataset.
- https://cdn.elifesciences.org/articles/67141/elife-67141-supp5-v2.docx
-
Supplementary file 6
Excel file.
List of differentially expressed genes in SLOS hNPCs relative to Control hNPCs. Relate to Figure 7.
- https://cdn.elifesciences.org/articles/67141/elife-67141-supp6-v2.xlsx
-
Transparent reporting form
- https://cdn.elifesciences.org/articles/67141/elife-67141-transrepform1-v2.pdf
Download links
A two-part list of links to download the article, or parts of the article, in various formats.
Downloads (link to download the article as PDF)
Open citations (links to open the citations from this article in various online reference manager services)
Cite this article (links to download the citations from this article in formats compatible with various reference manager tools)
7-Dehydrocholesterol-derived oxysterols cause neurogenic defects in Smith-Lemli-Opitz syndrome
eLife 11:e67141.
https://doi.org/10.7554/eLife.67141


