Associations of topic-specific peer review outcomes and institute and center award rates with funding disparities at the National Institutes of Health
- Office of the Director, National Institutes of Health, United States
- Division of Clinical Innovation, National Center for Advancing Translational Sciences, United States
- Office of Extramural Research, National Institutes of Health, United States
Figures
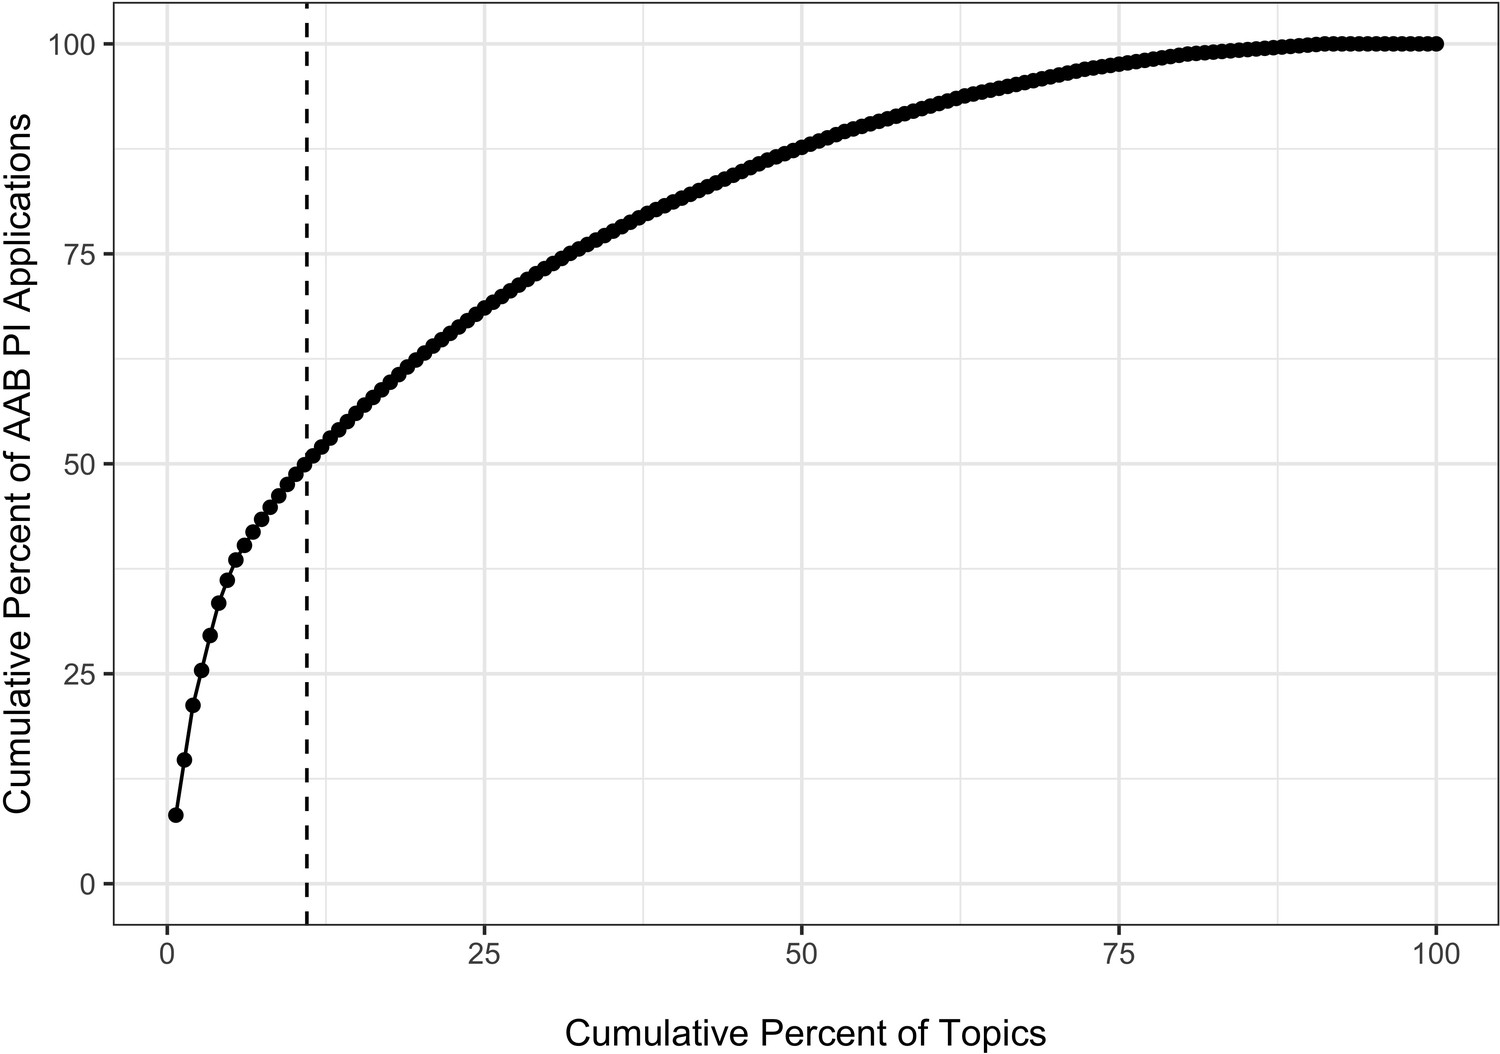
Figure 1
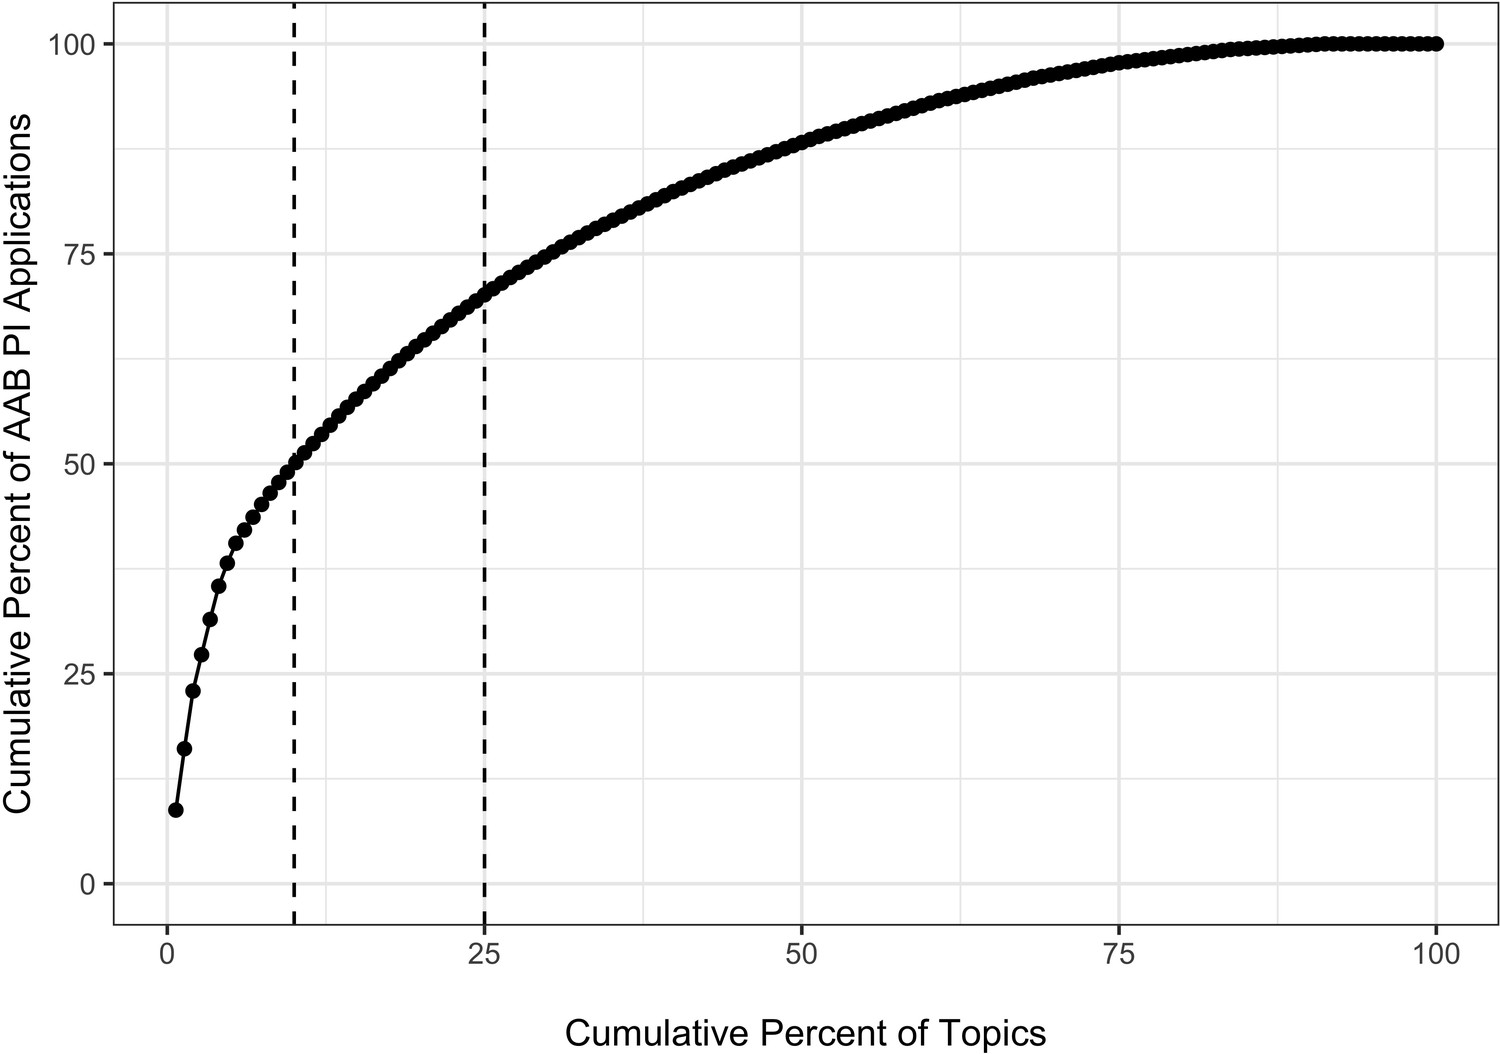
Cumulative percentage plot showing the association of cumulative percentage of applications submitted by AAB Principal Investigators and cumulative percentage of topics.
Each dot represents a topic; the first dot on the lower left corner shows that this one topic accounted for over 8% of all applications submitted by an AAB PI. Dashed vertical lines show that 10% of the topics accounted for 50% of the applications submitted by AAB Principal Investigators and that 25% of the topics accounted for 70% of the applications submitted by AAB Principal Investigators. AAB = African American or Black.
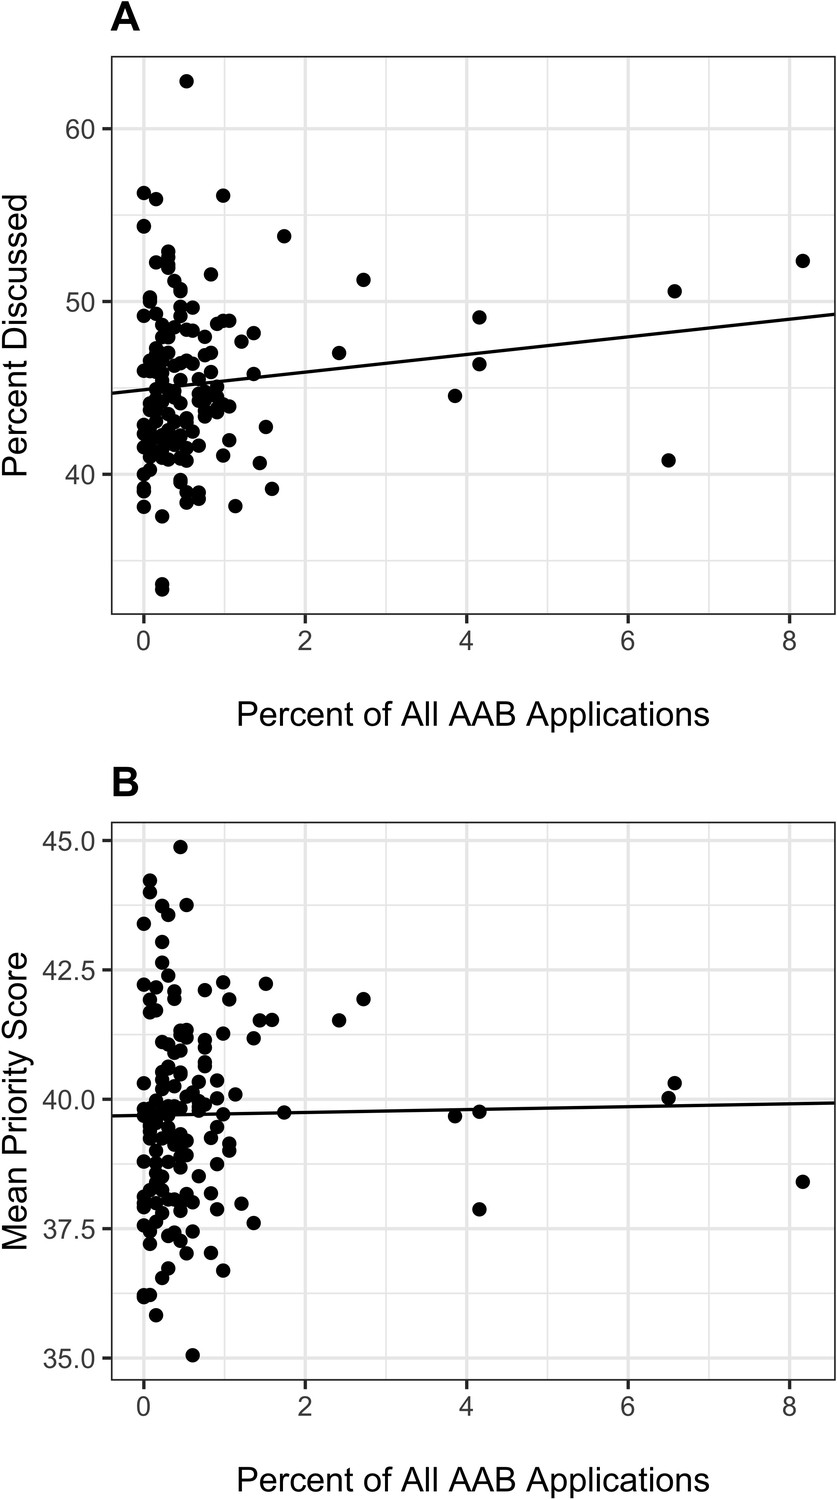
Figure 2

Topic peer review outcomes according to proportion of AAB applications linked to specific topics.
AAB = African American or Black. Panel A: Scatter plot of topic-specific probability of discussion according to proportion of AAB applications. Each dot refers to a topic; the three topics furthest to the right on the X-axis correspond to the three topics at the lower left of Figure 1. The line is based on a linear regression of proportion of topic-specifc applications discussed on proportion of AAB applications. The slope of the line was not significant (p=0.12). Panel B: Scatter plot of topic-specific mean priority score according to proportion of AAB applications. Lower mean priority scores correspond to better, more favorable reviews. Each dot refers to a topic; the three topics furthest to the right on the X-axis correspond to the three topics at the lower left of Figure 1. The line is based on a linear regression of proportion of topic-specific mean priority score on proportion of AAB applications; analyses are based on those applications that were discussed. The slope of the line was not significant (p=0.87).
Figure 3
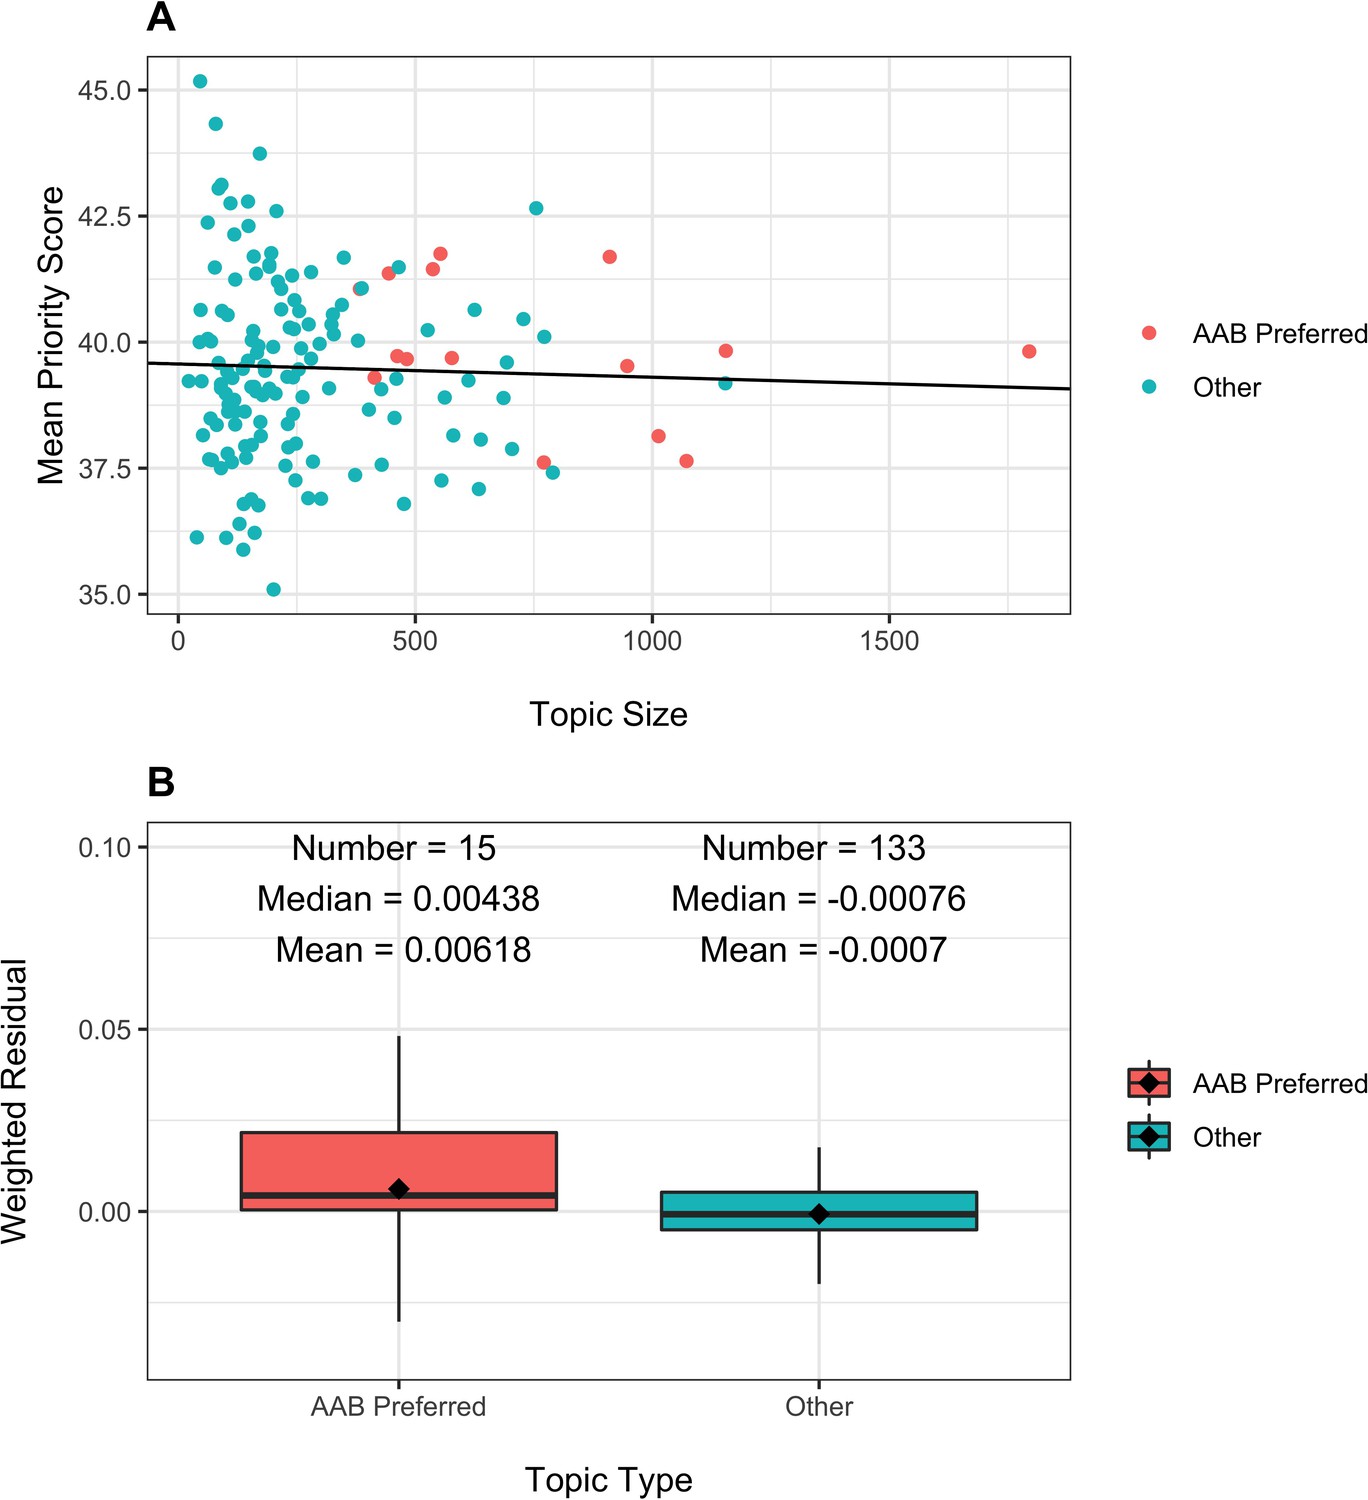
Topic peer review scores according to number of applications received ('Topic Size') and topic type (AAB Preferred or Other).
Panel A: Scatter plot of topic-specific mean peer review scores according to topic size. Each dot refers to a topic, with orange dots AAB preferred topics and green dots all others. The line is based on a linear regression of mean peer review scores on topic size. The slope of the line was not significant (p=0.63). Panel B: Distribution of weighted residuals of topic-specific mean review scores. Residuals are calculated as the distance between the dots in Panel A and the regression line, and are then weighted by topic size.
Figure 4

Scatter plot of IC-specific award rates according to proportion of IC applications that focus on AAB Preferred topics.
In other words, the X-axis value would be 33% if one-third of all IC applications focused on AAB Preferred topics, namely those 15 topics that together accounted for 50% of all applications with AAB PIs. The orange-colored ICs are those in which the proportion of applications from AAB PIs were in the top quartile. AAB = African American or Black; IC = Institute or Center; EY = National Eye Institute; DC = National Institute of Deafness and Communications Disorders; GM = National Institute of General Medical Sciences; DE = National Institute of Dental and Craniofacial Research; MH = National Institute of Mental Health; DA = National Institute on Drug Abuse; NS = National Institute of Neurological Disorders and Stroke; NR = National Institute of Nursing Research; HL = National Heart, Lung, and Blood Institute; AI = National Institute of Allergy and Infectious Diseases; ES = National Institute of Environmental Health Sciences; DK = National Institute of Diabetes and Digestive and Kidney Disease; AA = National Institute on Alcohol Abuse and Alcoholism; AG = National Institute on Aging; EB = National Institute of Biomedical Imaging and Bioengineering; CA = National Cancer Institute; HD = Eunice Kennedy Shriver National Institute of Child Health and Human Development; MD = National Institute on Minority Health and Health Disparities; AR = National Institute of Arthritis and Musculoskeletal and Skin Diseases. ICs that receive relatively more applications on AAB Preferred topics tended to have lower award rates (r = −0.35, p=0.08). Data for ICs with cell sizes not exceeding 11 are not shown due to privacy concerns.
Figure 5

Descriptive analyses of actual (Equation 3) and predicted (Equation 4) topic-specific award rates.
AAB = African American or Black. Panel A: Association of actual vs predicted award rates. Each dot refers to a topic. The line is based on a linear regression of actual award rate on predicted award rate (r = 0.62, p<0.0001). Panel B: Association of predicted award rate (Equation 4) with proportion of AAB applications (Equation 1). Each dot refers to a topic; the three topics furthest to the right on the X-axis correspond to the 3 topics at the lower left of Figure 1. The line is based on a linear regression of predicted award rate on percent of all AAB applications; the negative slope was borderline signifiant (p=0.06). Panel C: Association of actual award rate (Equation 3) with proportion of AAB applications (Equation 1). Each dot refers to a topic; the three topics furthest to the right on the X-axis correspond to the three topics at the lower left of Figure 1. The line is based on a linear regression of actual award rate on percent of all AAB applications; the slope was non-signficant (p=0.76).
Appendix 1—figure 1
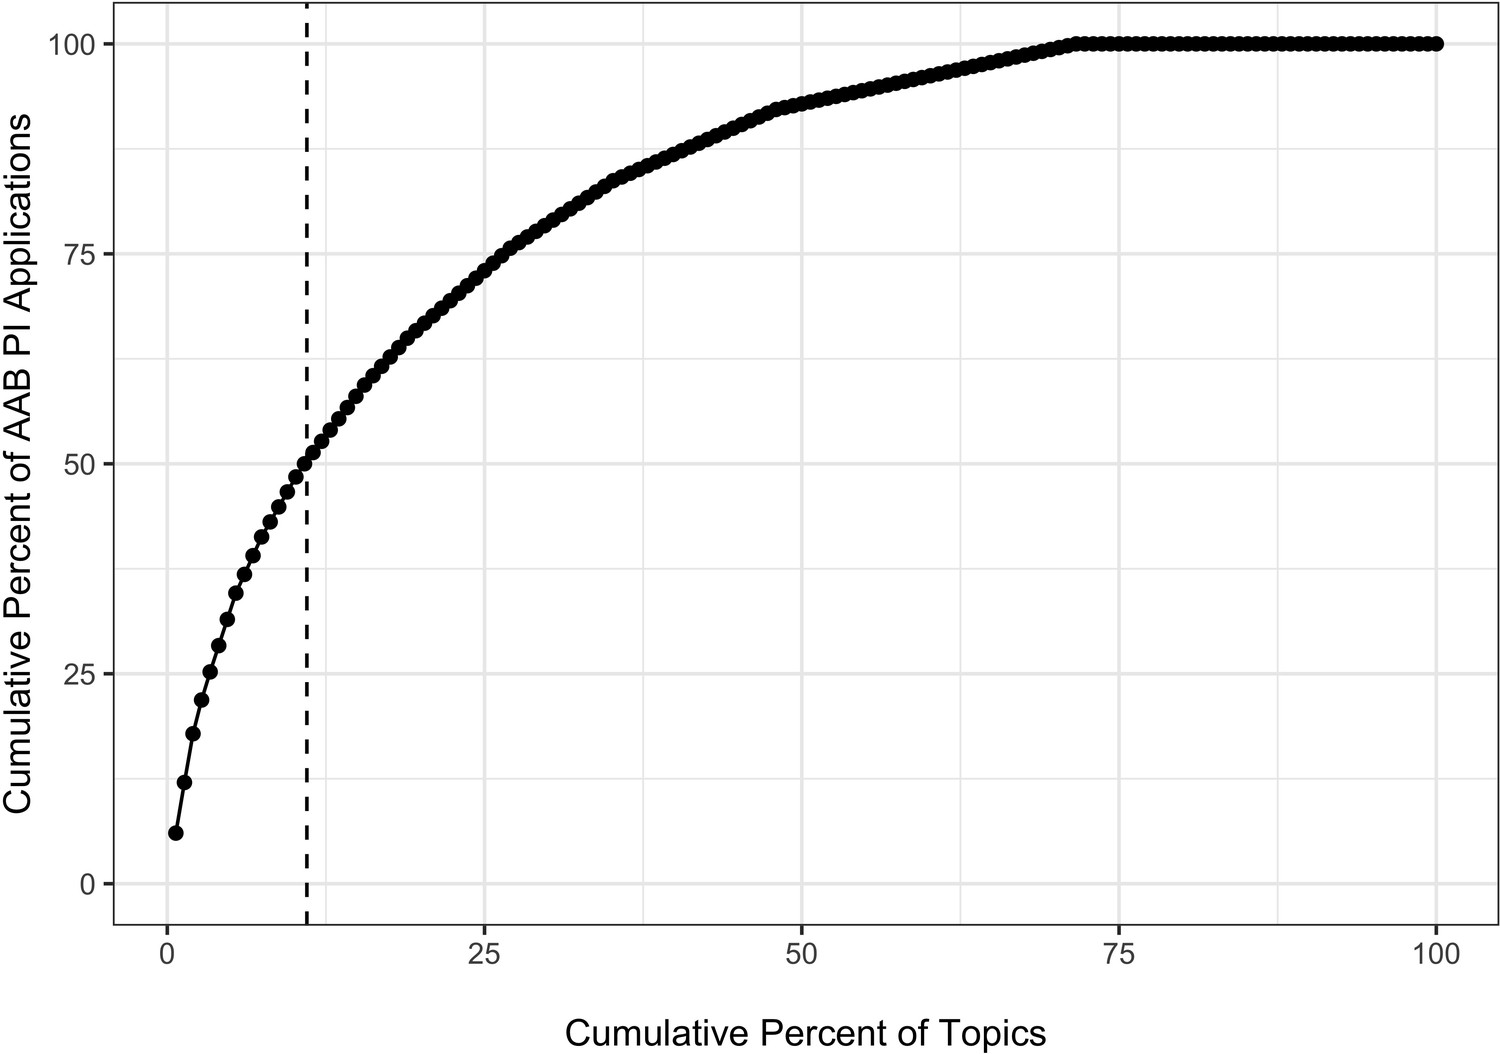
Cumulative percentage plot showing the association of cumulative percentage of applications submitted by AAB Principal Investigators and cumulative percentage of topics.
Each dot represents a topic; the first dot on the lower left corner shows that this one topic accounted for over 6% of all applications submitted by an AAB PI. Dashed vertical lines show that 11% of the topics accounted for 50% of the applications submitted by AAB Principal Investigators. AAB = African American or Black.
Appendix 1—figure 2
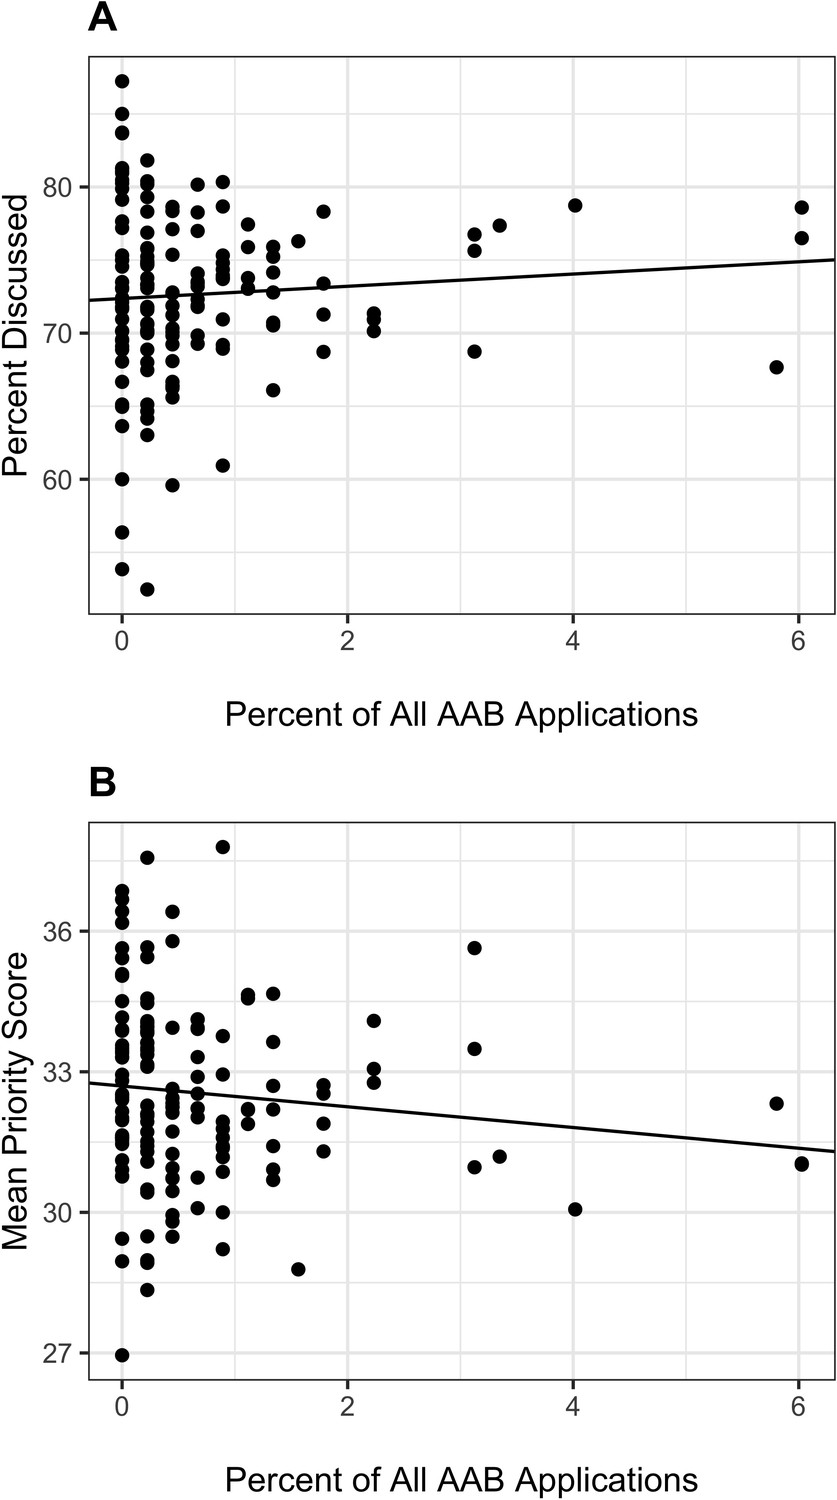
Topic peer review outcomes according to proportion of AAB applications linked to specific topics.
AAB = African American or Black. Panel A: Scatter plot of topic-specific probability of discussion according to proportion of AAB applications. Each dot refers to a topic; the three topics furthest to the right on the X-axis correspond to the three topics at the lower left of Figure 1. The line is based on a linear regression of proportion of topic-specifc applications discussed on proportion of AAB applications. The slope of the line was not significant (p=0.34). Panel B: Scatter plot of topic-specific mean priority score according to proportion of AAB applications. Lower mean priority scores correspond to better, more favorable reviews. Each dot refers to a topic; the three topics furthest to the right on the X-axis correspond to the three topics at the lower left of Figure 1. The line is based on a linear regression of proportion of topic-specific mean priority score on proportion of AAB applications; analyses are based on those applications that were discussed. The slope of the line was not significant (p=0.14).
Appendix 2—figure 1
Cumulative percentage plot showing the association of cumulative percentage of applications submitted by AAB Principal Investigators and cumulative percentage of topics.
Each dot represents a topic; the first dot on the lower left corner shows that this one topic accounted for over 8% of all applications submitted by an AAB PI. Dashed vertical lines show that 11% of the topics accounted for 50% of the applications submitted by AAB Principal Investigators. AAB = African American or Black.
Appendix 2—figure 2
Topic peer review outcomes according to proportion of AAB applications linked to specific topics.
AAB = African American or Black. Panel A: Scatter plot of topic-specific probability of discussion according to proportion of AAB applications. Each dot refers to a topic; the three topics furthest to the right on the X-axis correspond to the three topics at the lower left of Figure 1. The line is based on a linear regression of proportion of topic-specifc applications discussed on proportion of AAB applications. The slope of the line was not significant (p=0.12). Panel B: Scatter plot of topic-specific mean priority score according to proportion of AAB applications. Lower mean priority scores correspond to better, more favorable reviews. Each dot refers to a topic; the three topics furthest to the right on the X-axis correspond to the three topics at the lower left of Figure 1. The line is based on a linear regression of proportion of topic-specific mean priority score on proportion of AAB applications; analyses are based on those applications that were discussed. The slope of the line was not significant (p=0.84).
Tables
Table 1
Application characteristics according to Institute or Center (IC), as ranked by award rate (Equation 2, highest to lowest).
AAB = African American or Black; PI = Principal Investigator; EY = National Eye Institute; DC = National Institute of Deafness and Communications Disorders; GM = National Institute of General Medical Sciences; DE = National Institute of Dental and Craniofacial Research; MH = National Institute of Mental Health; DA = National Institute on Drug Abuse; NS = National Institute of Neurological Disorders and Stroke; NR = National Institute of Nursing Research; HL = National Heart, Lung, and Blood Institute; AI = National Institute of Allergy and Infectious Diseases; ES = National Institute of Environmental Health Sciences; DK = National Institute of Diabetes and Digestive and Kidney Disease; AA = National Institute on Alcohol Abuse and Alcoholism; AG = National Institute on Aging; EB = National Institute of Biomedical Imaging and Bioengineering; CA = National Cancer Institute; HD = Eunice Kennedy Shriver National Institute of Child Health and Human Development; MD = National Institute on Minority Health and Health Disparities; AR = National Institute of Arthritis and Musculoskeletal and Skin Diseases. Data for ICs with cell sizes not exceeding 11 are not shown due to privacy concerns. Final columns shows 2015 appropriations in billions of dollars.
| IC | Applications(N) | Awards(N) | Award rate(%) | AAB PI | AAB(%) | Appropriations($B) |
|---|---|---|---|---|---|---|
| EY | 2026 | 315 | 15.5 | 14 | 0.69 | 0.684 |
| GM | 9781 | 1266 | 12.9 | 113 | 1.16 | 2.371 |
| DC | 1145 | 141 | 12.3 | 13 | 1.14 | 0.405 |
| DE | 1282 | 140 | 10.9 | 26 | 2.03 | 0.400 |
| MH | 5067 | 536 | 10.6 | 87 | 1.72 | 1.463 |
| DA | 3606 | 359 | 10.0 | 66 | 1.83 | 1.029 |
| NS | 6786 | 668 | 9.8 | 77 | 1.13 | 1.605 |
| NR | 1180 | 107 | 9.1 | 55 | 4.66 | 0.141 |
| HL | 11,325 | 995 | 8.8 | 171 | 1.51 | 2.998 |
| ES | 2193 | 188 | 8.6 | 44 | 2.01 | 0.745 |
| AI | 9421 | 791 | 8.4 | 196 | 2.08 | 4.359 |
| DK | 6986 | 538 | 7.7 | 110 | 1.57 | 1.900 |
| AA | 1423 | 105 | 7.4 | 16 | 1.12 | 0.447 |
| EB | 1777 | 131 | 7.4 | 15 | 0.84 | 0.330 |
| AG | 4211 | 302 | 7.2 | 52 | 1.23 | 1.199 |
| CA | 15,906 | 1045 | 6.6 | 206 | 1.30 | 4.950 |
| HD | 5454 | 340 | 6.2 | 168 | 3.08 | 1.287 |
| MD | 829 | 51 | 6.2 | 123 | 14.84 | 0.269 |
| AR | 2656 | 161 | 6.1 | 30 | 1.13 | 0.522 |
Table 2
Application review and funding outcomes according to whether Institute or Center received a higher or lower proportion of applications from AAB principal investigators.
AAB = African American or Black; PI = Principal Investigator.
| Characteristic or outcome | Higher AAB | Lower AAB | |
|---|---|---|---|
| Total N (%) | 18262 (18.9) | 78435 (81.1) | |
| PI AAB | Yes | 579 (3.2) | 1064 (1.4) |
| Discussed | Yes | 8809 (48.2) | 35845 (45.7) |
| Priority Score | Median (IQR) | 39.0 (30.0 to 48.0) | 40.0 (30.0 to 48.0) |
| Percentile Ranking | Median (IQR) | 34.0 (21.0 to 45.0) | 33.0 (21.0 to 44.0) |
| Awarded | Yes | 1440 (7.9) | 6941 (8.8) |
Table 3
Application review and funding outcomes according to whether topic was among those that accounted for half of all AAB applications.
Abbreviations as in Table 2.
| Characteristic or outcome | AAB preferred | Other | |
|---|---|---|---|
| Total N (%) | 24416 (25.3) | 72281 (74.7) | |
| PI AAB | Yes | 824 (3.4) | 819 (1.1) |
| Discussed | Yes | 11515 (47.2) | 33139 (45.8) |
| Priority Score | Median (IQR) | 40.0 (31.0 to 48.0) | 39.0 (30.0 to 48.0) |
| Percentile Ranking | Median (IQR) | 34.0 (22.0 to 45.0) | 33.0 (20.0 to 44.0) |
| Assigned IC AAB Proportion | Higher AAB | 5925 (24.3) | 12337 (17.1) |
| Awarded | Yes | 1992 (8.2) | 6389 (8.8) |
Table 4
Application review and funding outcomes according to whether topic was among those that accounted for 70% of all AAB applications.
Abbreviations as in Table 2.
| Characteristic or outcome | AAB preferred | Other | |
|---|---|---|---|
| Total N (%) | 46108 (47.7) | 50589 (52.3) | |
| PI AAB | Yes | 1152 (2.5) | 491 (1.0) |
| Discussed | Yes | 21485 (46.6) | 23169 (45.8) |
| Priority Score | Median (IQR) | 40.0 (31.0 to 48.0) | 39.0 (30.0 to 48.0) |
| Percentile Ranking | Median (IQR) | 34.0 (21.0 to 45.0) | 33.0 (20.0 to 44.0) |
| Assigned IC AAB Proportion | Higher AAB | 11424 (24.8) | 6838 (13.5) |
| Awarded | Yes | 3852 (8.4) | 4529 (9.0) |
Table 5
Probit Regression Models (regression coefficients and standard errors) with focus on the PI.
Model 1 shows the univariable association of funding success according to whether the PI is AAB. The negative non-zero cofficient indicates that applications with AAB PIs are less likely to be funded; the p-value refers to the likelihood that the difference from zero would be due to chance were the null hypothesis of no association to be true. Model 2 adjusts for topic, Model 3 adjusts for IC assignment, and Model 4 adjusts for IC award rate. Note that the absolute value for the regression coefficient linking AAB PI to funding outcome decreases with each of these adjustments, with the greatest reduction after adjusting for IC award rate. AIC = Akaike Information Criterion; BIC = Bayesian Information Criterion; Num. obs. = Number of Observations. Other abbreviations same as in Tables 1 and 2.
| Model 1 | Model 2 | Model 3 | Model 4 | |
|---|---|---|---|---|
| Intercept | −1.359*** | −1.349*** | −1.348*** | −1.903*** |
| (0.006) | (0.007) | (0.006) | (0.020) | |
| AAB Principal Investigator | −0.184*** | −0.174*** | −0.174*** | −0.158** |
| (0.049) | (0.049) | (0.049) | (0.050) | |
| AAB Preferred Topic | −0.040** | |||
| (0.013) | ||||
| IC Higher AAB Applications | −0.060*** | |||
| (0.015) | ||||
| IC Award Rate | 0.061*** | |||
| (0.002) | ||||
| AIC | 56996.279 | 56989.156 | 56982.092 | 56175.409 |
| BIC | 57015.238 | 57017.594 | 57010.530 | 56203.847 |
| Log Likelihood | −28496.140 | −28491.578 | −28488.046 | −28084.705 |
| Deviance | 56992.279 | 56983.156 | 56976.092 | 56169.409 |
| Num. obs. | 96697 | 96697 | 96697 | 96697 |
-
; ; .
Table 6
Probit Regression Models (regression coefficients and standard errors) with focus on topic type.
Model 1 shows the univariable association of funding success according to whether the topic is AAB preferred. Model 2 shows results according to topic choice and IC award rate. Model 3 includes early stage investigator status, whether applications had multiple PIs, and whether the application included research on human subjects and/or animal subjects. AIC = Akaike Information Criterion; BIC = Bayesian Information Criterion; Num. obs. = Number of Observations. Other abbreviations same as in Tables 1 and 2.
| Model 1 | Model 2 | Model 3 | |
|---|---|---|---|
| Intercept | −1.351*** | −1.904*** | −1.869*** |
| (0.007) | (0.021) | (0.027) | |
| AAB Preferred Topic | −0.044** | −0.005 | −0.013 |
| (0.013) | (0.014) | (0.015) | |
| IC Award Rate | 0.061*** | 0.057*** | |
| (0.002) | (0.002) | ||
| AAB Principal Investigator | −0.170*** | ||
| (0.050) | |||
| Early Stage Investigator | 0.149*** | ||
| (0.015) | |||
| Multi-PI Application | 0.099*** | ||
| (0.015) | |||
| Human Subjects | −0.056 | ||
| (0.014) | |||
| Animal Subjects | −0.052*** | ||
| (0.014) | |||
| AIC | 57000.243 | 56185.926 | 56047.521 |
| BIC | 57019.201 | 56214.364 | 56123.355 |
| Log Likelihood | −28498.121 | −28089.963 | −28015.760 |
| Deviance | 56996.243 | 56179.926 | 56031.521 |
| Num. obs. | 96697 | 96697 | 96697 |
-
; ; .
Appendix 1—table 1
Application review and funding outcomes according to whether topic was among those that accounted for half of all AAB applications.
Abbreviations as in Table 2.
| Characteristic or outcome | AAB preferred | Other | |
|---|---|---|---|
| Total N (%) | 8193 (25.7) | 23707 (74.3) | |
| PI AAB | Yes | 224 (2.7) | 224 (0.9) |
| Discussed | Yes | 6107 (74.5) | 17300 (73.0) |
| Priority Score | Median (IQR) | 31.0 (22.0 to 40.0) | 31.0 (22.0 to 40.0) |
| Percentile Ranking | Median (IQR) | 21.0 (9.8 to 36.0) | 21.0 (10.0 to 35.0) |
| Awarded | Yes | 2419 (29.5) | 7186 (30.3) |
Appendix 1—table 2
Probit Regression Models (regression coefficients and standard errors) with focus on topic type.
Model 1 shows the univariable association of funding success according to whether the topic is AAB preferred. Model 2 shows results according to topic choice and IC award rate. Model 3 includes early stage investigator status, whether applications had multiple PIs, and whether the application included research on human subjects and/or animal subjects. AIC = Akaike Information Criterion; BIC = Bayesian Information Criterion; Num. obs. = Number of Observations. Other abbreviations same as in Tables 1 and 2.
| Model 1 | Model 2 | Model 3 | |
|---|---|---|---|
| Intercept | −0.515*** | −1.397*** | −1.422*** |
| (0.009) | (0.065) | (0.068) | |
| AAB Preferred Topic | −0.023 | −0.001 | −0.004 |
| (0.017) | (0.017) | (0.018) | |
| IC Award Rate | 0.029*** | 0.029*** | |
| (0.002) | (0.002) | ||
| AAB Principal Investigator | −0.171** | ||
| (0.065) | |||
| Early Stage Investigator | 0.221*** | ||
| (0.019) | |||
| Multi-PI Application | 0.035 | ||
| (0.020) | |||
| Human Subjects | −0.020 | ||
| (0.018) | |||
| Animal Subjects | −0.006 | ||
| (0.018) | |||
| AIC | 39034.476 | 38849.763 | 38720.539 |
| BIC | 39051.217 | 38874.874 | 38787.502 |
| Log Likelihood | −19515.238 | −19421.881 | −19352.270 |
| Deviance | 39030.476 | 38843.763 | 38704.539 |
| Num. obs. | 31900 | 31900 | 31900 |
-
; ; .
Appendix 2—table 1
Application review and funding outcomes according to whether topic was among those that accounted for half of all AAB applications.
Abbreviations as in Table 2.
| Characteristic or outcome | AAB preferred | Other | |
|---|---|---|---|
| Total N (%) | 19134 (24.9) | 57842 (75.1) | |
| PI AAB | Yes | 660 (3.4) | 663 (1.1) |
| Discussed | Yes | 8993 (47.0) | 26342 (45.5) |
| Priority Score | Median (IQR) | 40.0 (31.0 to 48.0) | 40.0 (30.0 to 48.0) |
| Percentile Ranking | Median (IQR) | 35.0 (22.0 to 45.0) | 34.0 (21.0 to 44.0) |
| Awarded | Yes | 1541 (8.1) | 5015 (8.7) |
Appendix 2—table 2
Probit Regression Models (regression coefficients and standard errors) with focus on topic type.
Model 1 shows the univariable association of funding success according to whether the topic is AAB preferred. Model 2 shows results according to topic choice and IC award rate. Model 3 includes early stage investigator status, whether applications had multiple PIs, and whether the application included research on human subjects and/or animal subjects. AIC = Akaike Information Criterion; BIC = Bayesian Information Criterion; Num. obs. = Number of Observations. Other abbreviations same as in Tables 1 and 2.
| Model 1 | Model 2 | Model 3 | |
|---|---|---|---|
| Intercept | −1.361*** | −1.903*** | −1.856*** |
| (0.007) | (0.023) | (0.030) | |
| AAB Preferred Topic | −0.040** | 0.002 | 0.008 |
| (0.015) | (0.015) | (0.017) | |
| IC Award Rate | 0.060*** | 0.056*** | |
| (0.002) | (0.002) | ||
| AAB Principal Investigator | −0.206*** | ||
| (0.057) | |||
| Early Stage Investigator | 0.160*** | ||
| (0.016) | |||
| Human Subjects | −0.070*** | ||
| (0.016) | |||
| Animal Subjects | −0.038* | ||
| (0.016) | |||
| AIC | 44830.312 | 44152.773 | 44026.919 |
| BIC | 44848.814 | 44180.526 | 44091.678 |
| Log Likelihood | −22413.156 | −22073.386 | −22006.460 |
| Deviance | 44826.312 | 44146.773 | 44012.919 |
| Num. obs. | 76976 | 76976 | 76976 |
| ; ; | |||
Additional files
-
Source data 1
csr_anon_id.RData.
- https://cdn.elifesciences.org/articles/67173/elife-67173-data1-v2.zip
-
Source code 1
Main Manuscript.Rmd.
- https://cdn.elifesciences.org/articles/67173/elife-67173-code1-v2.zip
-
Source code 2
Appendix 1.Rmd.
- https://cdn.elifesciences.org/articles/67173/elife-67173-code2-v2.zip
-
Source code 3
Appendix 2.Rmd.
- https://cdn.elifesciences.org/articles/67173/elife-67173-code3-v2.zip
-
Transparent reporting form
- https://cdn.elifesciences.org/articles/67173/elife-67173-transrepform-v2.docx
Download links
A two-part list of links to download the article, or parts of the article, in various formats.
Downloads (link to download the article as PDF)
Open citations (links to open the citations from this article in various online reference manager services)
Cite this article (links to download the citations from this article in formats compatible with various reference manager tools)
Associations of topic-specific peer review outcomes and institute and center award rates with funding disparities at the National Institutes of Health
eLife 10:e67173.
https://doi.org/10.7554/eLife.67173


