The out-of-field dose in radiation therapy induces delayed tumorigenesis by senescence evasion
- Univ. Lille, CNRS, Inserm, CHU Lille, Institut Pasteur de Lille, UMR9020-U1277 - CANTHER - Cancer Heterogeneity, Plasticity and Resistance to Therapies, France
- Univ. Lille, CNRS, UMR8520, Institut d'Electronique, Microélectronique et Nanotechnologie, France
- Oncovet Clinical Research, Plateforme PRECI, France
- Oncovet, Plateforme PRECI, France
- Univ. Lille, CNRS, Inserm, CHU Lille, Institut Pasteur de Lille, U1019 - CIIL - Centre d'Infection et d'Immunité de Lille, France
- Univ. Lille, Inserm, CHU Lille, Institut Pasteur de Lille, U1011 - EGID, France
- Lille University, Medical School and Centre Oscar Lambret, France
Figures
Figure 1 with 4 supplements
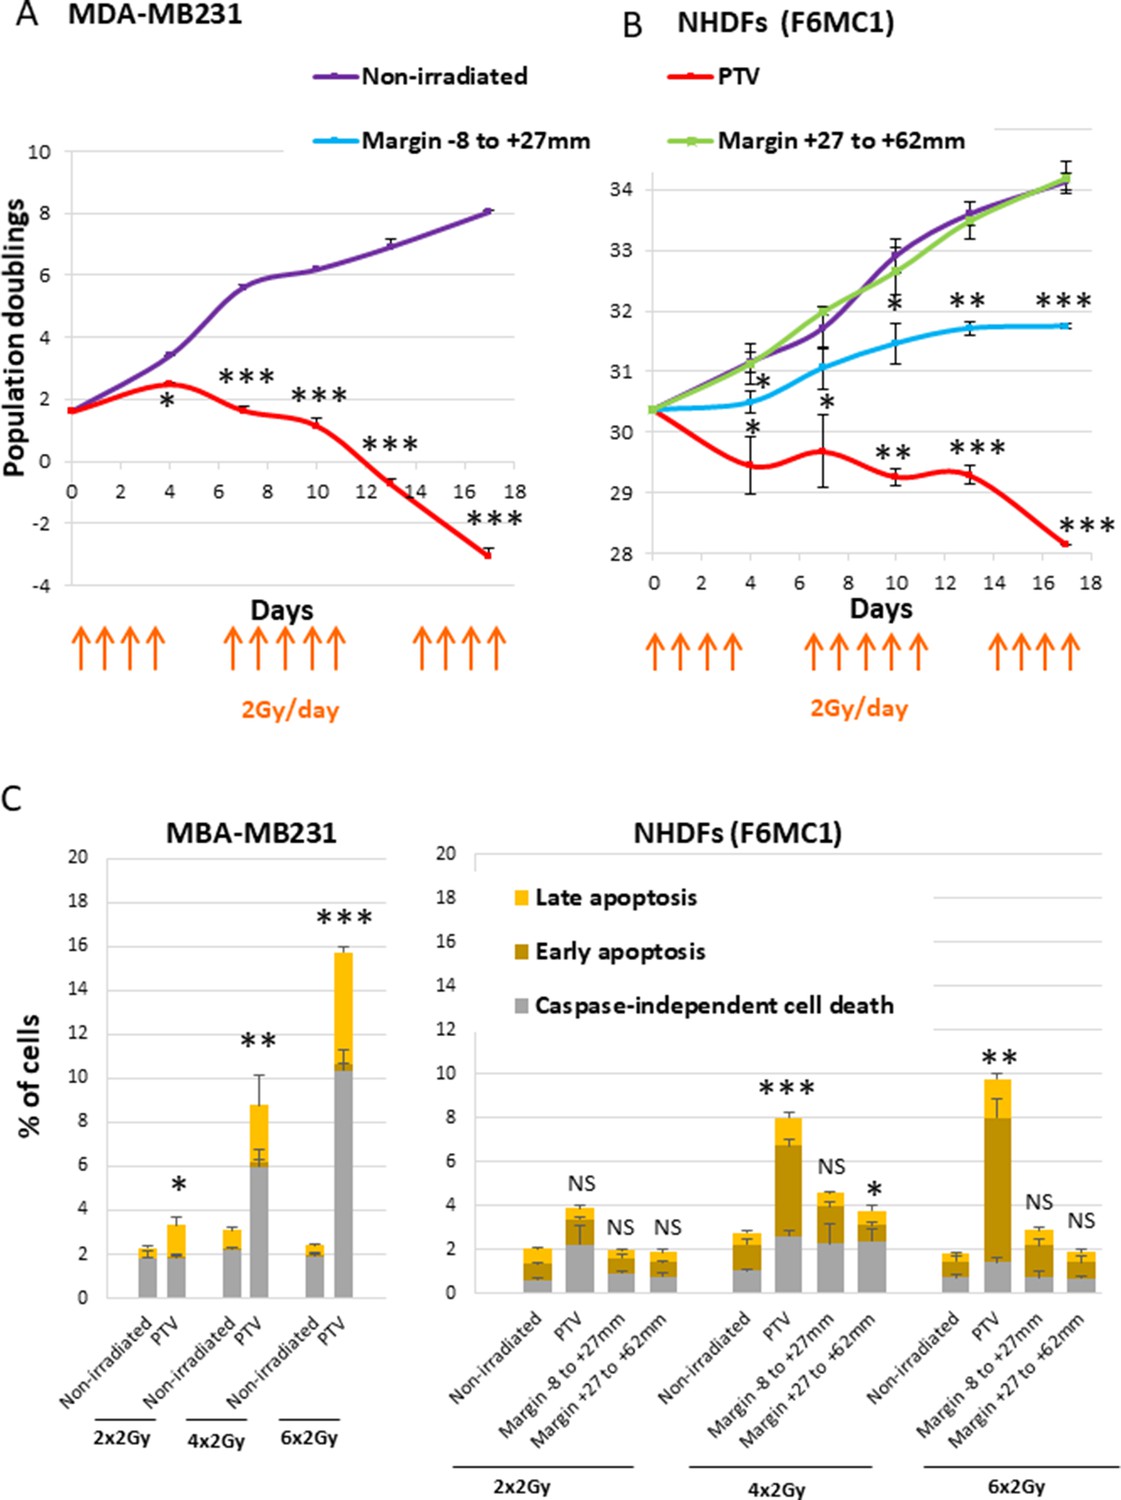
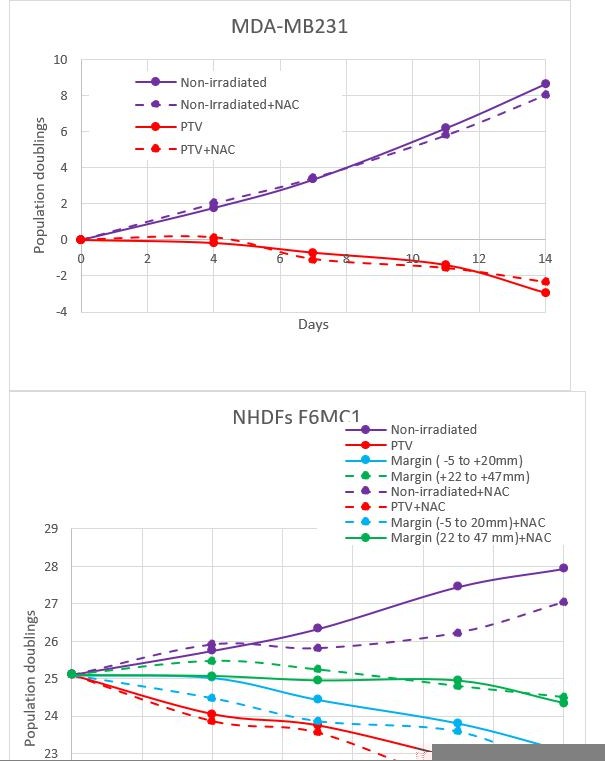
Growth curves and cell death level of MDA-MB231 and normal human dermal fibroblasts (NHDFs) positioned at the margin or inside a planning target volume (PTV) receiving 2 Gy/day.
(A) Growth curves of MDA-MB231 positioned inside the PTV and irradiated or not during 3 weeks. (B) Growth curves of NHDFs (donor F6MC1, population doubling [PD] = 30.36 at the beginning of the experiment) positioned straddling the PTV and the margin irradiated or not during 3 weeks. Cells were counted at each passage using a Malassez chamber. Each point represents the mean ± SD of three counts from three independent culture plates. t-tests were performed for each counting in comparison to nonirradiated cells. (C) MDA-MB231 positioned inside the PTV and NHDFs (donor F6MC1, PD = 33.05 at the beginning of the experiment) positioned straddling the PTV and the margin were irradiated or not up to six times. The level of cell death was measured 8 hr after the last irradiation. Each condition was performed in triplicate. Each bar represents the mean ± SD of the three measures. Caspase-independent cell death refers to cells negative for caspase activity and positive for propidium iodide (PI). Early apoptosis refers to cells positive only for caspase activity. Late apoptosis refers to cells positive for both caspase activity and PI. t-tests were performed between the total percentages of cell death of each condition in comparison to nonirradiated condition.
-
Figure 1—source data 1
Data for growth curves of MDA-MB231.
- https://cdn.elifesciences.org/articles/67190/elife-67190-fig1-data1-v1.xlsx
-
Figure 1—source data 2
Data for growth curves of normal human dermal fibroblasts (NHDFs).
- https://cdn.elifesciences.org/articles/67190/elife-67190-fig1-data2-v1.xlsx
-
Figure 1—source data 3
Data for cell death assays of normal human dermal fibroblasts (NHDFs) and MDA-MB231.
- https://cdn.elifesciences.org/articles/67190/elife-67190-fig1-data3-v1.xlsx
Figure 1—figure supplement 1
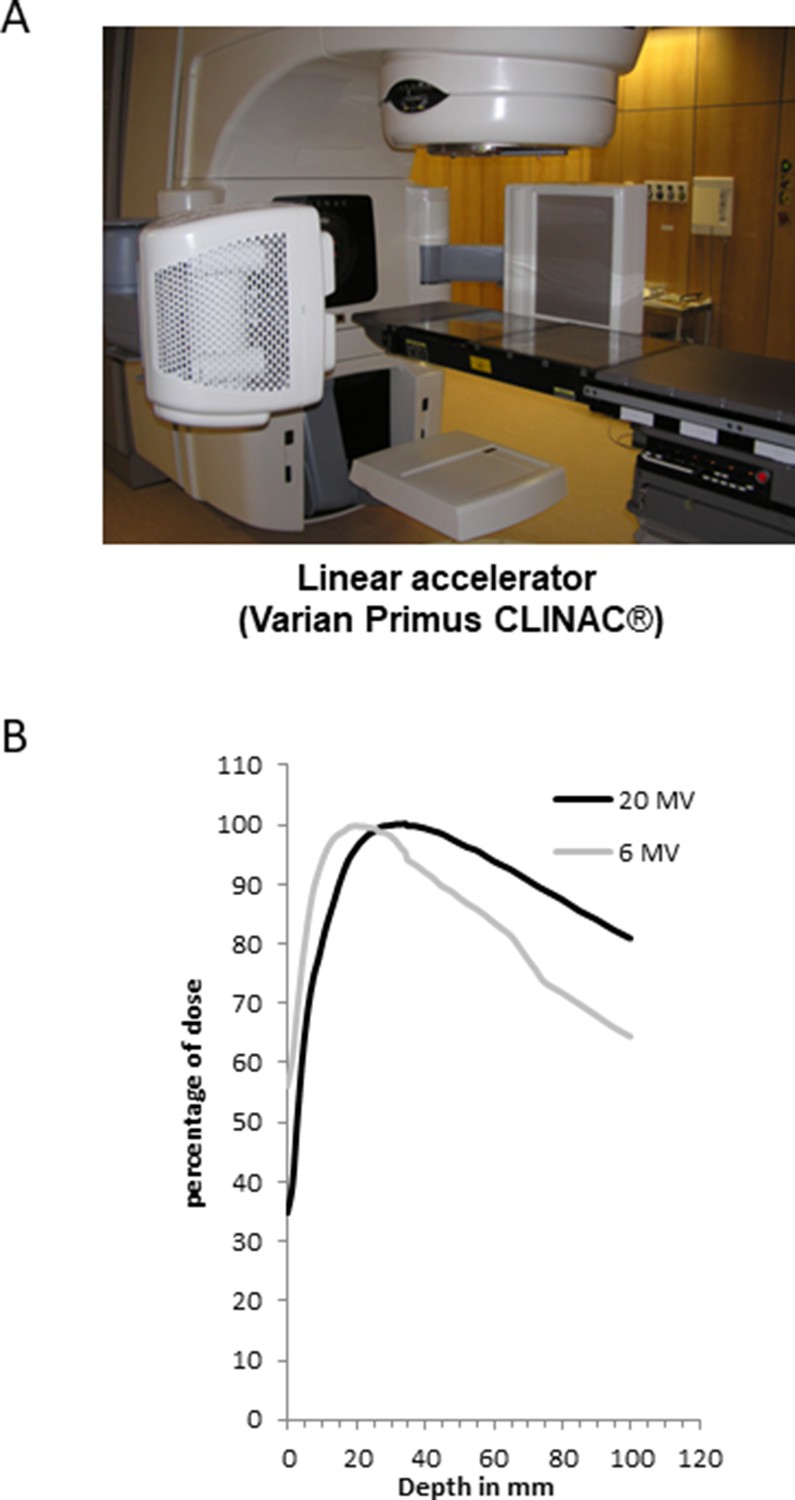
Physical parameters of the linear accelerator (Varian Primus CLINAC).
(A) Image of the Varian Primus CLINAC used in the study (except experiments on mice). (B) Varian Primus CLINAC’s depth profile recorded in photon mode at 6 or 20 MV.
-
Figure 1—figure supplement 1—source data 1
Data for the depth profile.
- https://cdn.elifesciences.org/articles/67190/elife-67190-fig1-figsupp1-data1-v1.xlsx
Figure 1—figure supplement 2
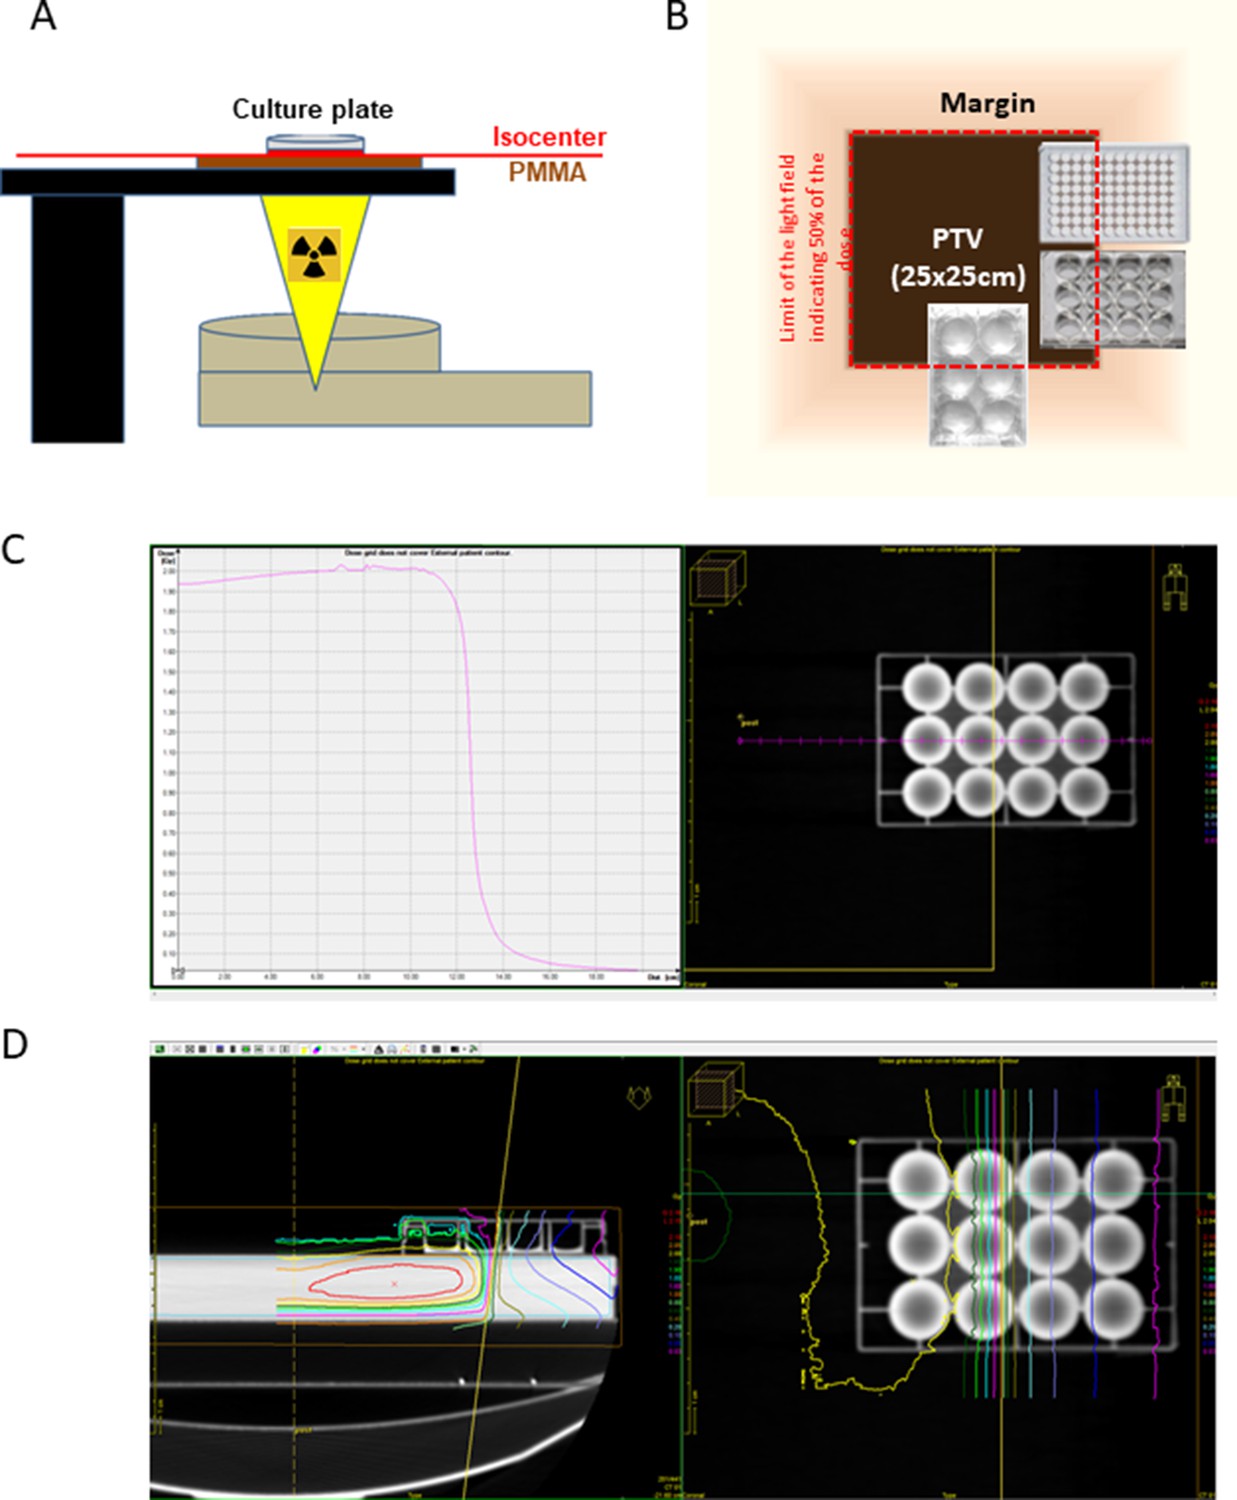
Cell irradiation setup.
(A) Schematic representation of how 96-, 12-, or 6-well plates were irradiated. Plates were put on a 2- or 4-cm-thick poly(methyl methacrylate) (PMMA) plate laid on the carbon fiber table for an irradiation at 6 or 20 MV, respectively, and irradiated from below. (B) Schematic representation of how well plates were positioned in order to have at the same time well columns inside the planning target volume (PTV) and outside, in the margin. The red line represents the limit of the light field at which the deposited dose is 50% of that in the PTV. (C) Scanning of a 12-well plate and calculation of the dose deposited by a 20 MV beam using the treatment planning system of the Centre Oscar Lambret (Lille). The limit of the beam (isodose 50) is indicated by the yellow line. (D) Isodose curves of a 12-well plate. Note that the bottom of the wells inside the PTV did receive 100% of the dose. Similar results were obtained with 96- and 6-well plates.
Figure 1—figure supplement 3
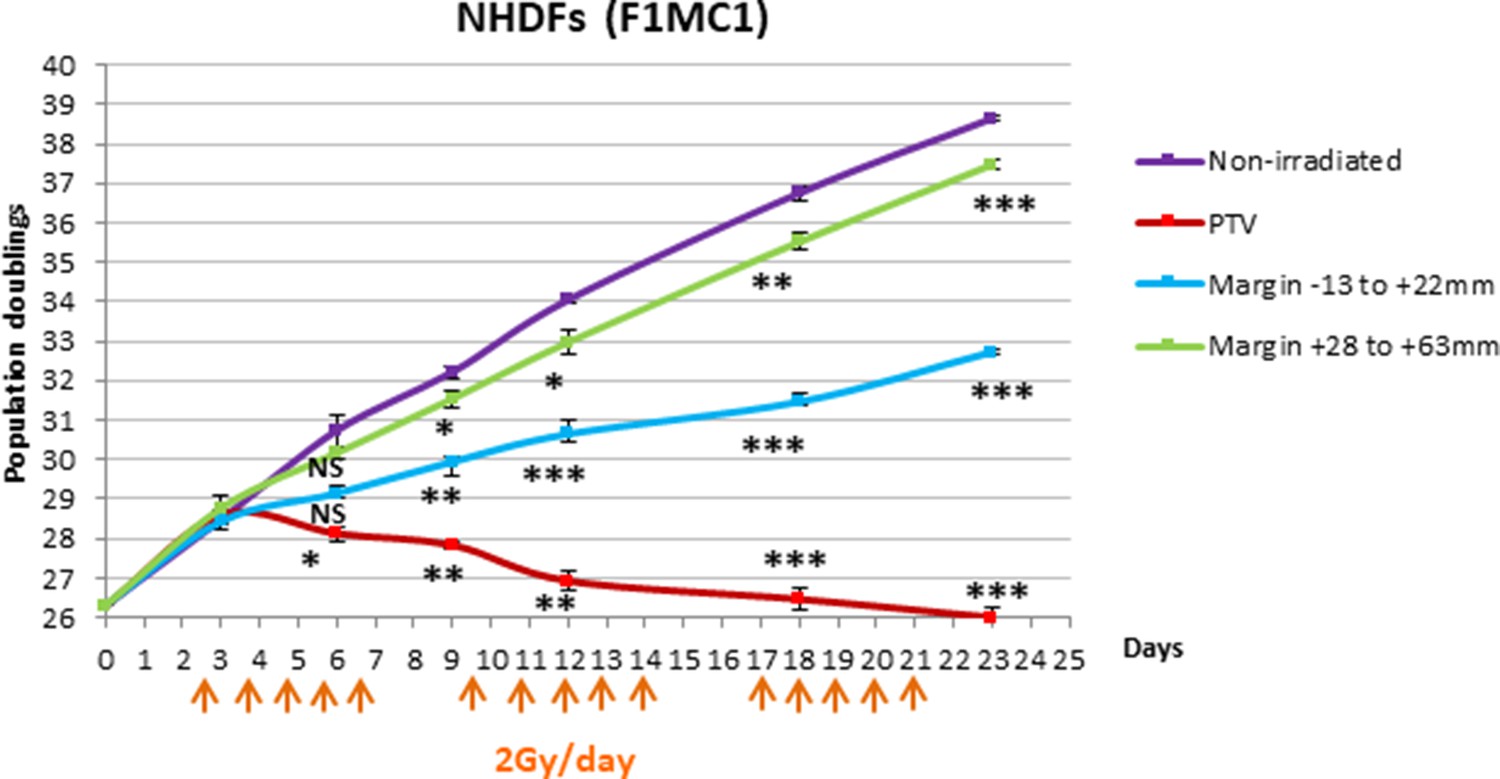
Growth curves of normal human dermal fibroblasts (NHDFs) from another donor positioned at the margin or inside a planning target volume (PTV) receiving 2 Gy/day.
Growth curves of NHDFs (donor F1MC1, population doubling [PD] = 26.3 at the beginning of the experiment) cultured in 6-well plates irradiated at 2 Gy/day except weekends during 3 weeks. The days of irradiation are indicated with an arrow. Cells were counted at each passage using a Malassez cell counting chamber. Each point represents the mean ± SD of three measures from three independent culture plates. t-tests were performed for each counting in comparison to nonirradiated cells.
-
Figure 1—figure supplement 3—source data 1
Data for growth curves.
- https://cdn.elifesciences.org/articles/67190/elife-67190-fig1-figsupp3-data1-v1.xlsx
Figure 1—figure supplement 4
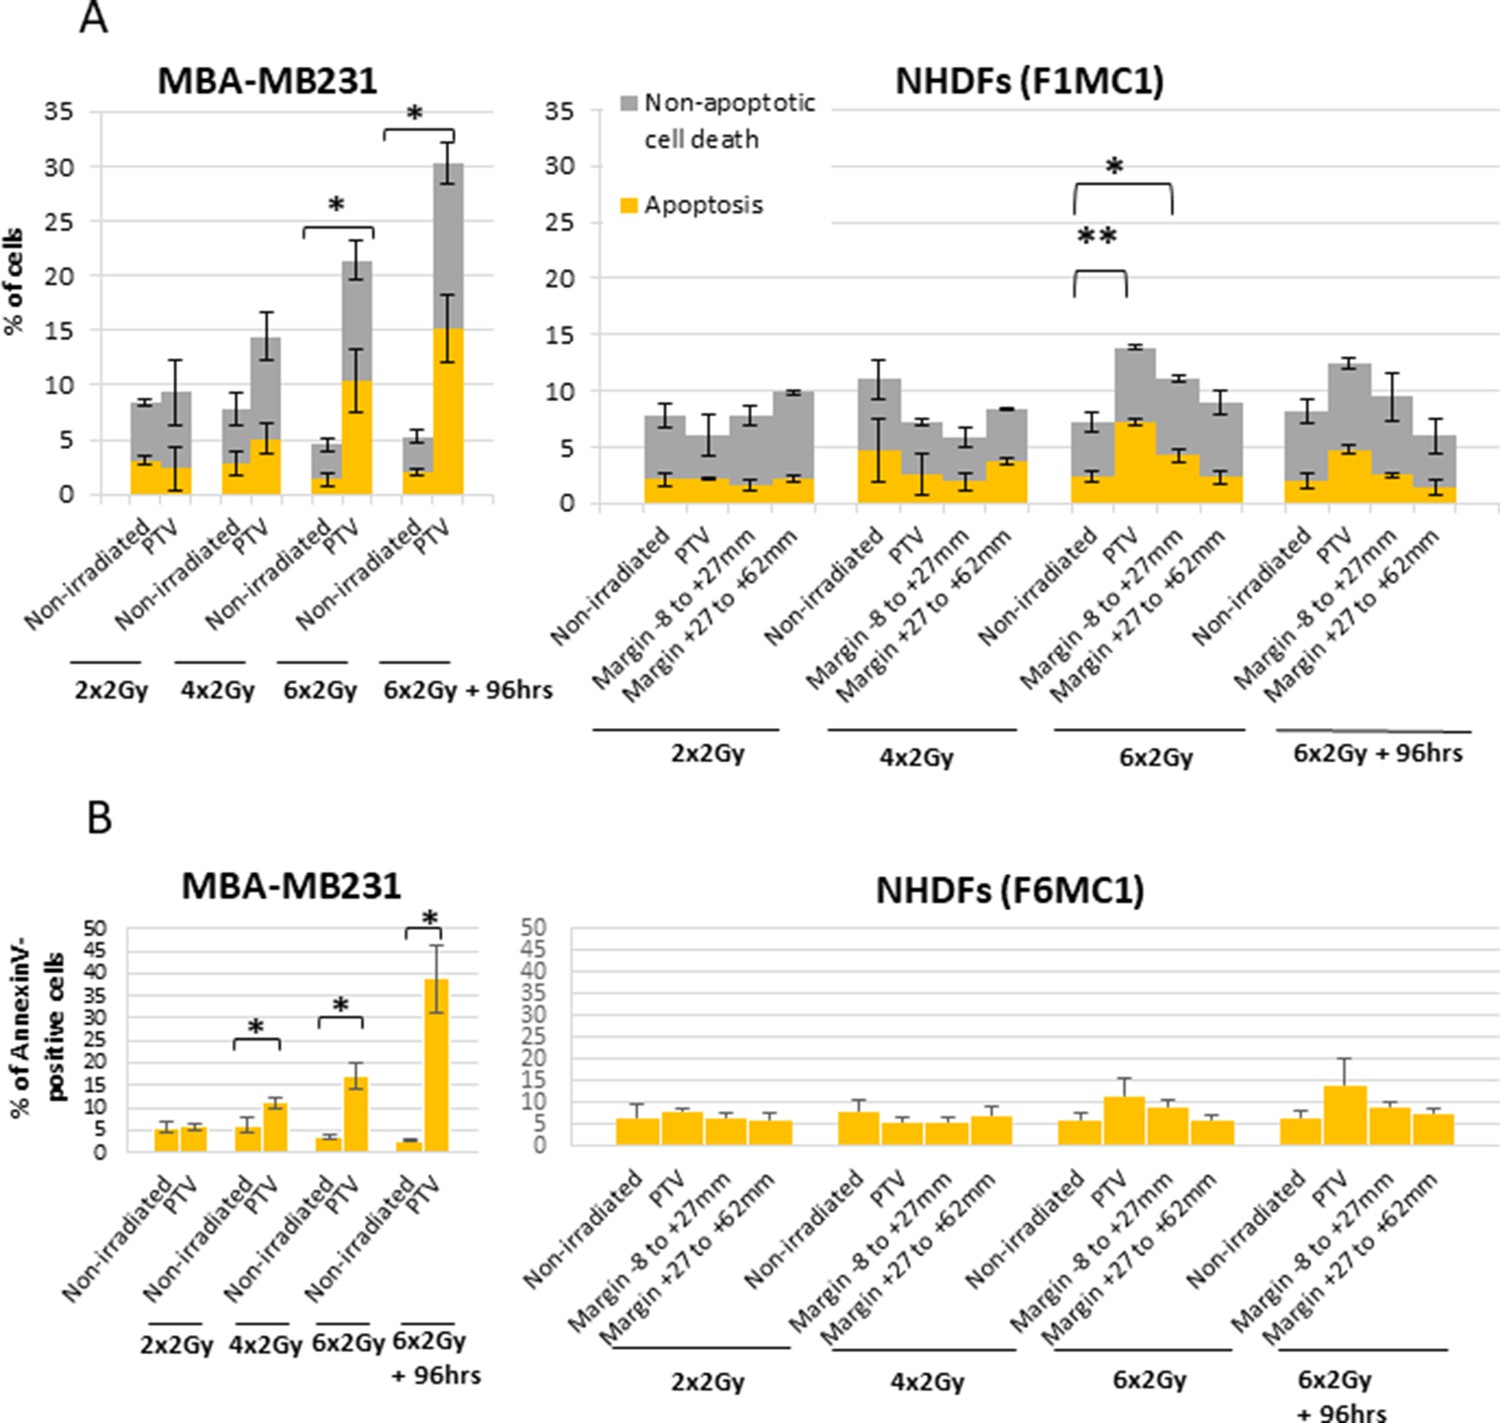
Cell death level of normal human dermal fibroblasts (NHDFs) from two other donors positioned at the margin or inside a planning target volume (PTV) receiving 2 Gy/day.
(A) MDA-MB231 cultured in 100 mm dishes were irradiated or not at 2 Gy/day except weekends up to six irradiations. The dishes were entirely located inside the PTV. NHDFs (A: donor F1MC1, population doubling [PD] = 28 at the beginning of the experiment; B: donor F6MC1, PD = 20.29 at the beginning of the experiment) cultured in 6-well plates were irradiated, positioned as indicated in Figure 1—figure supplement 2A and B. The level of cell death was measured 8 hr or 96 hr after the last radiation fraction by flow cytometry using the Alexa Fluor 488 Annexin V/Dead Cell Apoptosis kit (Life Technologies). Apoptosis was recorded as Annexin V-positive and propidium iodide (PI)-negative cells. Nonapoptotic cell death was recorded as Annexin V-positive and PI-positive cells. Each condition was performed in triplicate. Each bar represents the mean ± SD of the three measures. (B) Total cell death was recorded as Annexin V-positive cells. Each condition was performed in triplicate. Each bar represents the mean ± SD of the three measures. t-tests were performed between the total percentages of cell death of each condition in comparison to nonirradiated condition.
-
Figure 1—figure supplement 4—source data 1
Data for Alexa Fluor 488 Annexin Dead Cell Apoptosis assays.
- https://cdn.elifesciences.org/articles/67190/elife-67190-fig1-figsupp4-data1-v1.xlsx
-
Figure 1—figure supplement 4—source data 2
Data for Annexin V-positive cells.
- https://cdn.elifesciences.org/articles/67190/elife-67190-fig1-figsupp4-data2-v1.xlsx
Figure 2 with 5 supplements
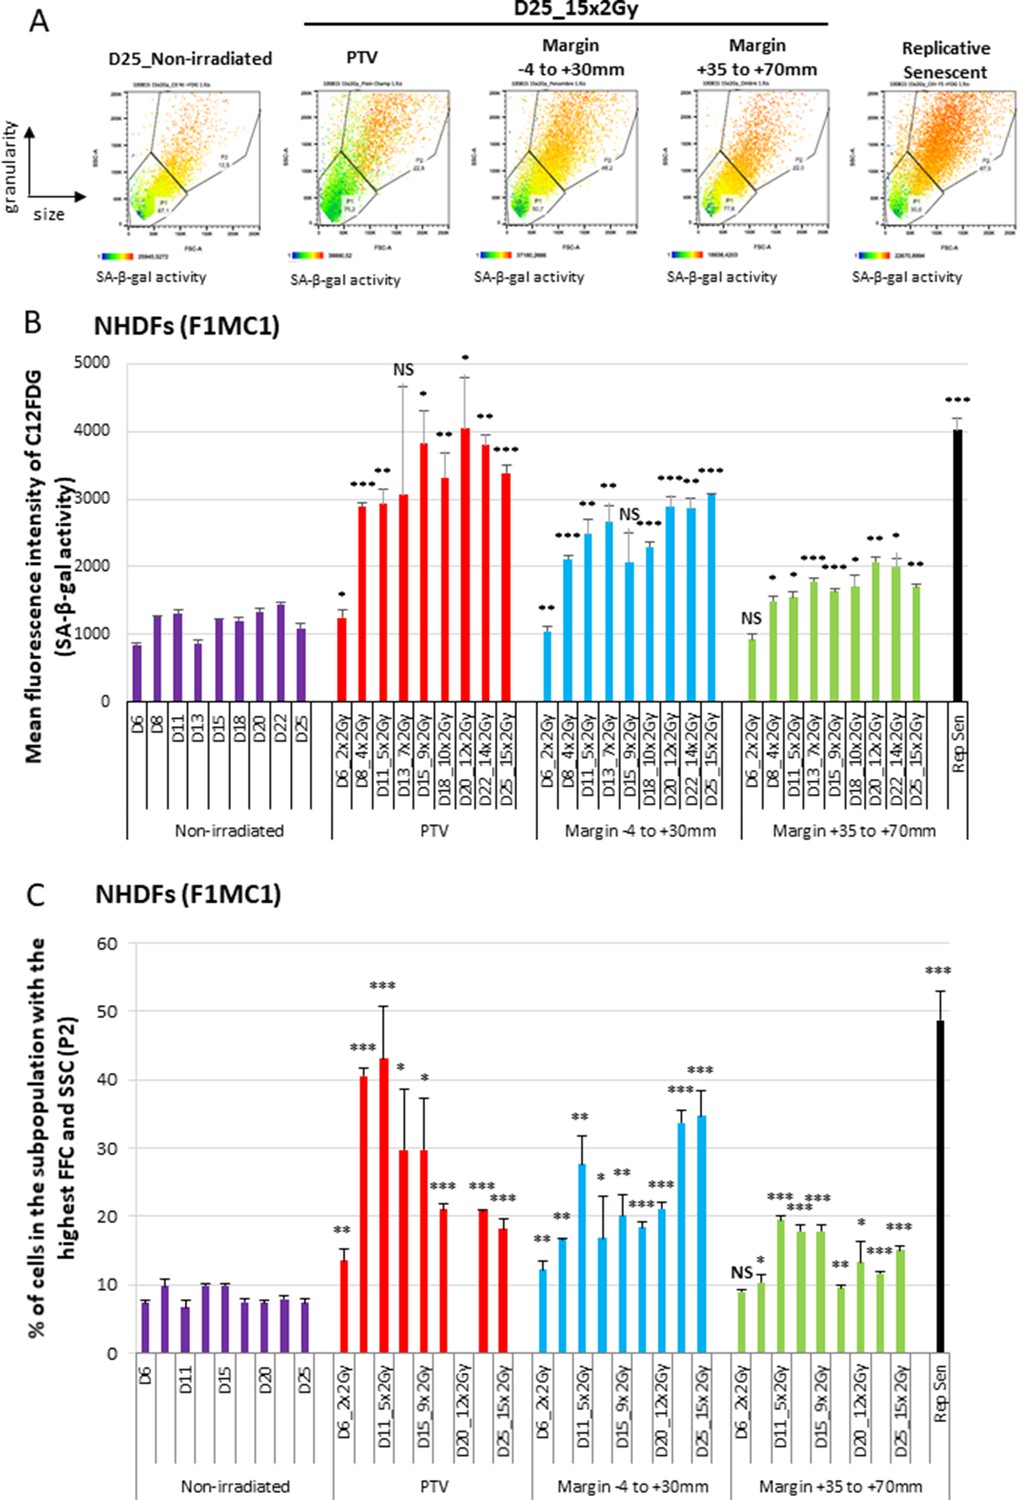
Normal human dermal fibroblasts (NHDFs) positioned at the margin of a planning target volume (PTV) receiving 2 Gy/day undergo senescence.
Six-well plates of NHDFs (donor F1MC1, population doubling [PD] = 25.8 at the beginning of the experiment) positioned straddling the PTV and the margin were irradiated during 3 weeks at 2 Gy/day except weekends. Cells were analyzed 24 hr or 72 hr after the last radiation fraction by flow cytometry for their side scatter (SSC) and forward scatter (FSC) values, representing the granularity and the size of the cells, respectively, and for their SA-β-Gal activity using the fluorogenic C12FDG substrate. (A) Examples of how dot plots were analyzed to characterize senescent cells. The dot plots represent the size (FSC) and granularity (SSC) measures of NHDFs. The gate P2 corresponds to cells with the highest size and granularity established by comparing nonirradiated exponentially growing NHDFs to replicative senescent NHDFs. The color scale of the dots represents their SA-β-Gal activity, with the blue color representing a low activity and the orange color a high activity. The middle panels are examples of C12FDG measures after 15 irradiations (day 25). The right panel illustrates the gate of the biggest and most granular cells that was set by comparing nonirradiated exponentially growing NHDFs (left panel) to NHDFs at replicative senescence plateau (PD = 61.03). (B) SA-β-Gal activity measured 24 hr or 72 hr after the last radiation fraction by flow cytometry using the fluorogenic C12FDG substrate. The results are given as the mean C12FDG fluorescence intensity. Each condition was performed in triplicate. Each bar represents the mean ± SD of the three measures. t-tests were performed for each condition in comparison to nonirradiated cells. (C) SSC and FSC values, representing the granularity and the size of the cells respectively, were measured by flow cytometry on the same cells and at the same time as the C12FDG fluorescence. Each bar shows the percentage of cells with the highest FSC and SSC values. Each condition was performed in triplicate. Each bar represents the mean ± SD of the three measures. t-tests were performed for each counting in comparison to nonirradiated exponentially growing NHDFs.
-
Figure 2—source data 1
Data for SA-β-Gal activity.
- https://cdn.elifesciences.org/articles/67190/elife-67190-fig2-data1-v1.xlsx
-
Figure 2—source data 2
Data for forward scatter (FSC) and side scatter (SSC levels).
- https://cdn.elifesciences.org/articles/67190/elife-67190-fig2-data2-v1.xlsx
Figure 2—figure supplement 1
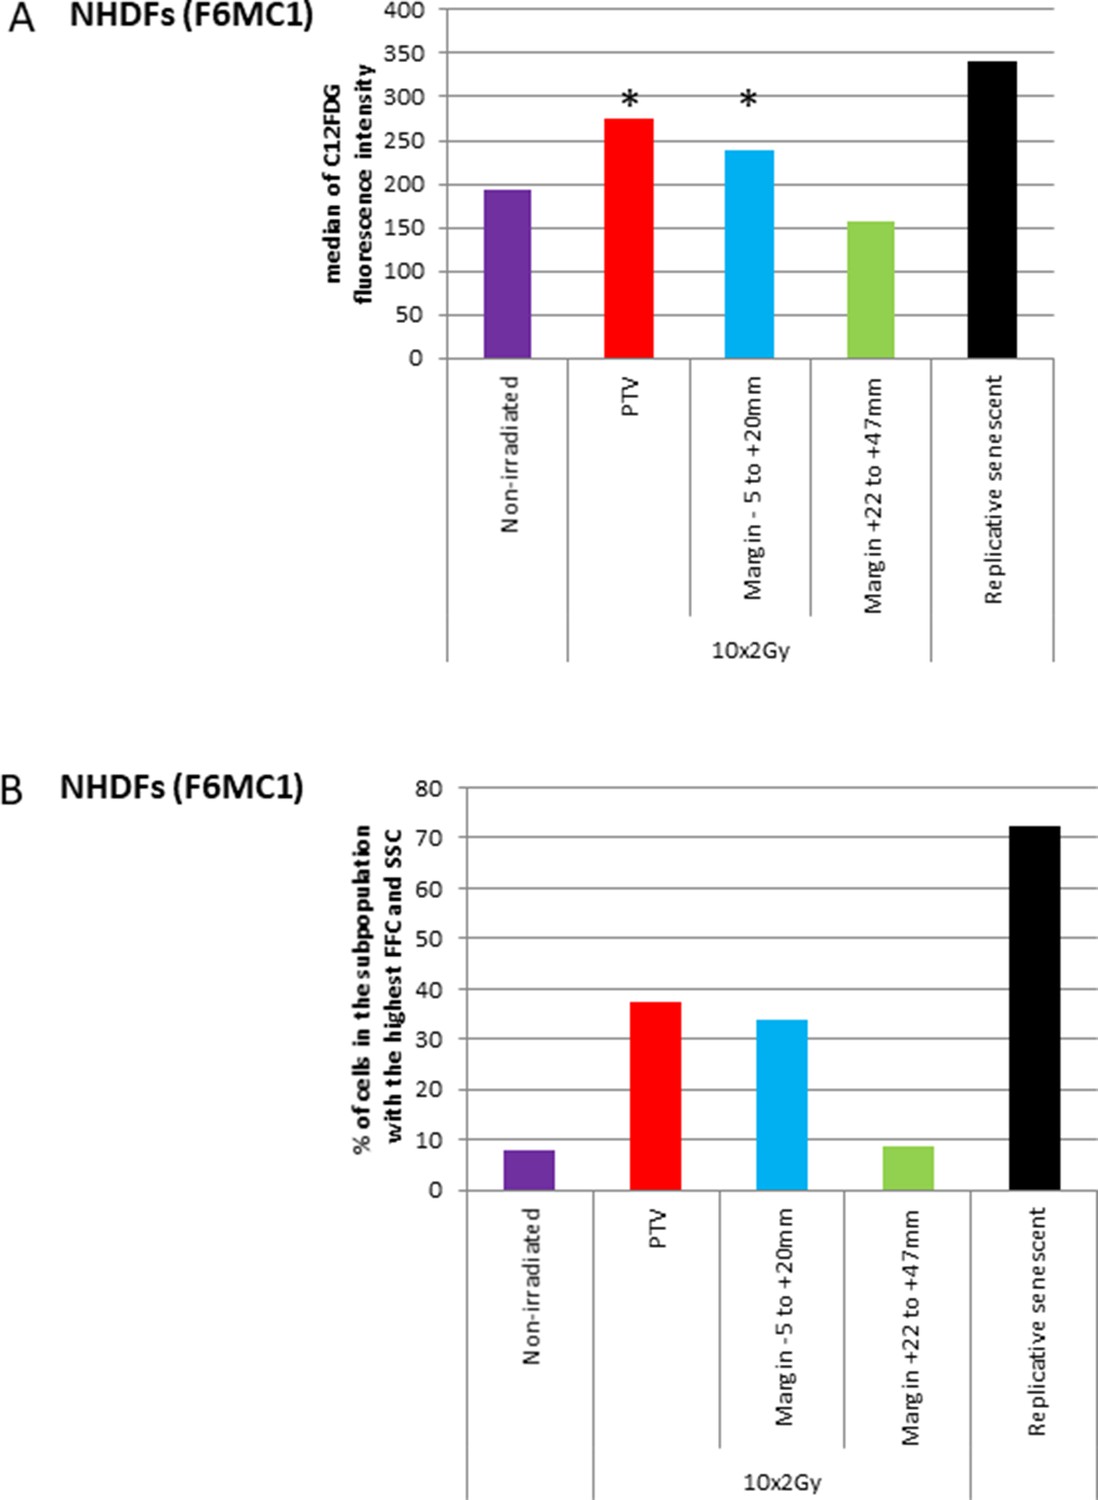
Normal human dermal fibroblasts (NHDFs) from another donor positioned at the margin of a planning target volume (PTV) receiving 2 Gy/day undergo senescence.
NHDFs (donor F6MC1, population doubling [PD] = 32.4 at the beginning of the experiment) cultured in 12-well plates were irradiated or not at 2 Gy each day except weekends for a total of 10 radiation fractions. Plates were positioned with one row of wells inside the PTV and three rows in the margin. (A) The SA-β-Gal activity was measured 72 hr after the 10th radiation fraction by flow cytometry using the fluorogenic C12FDG substrate. NHDFs at replicative senescence plateau (PD = 55.8) were used for comparison. The results are given as the median C12FDG fluorescence intensity. A chi-square test was done to compare the fluorescence intensity of each of the 10,000 irradiated or senescent NHDFs to nonirradiated NHDFs. (B) The side scatter (SSC) and forward scatter (FSC) values were measured by flow cytometry on the same cells and at the same time as the C12FDG fluorescence. Each bar gives the percentage of cells with the highest FSC and SSC values. The gate was established by comparing nonirradiated exponentially growing NHDFs to NHDFs at the replicative senescence plateau (PD = 55.8).
-
Figure 2—figure supplement 1—source data 1
Values of C12FDG fluorescence intensity.
- https://cdn.elifesciences.org/articles/67190/elife-67190-fig2-figsupp1-data1-v1.xlsx
Figure 2—figure supplement 2
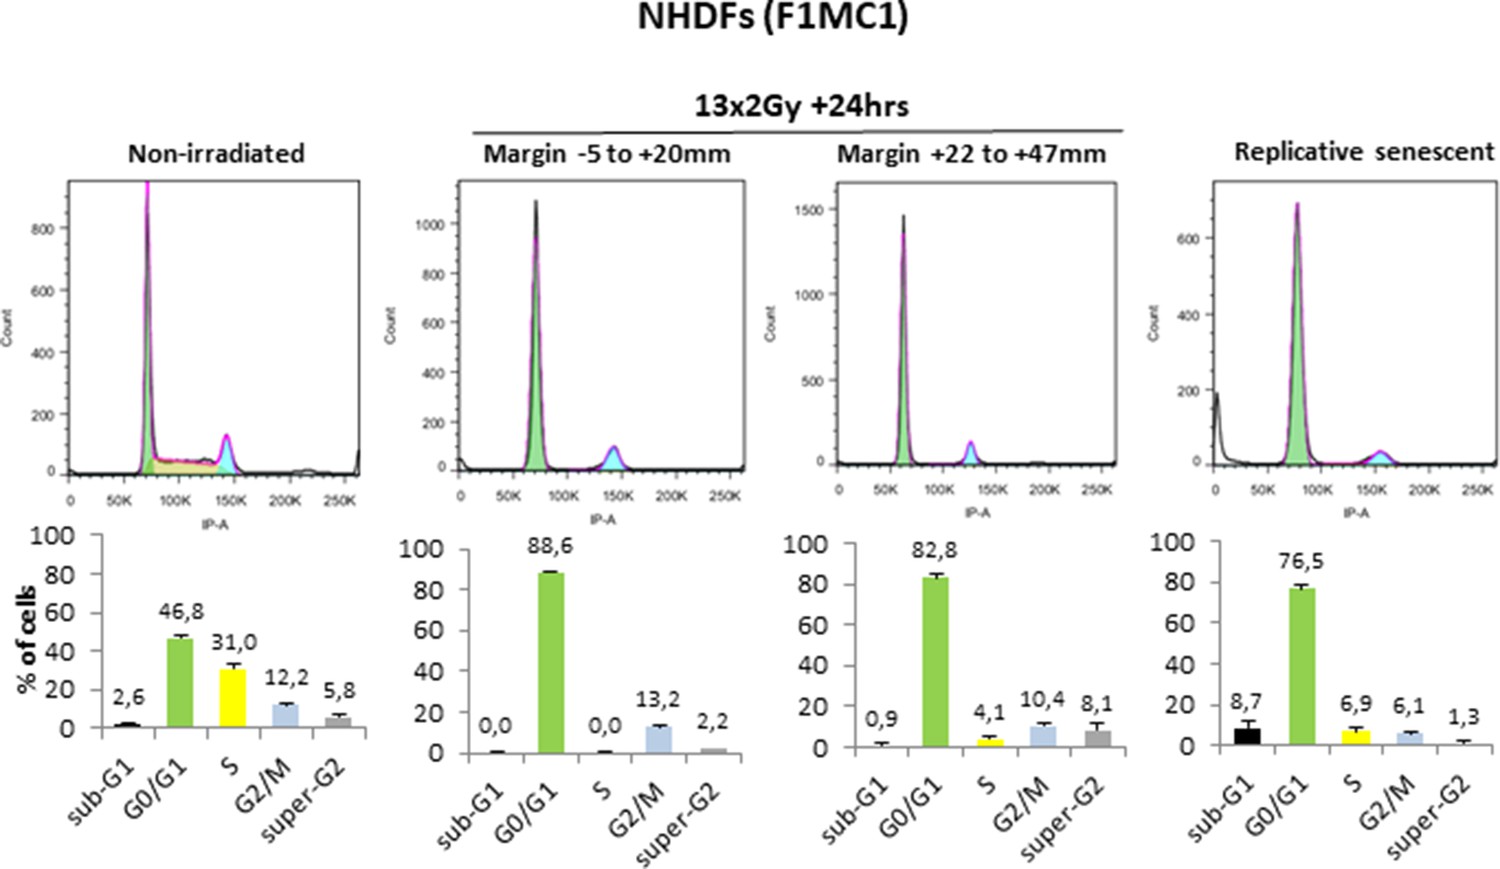
Normal human dermal fibroblasts (NHDFs) positioned at the margin of the planning target volume (PTV) receiving 2 Gy/day become cell cycle arrested in G1.
NHDFs (donor F1MC1, population doubling [PD] = 25.8 at the beginning of the experiment) cultured in 6-well plates were irradiated or not at 2 Gy/day except weekends up to 13 times. NHDFs at replicative senescence plateau (PD = 61.03) were used for comparison. Cells were analyzed 24 hr after the 13rd radiation fraction by flow cytometry with propidium iodide staining. Each condition was performed in duplicate and analyzed with FlowJo V10. The upper panels show representative cell cycle histograms. The lower bar charts represent the mean of the two measures. Each bar represents a cell cycle phase. Sub-G1 represents dying cells. Super-G2 represents polyploid cells or doublets.
-
Figure 2—figure supplement 2—source data 1
Quantification of cells in the different phases of the cell cycle.
- https://cdn.elifesciences.org/articles/67190/elife-67190-fig2-figsupp2-data1-v1.xls
Figure 2—figure supplement 3
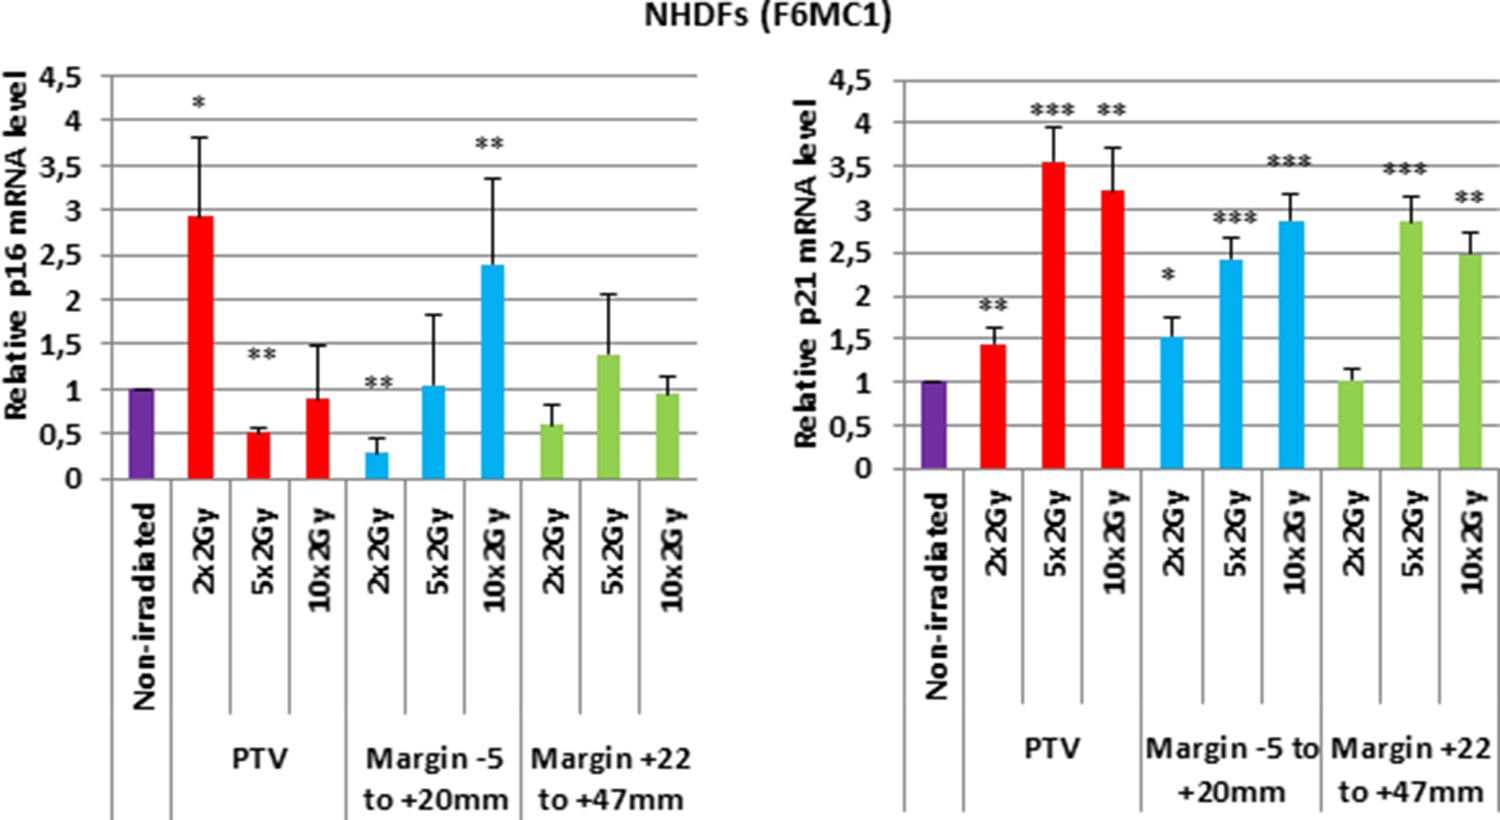
Induction of p16 and p21 expression in normal human dermal fibroblasts (NHDFs) positioned at the margin of a planning target volume (PTV) receiving 2 Gy/day.
NHDFs (donor F6MC1, population doubling [PD] = 18 at the beginning of the experiment) cultured in 12-well plates were irradiated or not at 2 Gy/day except weekends for different durations (2 × 2 Gy, 5 × 2 Gy, 10 × 2 Gy). The expressions of p16 (left) and p21 (right) were analyzed by RT-qPCR. Each condition was done in triplicate. The bar charts represent the mean fold change ± SD of p16 or p21 mRNA abundance compared to nonirradiated cells from the three measures of each condition. A Student test was performed for each condition in comparison to nonirradiated cells.
-
Figure 2—figure supplement 3—source data 1
RT-qPCR data for p16.
- https://cdn.elifesciences.org/articles/67190/elife-67190-fig2-figsupp3-data1-v1.xlsx
-
Figure 2—figure supplement 3—source data 2
RT-qPCR data for p21.
- https://cdn.elifesciences.org/articles/67190/elife-67190-fig2-figsupp3-data2-v1.xlsx
Figure 2—figure supplement 4
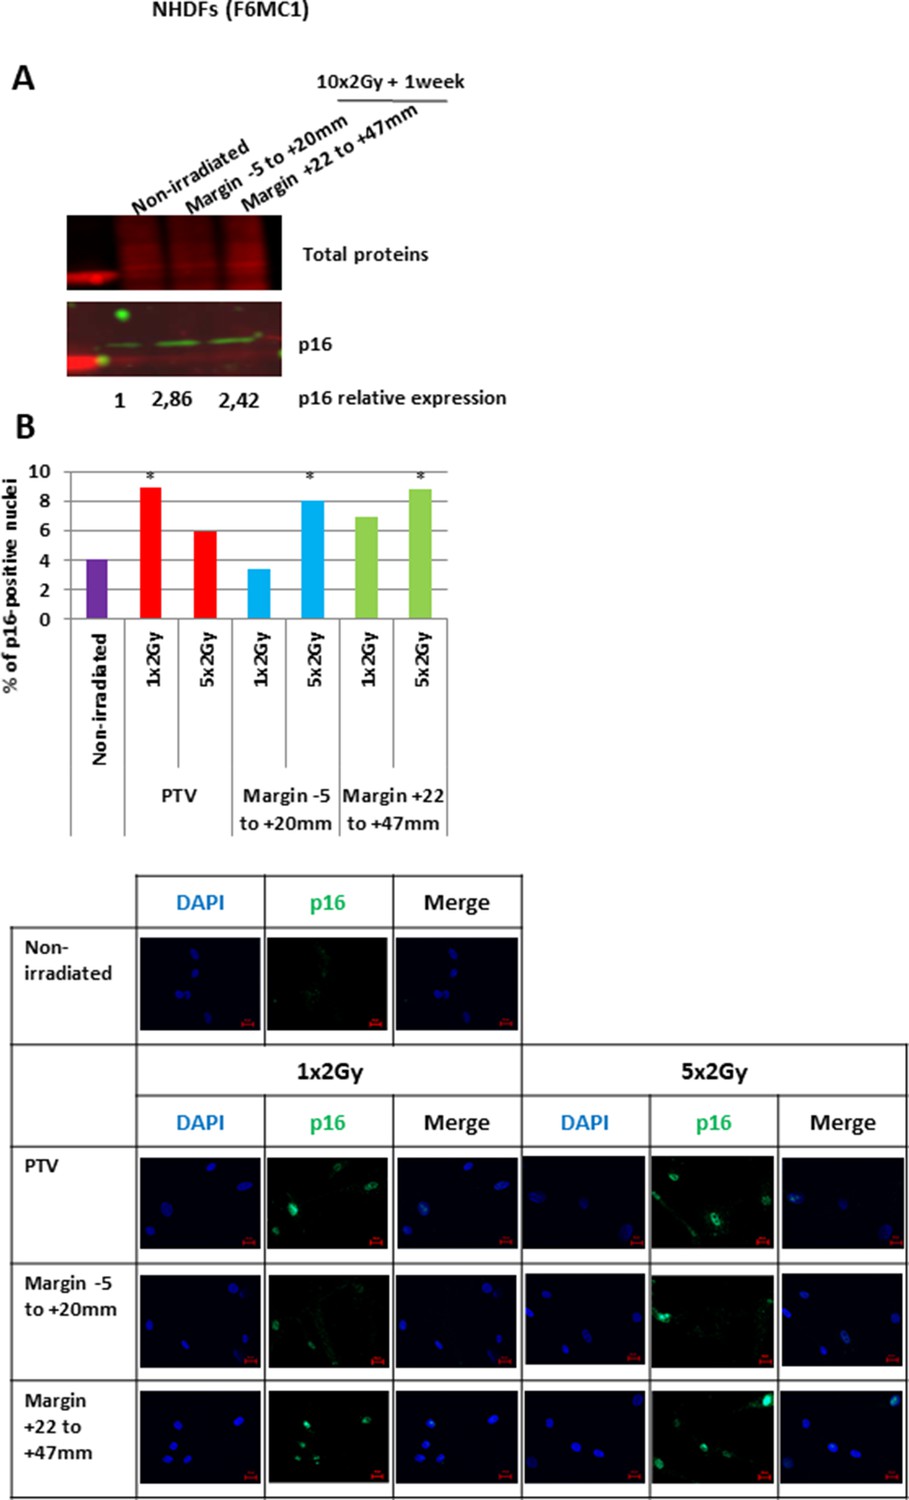
Induction of p16 in normal human dermal fibroblasts (NHDFs) positioned at the margin of a planning target volume (PTV) receiving 2 Gy/day.
NHDFs (donor F6MC1, population doubling [PD] = 18 at the beginning of the experiment) cultured in 12-well plates were irradiated or not at 2 Gy/day except weekends for different durations (1 × 2 Gy, 5 × 2 Gy, 10 × 2 Gy). (A) The expression of p16 was analyzed by Western blot after 10 × 2 Gy with a resting time of 1 week. Total protein stain was used as loading control. p16 expression was normalized to total proteins and then quantified compared to nonirradiated cells. (B) Immunofluorescence analysis of p16 protein levels. p16-positive nuclei were counted amongst almost 100 cells. A chi-square test was done to compare the percent of p16-positive cells between irradiated and nonirradiated cells. Images of immunofluorescence representative of those used to calculate the percentage of p16-positive nuclei are given. The scale bar represents 20 µm.
-
Figure 2—figure supplement 4—source data 1
Western blot of p16.
- https://cdn.elifesciences.org/articles/67190/elife-67190-fig2-figsupp4-data1-v1.pptx
-
Figure 2—figure supplement 4—source data 2
Quantification of p16-positive cells.
- https://cdn.elifesciences.org/articles/67190/elife-67190-fig2-figsupp4-data2-v1.xlsx
Figure 2—figure supplement 5
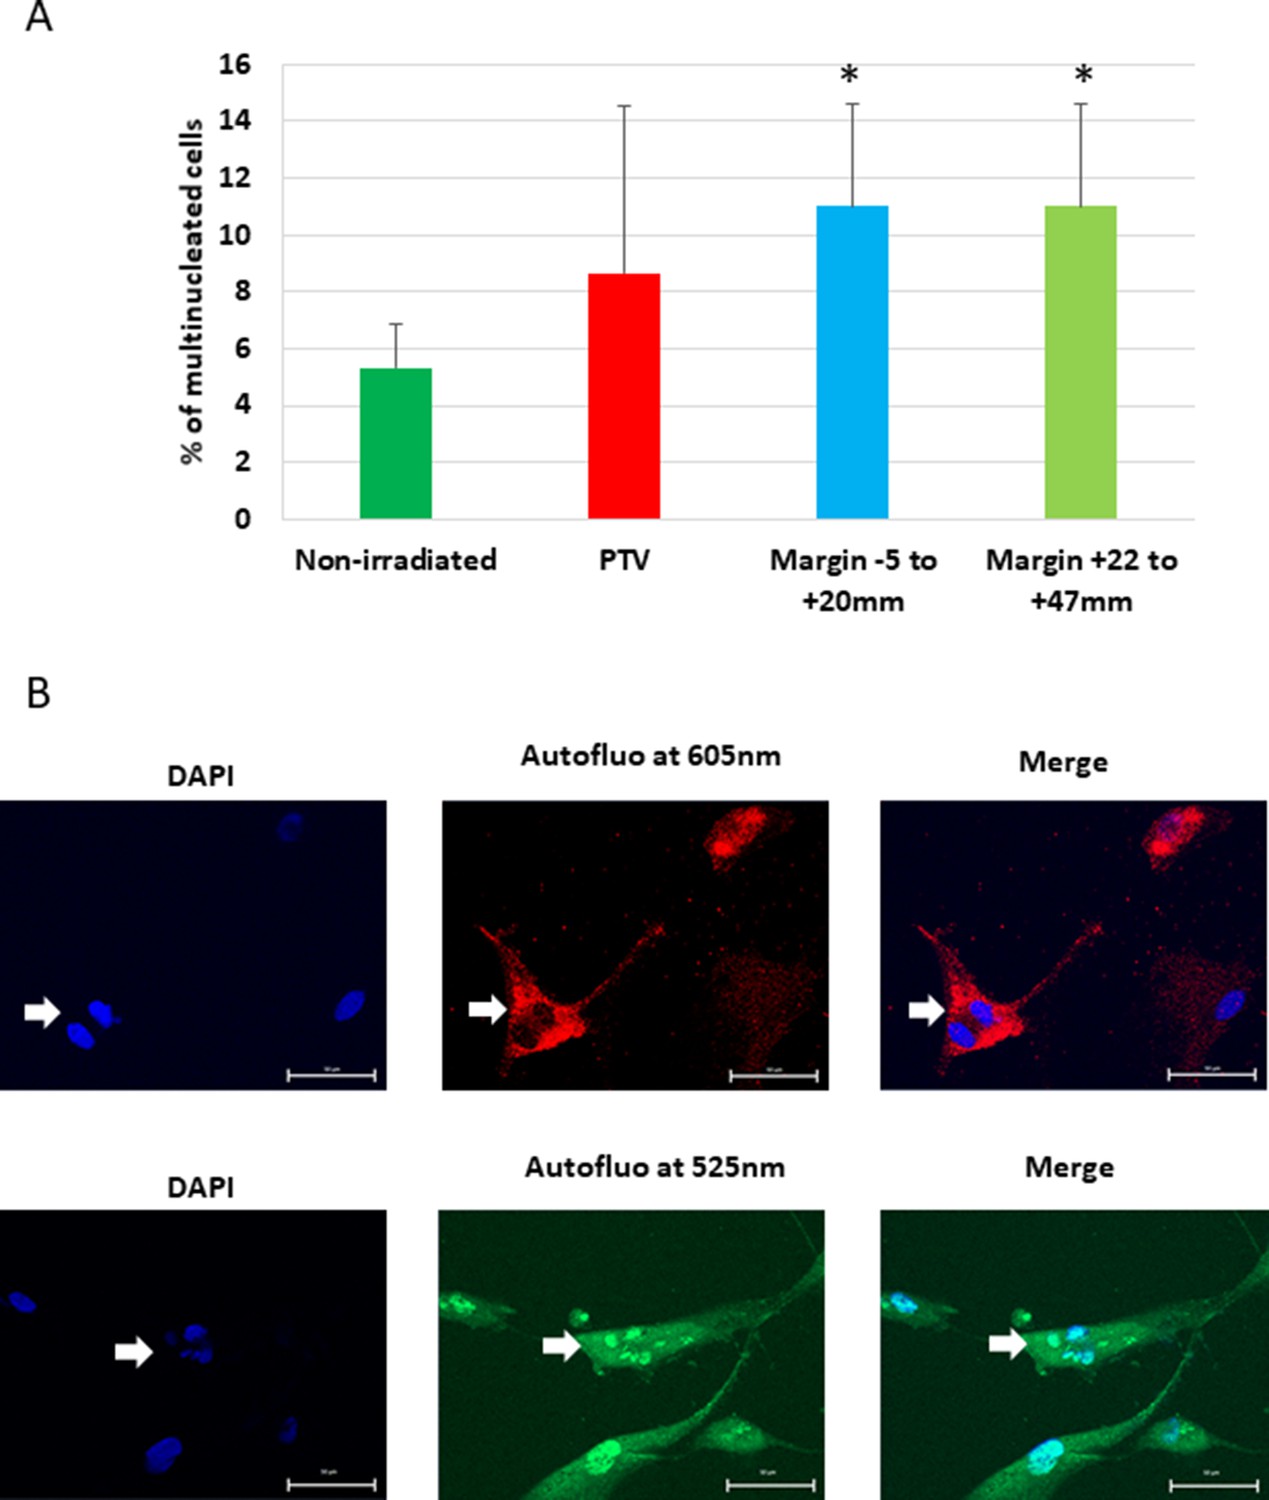
A significant proportion of normal human dermal fibroblasts (NHDFs) positioned at the margin of a planning target volume (PTV) receiving 2 Gy/day become multinucleated.
Three independent series of fluorescent microscopy images from three immunofluorescence experiments were reanalyzed for the presence of multinucleated cells. In these experiments, NHDFs were irradiated in 12-well plates at 2 Gy/day for 2 weeks. Nuclei were detected by the DAPI staining and the cell limits were determined by using the cell autofluorescence at 605 ± 70 nm or 525 ± 50 nm. (A) About 100 cells were manually counted for each condition. Each bar represents the mean ± SD of the percent of multinucleated cells in the three series. t-tests were performed for each condition in comparison to the nonirradiated condition. (B) Two representative images visualized at 605 ± 70 nm or 525 ± 50 nm. The white arrows point to multinucleated cells. Scale bar = 50 µm.
-
Figure 2—figure supplement 5—source data 1
Quantification of multinucleated cells.
- https://cdn.elifesciences.org/articles/67190/elife-67190-fig2-figsupp5-data1-v1.xlsx
Figure 3 with 6 supplements
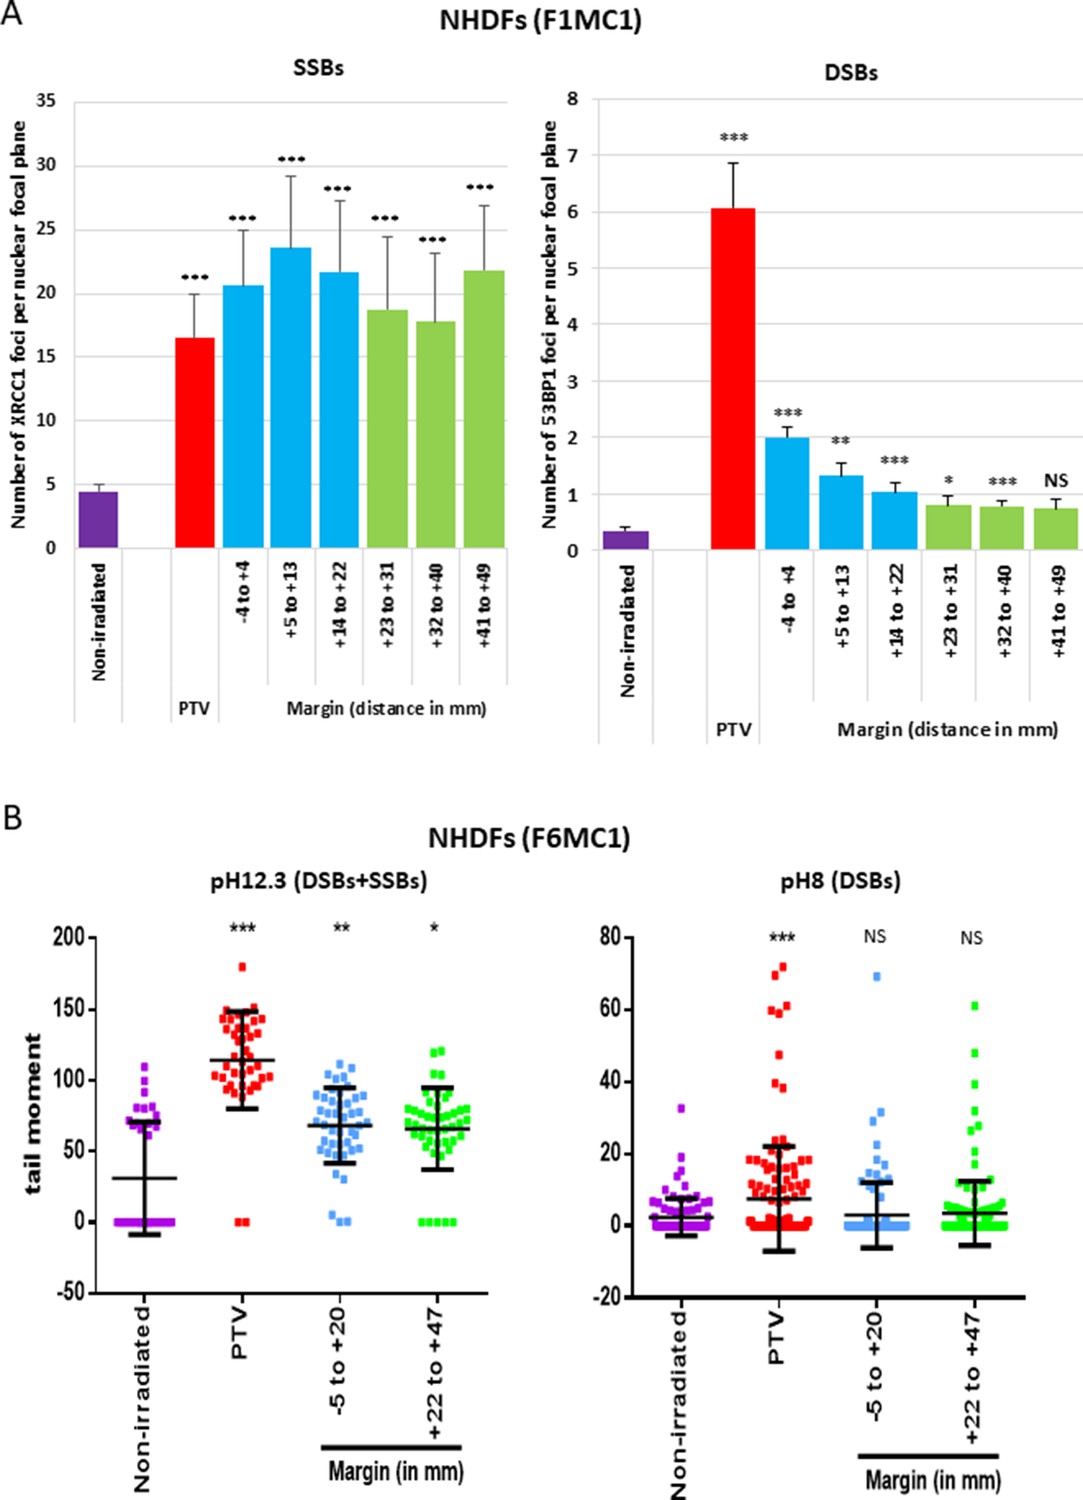
Single-strand breaks (SSBs) and double-strand breaks (DSBs) generated in normal human dermal fibroblasts (NHDFs) positioned at the margin or inside a planning target volume (PTV) having received 2 Gy.
(A) Proliferating NHDFs (donor F1MC1, population doubling [PD] = 32) positioned straddling the PTV and the margin were irradiated once at 2 Gy. Cells were fixed 20 min or 2 hr later for the immunodetection of XRCC1 and 53BP1, respectively. XRCC1 and 53BP1 foci were quantified by high-content microscopy. The bar chart represents the mean number ± SD of foci per nuclear focal plane in 100 cells of all wells of a column. An ANOVA test with a Bonferroni correction was performed for each counting in comparison to nonirradiated exponentially growing NHDFs. (B) Proliferating NHDFs (F6MC1, PD = 20.53) were irradiated as in (A), immediately put at 10°C for 30 min and then processed for comet assays. Each dot in the scatter plots represents the value of the tail moment of one cell. The columns regroup the values of about 100 cells for each condition and give the mean ± SD of tail moment values. A Kruskal–Wallis test with a Bonferroni correction was performed for each counting in comparison to nonirradiated exponentially growing NHDFs.
-
Figure 3—source data 1
Number of XRCC1 foci.
- https://cdn.elifesciences.org/articles/67190/elife-67190-fig3-data1-v1.xlsx
-
Figure 3—source data 2
Number of 53BP1 foci.
- https://cdn.elifesciences.org/articles/67190/elife-67190-fig3-data2-v1.xlsx
-
Figure 3—source data 3
Statistics on comet assays at pH 12.3.
- https://cdn.elifesciences.org/articles/67190/elife-67190-fig3-data3-v1.pdf
-
Figure 3—source data 4
Comet assays at pH 12.3.
- https://cdn.elifesciences.org/articles/67190/elife-67190-fig3-data4-v1.xlsx
-
Figure 3—source data 5
Comet assays at pH 8.
- https://cdn.elifesciences.org/articles/67190/elife-67190-fig3-data5-v1.xlsx
-
Figure 3—source data 6
Statistics on comet assays at pH 8.
- https://cdn.elifesciences.org/articles/67190/elife-67190-fig3-data6-v1.pdf
Figure 3—figure supplement 1
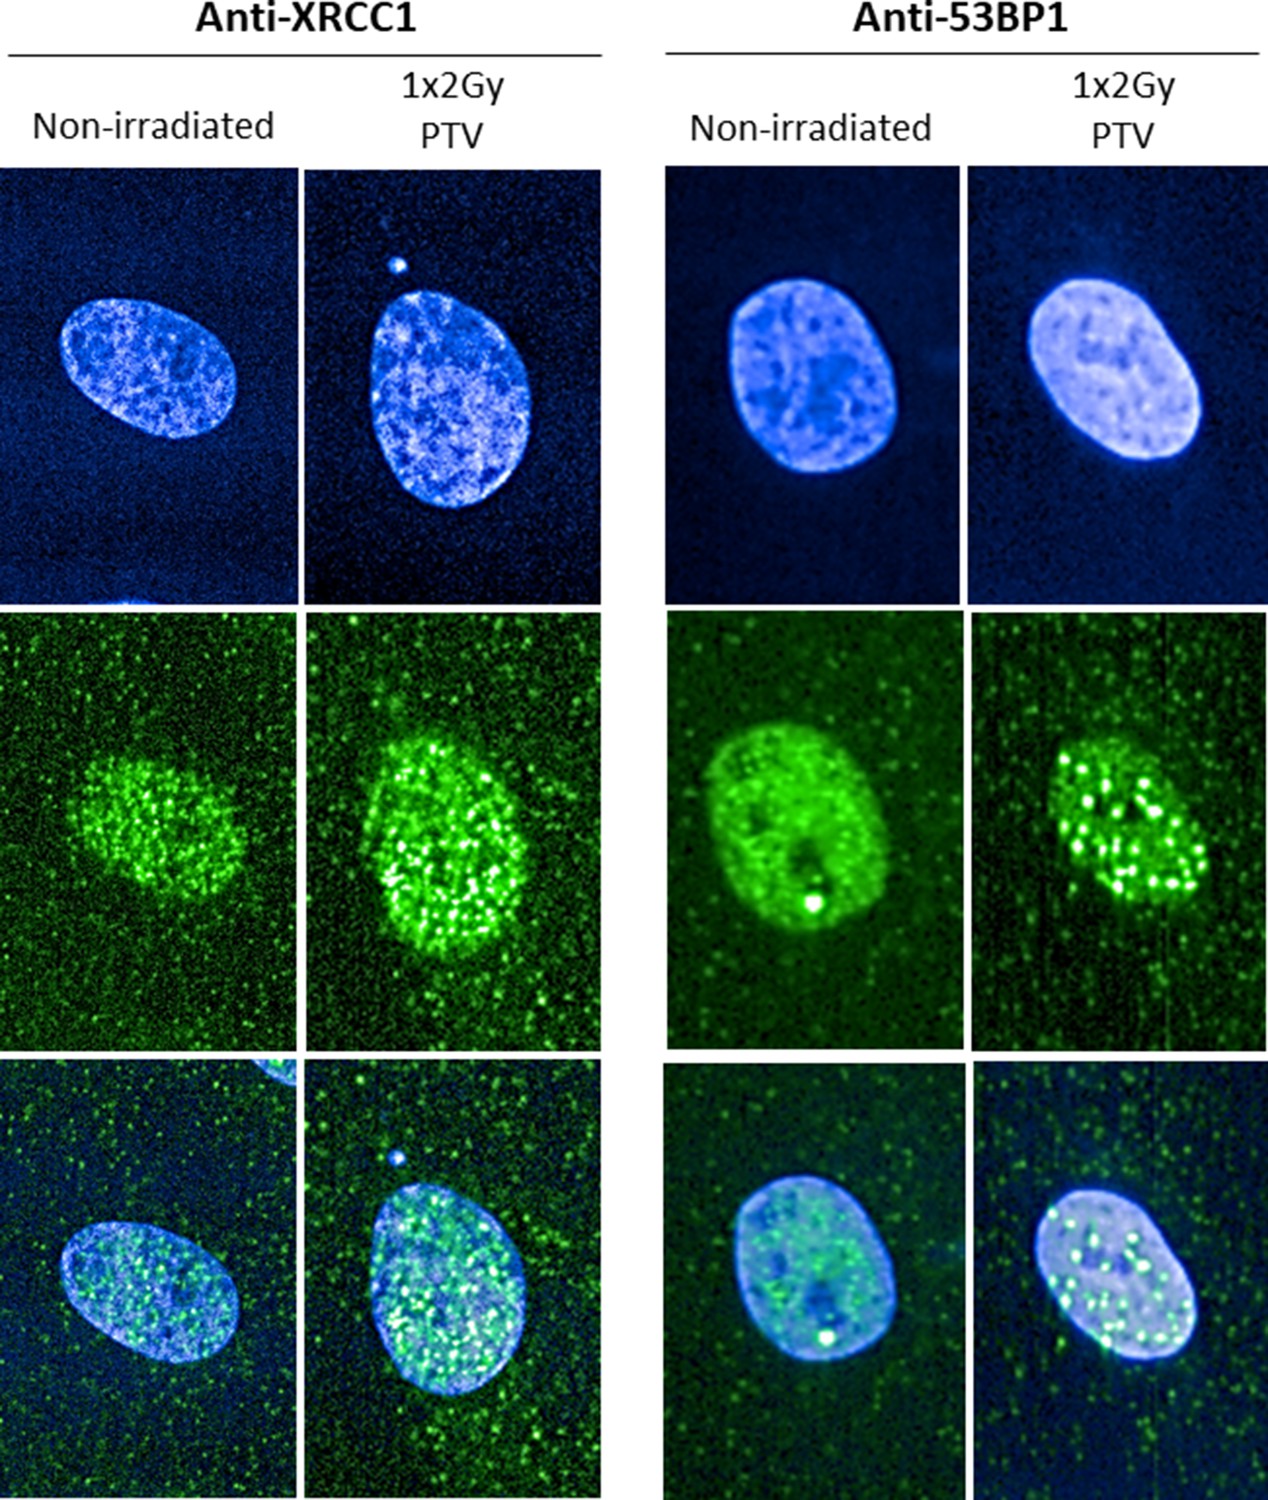
Representative images of XRCC1 and 53BP1 foci recorded by high-content microscopy.
Proliferating normal human dermal fibroblasts (NHDFs) (donor F1MC1, population doubling [PD] = 32) cultured in 96-well plates positioned straddling the planning target volume (PTV) and the margin were irradiated once at 2 Gy. Cells were fixed 20 min or 2 hr later for the immunodetection of XRCC1 and 53BP1, respectively. Cells were imaged using high-content microscopy to quantify XRCC1 and 53BP1 foci. Representative images of both types of foci are given.
Figure 3—figure supplement 2
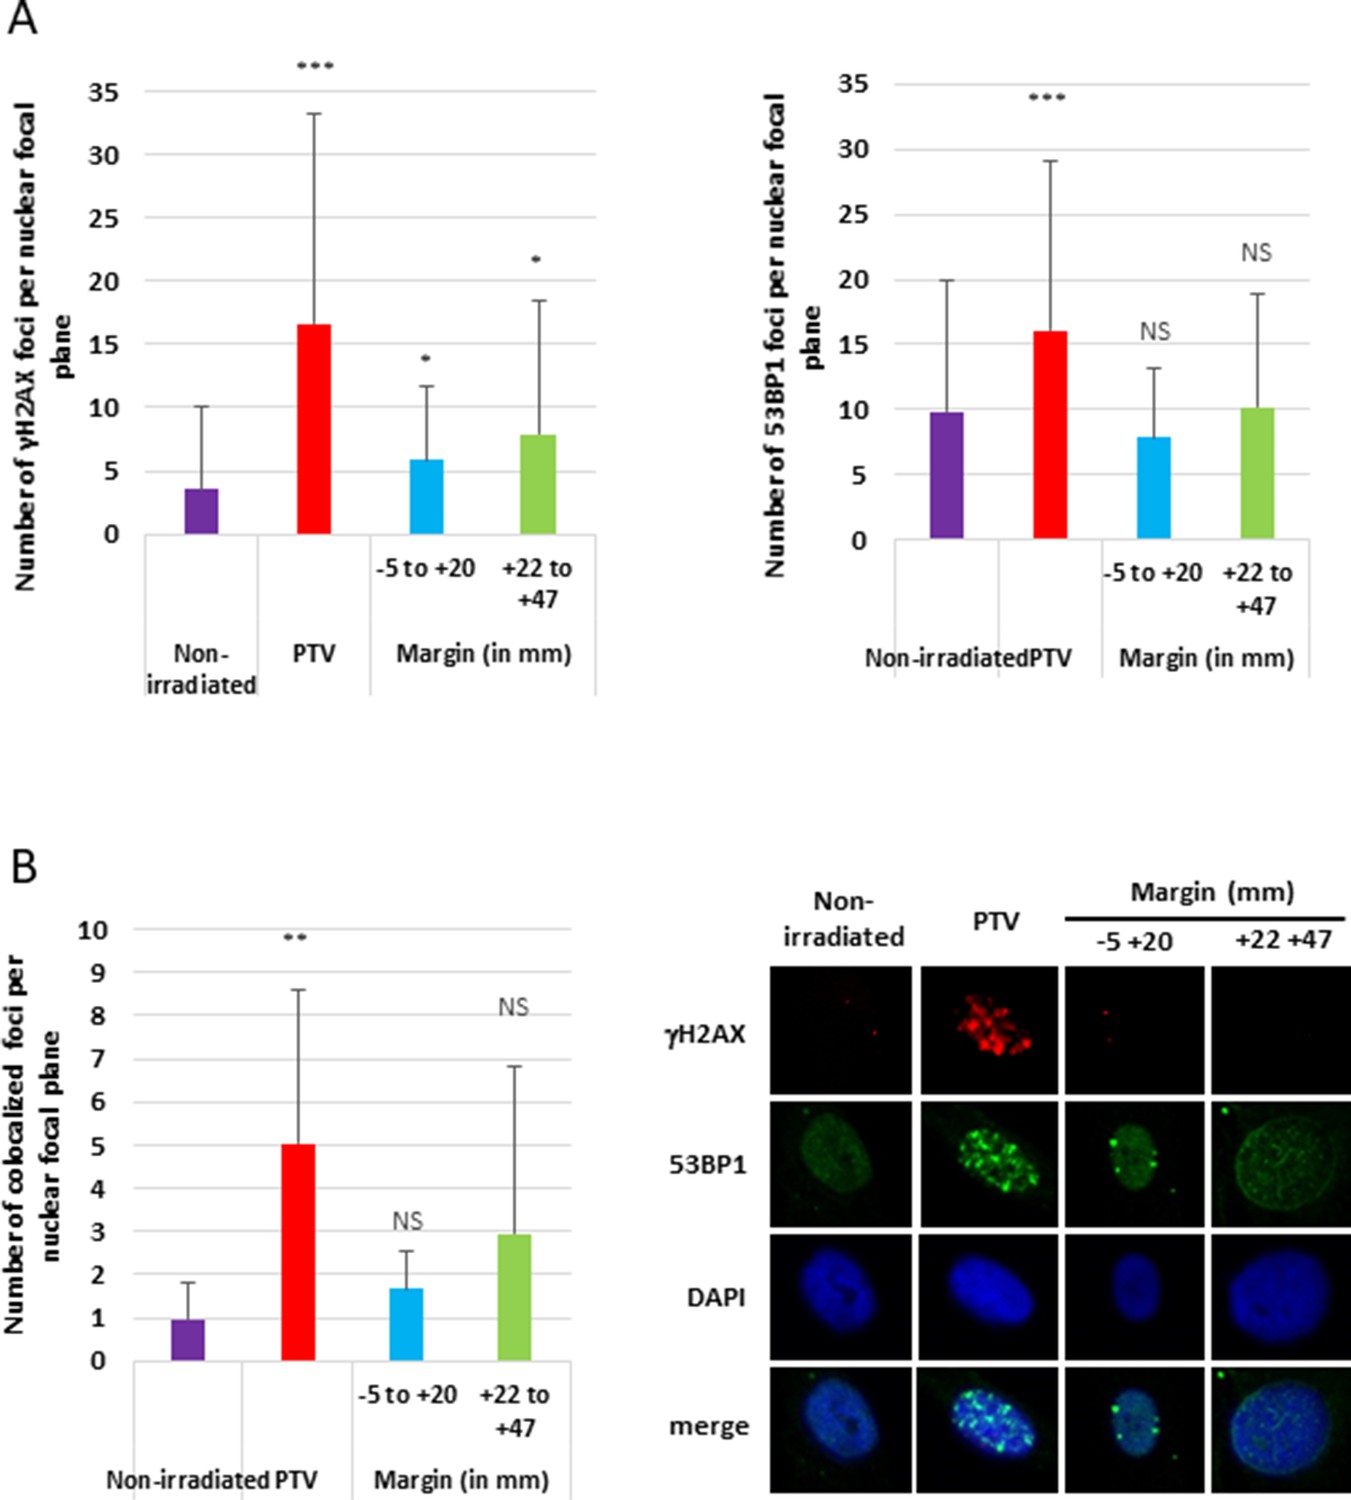
Normal human dermal fibroblasts (NHDFs) positioned at the margin of a planning target volume (PTV) receiving 2 Gy do not suffer from double-strand breaks (DSBs).
Proliferating NHDFs (donor F6MC1) cultured in 6-well plates positioned straddling the PTV were irradiated once at 2 Gy. Cells were fixed 2 hr later for the immunodetection of γH2AX and 53BP1, respectively. (A) γH2AX and 53BP1 foci were quantified by confocal microscopy using the Biovoxel module from ImageJ. The bar chart represents the mean number ± SD of foci per nuclear focal plane of 100 cells taken in all wells of a column. An ANOVA test with a Bonferroni correction was performed for each counting in comparison to nonirradiated exponentially growing NHDFs. (B) The foci in which 53BP1 and γH2AX were co-localized were quantified using the JACoP module from ImageJ. The bar chart represents the mean number ± SD of double-positive foci per nuclear focal plane of 100 cells taken in all wells of a column. An ANOVA test with a Bonferroni correction was performed for each counting in comparison to nonirradiated exponentially growing NHDFs.
-
Figure 3—figure supplement 2—source data 1
Quantification of γH2AX foci.
- https://cdn.elifesciences.org/articles/67190/elife-67190-fig3-figsupp2-data1-v1.xlsx
Figure 3—figure supplement 3
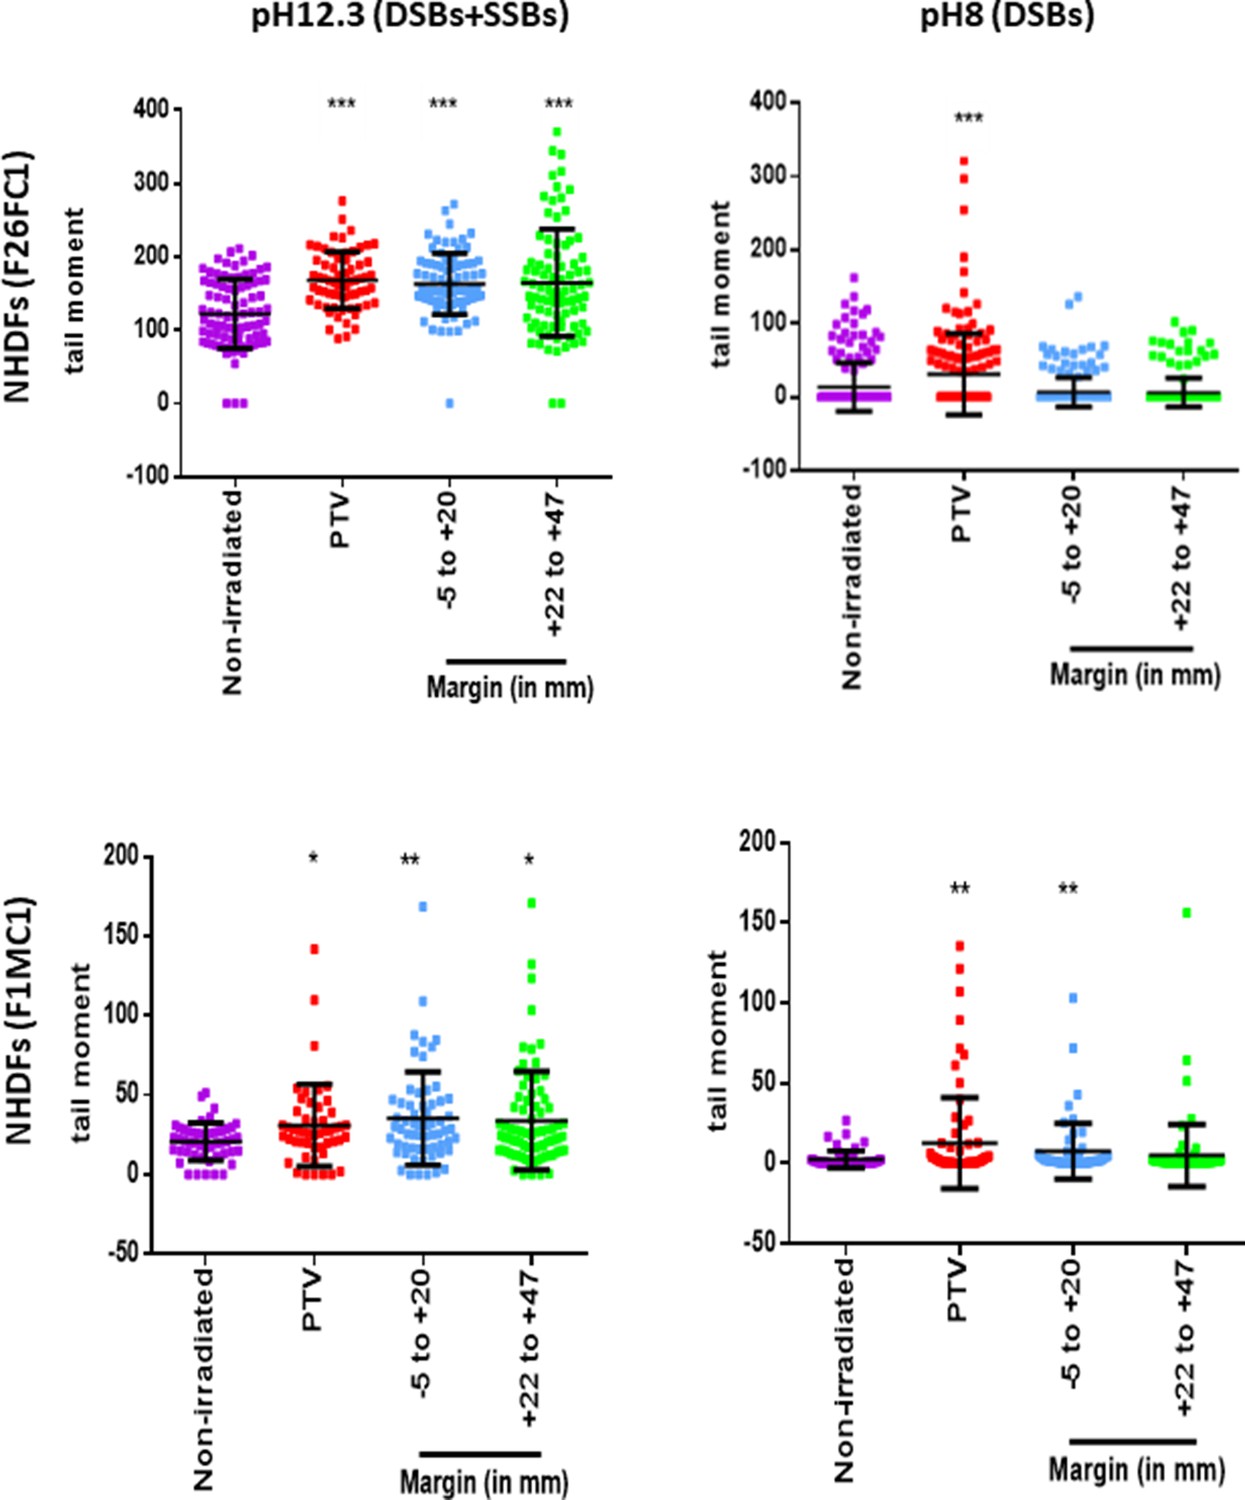
Single-strand breaks (SSBs) and double-strand breaks (DSBs) generated in normal human dermal fibroblasts (NHDFs) derived from different donors positioned at the margin or inside a planning target volume (PTV) receiving 2 Gy.
Proliferating NHDFs (F26MC1, population doubling [PD] = 6.2; F1MC1, PD = 24.3) cultured in 12-well plates were irradiated at 2 Gy and then processed for comet assays as in Figure 3B. About 100 cells per condition were analyzed. Each dot in the scatter plots represents the value of the tail moment of one cell. The columns regroup all the values for each condition and give the mean ± SD of tail moment values. A Kruskal–Wallis test with a Bonferroni correction was performed for each counting in comparison to nonirradiated exponentially growing NHDFs.
-
Figure 3—figure supplement 3—source data 1
Comet assays at pH 12.3 with F26MC1 NHDFs.
- https://cdn.elifesciences.org/articles/67190/elife-67190-fig3-figsupp3-data1-v1.xlsx
-
Figure 3—figure supplement 3—source data 2
Statistics on comet assays at pH 12.3 with F26MC1 NHDFs.
- https://cdn.elifesciences.org/articles/67190/elife-67190-fig3-figsupp3-data2-v1.pdf
-
Figure 3—figure supplement 3—source data 3
Comet assays at pH 8 with F26MC1 NHDFs.
- https://cdn.elifesciences.org/articles/67190/elife-67190-fig3-figsupp3-data3-v1.xlsx
-
Figure 3—figure supplement 3—source data 4
Statistics on comet assays at pH 8 with F26MC1 NHDFs.
- https://cdn.elifesciences.org/articles/67190/elife-67190-fig3-figsupp3-data4-v1.pdf
-
Figure 3—figure supplement 3—source data 5
Comet assays at pH 12.3 with F1MC1 NHDFs.
- https://cdn.elifesciences.org/articles/67190/elife-67190-fig3-figsupp3-data5-v1.xlsx
-
Figure 3—figure supplement 3—source data 6
Statistics on comet assays at pH 12.3 with F1MC1 NHDFs.
- https://cdn.elifesciences.org/articles/67190/elife-67190-fig3-figsupp3-data6-v1.pdf
-
Figure 3—figure supplement 3—source data 7
Comet assays at pH 8 with F1MC1 NHDFs.
- https://cdn.elifesciences.org/articles/67190/elife-67190-fig3-figsupp3-data7-v1.xlsx
-
Figure 3—figure supplement 3—source data 8
Statistics on comet assays at pH 8 with F1MC1 NHDFs.
- https://cdn.elifesciences.org/articles/67190/elife-67190-fig3-figsupp3-data8-v1.pdf
Figure 3—figure supplement 4
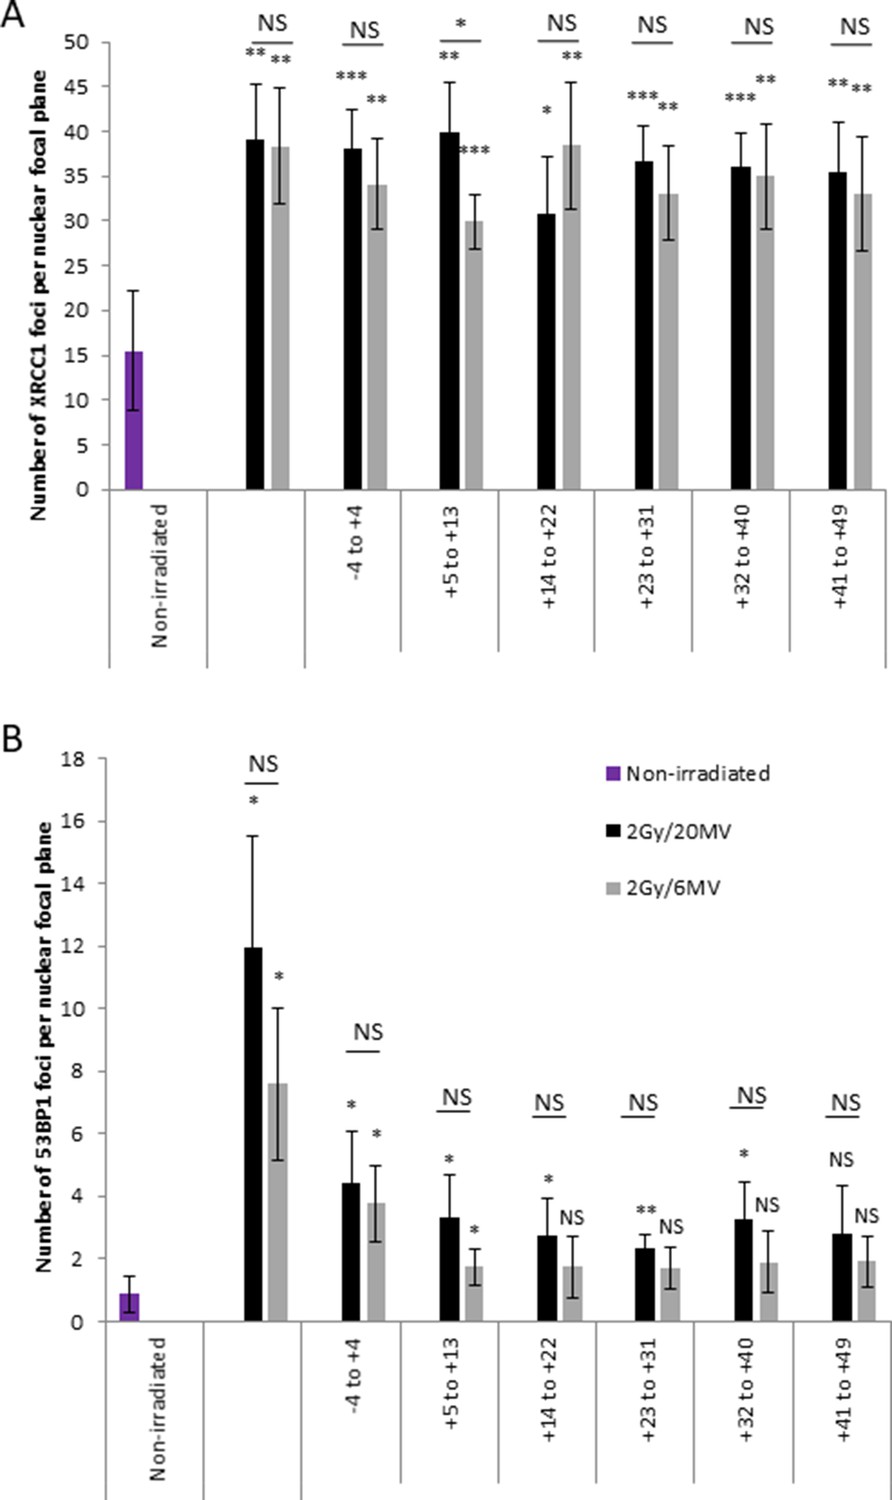
The numbers of 53BP1 and XRCC1 foci recorded after an irradiation with 6 and 20 MV photon beams are similar.
Proliferating normal human dermal fibroblasts (NHDFs) (donor F1MC1, population doubling [PD] = 39) cultured in 96-well plates were irradiated as in Figure 3 at 2 Gy by a photon beam of 6 or 20 MV. XRCC1 and 53BP1 foci were detected and analyzed as in Figure 3A. An ANOVA with a Bonferroni correction was performed for each condition in comparison to nonirradiated exponentially growing NHDFs. A t-test was performed to compare for each distance the number of XRCC1 or 53BP1 foci between 20 and 6 MV.
-
Figure 3—figure supplement 4—source data 1
Number of XRCC1 and 53BP foci.
- https://cdn.elifesciences.org/articles/67190/elife-67190-fig3-figsupp4-data1-v1.xlsx
Figure 3—figure supplement 5

A propagation of ionizing particles in the material is necessary for single-strand break (SSB) induction at distance from the planning target volume (PTV).
(A) Schematic representation of how the 12-well plates were aligned, sealed or not together with an ultrasound gel (250820, Asept Inmed), in order to have wells inside the PTV and wells in the margin, in continuity or not with the PTV. The red line represents the limit of the light field at which the deposited dose is 50% of that in the PTV. (B) Immunodetection of XRCC1 and 53BP1 foci in normal human dermal fibroblasts (NHDFs) (F6MC1, population doubling [PD] = 27.93) irradiated at 2 Gy as represented in (A). Cells were fixed 20 min or 2 hr after the irradiation for the immunodetection of XRCC1 or 53BP1, respectively. About 50 cells per condition were analyzed. Each dot in the scatter plots represents the number of foci in a focal plane of one nucleus. The columns regroup all the values for each condition and give the mean ± SD of foci number of 50 cells. A Kruskal–Wallis test with a Bonferroni correction was performed for each counting in comparison to nonirradiated exponentially growing NHDFs.
-
Figure 3—figure supplement 5—source data 1
Number of XRCC1 foci.
- https://cdn.elifesciences.org/articles/67190/elife-67190-fig3-figsupp5-data1-v1.xlsx
-
Figure 3—figure supplement 5—source data 2
Statistics on XRCC1 foci number.
- https://cdn.elifesciences.org/articles/67190/elife-67190-fig3-figsupp5-data2-v1.pdf
-
Figure 3—figure supplement 5—source data 3
Number of 53BP1 foci.
- https://cdn.elifesciences.org/articles/67190/elife-67190-fig3-figsupp5-data3-v1.xlsx
-
Figure 3—figure supplement 5—source data 4
Statistics on 53BP1 foci number.
- https://cdn.elifesciences.org/articles/67190/elife-67190-fig3-figsupp5-data4-v1.pdf
Figure 3—figure supplement 6
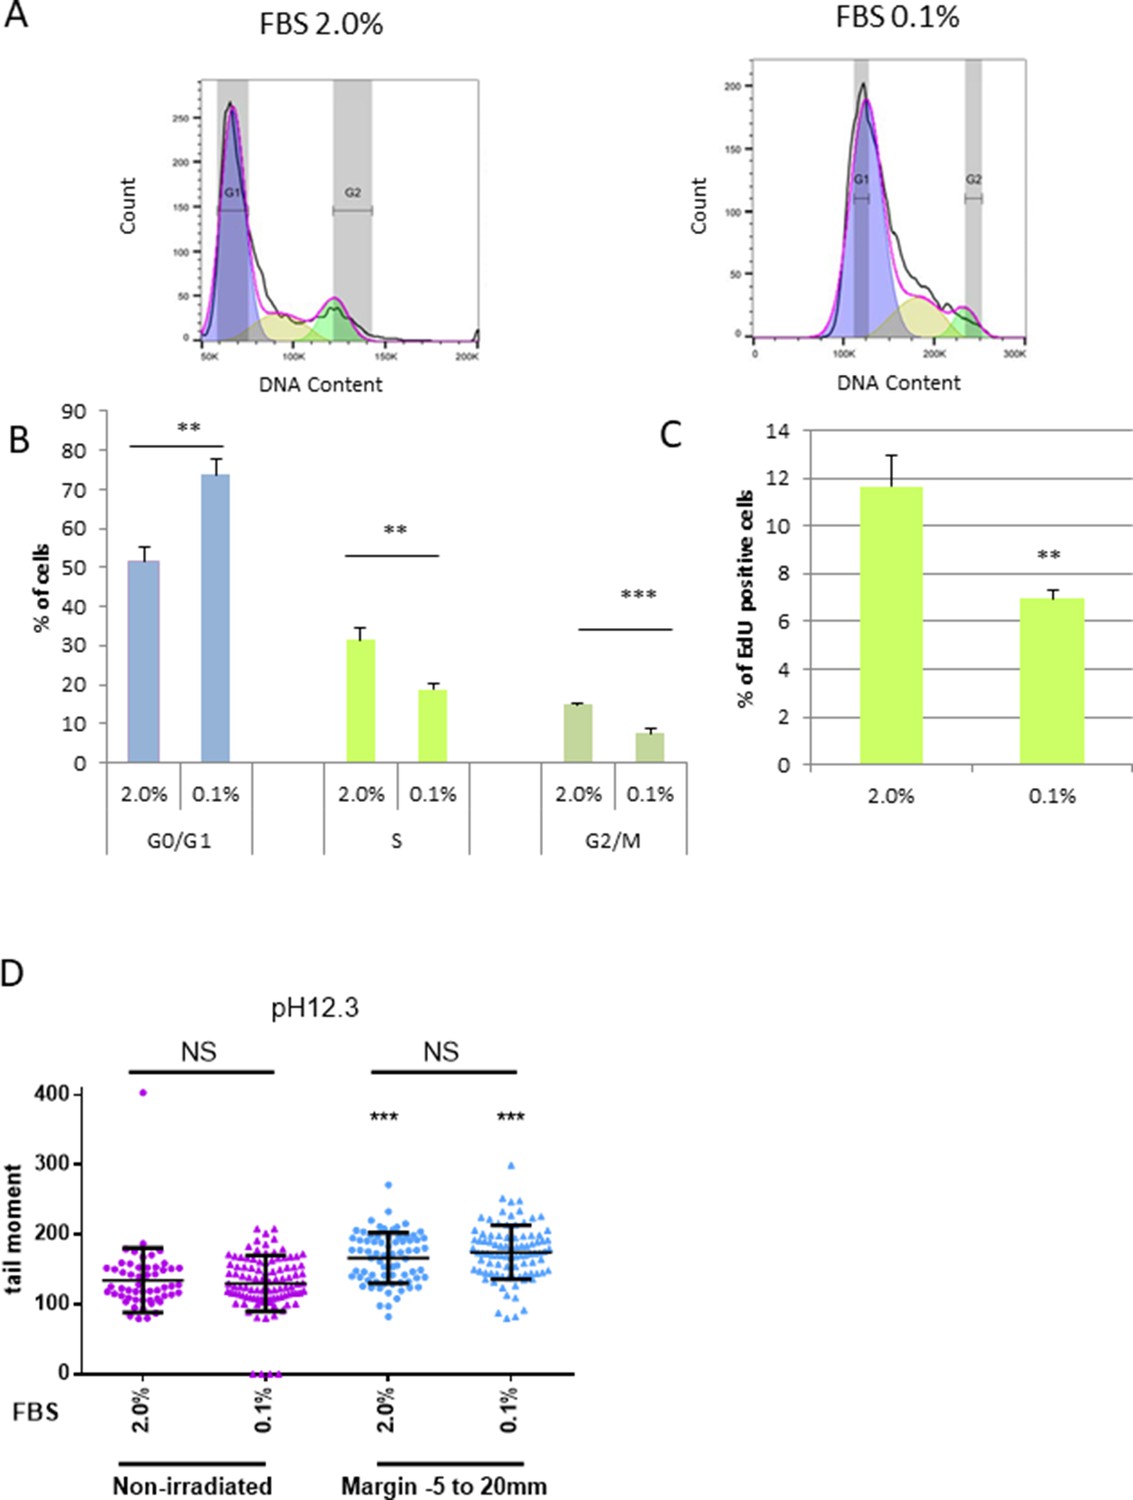
The proliferating versus quiescent status of normal human dermal fibroblasts (NHDFs) does not interfere with the generation of single-strand breaks (SSBs).
NHDFs’ (F6MC1, population doubling [PD] = 27.8) proliferation was slowed down by starvation in 0.1% fetal bovine serum (FBS) instead of the normal 2% FBS concentration. (A) Cell cycle analysis performed after 48 hr of starvation by flow cytometry. The shown histograms are representative of three independent experiments. (B) Bar chart representing the dispersion of cells in the different cell cycle phases. This analysis is based on the DNA content measurements by flow cytometry of three independent samples. (C) Bar chart representing the percentage of EdU-positive cells. (D) Proliferating and starved NHDFs cultured in 12-well plates were positioned at the margin of a planning target volume (PTV) irradiated or not at 2 Gy daily (20 MV) for 5 days. After the last radiation fraction, cells were put at 10°C for 30 min and processed for comet assays at pH 12.3. The tail moment was analyzed in about 50 cells per condition. Each dot in the scatter plots represents the value of the tail moment of one cell. The columns regroup all the values for each condition and give the mean ± SD of tail moment values. A Kruskal–Wallis test with a Bonferroni correction was performed for each counting in comparison to nonirradiated exponentially growing NHDFs or in comparison to cells cultured in 2% FBS.
-
Figure 3—figure supplement 6—source data 1
Quantification of cells in the different phases of the cell cycle.
- https://cdn.elifesciences.org/articles/67190/elife-67190-fig3-figsupp6-data1-v1.xlsx
-
Figure 3—figure supplement 6—source data 2
Comet assays.
- https://cdn.elifesciences.org/articles/67190/elife-67190-fig3-figsupp6-data2-v1.xlsx
Figure 4 with 1 supplement
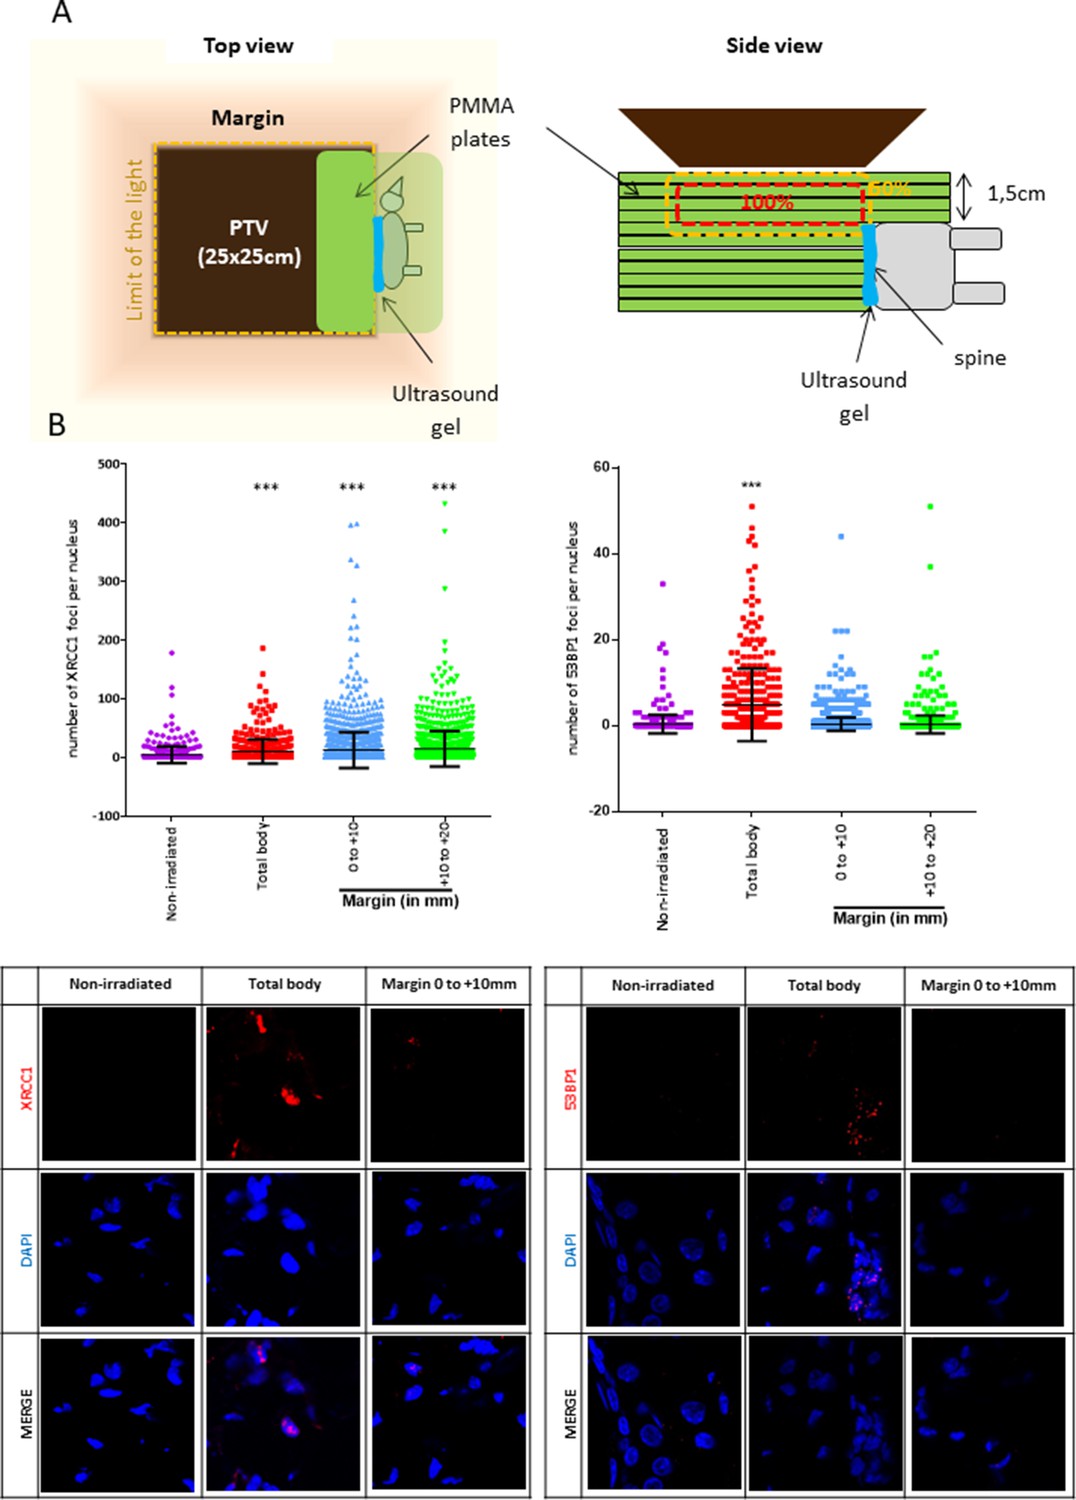
Mice positioned at the margin of a phantom mimicking a planning target volume (PTV) irradiated once at 2 Gy have a significant increase of XRCC1 foci.
(A) Schematic representation of how mice were positioned at the margin of a phantom. (B) Six mice (three females and three males) were irradiated as in (A), one mouse was irradiated positioned inside the PTV (positive control designed as ‘total body’) and four mice (two females and two males) were not irradiated but manipulated as the others. Mice were sacrificed 1 hr after irradiation. Skin samples at different distances from the isodose 50 (the spine), established as the zero, were dissected and fixed for the immunodetection of XRCC1 and 53BP1. XRCC1 and 53BP1 foci of dermal cells were quantified by confocal microscopy. One skin sample per distance and per mice was used. Inside each sample, about 200 cells were analyzed. Each dot in the scatter plots represents the number of XRCC1 or 53BP1 foci of one dermal cell. The columns regroup all the values for each condition and give the mean ± SD of foci number values. A Kruskal–Wallis test with a Bonferroni correction was performed for each counting in comparison to nonirradiated mice. The lower panel shows representative fluorescent microscopic images of XRCC1 or 53BP1 foci in red and nucleus stained by DAPI in blue.
-
Figure 4—source data 1
Number of XRCC1 foci.
- https://cdn.elifesciences.org/articles/67190/elife-67190-fig4-data1-v1.xlsx
-
Figure 4—source data 2
Statistics on XRCC1 foci numbers.
- https://cdn.elifesciences.org/articles/67190/elife-67190-fig4-data2-v1.pdf
-
Figure 4—source data 3
Number of 53BP1 foci.
- https://cdn.elifesciences.org/articles/67190/elife-67190-fig4-data3-v1.xlsx
-
Figure 4—source data 4
Statistics on 53BP1 foci numbers.
- https://cdn.elifesciences.org/articles/67190/elife-67190-fig4-data4-v1.pdf
Figure 4—figure supplement 1
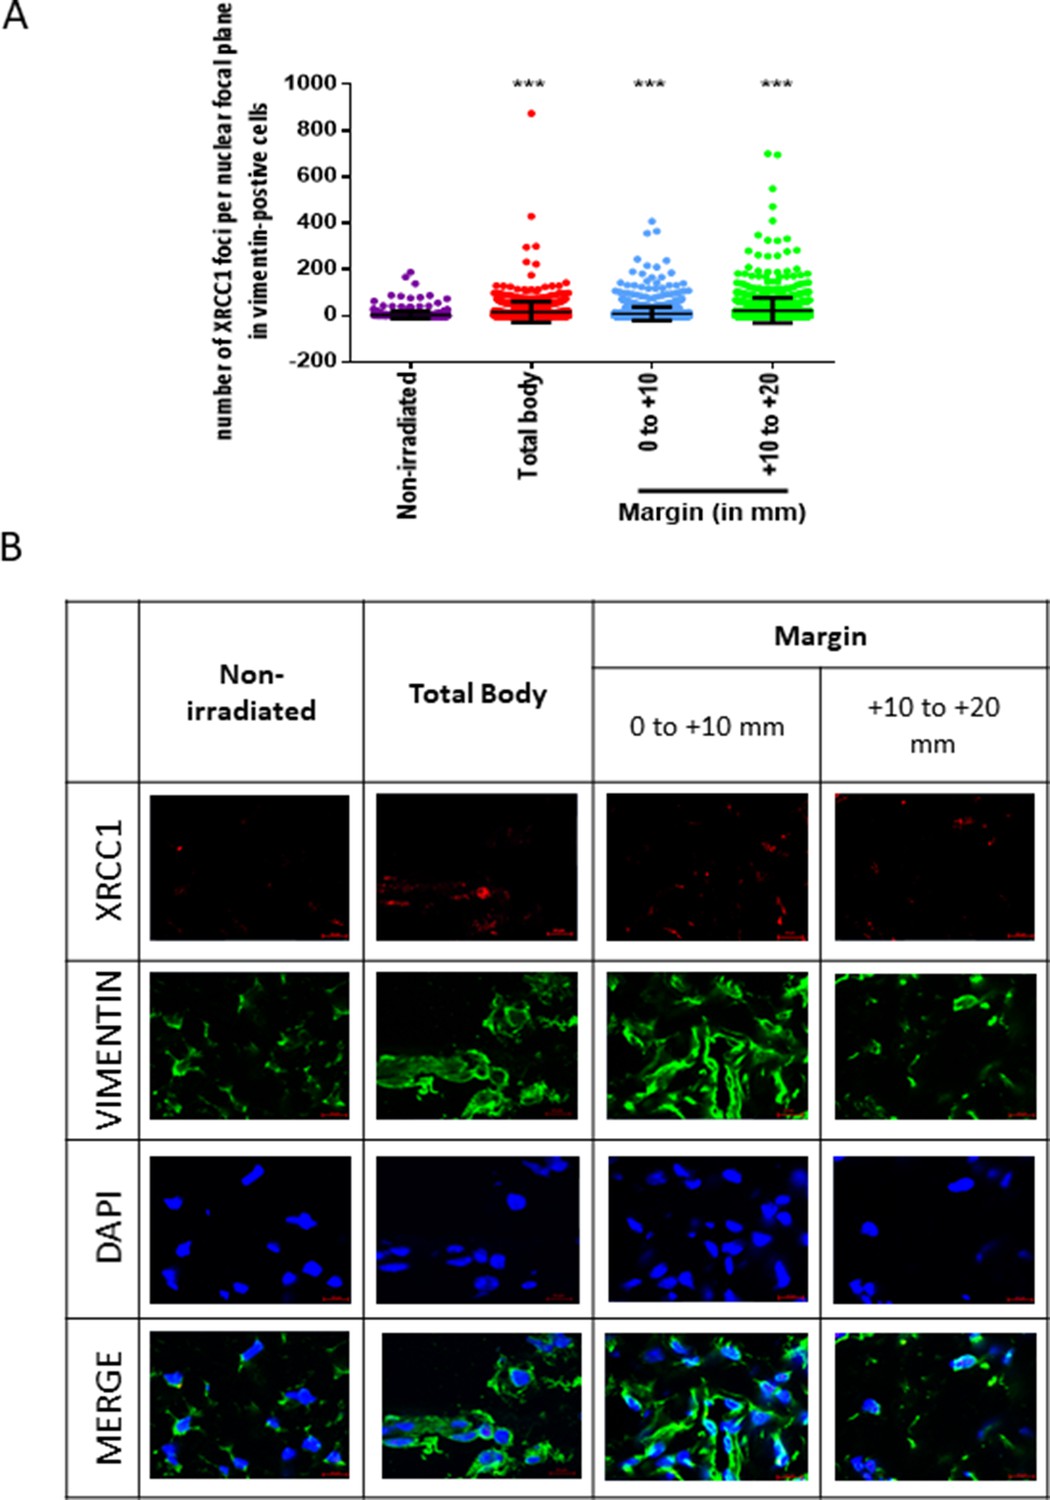
Mice positioned at the margin of a phantom mimicking a planning target volume (PTV) irradiated once at 2 Gy have a significant increase of XRCC1 foci in dermal fibroblasts.
(A) Mice irradiated as in Figure 4 were sacrificed 1 hr after irradiation. Skin samples at different distances from the isodose 50 (the spine), established as the zero, were dissected and immediately frozen for the further co-immunodetection of XRCC1 and vimentin. XRCC1 foci of dermal cells that are positive for vimentin were quantified by confocal microscopy. About 600 vimentin-positive cells per condition were analyzed. Each dot in the scatter plots represents the number of XRCC1 foci in the nuclear focal plane of one vimentin-positive cell. The columns regroup all the values for each condition and give the mean ± SD of foci number values. A Kruskal–Wallis test with a Bonferroni correction was performed for each counting in comparison to nonirradiated mice. (B) Representative fluorescent microscopic images of XRCC1 foci in red, vimentin in green, and nucleus stained by DAPI in blue.
-
Figure 4—figure supplement 1—source data 1
Quantification of XRCC1 foci.
- https://cdn.elifesciences.org/articles/67190/elife-67190-fig4-figsupp1-data1-v1.xlsx
-
Figure 4—figure supplement 1—source data 2
Statistics on the quantification of XRCC1 foci.
- https://cdn.elifesciences.org/articles/67190/elife-67190-fig4-figsupp1-data2-v1.pdf
Figure 5 with 3 supplements
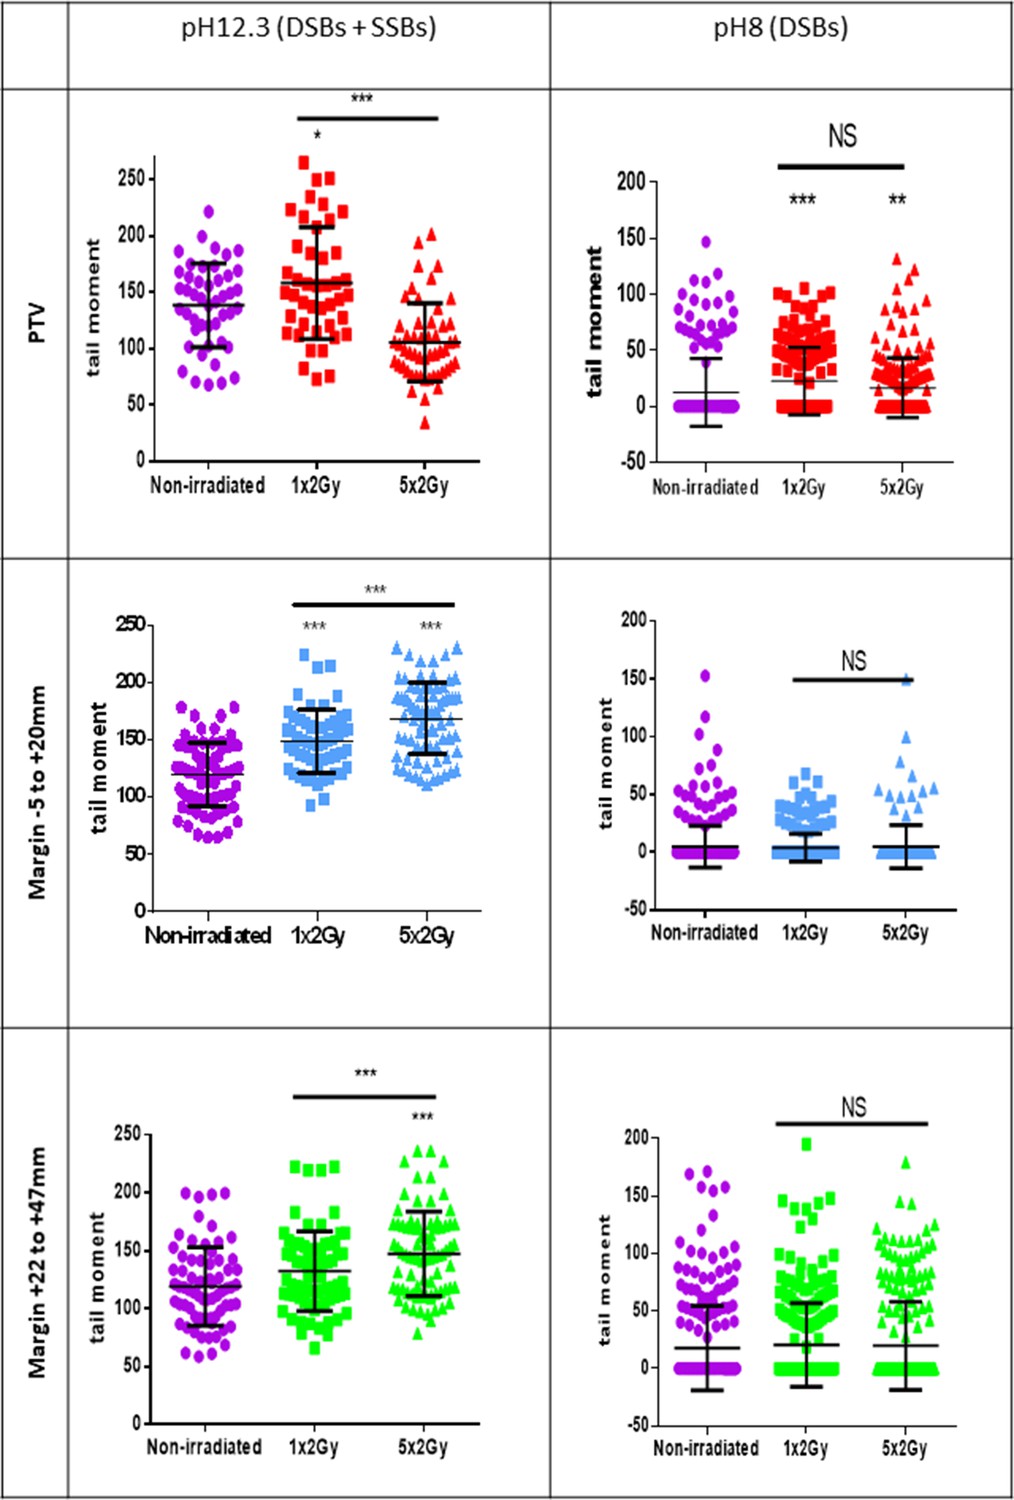
Single-strand breaks (SSBs) accumulate with successive irradiations in normal human dermal fibroblasts (NHDFs) positioned at the margin of a planning target volume (PTV) receiving 2 Gy/day.
Proliferating NHDFs (donor F6MC1, population doubling [PD] = 22.67) cultured in 12-well plates were irradiated or not only one time at 2 Gy or during 5 days at 2 Gy daily. Just after the last radiation fraction, cells were put at 10°C for 30 min and then processed for comet assays. About 150 cells per condition were analyzed. Each dot in the scatter plots represents the value of the tail moments of one cell. The columns regroup all the values for each condition and give the mean ± SD of tail moment values. A Kruskal–Wallis test with a Bonferroni correction was performed for each counting in comparison to nonirradiated exponentially growing NHDFs or between cells irradiated one or five times.
-
Figure 5—source data 1
Comet assays at pH 8 for the planning target volume (PTV).
- https://cdn.elifesciences.org/articles/67190/elife-67190-fig5-data1-v1.xlsx
-
Figure 5—source data 2
Statistics on comet assays at pH 8.
- https://cdn.elifesciences.org/articles/67190/elife-67190-fig5-data2-v1.pdf
-
Figure 5—source data 3
Statistics on comet assays at pH 12.3.
- https://cdn.elifesciences.org/articles/67190/elife-67190-fig5-data3-v1.pdf
-
Figure 5—source data 4
Comet assays at pH 8 for the margin –5 + 20.
- https://cdn.elifesciences.org/articles/67190/elife-67190-fig5-data4-v1.xlsx
-
Figure 5—source data 5
Comet assays at pH 8 for the margin +22 + 47.
- https://cdn.elifesciences.org/articles/67190/elife-67190-fig5-data5-v1.xlsx
-
Figure 5—source data 6
Comet assays at pH 12.3 for the planning target volume (PTV).
- https://cdn.elifesciences.org/articles/67190/elife-67190-fig5-data6-v1.xlsx
-
Figure 5—source data 7
Comet assays at pH 12.3 for the margin –5 + 20.
- https://cdn.elifesciences.org/articles/67190/elife-67190-fig5-data7-v1.xlsx
-
Figure 5—source data 8
Comet assays for the margin +22 + 47.
- https://cdn.elifesciences.org/articles/67190/elife-67190-fig5-data8-v1.xlsx
Figure 5—figure supplement 1
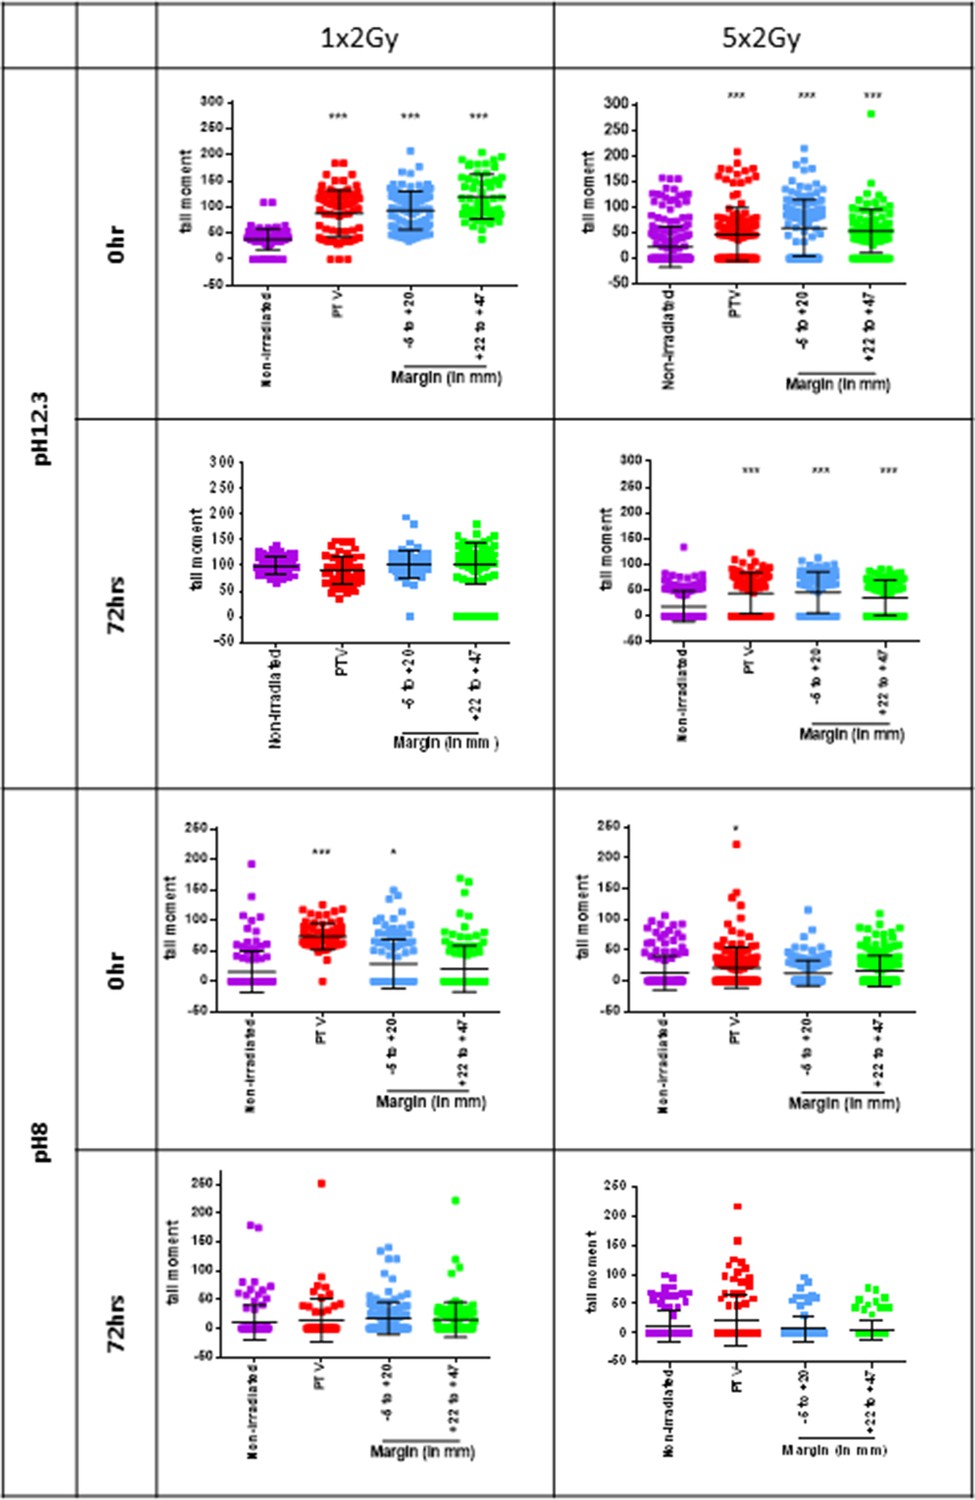
Single-strand breaks (SSBs) generated in normal human dermal fibroblasts (NHDFs) positioned at the margin of the planning target volume (PTV) are no more repaired after five successive irradiations at 2 Gy.
Proliferating NHDFs (F6MC1, population doubling [PD] = 20.3 at the beginning of the experiment) cultured in 12-well plates were irradiated at 2 Gy/day for 1 (1 × 2 Gy) or 5 days (5 × 2 Gy). After the last radiation fraction, cells were either put at 10°C for 30 min and processed for comet assays (0 hr) or put in culture at 37°C and processed for comet assays 72 hr later (72 hr). The tail moment was analyzed in about 50 cells per condition. Each dot in the scatter plots represents the value of the tail moment of one cell. The columns regroup all the values for each condition and give the mean ± SD of tail moment values. A Kruskal–Wallis test with a Bonferroni correction was performed for each counting in comparison to nonirradiated exponentially growing NHDFs.
-
Figure 5—figure supplement 1—source data 1
Comet assays pH 12.3.
- https://cdn.elifesciences.org/articles/67190/elife-67190-fig5-figsupp1-data1-v1.xlsx
-
Figure 5—figure supplement 1—source data 2
Statistics on comet assays pH 12.3.
- https://cdn.elifesciences.org/articles/67190/elife-67190-fig5-figsupp1-data2-v1.pdf
-
Figure 5—figure supplement 1—source data 3
Comet assays pH 8.
- https://cdn.elifesciences.org/articles/67190/elife-67190-fig5-figsupp1-data3-v1.xlsx
-
Figure 5—figure supplement 1—source data 4
Statitstics on comet assays pH 8.
- https://cdn.elifesciences.org/articles/67190/elife-67190-fig5-figsupp1-data4-v1.pdf
Figure 5—figure supplement 2
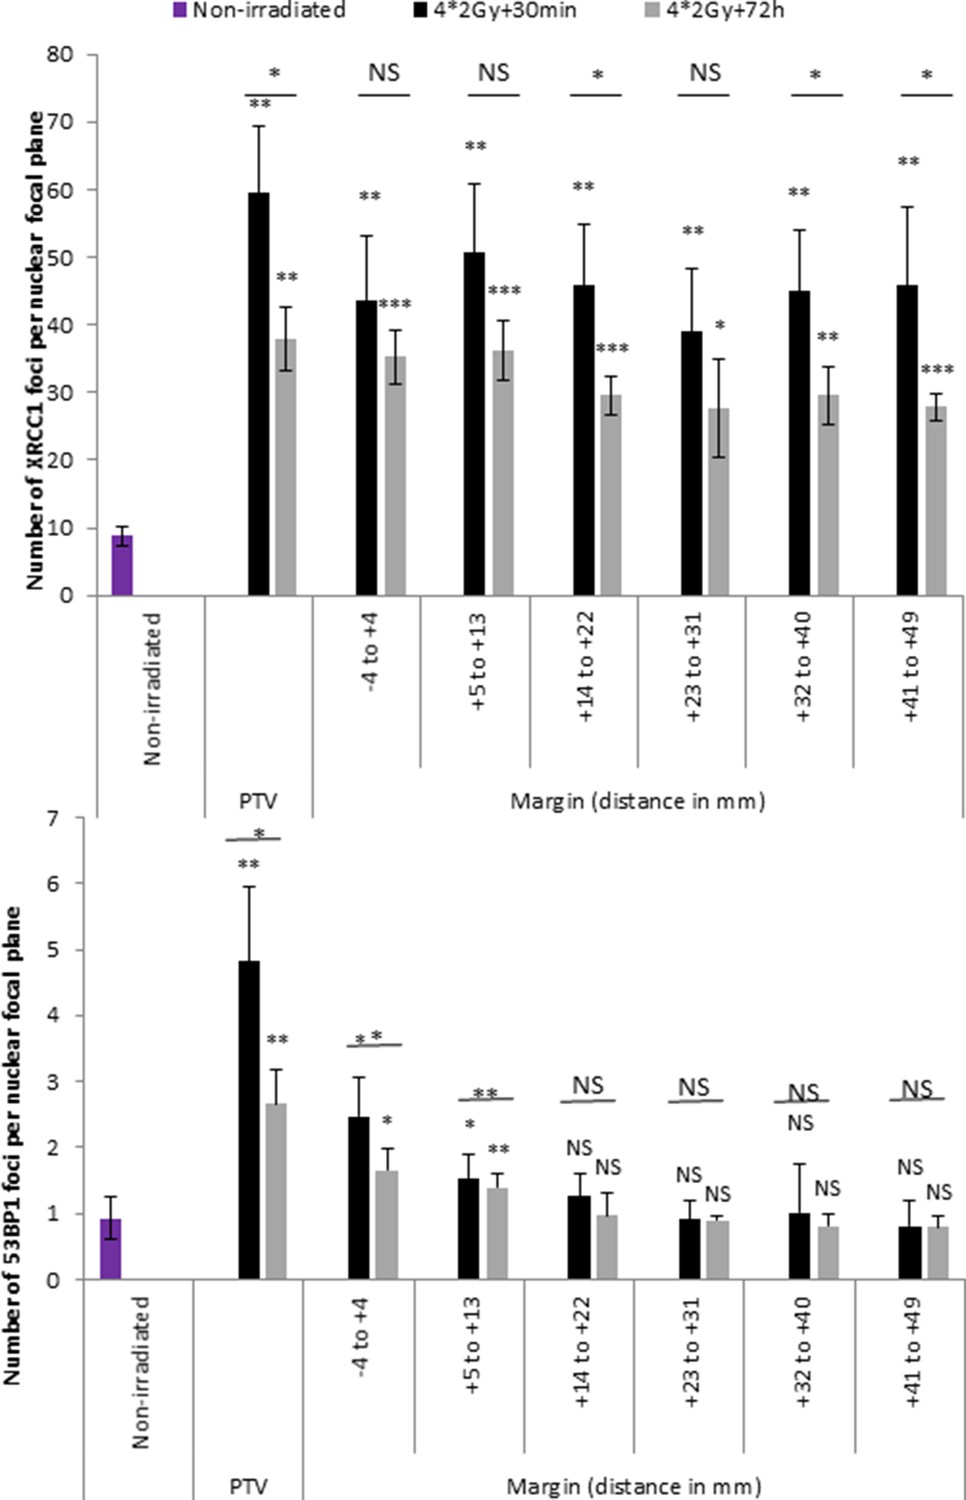
The repair of single-strand breaks (SSBs) generated in normal human dermal fibroblasts (NHDFs) positioned at the margin of the planning target volume (PTV) becomes poorly efficient after four successive irradiations at 2 Gy.
Proliferating NHDFs (F6MC1, population doubling [PD] = 19) cultured in 96-well plates were irradiated at 2 Gy/day for 4 days (4 × 2 Gy). Then, they were fixed at indicated time and an immunodetection of XRCC1 (upper panels) or 53BP1 (bottom panels) foci was performed as in Figure 3A. The results were analyzed by high-content microscopy. The bar chart represents the mean number ± SD of foci per nuclear focal plane of 100 cells taken in all wells of a column. An ANOVA with a Bonferroni correction was performed for each condition in comparison to nonirradiated exponentially growing NHDFs. t-tests were performed to compare the number of foci 72 hr versus 30 min post-irradiation.
-
Figure 5—figure supplement 2—source data 1
Quantification of XRCC1 foci.
- https://cdn.elifesciences.org/articles/67190/elife-67190-fig5-figsupp2-data1-v1.xlsx
-
Figure 5—figure supplement 2—source data 2
Quantification of 53BP1 foci.
- https://cdn.elifesciences.org/articles/67190/elife-67190-fig5-figsupp2-data2-v1.xlsx
Figure 5—figure supplement 3
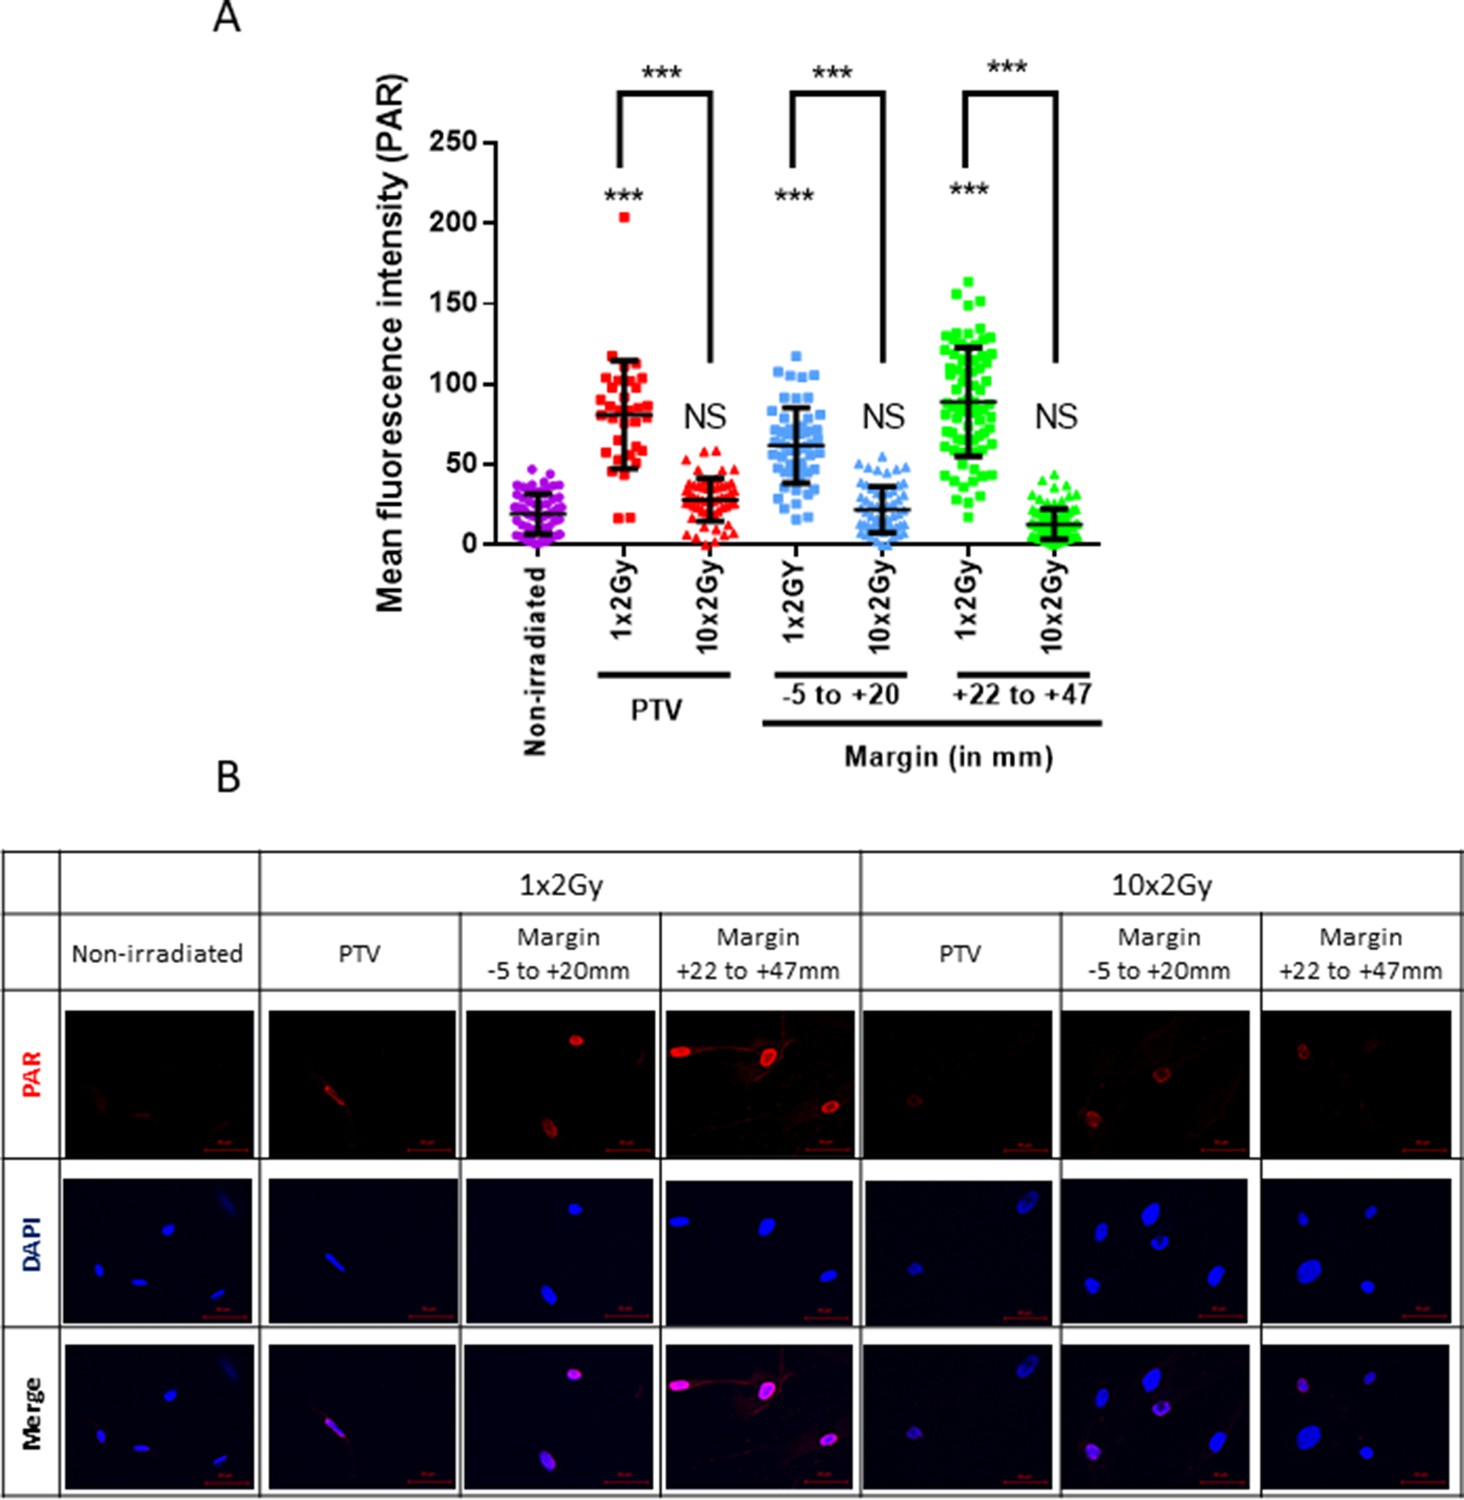
The PARylation capacity decreases with successive irradiations.
(A) Analysis of the PARylation capacity in normal human dermal fibroblasts (NHDFs) (F6MC1, population doubling [PD] = 32.4 at the beginning of the experiment) positioned at the margin or inside a planning target volume (PTV) irradiated or not for 1 or 10 days at 2 Gy/day. PAR chain detection was made by immunofluorescence after challenging cells of all conditions by 100 µM hydrogen peroxide for 10 min at room temperature followed by a recovery at 37°C for 3 min in fresh medium. The bar chart represents the mean ± SD of fluorescence intensity per cell in 100 cells. An ANOVA with a Bonferroni correction was performed for each condition in comparison to nonirradiated exponentially growing NHDFs. t-tests were performed to compare the fluorescence intensity after 10 × 2 Gy versus 1 × 2 Gy. (B) Representative fluorescent microscopic images of the PAR chain immunostaining. Scale bar = 50 µm.
-
Figure 5—figure supplement 3—source data 1
Quantification of PAR foci.
- https://cdn.elifesciences.org/articles/67190/elife-67190-fig5-figsupp3-data1-v1.xlsx
-
Figure 5—figure supplement 3—source data 2
Statistics on quantification of PAR foci.
- https://cdn.elifesciences.org/articles/67190/elife-67190-fig5-figsupp3-data2-v1.pdf
Figure 6 with 2 supplements
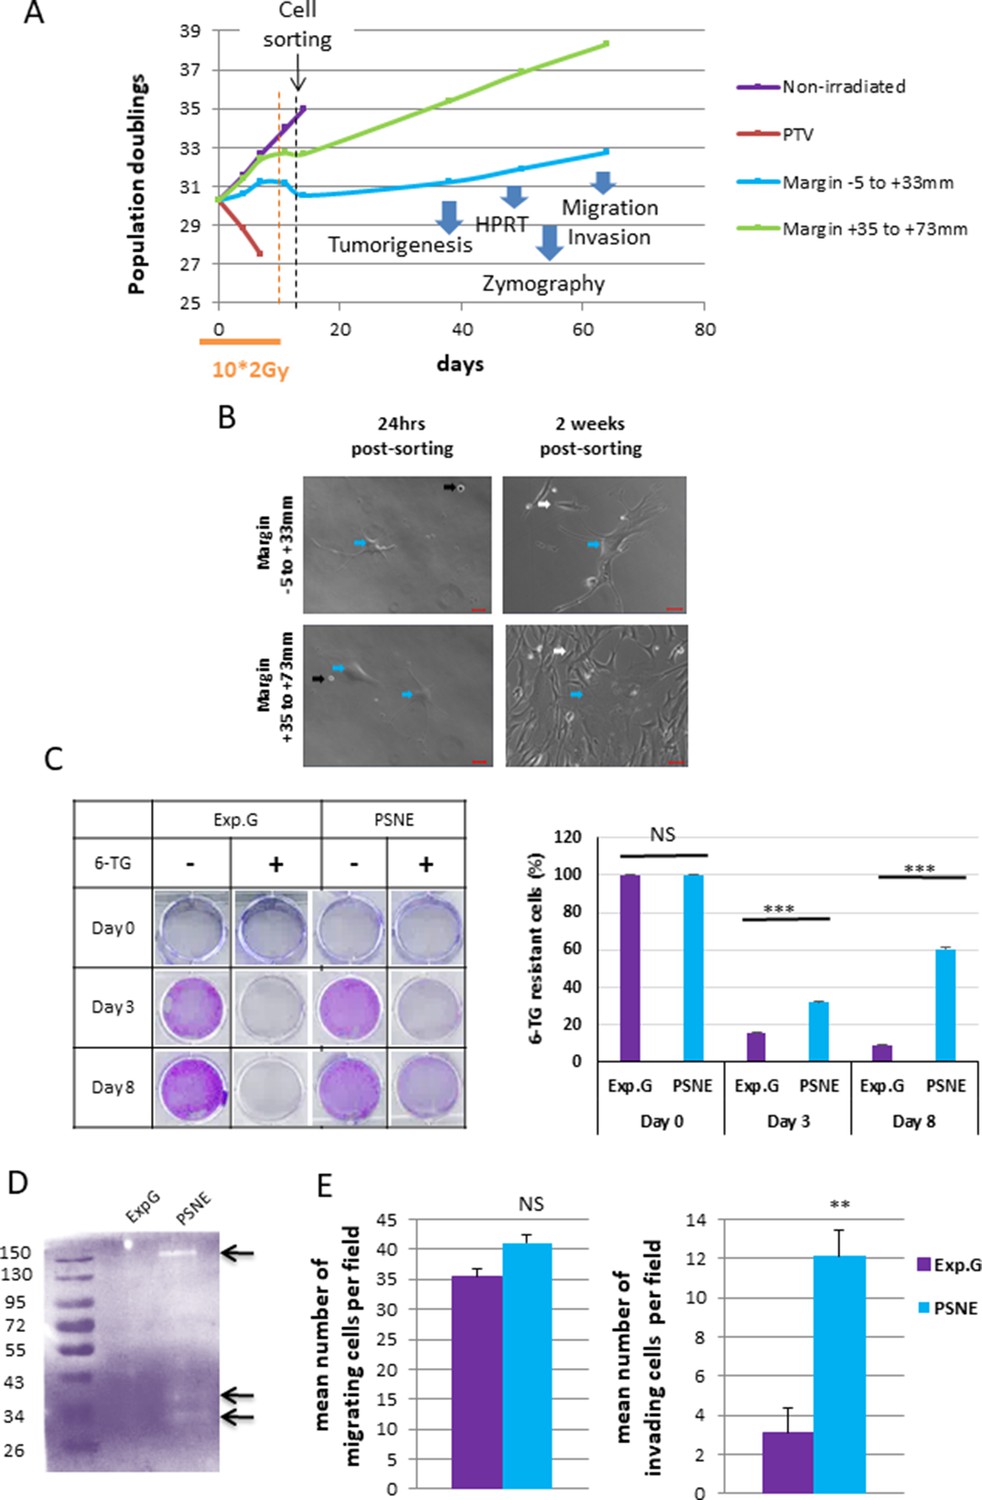
Some radio-induced senescent cells generated in the margin escape from senescence to generate a progeny of cells that reproliferate, have an increased invasion capacity, and display mutations.
(A) Normal human dermal fibroblasts (NHDFs) (donor F6MC1, population doubling [PD] = 29.6 at the beginning of the experiment) positioned straddling the planning target volume (PTV) and the margin were irradiated or not during 2 weeks (10 * 2 Gy). Cells were counted at each passage using a Malassez chamber. After 2 weeks of irradiation, the senescent cells generated in the margin were sorted according to their size, granularity, and SA-β-Gal activity (see parameters of sorting in Figure 6—figure supplement 1). After sorting, cells were put again in culture and followed at long term. (B) Phase-contrast microscopic images of cells of the margin 24 hr and 2 weeks post-sorting. The blue arrows indicate cells with a senescent morphology. The black arrows indicate cells that have not replated. The white arrows indicate small reproliferating cells. (C) Hypoxanthine Phosphorybosyl Transferase (HPRT) assays performed on cells having regrown from sorted senescent cells generated in the margin referred to as post-senescence neoplastic emerging (PSNE) cells and on nonirradiated exponentially growing NHDFs at 17 PDs (used as control for normal cells). The bars indicate the mean ± SD of three measures of the percentage of 6-thioguanine (6-TG)-resistant cells. (D) Metalloproteinase (MMP) activity analysis of culture supernatant from PSNE or exponentially growing cells by 0.1% gelatin zymography. Arrows show bands of digested gelatin. (E) Migrating and invasive capacities were assayed in Boyden chambers without or with Matrigel, respectively. Cells that have passed across the filters were counted in five fields per chamber in three different chambers for each condition. Each bar represents the mean ± SD of the number of cells per field. t-tests were performed for comparing exponentially growing and PSNE cells.
-
Figure 6—source data 1
Data of growth curves.
- https://cdn.elifesciences.org/articles/67190/elife-67190-fig6-data1-v1.xlsx
-
Figure 6—source data 2
Quantification of 6-thioguanine (6-TG)-resistant cells.
- https://cdn.elifesciences.org/articles/67190/elife-67190-fig6-data2-v1.xlsx
-
Figure 6—source data 3
Zymography.
- https://cdn.elifesciences.org/articles/67190/elife-67190-fig6-data3-v1.pptx
-
Figure 6—source data 4
Quantification of cell migration and invasion.
- https://cdn.elifesciences.org/articles/67190/elife-67190-fig6-data4-v1.xlsx
Figure 6—figure supplement 1
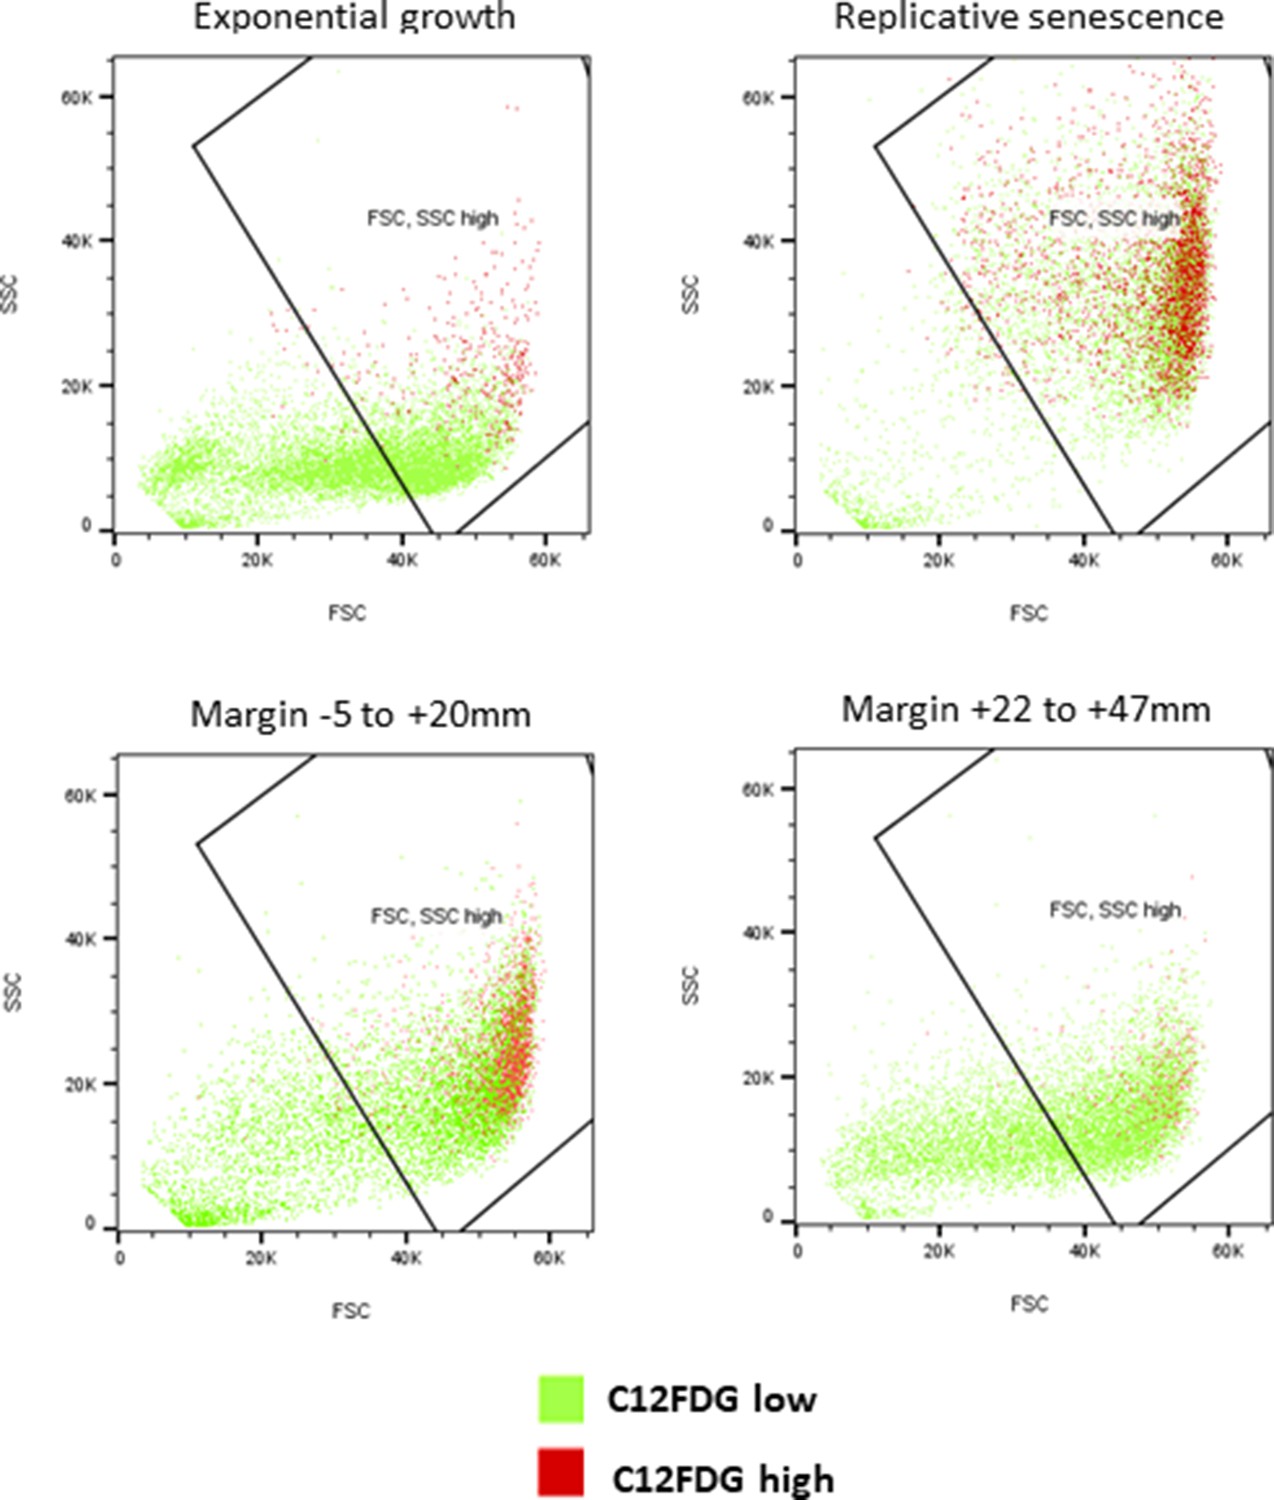
Principle of senescent cell sorting.
Dot plots showing how senescent cells were sorted in Figure 6. The time of cell sorting is indicated in Figure 6A. First, by comparing the intensity of the C12FDG staining in exponentially growing normal human dermal fibroblasts (NHDFs) versus NHDFs at replicative senescence, we set the threshold to separate the C12FDG high (red dots) and C12FDG low (green dots) cells. Then, in the C12FDG high subpopulation, we delineated the subpopulation of 50% of cells with the highest forward scatter (FSC) and side scatter (SSC values). The gate thus defined was applied to all conditions to sort the cells.
Figure 6—figure supplement 2
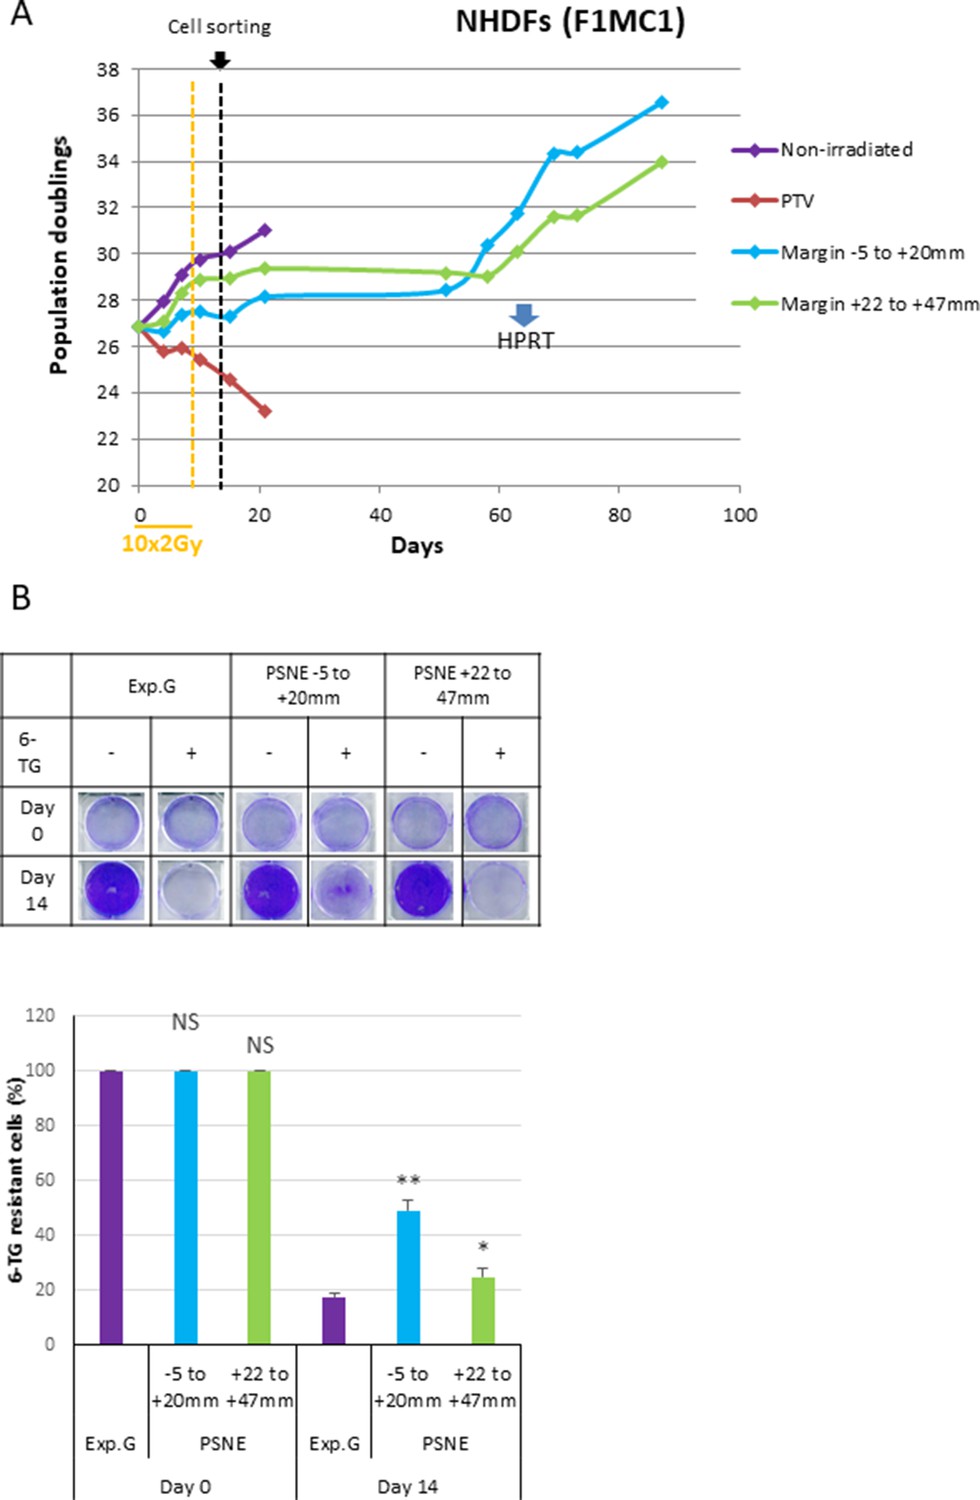
Similar experiment as in Figure 6 with normal human dermal fibroblasts (NHDFs) derived from another donor.
(A) NHDFs (donor F1MC1, population doubling [PD] = 26.83 at the beginning of the experiment) cultured in 6-well plates were irradiated or not at 2 Gy/day except weekends during 2 weeks. Cells were counted at each passage using a Malassez cell counting chamber. After 2 weeks of irradiation, the senescent cells generated in the margin were sorted according to their size, granularity, and SA-β-Gal activity. The sorted cells were put again in culture and followed at long term. (B) Hypoxanthine Phosphorybosyl Transferase (HPRT) assays performed on cells having regrown from sorted senescent cells referred to as post-senescent neoplastic emergent (PSNE) and on nonirradiated exponentially growing NHDFs at 28.01 PDs as control for normal cells. The bars indicate the mean ± SD of three measures of the percentage of 6-thioguanine (6-TG)-resistant cells. t-tests were performed for comparing exponentially growing and emerging cells.
-
Figure 6—figure supplement 2—source data 1
Growth curves.
- https://cdn.elifesciences.org/articles/67190/elife-67190-fig6-figsupp2-data1-v1.xlsx
-
Figure 6—figure supplement 2—source data 2
Quantification of 6-thioguanine (6-TG)-resistant cells.
- https://cdn.elifesciences.org/articles/67190/elife-67190-fig6-figsupp2-data2-v1.xlsx
Figure 7 with 4 supplements

A single-strand break (SSB) accumulation is enough to induce senescence and post-senescence neoplastic escape (PSNE).
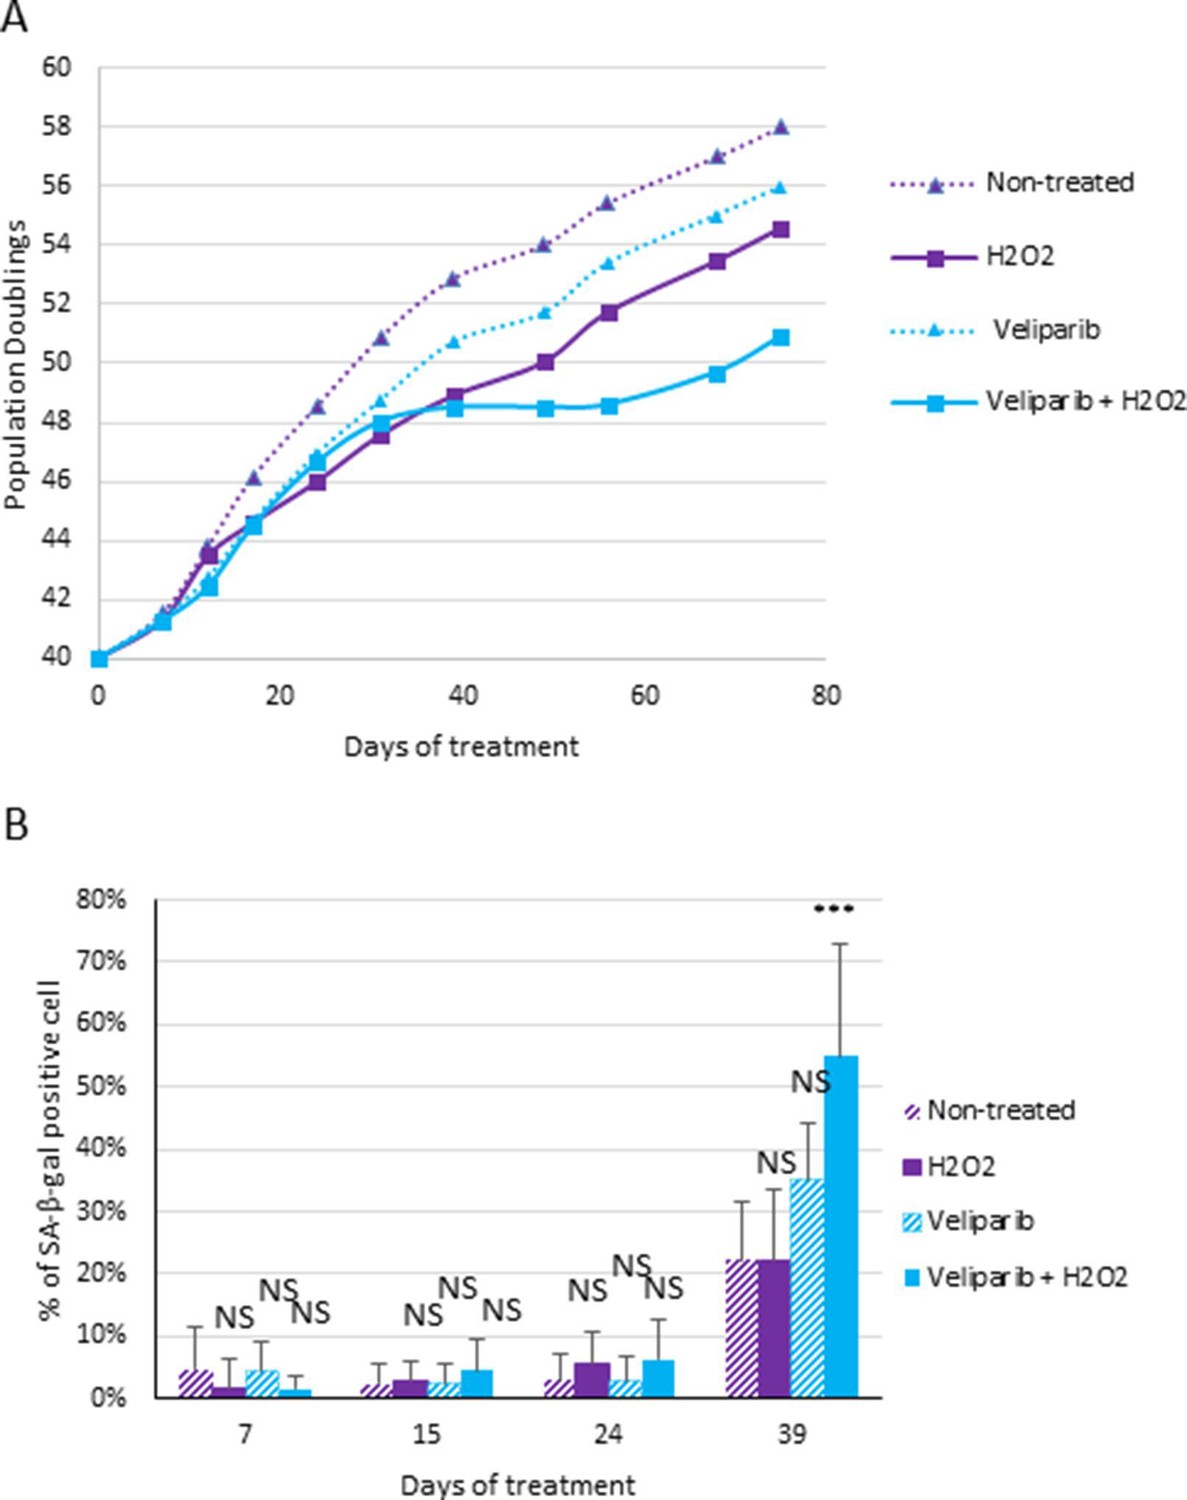
(A) Analysis of XRCC1 foci by immunofluorescence in normal human dermal fibroblasts (NHDFs) (F1MC1, population doubling [PD] = 44.07 at the beginning of the experiment) treated daily or not with veliparib at 1 µM in combination with H2O2 at 5 µM during 21 days and then with veliparib alone. Each point represents the mean number of XRCC1 foci per nuclear focal plane at indicated time of treatment from 100 cells per condition. t-tests were performed for comparing nontreated and treated cells for each time point. (B) SA-β-Gal assays. Each bar represents the mean ± SD percent of SA-β-Gal-positive cells in an X-gal assay from five independent microscopic fields. t-tests were performed for comparing nontreated and treated cells for each time point. (C) Growth curves of the same cells. (D) Representative phase-contrast microscopy images of cell morphologies. (E) Hypoxanthine Phosphorybosyl Transferase (HPRT) assays performed on PSNE cells having regrown after the senescent plateau and on nontreated exponentially growing NHDFs (Exp. Growth) at 22 PDs as control. The bars indicate the mean ± SD of three measures of the percentage of 6-thioguanine (6-TG)-resistant cells. t-tests were performed for comparing exponentially growing cells with emerging cells.
-
Figure 7—source data 1
Number of XRCC1 foci.
- https://cdn.elifesciences.org/articles/67190/elife-67190-fig7-data1-v1.xlsx
-
Figure 7—source data 2
Quantification of SA-β-Gal assays.
- https://cdn.elifesciences.org/articles/67190/elife-67190-fig7-data2-v1.xlsx
-
Figure 7—source data 3
Growth curves.
- https://cdn.elifesciences.org/articles/67190/elife-67190-fig7-data3-v1.xlsx
-
Figure 7—source data 4
Quantification of 6-thioguanine (6-TG)-resistant cells.
- https://cdn.elifesciences.org/articles/67190/elife-67190-fig7-data4-v1.xlsx
Figure 7—figure supplement 1
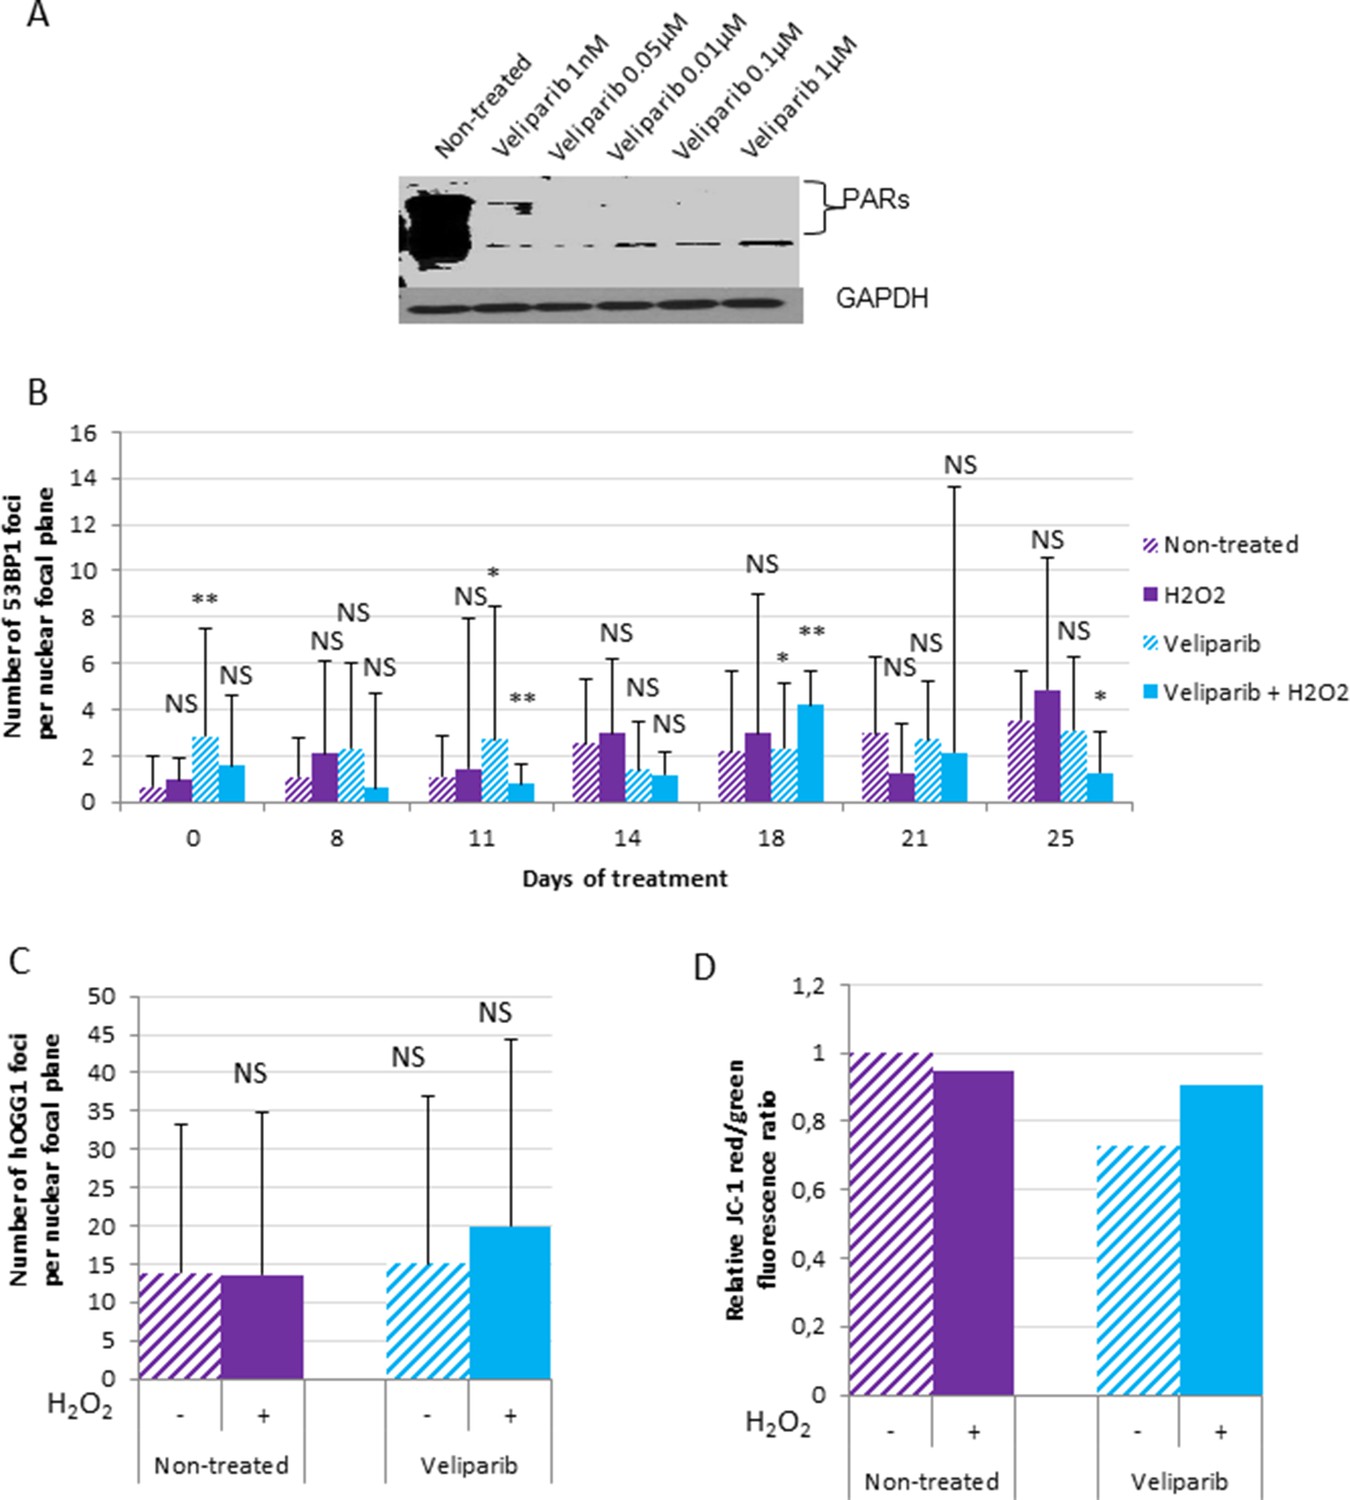
The combined poly(ADP)ribose polymerase (PARP) inhibitor + H2O2 treatment does not induce other oxidative damages than single-strand breaks (SSBs).
(A) PARylation synthesis assay in normal human dermal fibroblasts (NHDFs) (F1MC1, population doubling [PD] = 46) treated during 24 hr with different concentrations of veliparib and challenged for 10 min with 100 µM H2O2. (B) NHDFs (F1MC1, DP = 44.07 at the beginning of the experiment) were treated daily or not with veliparib + H2O2 as in Figure 7. 53BP1 foci were analyzed by immunofluorescence during the first 25 days of treatment. (C) hOGG1 foci were analyzed by immunofluorescence at day 26. The bar chart represents the mean number ± SD of foci per nuclear focal plane in 100 nuclei. t-tests were performed for comparing nontreated and treated cells for each time point. (D) The mitochondrial membrane potential was evaluated by the JC-1 dye at day 25 by flow cytometry. Each bar gives the mean of the red/green fluorescence ratio in a population of 10,000 cells normalized to the nontreated population.
-
Figure 7—figure supplement 1—source data 1
Western-blots.
- https://cdn.elifesciences.org/articles/67190/elife-67190-fig7-figsupp1-data1-v1.pptx
-
Figure 7—figure supplement 1—source data 2
Quantification of 53BP1 foci.
- https://cdn.elifesciences.org/articles/67190/elife-67190-fig7-figsupp1-data2-v1.xlsx
-
Figure 7—figure supplement 1—source data 3
Quantification of hOGG1 foci.
- https://cdn.elifesciences.org/articles/67190/elife-67190-fig7-figsupp1-data3-v1.xlsx
-
Figure 7—figure supplement 1—source data 4
Quantification of red on green fluorescence.
- https://cdn.elifesciences.org/articles/67190/elife-67190-fig7-figsupp1-data4-v1.xlsx
Figure 7—figure supplement 2
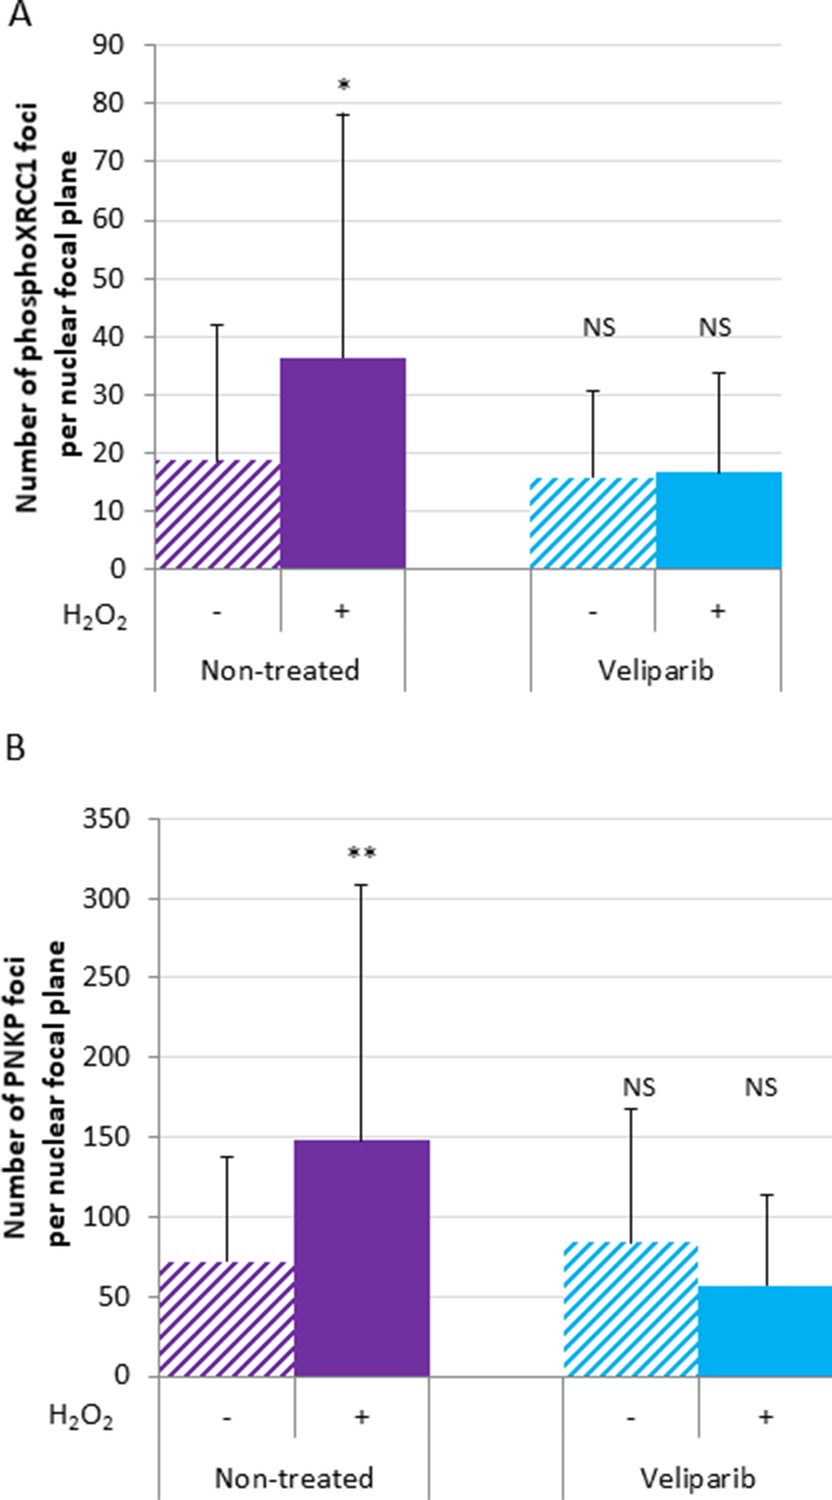
The repair of single-strand breaks (SSBs) is blocked during a veliparib + H2O2 treatment.
Normal human dermal fibroblasts (NHDFs) (F1MC1, population doubling [PD] = 44.07 at the beginning of the experiment) were treated daily or not with veliparib + H2O2 as in Figure 7. phosphoXRCC1 (A) and polynucleotide kinase phosphatase (PNKP) (B) foci were analyzed by immunofluorescence at day 26. The bar chart represents the mean number ± SD of foci per nuclear focal plane in 100 nuclei. t-tests were performed for comparing nontreated and treated cells for each time point.
-
Figure 7—figure supplement 2—source data 1
Quantification of phosphoXRCC1 foci.
- https://cdn.elifesciences.org/articles/67190/elife-67190-fig7-figsupp2-data1-v1.xlsx
-
Figure 7—figure supplement 2—source data 2
Quantification of polynucleotide kinase phosphatase (PNKP) foci.
- https://cdn.elifesciences.org/articles/67190/elife-67190-fig7-figsupp2-data2-v1.xlsx
Figure 7—figure supplement 3
Same experiment as in Figure 7 with another normal human dermal fibroblast (NHDF) donor.
NHDFs (F6MC1, population doubling [PD] = 40.04 at the beginning of the experiment) were submitted daily to the combined veliparib +H2O2 treatment as in Figure 6 for 31 days. Then, the H2O2 treatment was stopped but the veliparib treatment maintained up to day 75. (A) Growth curves. (B) SA-β-Gal assays (using the X-Gal substrate). SA-β-Gal-positive cells were counted amongst about 250 cells per condition. t-tests were performed for comparing nontreated and treated cells for each time point.
-
Figure 7—figure supplement 3—source data 1
Growth curves.
- https://cdn.elifesciences.org/articles/67190/elife-67190-fig7-figsupp3-data1-v1.xlsx
-
Figure 7—figure supplement 3—source data 2
Quantification of SA-β-Gal assays.
- https://cdn.elifesciences.org/articles/67190/elife-67190-fig7-figsupp3-data2-v1.xlsx
Figure 7—figure supplement 4
The combined poly(ADP)ribose polymerase (PARP) inhibitor + H2O2 treatment induces a panel of senescence markers.
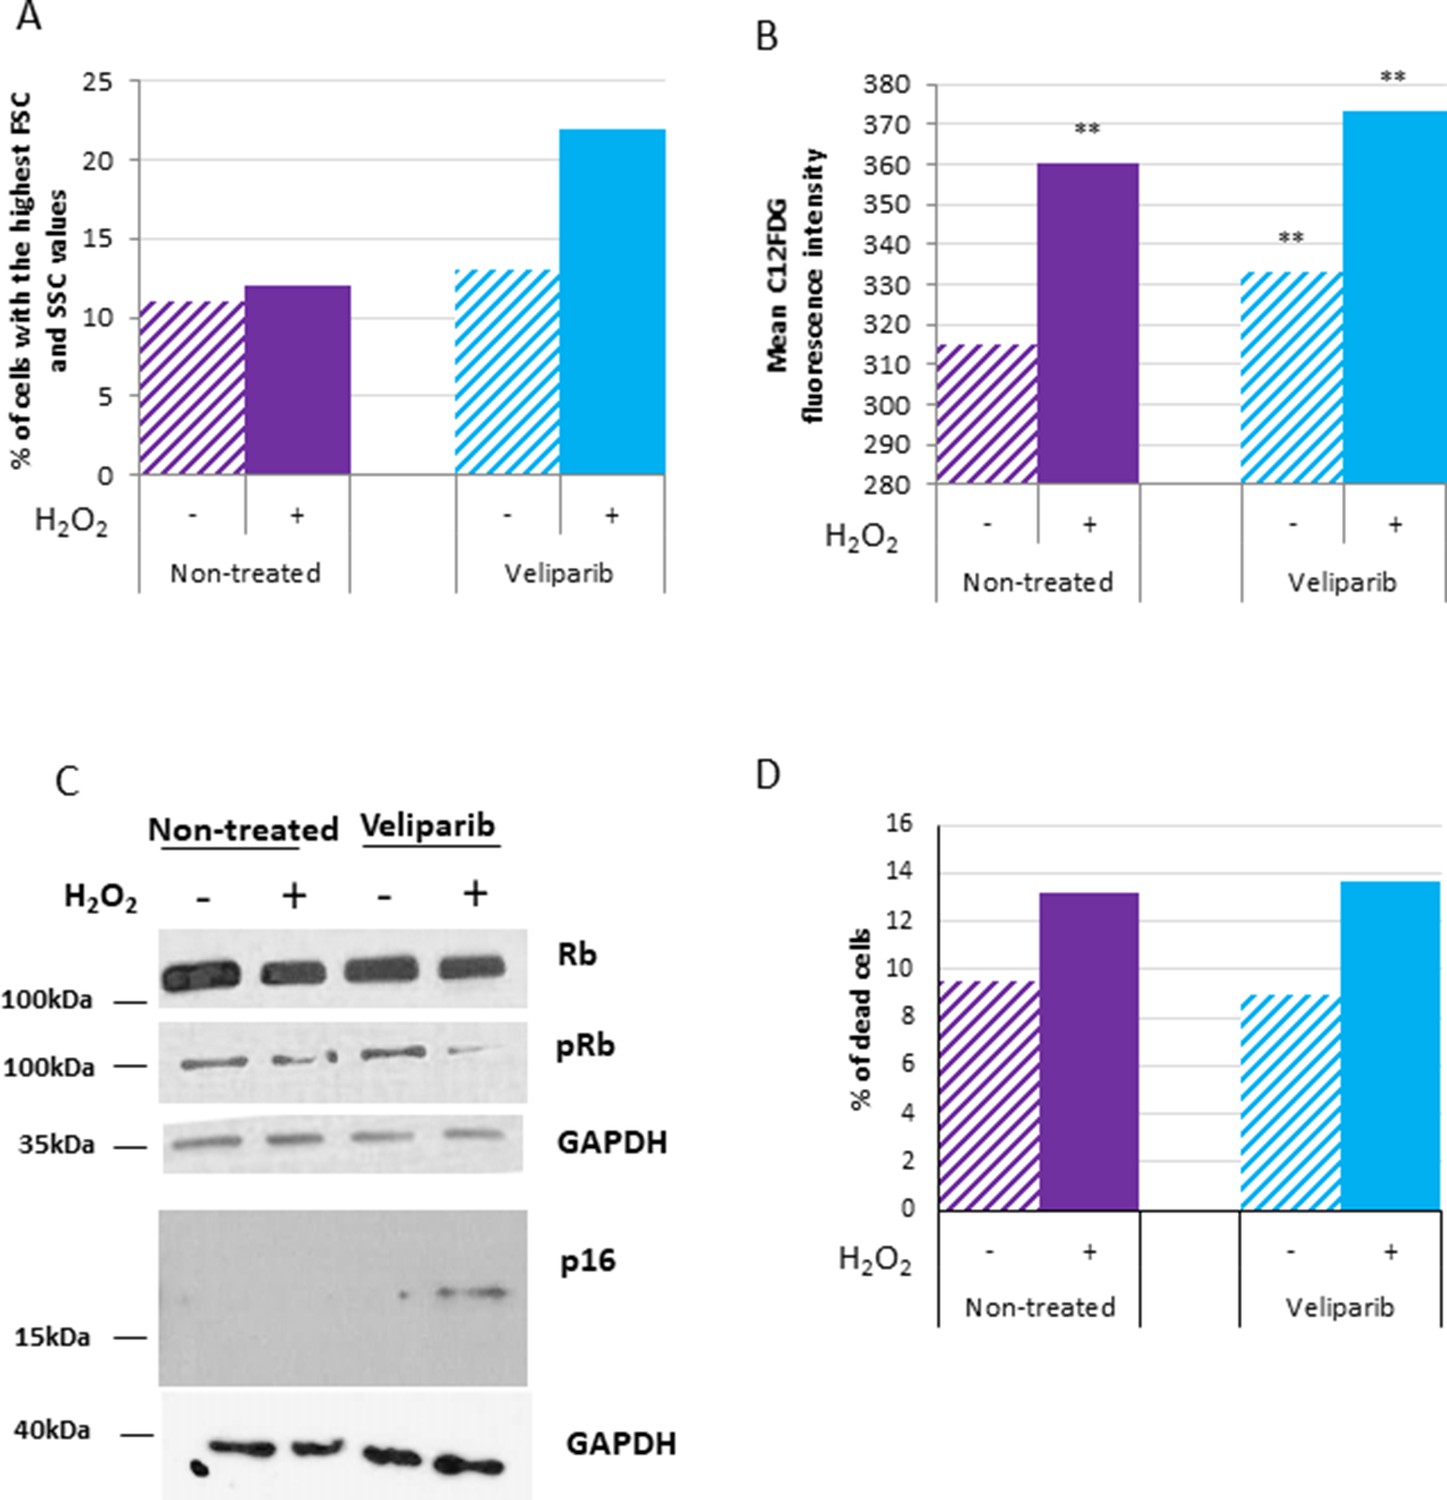
Normal human dermal fibroblasts (NHDFs) (F1MC1, population doubling [PD] = 40.01 at the beginning of the experiment) were treated daily or not with veliparib + H2O2 as in Figure 6. (A) At day 25, cell morphologies were analyzed by flow cytometry. The bar chart reports the percentage of cells with high forward scatter (FSC) and side scatter (SSC) values among 10,000 cells. (B) SA-β-Gal activity evaluated at day 25 by flow cytometry using the C12FDG fluorescent substrate. The bar chart reports the mean C12FDG fluorescence intensity of 10,000 cells. A chi-square test was done to compare the fluorescence intensity of each of the 10,000 irradiated or senescent NHDFs to nonirradiated NHDFs. (C) Western blot analysis of Rb, phospho-Rb (pRb), p16, and GAPDH (loading control) protein levels after 25 days of treatment. (D) Level of cell death measured at day 20 by flow cytometry using the Annexin V/propidium iodide (PI) assay. The indicated percentage of dead cells regroups Annexin V and/or PI-positive cells.
-
Figure 7—figure supplement 4—source data 1
Values of C12FDG fluorescence intensity.
- https://cdn.elifesciences.org/articles/67190/elife-67190-fig7-figsupp4-data1-v1.xlsx
-
Figure 7—figure supplement 4—source data 2
Western blots.
- https://cdn.elifesciences.org/articles/67190/elife-67190-fig7-figsupp4-data2-v1.pptx
-
Figure 7—figure supplement 4—source data 3
Results of Annexin V/propidium iodide assays.
- https://cdn.elifesciences.org/articles/67190/elife-67190-fig7-figsupp4-data3-v1.xlsx
Author response image 1
Tables
Author response table 1
| Non-irradiated | PTV | Margin (-5 to +20mm) | Margin (+22 to +47mm) | |
|---|---|---|---|---|
| Mean | 2.34 | 7.49 | 2.96 | 3.45 |
| Fold change between PTV and margin | 2.53 | 2.17 |
Additional files
Download links
A two-part list of links to download the article, or parts of the article, in various formats.
Downloads (link to download the article as PDF)
Open citations (links to open the citations from this article in various online reference manager services)
Cite this article (links to download the citations from this article in formats compatible with various reference manager tools)
The out-of-field dose in radiation therapy induces delayed tumorigenesis by senescence evasion
eLife 11:e67190.
https://doi.org/10.7554/eLife.67190


