IGF-1 facilitates extinction of conditioned fear
- Departamento de Anatomía, Histología y Neurociencia, Facultad de Medicina, Universidad Autónoma de Madrid, Spain
- Departamento de Ciencias Médicas Básicas (Fisiología) and Instituto de Tecnologías Biomédicas (ITB), Universidad de La Laguna, Spain
- Department of Neuroscience, University of Minnesota, United States
- Centro de Investigación Biomédica en Red Sobre Enfermedades Neurodegenerativas (CIBERNED), Instituto Universitario de Investigación Neuroquímica (IUIN), Instituto Ramón y Cajal de Investigación Sanitaria (IRYCIS) and Departamento de Bioquímica y Biología Molecular, Facultad de Química, Universidad Complutense de Madrid, Spain
- Institute of Physiology and Pathophysiology, Medical Biophysic, Heidelberg University, Germany
Figures
Figure 1 with 2 supplements
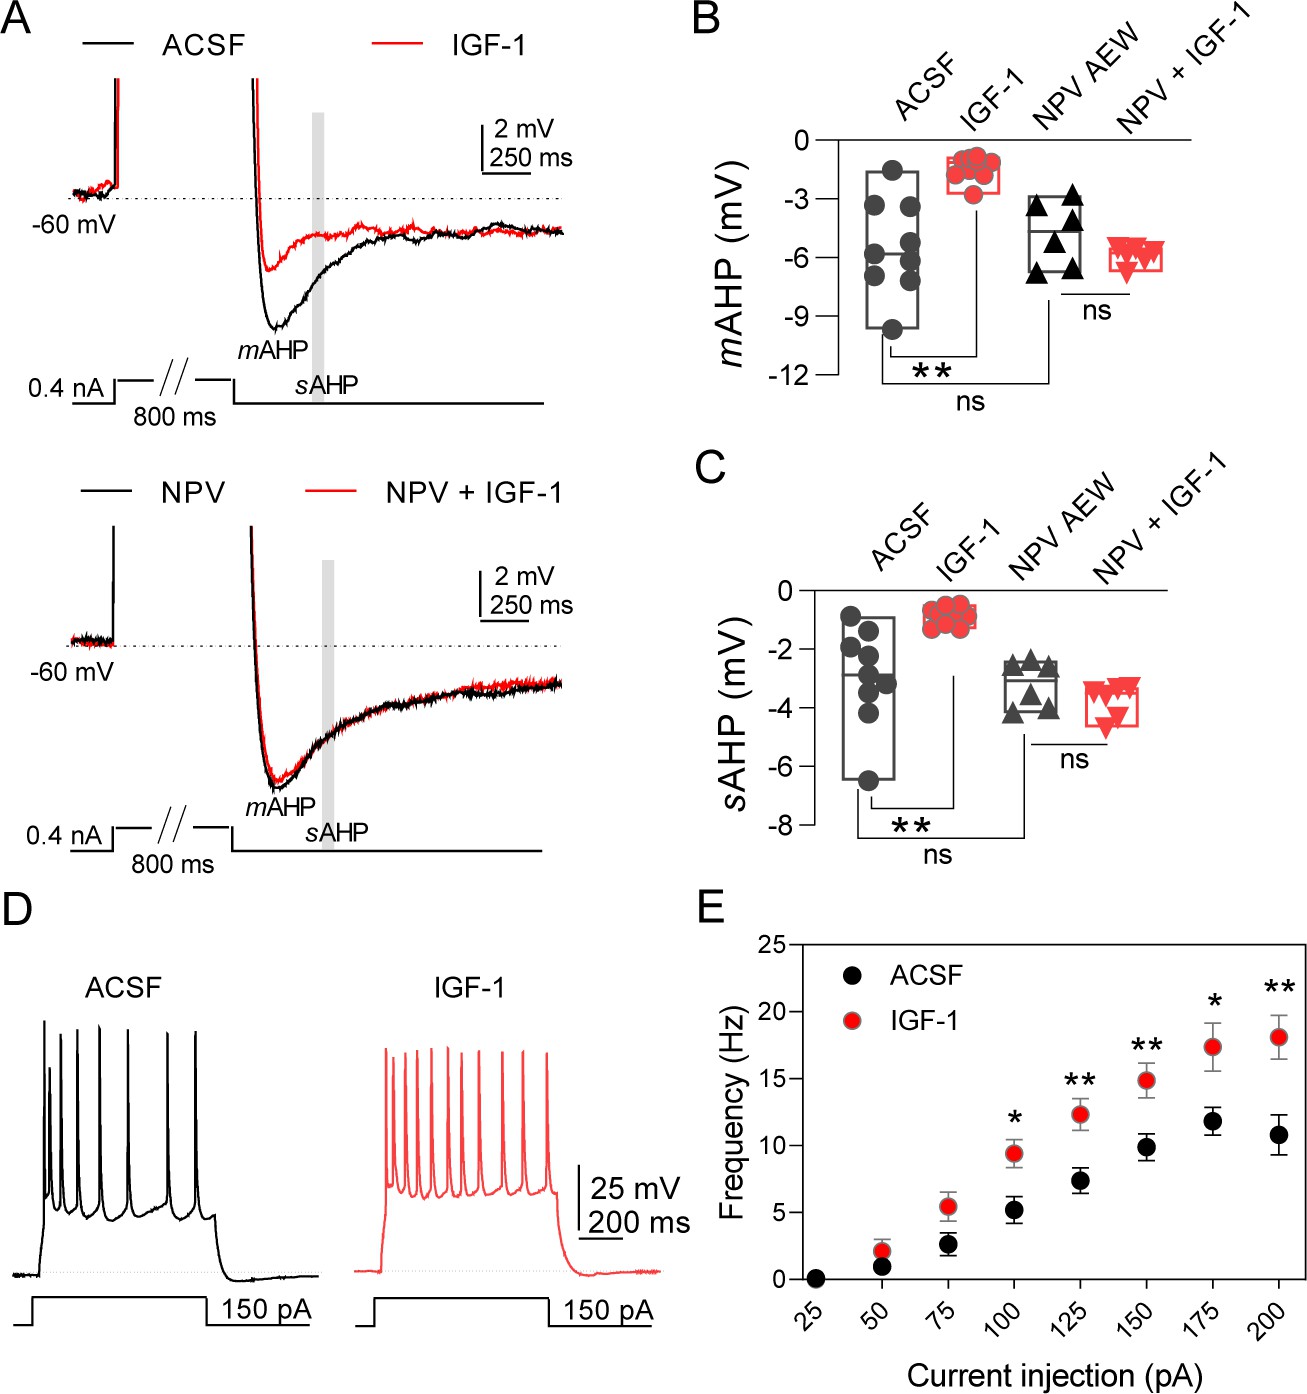
IGF-1 increases the excitability of IL-L5PNs.
(A) Representative recordings from IL-L5PNs of hyperpolarizing potentials elicited by an 800 ms depolarizing pulse to study medium and slow AHP in control conditions (ACSF, top) and in the presence of NVP-AEW541 (40 nM, bottom), before (black) and during IGF-1 (10 nM, red) (spikes are truncated). The mAHP was measured at the hyperpolarization peak and the gray box indicates where the sAHP was measured. (B) Bar diagram summarizing mAHP amplitudes (n = 9 cells/8 animals; ACSF vs IGF-1 **p<0.01 and ns (non-significant) n = 6 cells/3 animals NVP vs NVP +IGF-1, Student's paired t-test). Mann–Whitney test, n = 9/6 cells ACSF vs NVP, ns. (C) Bar diagram summarizing sAHP amplitudes (n = 9 cells/8 animals; ACSF vs IGF-1 **p<0.01 and ns n = 6 cells/3 animals NVP vs NVP +IGF-1, Student's paired t-test). Mann–Whitney test, n = 9/6 cells ACSF vs NVP, ns. (D). Representative traces recorded from IL-L5PNs after 100 pA current injection in ACSF (gray) and after IGF-1 application (red). (E) Plot showing the frequency of APs as a function of the injected current (pA) for IL-L5PNs in ACSF (gray) and after IGF-1 application (red) (n = 10 cells/8 animals ACSF vs IGF-1 *p<0.05, **p<0.01 and ns, Multiple t-tests with post hoc Holm–Sildak multiple comparison methods). See also Figure 1—figure supplement 1 and Figure 1—figure supplement 2.
-
Figure 1—source data 1
Source data for Figure 1: IGF-1 increases the excitability of IL-L5PNs.
- https://cdn.elifesciences.org/articles/67267/elife-67267-fig1-data1-v2.xlsx
Figure 1—figure supplement 1
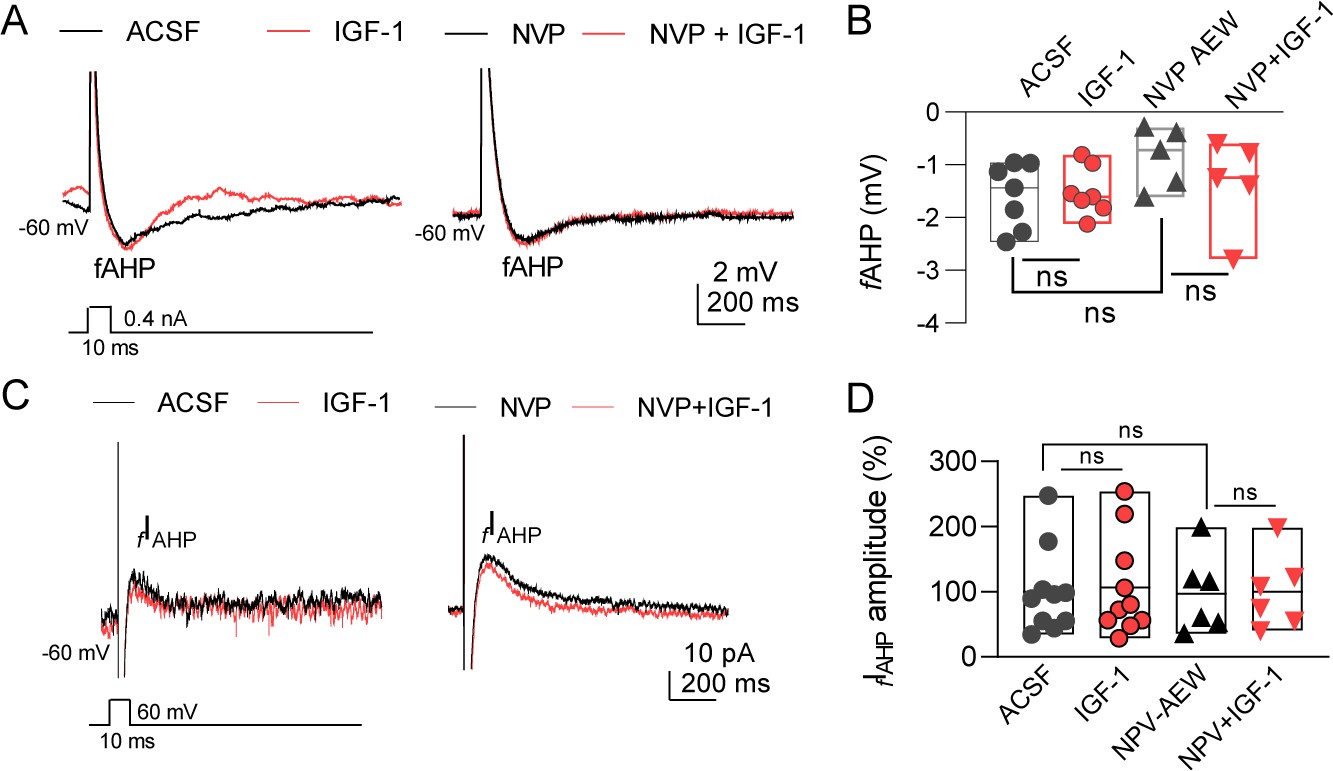
IGF-1 has no effect on fAHP and fIAHP.
(A) Representative recordings of hyperpolarizing potentials elicited by a 10 ms depolarizing pulse applied to study the fast components of the AHP, in control conditions (ACSF, left) and in the presence of NVP-AEW541 (right), before (black) and during IGF-1 (red) (spikes are truncated). (B) Bar diagram summarizing the lack of effect of IGF-1 on the fAHP (n = 7 cells/5 animals; ACSF vs IGF-1, ns (non-significant) and n = 5 cells/3 animals NVP vs NVP +IGF-1, ns, Student's paired t-test). Mann–Whitney test, n = 7/5 cells ACSF vs NVP, ns. (C) Representative current traces recorded in response to a 10 ms depolarizing pulse from −60 mV to 0 mV in control condition (ACSF, left) and in the presence of (40 nM) NVP-AEW541 (right), before (black) and during IGF-1 (red). The fAHP was measured at the hyperpolarization peak. (D) Bar diagram summarizing the lack of effect of IGF-1 on the current amplitude of fIAHPn = 10 cells/8 animals; ACSF vs IGF-1, ns (non-significant) and n = 6 cells/3 animals NVP vs NVP +IGF-1, ns, Student's paired t-test. Mann–Whitney test, n = 10/6 cells ACSF vs NVP, ns.
-
Figure 1—figure supplement 1—source data 1
Source data for Figure 1—figure supplement 1.
IGF-1 has no effect on fAHP and fIAHP.
- https://cdn.elifesciences.org/articles/67267/elife-67267-fig1-figsupp1-data1-v2.xlsx
Figure 1—figure supplement 2
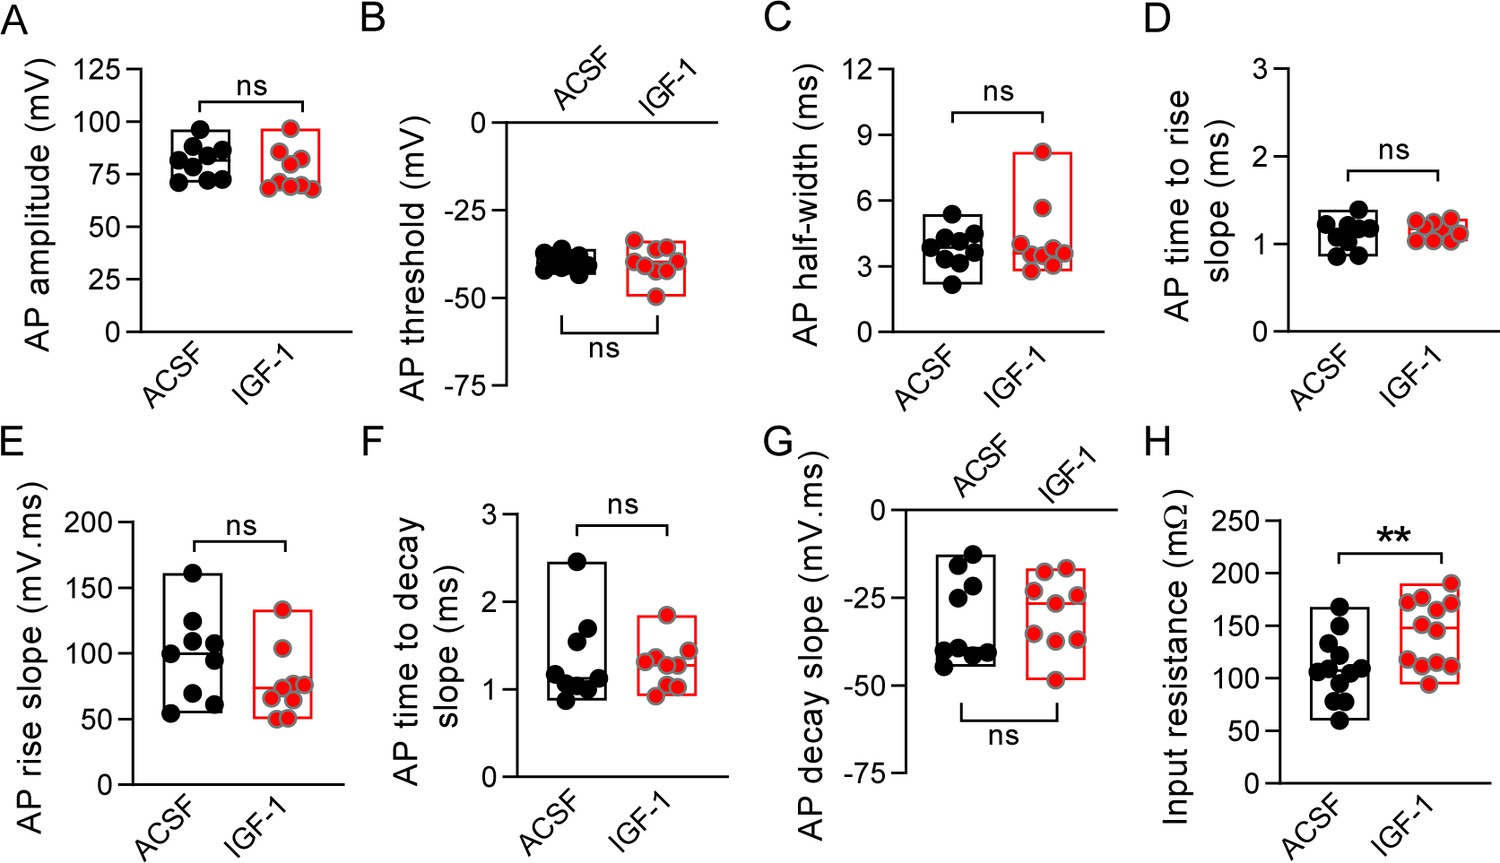
Action potential (AP) properties are unaltered by IGF-1.
(A–G) AP amplitude; threshold, half-width, time to rise slope, rise slope, time to decay slope, and decay slope in ACSF and during IGF-1 (n = 9 cells/7 animals) ACSF vs IGF-1 ns Student's paired t-test. (H) Input resistance n = 12 cells/8 animals, ACSF vs IGF-1 ***p<0.001 Student's paired t-test.
-
Figure 1—figure supplement 2—source data 1
Source data for Figure 1—figure supplement 1: Action potential properties are unaltered by IGF-1.
- https://cdn.elifesciences.org/articles/67267/elife-67267-fig1-figsupp2-data1-v2.xlsx
Figure 2 with 1 supplement
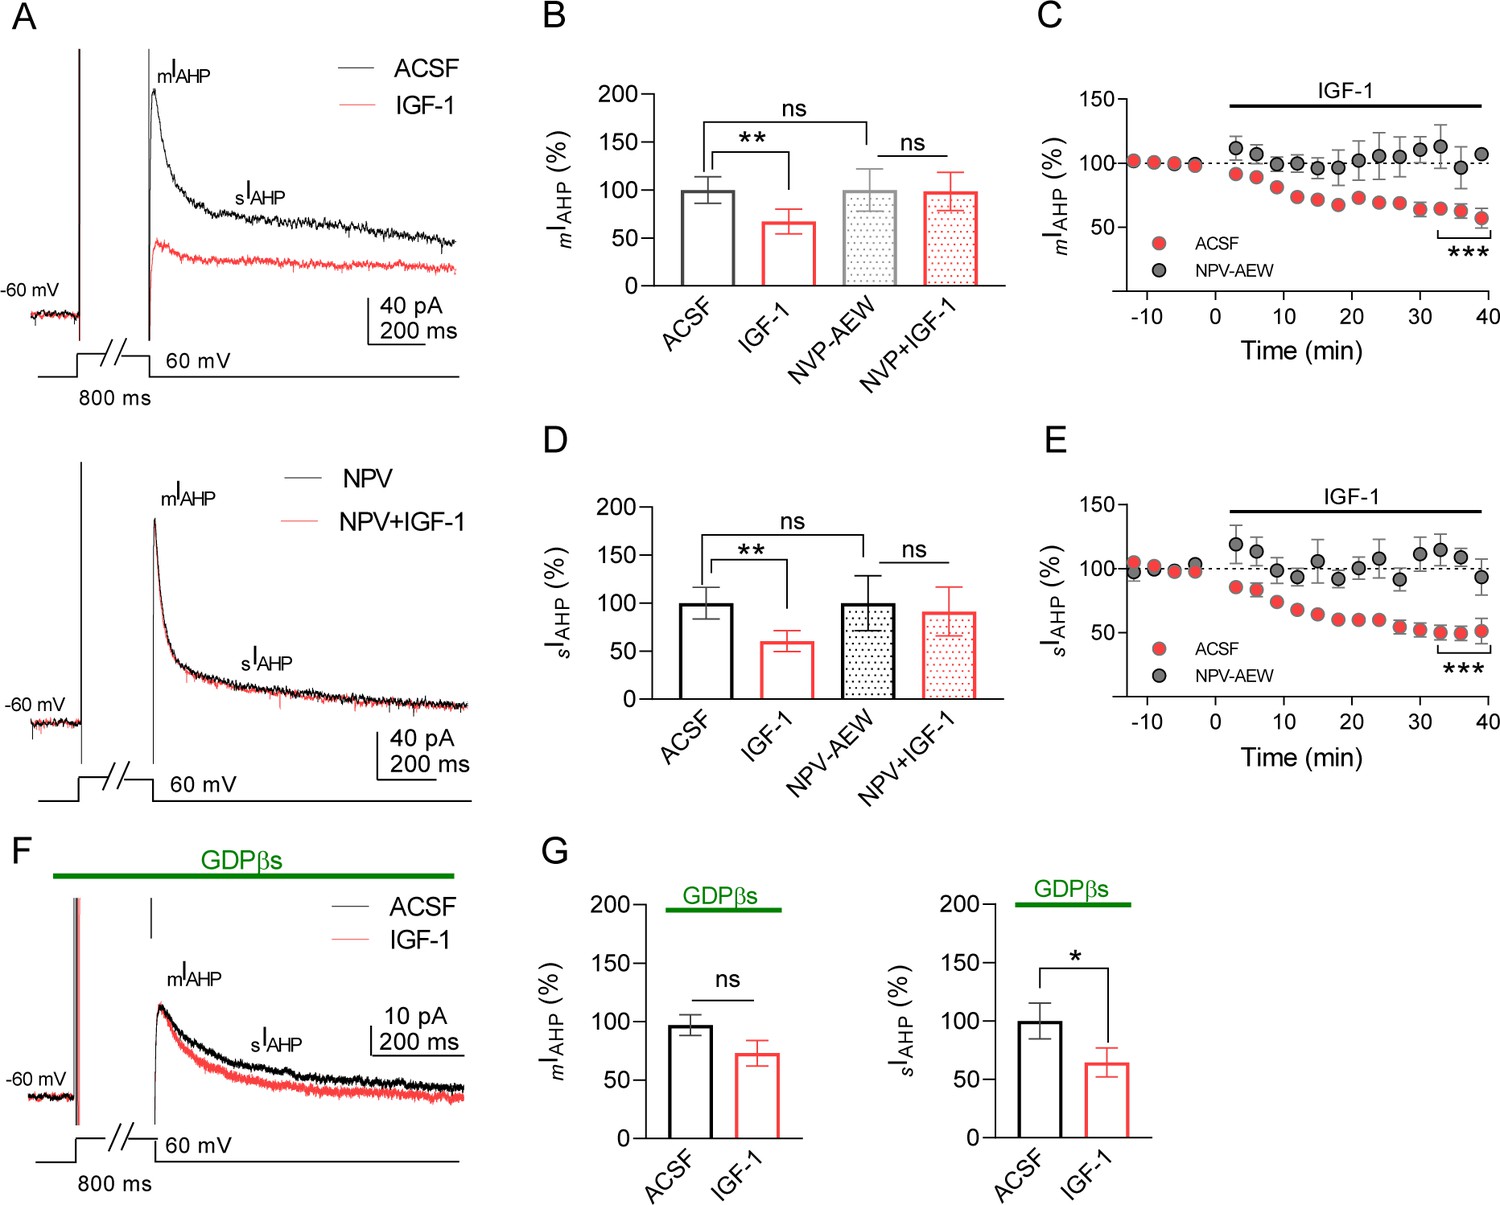
IGF-1 reduces mIAHP and sIAHP in IL-L5PNs.
(A) Representative current traces recorded from IL-L5PNs in response to an 800 ms depolarizing voltage pulse from −60 mV to 0 mV in the control condition (ACSF, top) and the presence of NVP-AEW541 (40 nM, bottom), before (black), and during 10 nM IGF-1 (red). (B) Bar diagram summarizing the normalized amplitude of mIAHP (n = 9 cells/5 animals; ACSF vs IGF-1 **p<0.01 and ns, non-significant, n = 7 cells/7 animals NVP vs NVP + IGF-1, Student's paired t-test). Mann–Whitney test, n = 9/7 cells ACSF vs NVP, ns. (C) Plot showing the time course of the peak amplitude of the mIAHP in ACSF (red) and in NVP-AEW541 before and during IGF-1 (n = 9 cells/7 animals; ACSF vs IGF-1 ***p<0.0001 and ns n = 7 cells/7 animals NVP vs NVP + IGF-1, Student's paired t-test). Mann–Whitney test, n = 9/7 cells IGF-1 vs NVP + IGF-1, ns. (D and E) Same as B and C respectively but for the sIAHP. (F) Same as A, but in the presence of GDPβs in the patch pipette. Note that only the sIAHP is modulated by IGF-1 under blockade of the G proteins. (G) Bar diagram summarizing the normalized amplitude of mIAHP (left) and normalized area of sIAHP (right) under GDPβs (n = 8 cells/4 animals; mIAHP ACSF vs IGF-1 ns, non-significant and sIAHP, n = 8 cells/4 animals ACSF vs IGF-1 *p<0.05, Student's paired t-test). See also Figure 2—figure supplement 1.
-
Figure 2—source data 1
Source data for Figure 2.
IGF-1 reduces mIAHP and sIAHP in IL-L5PNs.
- https://cdn.elifesciences.org/articles/67267/elife-67267-fig2-data1-v2.xlsx
Figure 2—figure supplement 1
Time course of mIAHP and sIAHP.
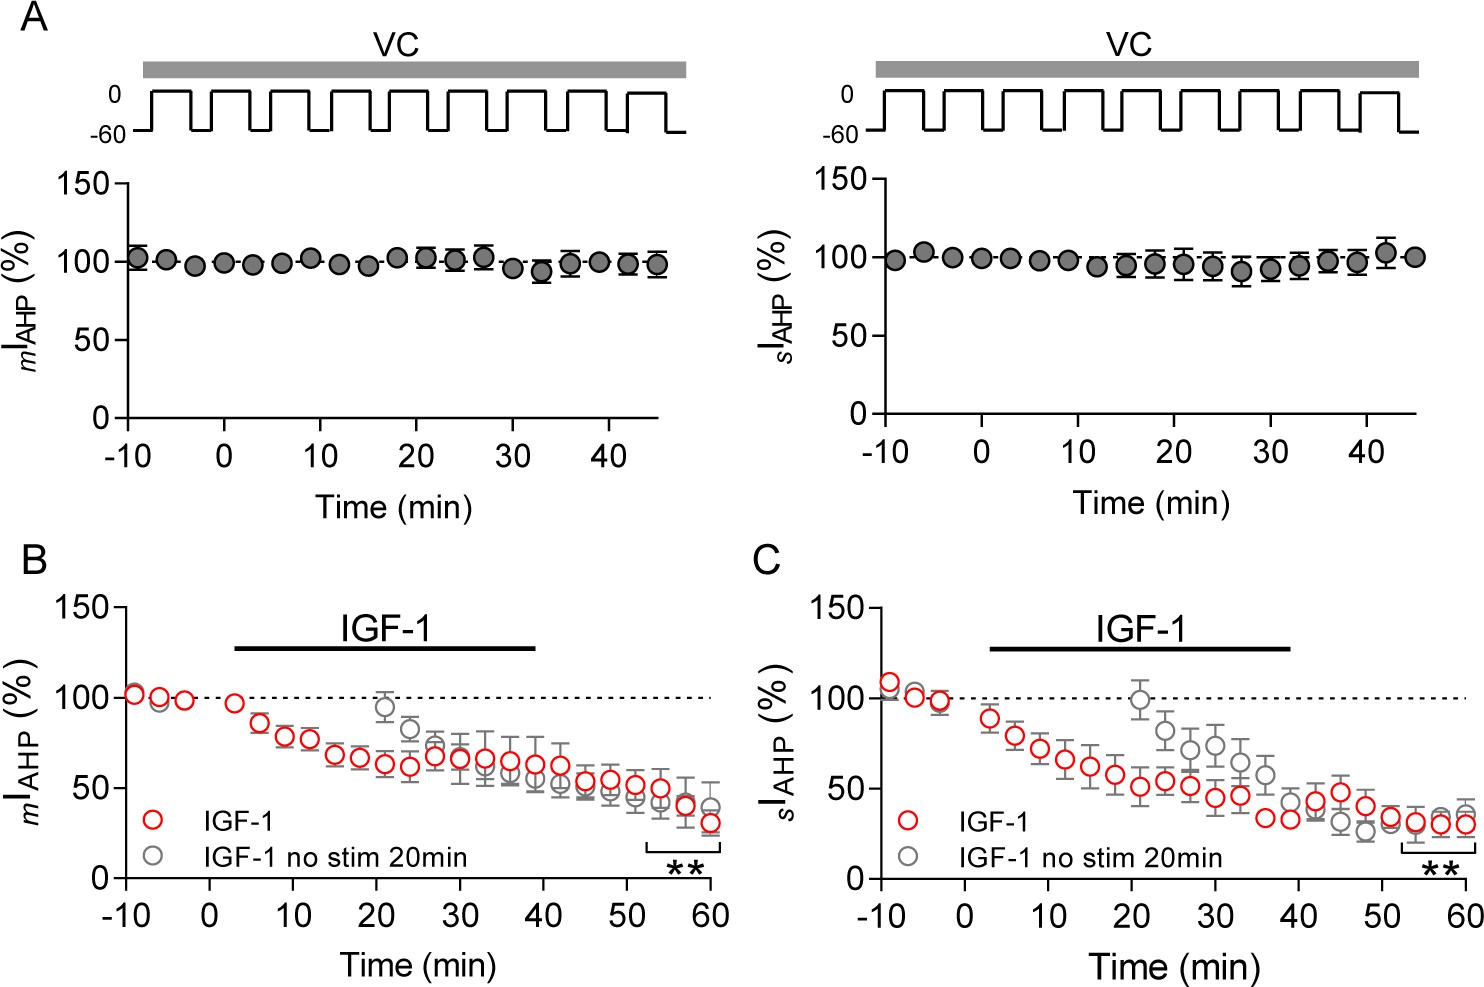
(A) Plot showing the time course of mIAHP (left) and sIAHP (right) in control conditions (ACSF) after applying 800 ms depolarizing pulses, respectively (n = 4 in each group). Note that the IAHPs are not modulated by the protocol used for their induction in the absence of IGF-1. (B) Plot showing the time course of mIAHP and the persistent effect of IGF-1 after washout; start at 0 min; n = 7 cells/6 animals, ACSF vs IGF-1 **p<0.01 Student'´s paired t-test; and start at 20 min after IGF-1 infusion n = 6 cells/4 animals, ACSF vs IGF-1 **p<0.01 Student's paired t-test. (C) Same as B but for the sIAHP. Note the LTD of IAHP was similar in both groups.
-
Figure 2—figure supplement 1—source data 1
Source data for Figure 2—figure supplement 1.
Time course of mIAHP and sIAHP.
- https://cdn.elifesciences.org/articles/67267/elife-67267-fig2-figsupp1-data1-v2.xlsx
Figure 3 with 2 supplements

IGF-1 induces long-term potentiation of the synaptic transmission.
(A) Plot showing the time course of EPSCs when the IGF-1 was bath applied for 35 min after a stable (~5 min) baseline, (n = 5 cells/3 animals, ACSF vs IGF-1 ***p<0.001 and ns, n = 5 cells/3 animals NVP vs NVP +IGF-1 Student's paired t-test). Mann–Whitney test, n = 5/5 cells IGF-1 vs NVP +IGF-1, **p<0.01. (B) (top) Superimposed representative paired-pulse EPSCs recorded before (black trace) and during IGF-1 (red trace). (bottom) Bar diagram summarizing the EPSC paired-pulse ratio (PPR) before (black bar) and during IGF-1 (red bar). Student's paired t-test **p<0.01; (n = 5, same as A). (C) (top) Representative EPSCs traces before and during IGF-1. (bottom) Plot of the variance (1/CV2r) as a function of the mean EPSC peak amplitude (M) 30 min after IGF-1 and normalized to control condition (ACSF) (n = 5, same as A). (D) Plot showing the time course of EPSCs when IGF-1 is applied in the absence of synaptic stimulus for 15 min. (n = 5 cells/3 animals, ACSF vs IGF-1 ***p<0.001 Student's paired t-test). (E–H) Same as A–D, respectively, but for the IPSCs. (I) Plot showing the time course of PSP amplitude when, after a stable (~5 min) baseline, IGF-1 was bath applied for 35 min. Student's paired t-test ***p<0.001 (n = 6). (J) Representative PSPs recordings before (black trace) and during IGF-1 (red trace). (K) Bar diagrams summarizing the effect of IGF-1 on the PSP amplitude, PSP area, and the TAU ON and OFF (n = 6 cells/4 animals, ACSF vs IGF-1 *p<0.05 Student's paired t-test). Note that only the amplitude and area of the PSPs are modulated by IGF-1. (L) Representative current-clamp responses recorded before (black trace) and during IGF-1 (red trace). (M) Bar diagram summarizing the number of action potentials (APs) in ACSF and at 5, 10, and 15 min during IGF-1 (n = 6 cells/4 animals, ACSF vs IGF-1 *p<0.05, ***p<0.001 one-way ANOVA with post hoc Dunnett's multiple comparison test). (N) Bar diagram summarizing the lack of effect of IGF-1 in the AP amplitude, the AP half-width, AP time to rise slope, AP rise slope, AP time to decay slope, and AP decay slope (n = 6 cells/4 animals, ACSF vs IGF-1 Student's paired t-test). See also Figure 3—figure supplement 1 and Figure 3—figure supplement 2.
-
Figure 3—source data 1
Source data for Figure 3.
IGF-1 induces long-term potentiation of the synaptic transmission.
- https://cdn.elifesciences.org/articles/67267/elife-67267-fig3-data1-v2.xlsx
Figure 3—figure supplement 1
The protocol of stimulation does not induce plasticity.
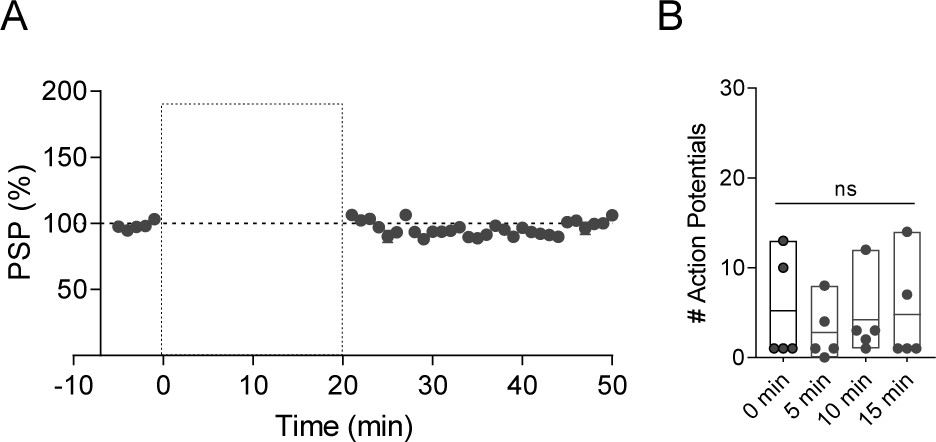
(A) Plot showing a long-lasting stable recording of the PSPs with the protocol used in Figure 3I but in the absence of IGF-1 ACSF (−5–0 min) vs ACSF (45–50 min), ns (not-significant) Student's paired t-test n = 4 cells/2 animals. (B) Bar diagram summarizing the lack of effect of the protocol of recording the PSPs in the number of action potentials recorded at different time points (0, 5, 10, and 15 min). One-way ANOVA with post hoc Dunnett's multiple comparison test, n = 4 cells/2 animals ns (not-significant).
-
Figure 3—figure supplement 1—source data 1
Source data for Figure 3—figure supplement 1.
The protocol of stimulation does not induce plasticity.
- https://cdn.elifesciences.org/articles/67267/elife-67267-fig3-figsupp1-data1-v2.xlsx
Figure 3—figure supplement 2
The application of IGF-1 is sufficient to induce plasticity.
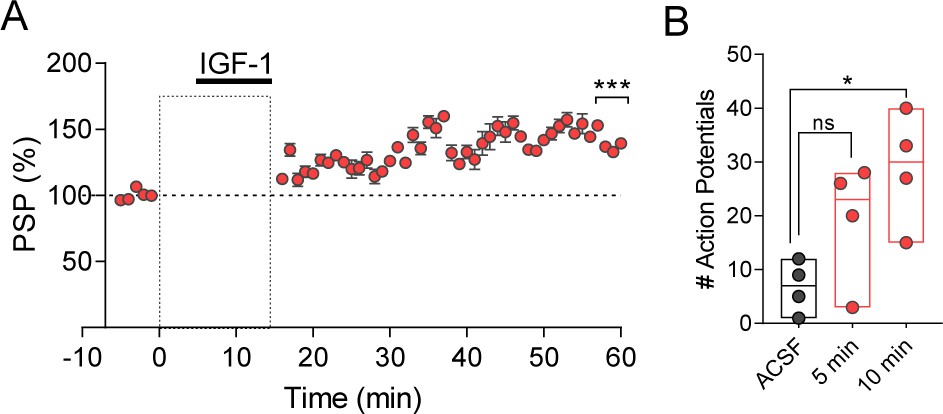
(A) Plot showing the time course of PSPs amplitude when, after a stable (~5 min) baseline, IGF-1 was bath applied for 10 min. Student's paired t-test ***p>0.001 (n = 6 cells/2 animals). (B) Bar diagram summarizing the number of action potentials in ACSF and at 5 and 10 min during IGF-1 (n = 6 cells/2 animals) one-way ANOVA with post hoc Dunnett's multiple comparison tests *p<0.05.
-
Figure 3—figure supplement 2—source data 1
Source data for Figure 3—figure supplement 2.
The application of IGF-1 is sufficient to induce plasticity.
- https://cdn.elifesciences.org/articles/67267/elife-67267-fig3-figsupp2-data1-v2.xlsx
Figure 4 with 2 supplements
IGF-1 facilitates the extinction memory by reducing mIAHP and sIAHP.
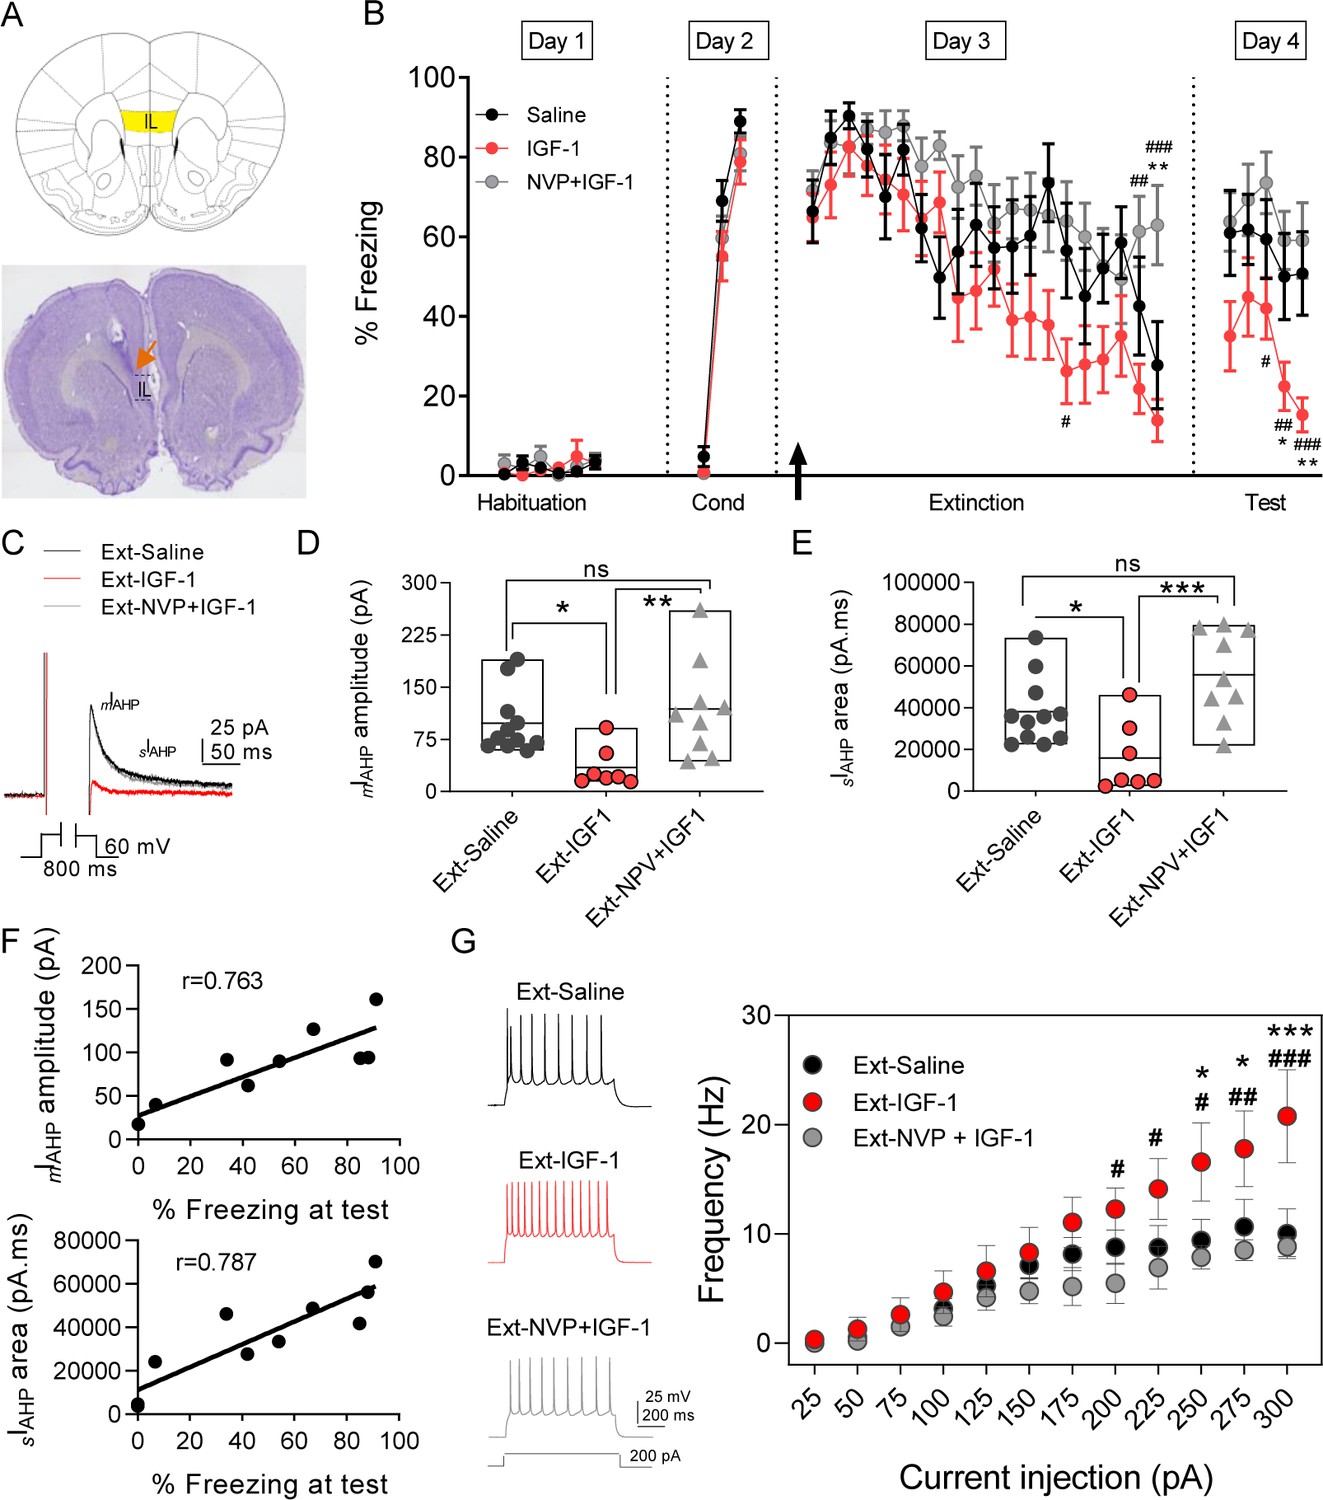
(A) (top) Image showing the infralimbic cortex (IL) localization. (bottom) Nissl-stained coronal section of rat IL, the orange arrow indicates the tip of the cannula implanted on the IL. (B) Plot showing the time course of the percentage of freezing during the extinction protocol for the three groups studied (saline, IGF-1, and NVP-+IGF-1). Saline (n = 11), IGF-1 (n = 14), and NVP-AEW541 +IGF-1 (n = 12) were directly applied into the IL through the implanted cannula 30 min before extinction training (day 3). The black arrow indicates the time of infusion. (*p<0.05 **p<0.01 saline vs IGF-1 and NPV + IGF-1 #p<0.05; ##p<0.01; ###p<0.001 IGF-1 vs NPV + IGF-1; One-way ANOVA with post hoc Tukey's multiple comparisons test). (C) Representative mIAHP and sIAHP current traces recorded in three groups of animals studied that showed fear extinction (D) Bar diagrams summarizing the mIAHP for all the groups studied. Recordings were performed in day 4 (test) after finishing the extinction protocol; saline (n = 11 cells/3 animals) vs IGF-1 (n = 7 cells/4 animals) *p<0.05; IGF-1 vs NPV + IGF-1 (n = 9 cells/3 animals) **p<0.01 and saline (n = 11 cells/3 animals) vs NPV + IGF-1 (n = 9 cells/3 animals) ns, one-way ANOVA with post hoc Tukey's multiple comparisons test. (E) Bar diagrams summarizing the sIAHP for all the groups studied. Saline (n = 11 cells/3 animals) vs IGF-1 (n = 7 cells/4 animals) *p<0.05; IGF-1 vs NPV + IGF-1 (n = 9 cells/3 animals) **p<0.01 and saline (n = 11 cells/3 animals) vs NPV + IGF-1 (n = 9 cells/3 animals) ns, one-way ANOVA with post hoc Tukey's multiple comparisons test. (F) For each rat in the extinction groups, the mIAHP and sIAHP for all cells were averaged. Across rats, these values were significantly correlated with freezing levels at test (r = 0.763 for mIAHP and r = 0.787 for sIAHP pointing to that the reduction in both currents is correlated with the extinction recall). (G) Representative traces recorded from IL-L5PNs from animals that showed fear extinction after 200 pA (left) current injection in saline (black); IGF-1 (red) and NVP + IGF-1 (gray). Frequency-injected current relationships for IL-L5PNs in saline (black, n = 10 cells/5 animals) IGF-1 (red, n = 7 cells/3 animals) and NVP + IGF-1 (gray, n = 6 cells/3 animals). (*) IGF-1 vs saline and (#) IGF-1 vs. NVP + IGF-1; one-way ANOVA with post hoc Tukey's multiple comparisons test. See also Figure 4—figure supplement 1 and Figure 4—figure supplement 2.
-
Figure 4—source data 1
Source data for Figure 4.
IGF-1 facilitates the extinction memory by reducing mIAHP and sIAHP.
- https://cdn.elifesciences.org/articles/67267/elife-67267-fig4-data1-v2.xlsx
Figure 4—figure supplement 1
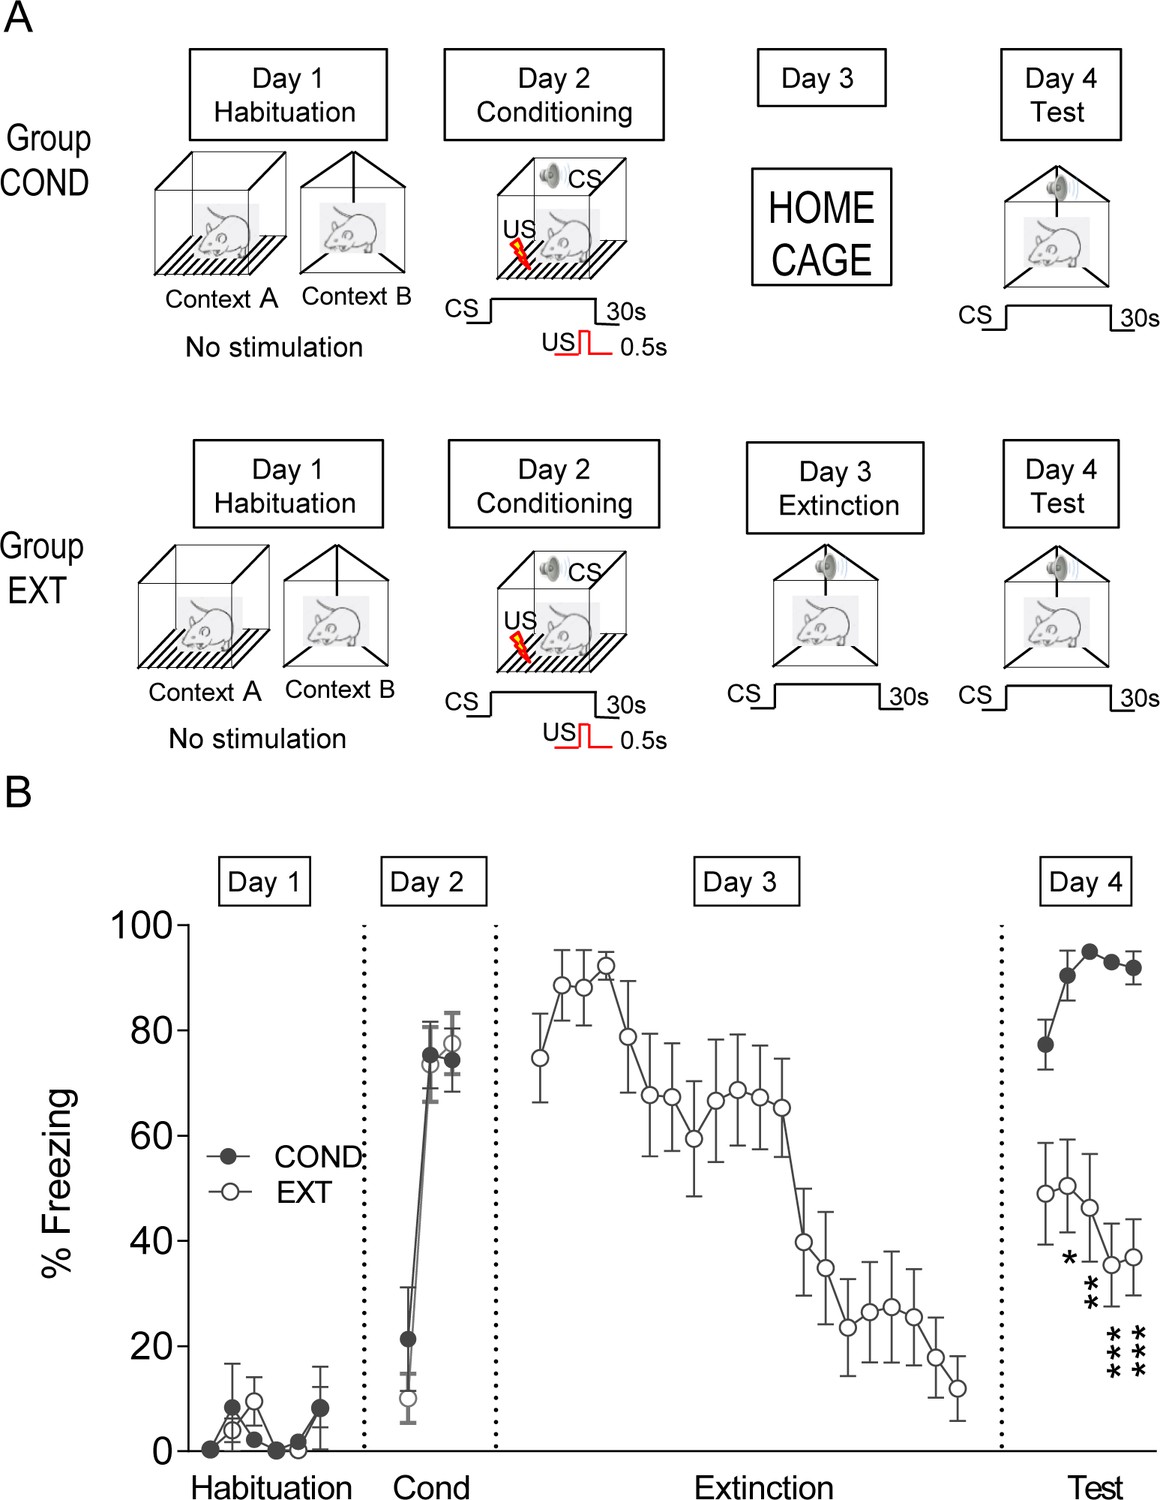
Protocol of behavior.
(A) The experimental design of the conditioned fear experiments. (B) Plot showing the time course of the percentage of freezing during the experiment for the two groups studied: conditioned (COND, black circles; n = 7) and extinction (EXT, white circles; n = 11) groups. As expected, animals in the COND group showed higher levels of freezing to the test tones compared with the EXT groups (***p<0.001; **p<0.01; one-way ANOVA with post hoc Tukey's multiple comparisons test).
-
Figure 4—figure supplement 1—source data 1
Source data for Figure 4—figure supplement 1.
Protocol of behavior.
- https://cdn.elifesciences.org/articles/67267/elife-67267-fig4-figsupp1-data1-v2.xlsx
Figure 4—figure supplement 2
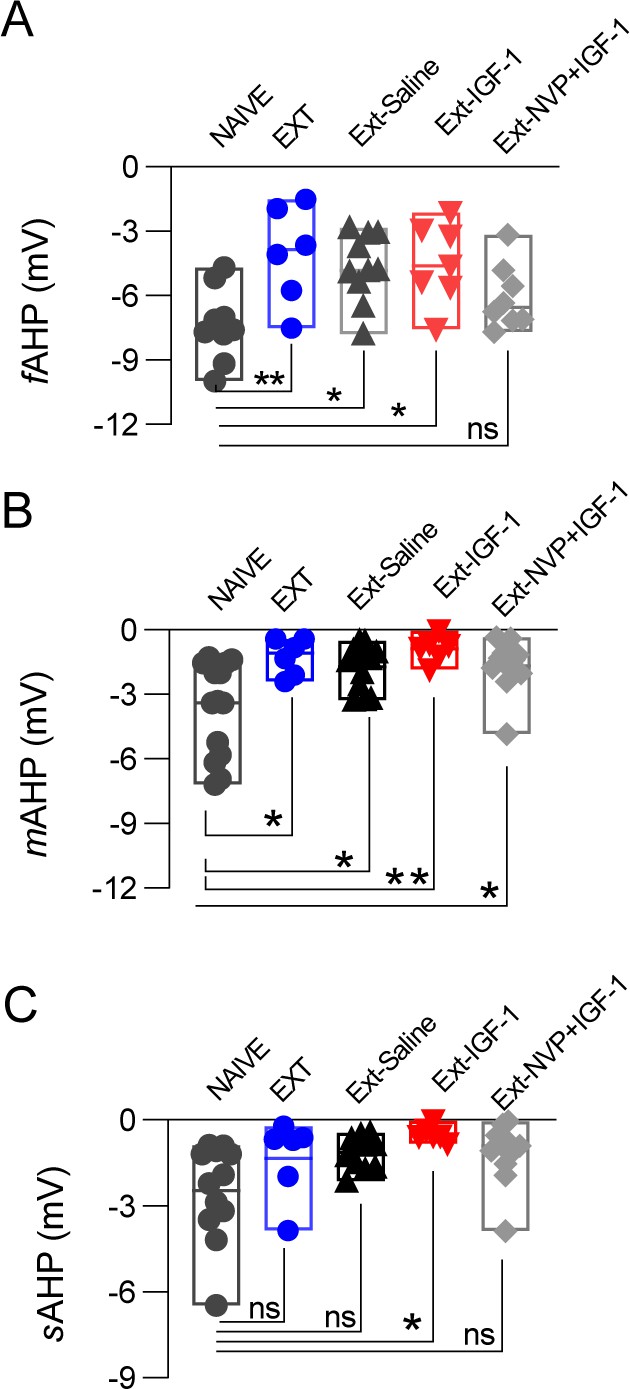
AHPs of the L5PN of the IL recorded from animals after fear extinction.
(A) Bar diagram summarizing fAHP from rats NAÏVE (n = 10 cells/8 animals) and after test behaviors in different groups: EXT (n = 6 cells/2 animals); Ext-Saline (n = 10 cells/3 animals); Ext-IGF-1 (n = 7 cells/3 animals); Ext-NVP +IGF-1 (n = 8 cells/2 animals) One-way ANOVA with post hoc Turkey's multiple comparisons test *p<0.05; **p<0.01. (B) Bar diagram summarizing mAHP from rats NAÏVE (n = 16 cells/10 animals) and after test behaviors in different groups EXT (n = 6 cells/2 animals); Ext-Saline (n = 13 cells/5 animals); Ext-IGF-1 (n = 6 cells/3 animals); Ext-NVP +IGF-1 (n = 11 cells/3 animals) One-way ANOVA with post hoc Turkey's multiple comparisons test *p<0.05; **p<0.01. (C) Bar diagram summarizing sAHP from rats NAÏVE (n = 12 cells/6 animals) and after test behaviors in different groups EXT (n = 6 cells/2 animals); Ext-Saline (n = 11 cells/4 animals); Ext-IGF-1 (n = 6 cells/3 animals); Ext-NVP +IGF-1 (n = 11 cells/3 animals); one-way ANOVA with post hoc Turkey's multiple comparisons test *p<0.05. See also Supplementary file 1.
-
Figure 4—figure supplement 2—source data 1
Source data for Figure 4—figure supplement 2.
AHPs of the L5PN of the IL recorded from animals after fear extinction.
- https://cdn.elifesciences.org/articles/67267/elife-67267-fig4-figsupp2-data1-v2.xlsx
Figure 5
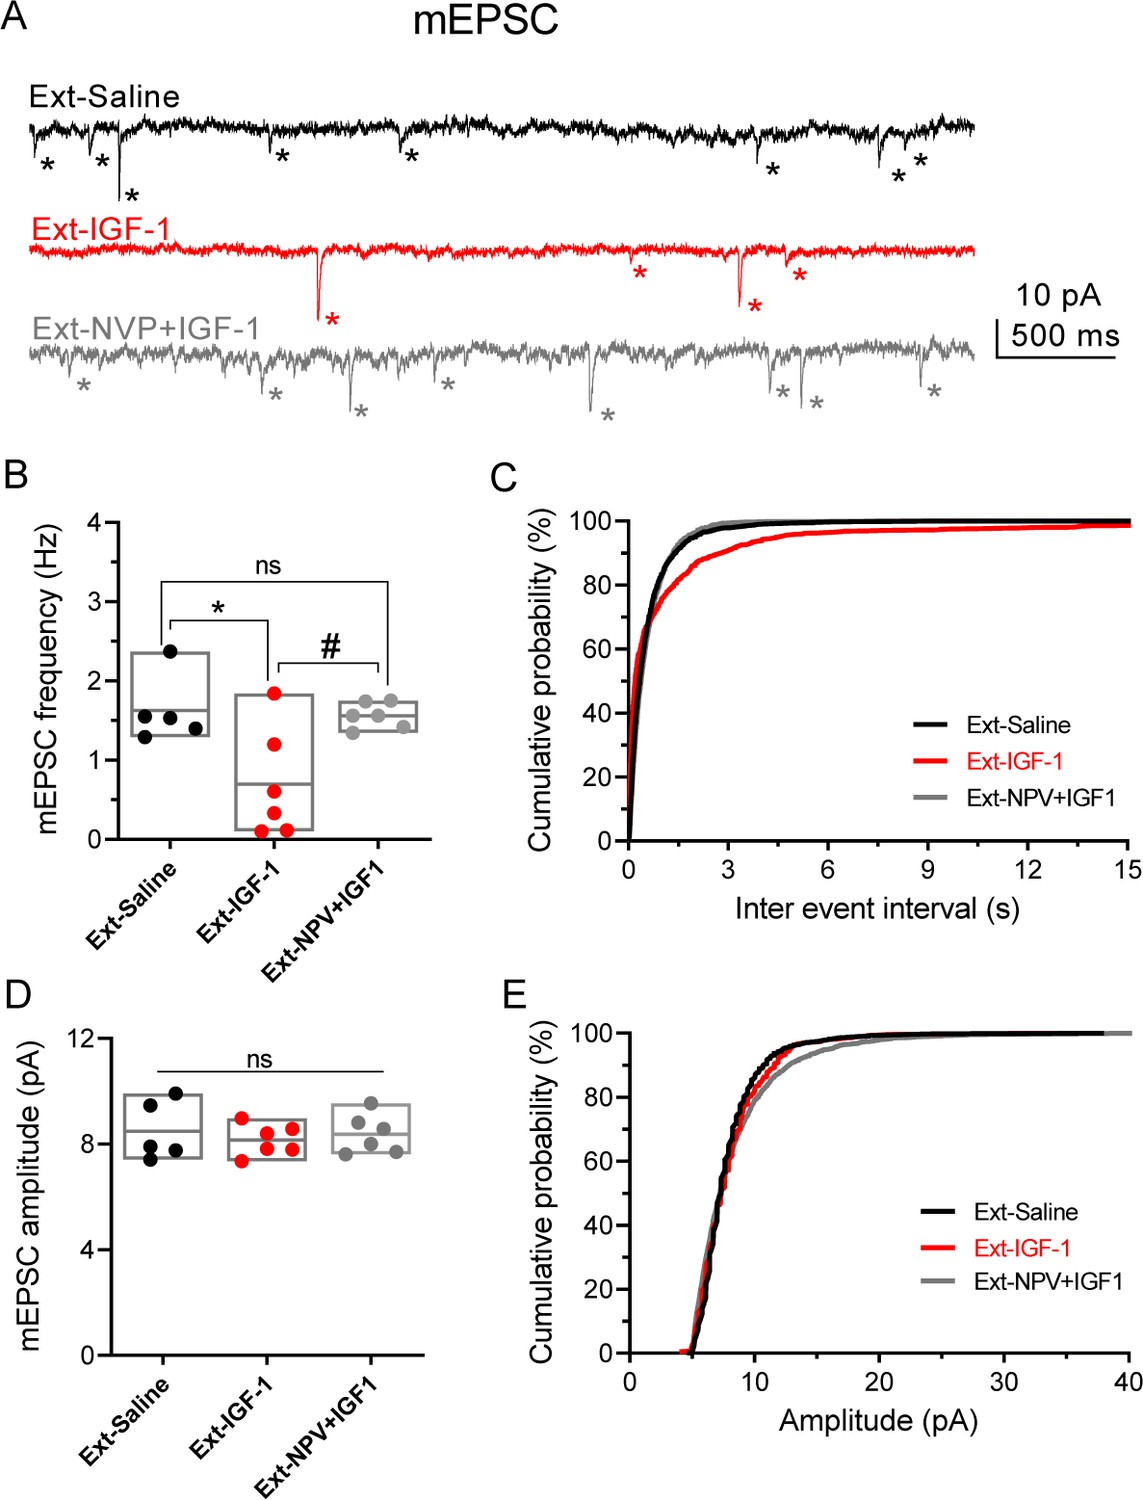
IGF-1 decreases the frequency of mEPSC.
(A) Representative traces recorded at −60 mV in IL-L5PNs from animals that showed fear extinction, in the presence of 1 µM TTX, 50 µM PiTX, and 5 μM CPG-55845. Asterisks denote mEPSC events. Note the decreased mEPSCs frequency induced by IGF-1. (B) Bar diagram of the summary data showing mean mEPSCs frequency from Ext-Saline (black, n = 5 cells/2 animals); Ext-IGF-1 (red, n = 6/3 animals); and Ext-NVP +IGF-1 (gray, n = 6/3 animals). One-way ANOVA with post hoc Tukey's multiple comparisons test. (C) Cumulative probability plots of mean inter-mEPSC interval in Ext-Saline (black); Ext-IGF-1 (red); and Ext-NVP +IGF-1 (gray) (same cells as in B). Note that IGF-1 increased the mean inter-mEPSC interval (p<0.05; Kolmogorov–Smirnov test). (D) Bar diagram of the summary data showing mean mEPSCs amplitude (same cells as in B). (E) Cumulative probability plots of mean amplitude-mEPSC in Ext-Saline (black); Ext-IGF-1 (red); and Ext-NVP +IGF-1 (gray). Note that IGF-1 does not change the mean mEPSCs amplitude (same cells as in B).
-
Figure 5—source data 1
Source data for Figure 5: IGF-1 decreases the frequency of mEPSC.
- https://cdn.elifesciences.org/articles/67267/elife-67267-fig5-data1-v2.xlsx
Additional files
-
Supplementary file 1
Summary of statistical significance and tests used in each figure.
- https://cdn.elifesciences.org/articles/67267/elife-67267-supp1-v2.docx
-
Transparent reporting form
- https://cdn.elifesciences.org/articles/67267/elife-67267-transrepform-v2.docx
Download links
A two-part list of links to download the article, or parts of the article, in various formats.
Downloads (link to download the article as PDF)
Open citations (links to open the citations from this article in various online reference manager services)
Cite this article (links to download the citations from this article in formats compatible with various reference manager tools)
IGF-1 facilitates extinction of conditioned fear
eLife 10:e67267.
https://doi.org/10.7554/eLife.67267


