Human spinal cord in vitro differentiation pace is initially maintained in heterologous embryonic environments
- Division of Cell and Developmental Biology, School of Life Sciences, University of Dundee, United Kingdom
Figures
Figure 1

Human pluripotent cell derivation of NMP-like cells and their differentiation into dorsal spinal cord neural rosettes.
(A) Timeline and protocol for induction and differentiation of dorsal spinal cord neural rosette from human pluripotent stem cells (hPSC); (B) Expression patterns and quantification of cell type specific proteins in rosettes on days D4, D6, and D10 detected by immunofluorescence (IF) combined with DNA stain DAPI: apical polarity marker N-Cadherin (NCAD), neural progenitor markers SOX2, PAX6, early neural crest marker SNAIL2, and dorso-ventrally restricted neural progenitor markers PAX7 and OLIG2. Quantifications indicate proportions of expressing cells in either a defined field on D4 or within a rosette from D6, in 15 samples for each marker (n = 5 rosettes from each of 3 independent differentiations, each data point represents a single rosette), see section ‘Materials and Methods’. Data analysed with Mann–Whitney test, errors bars ± SEM, p values: *p<0.05; **p<0.01; **** p<0.0001; scale bar = 50 μm.
-
Figure 1—source data 1
Quantifications indicating proportions of cells expressing SOX2, PAX6 and SNAI2 in either a defined field on D4 or within a rosette from D6 and D10.
- https://cdn.elifesciences.org/articles/67283/elife-67283-fig1-data1-v2.xlsx
-
Figure 1—source data 2
Quantifications indicating proportions of cells expressing PAX7 and OLIG2 in either a defined field on D4 or within a rosette from D6 and D10.
- https://cdn.elifesciences.org/articles/67283/elife-67283-fig1-data2-v2.xlsx
-
Figure 1—source data 3
Quantifications indicating the different diameters of rosette in micrometre from D6, D10, and D14.
- https://cdn.elifesciences.org/articles/67283/elife-67283-fig1-data3-v2.xlsx
Figure 2 with 1 supplement
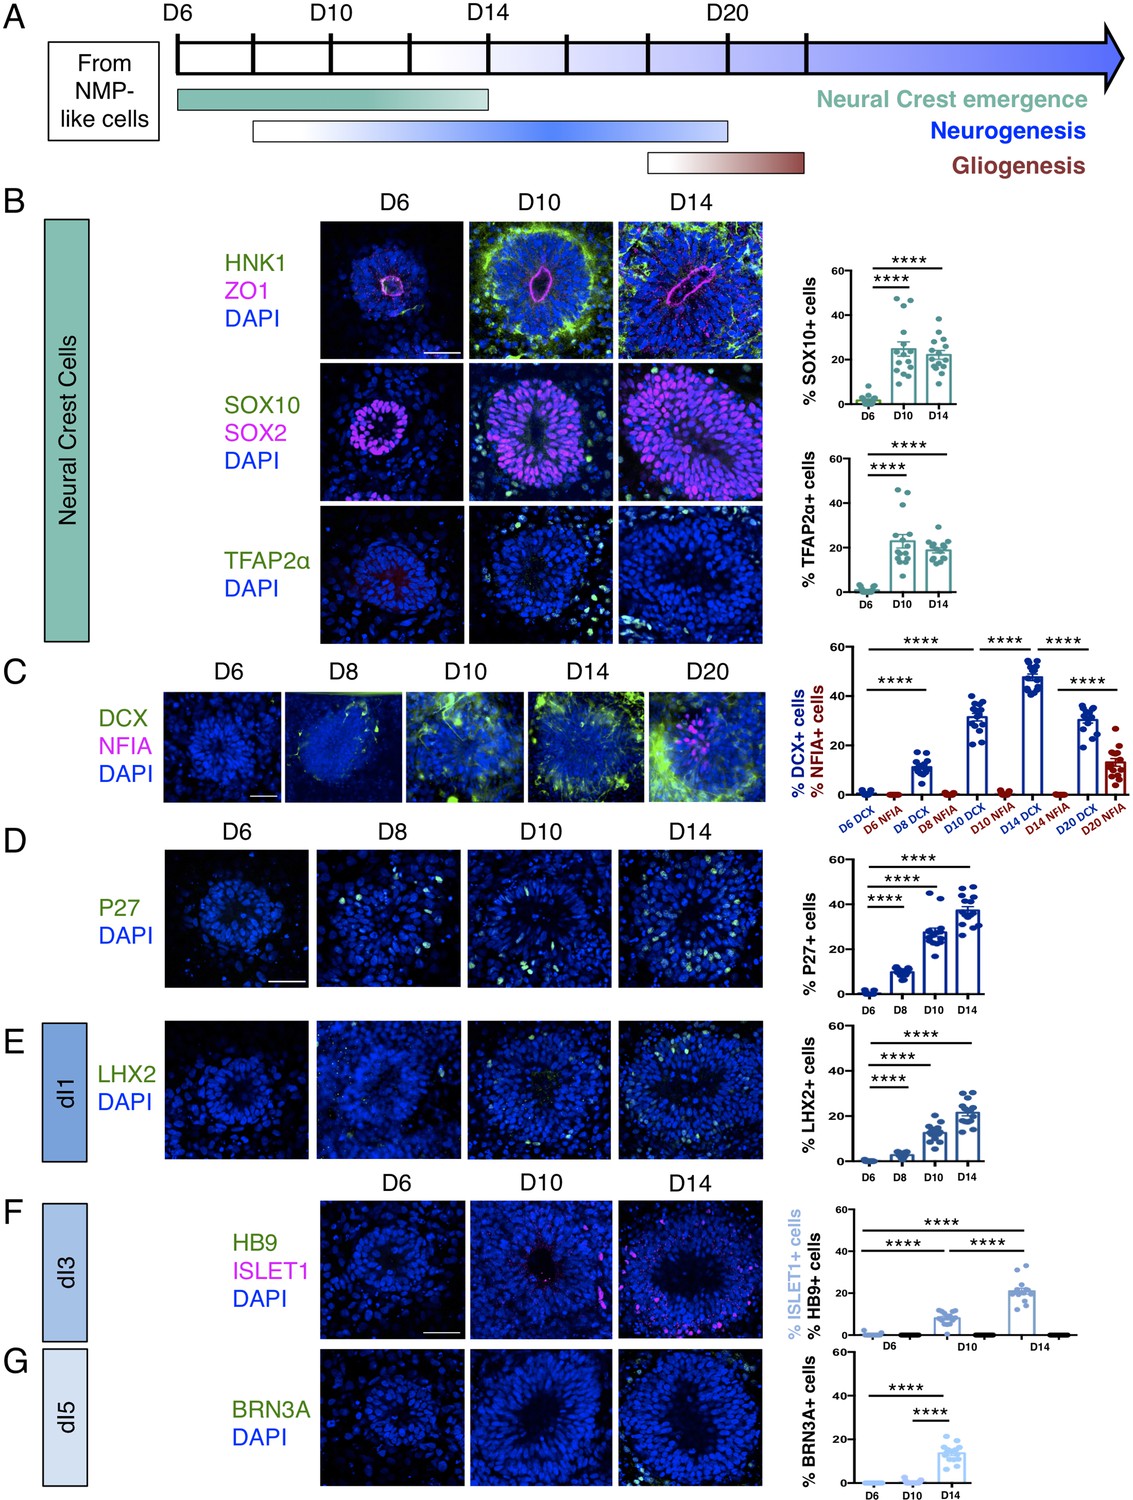
Human dorsal spinal cord rosettes exhibit stereotyped sequence of cell-type specific differentiation.
(A) Schematic of in vitro sequence of cell-type specific differentiation of dorsal spinal cord rosettes; (B) emergence of migrating neural crest from rosettes by D10, documented by IF for key marker proteins HNK1, (lumen defined by apical marker ZO-1), SOX10 (neural progenitors defined by SOX2), and TFAP2α and quantified for SOX10 and TFAP2α; (C) transition from neurogenesis to gliogenesis documented and quantified in immature neuronal reporter line (H1:DCX-YFP) with co-IF for gliogenesis marker Nuclear Factor I-A (NFIA) at key timepoints; (D) P27/KIP1 expression which by analogy identifies most dorsal post-mitotic neurons, confirms neurogenesis onset by D8; (E–G) emergence of dorsal interneuron (dIs) subtypes by D10 indicated by dI1s/LHX2 (E), dI3s/ISLET1 (F) (note lack of HB9/ ISLET1 co-expression distinguishes these cells from motor neurons) and dI5s/BRN3A. Sample numbers, statistics and error bars as in Figure 1, each data point represents a single rosette and see section ‘Materials and Methods’; scale bar = 50 μm.
-
Figure 2—source data 1
Quantifications indicating proportions of cells expressing migratory Neural Crest Cells markers (SOX10 and TFAP2α) within a rosette from D6, D10, and D14.
- https://cdn.elifesciences.org/articles/67283/elife-67283-fig2-data1-v2.xlsx
-
Figure 2—source data 2
Quantifications indicating proportions of cells expressing neuronal marker (DCX) and glial marker (NFIA) within a rosette from D6, D8, D10, D14, and D20.
- https://cdn.elifesciences.org/articles/67283/elife-67283-fig2-data2-v2.xlsx
-
Figure 2—source data 3
Quantifications indicating proportions of cells expressing neuronal marker (P27) within a rosette from D6, D8, D10 and D14.
- https://cdn.elifesciences.org/articles/67283/elife-67283-fig2-data3-v2.xlsx
-
Figure 2—source data 4
Quantifications indicating proportions of cells expressing dI1s marker (LHX2) within a rosette from D6, D8, D10 and D14.
- https://cdn.elifesciences.org/articles/67283/elife-67283-fig2-data4-v2.xlsx
-
Figure 2—source data 5
Quantifications indicating proportions of cells expressing ISLET1 and HB9 within a rosette from D6, D10, and D14.
- https://cdn.elifesciences.org/articles/67283/elife-67283-fig2-data5-v2.xlsx
-
Figure 2—source data 6
Quantifications indicating proportions of cells expressing dI5s marker (BRN3A) within a rosette from D6, D8, D10, and D14.
- https://cdn.elifesciences.org/articles/67283/elife-67283-fig2-data6-v2.xlsx
Figure 2—figure supplement 1
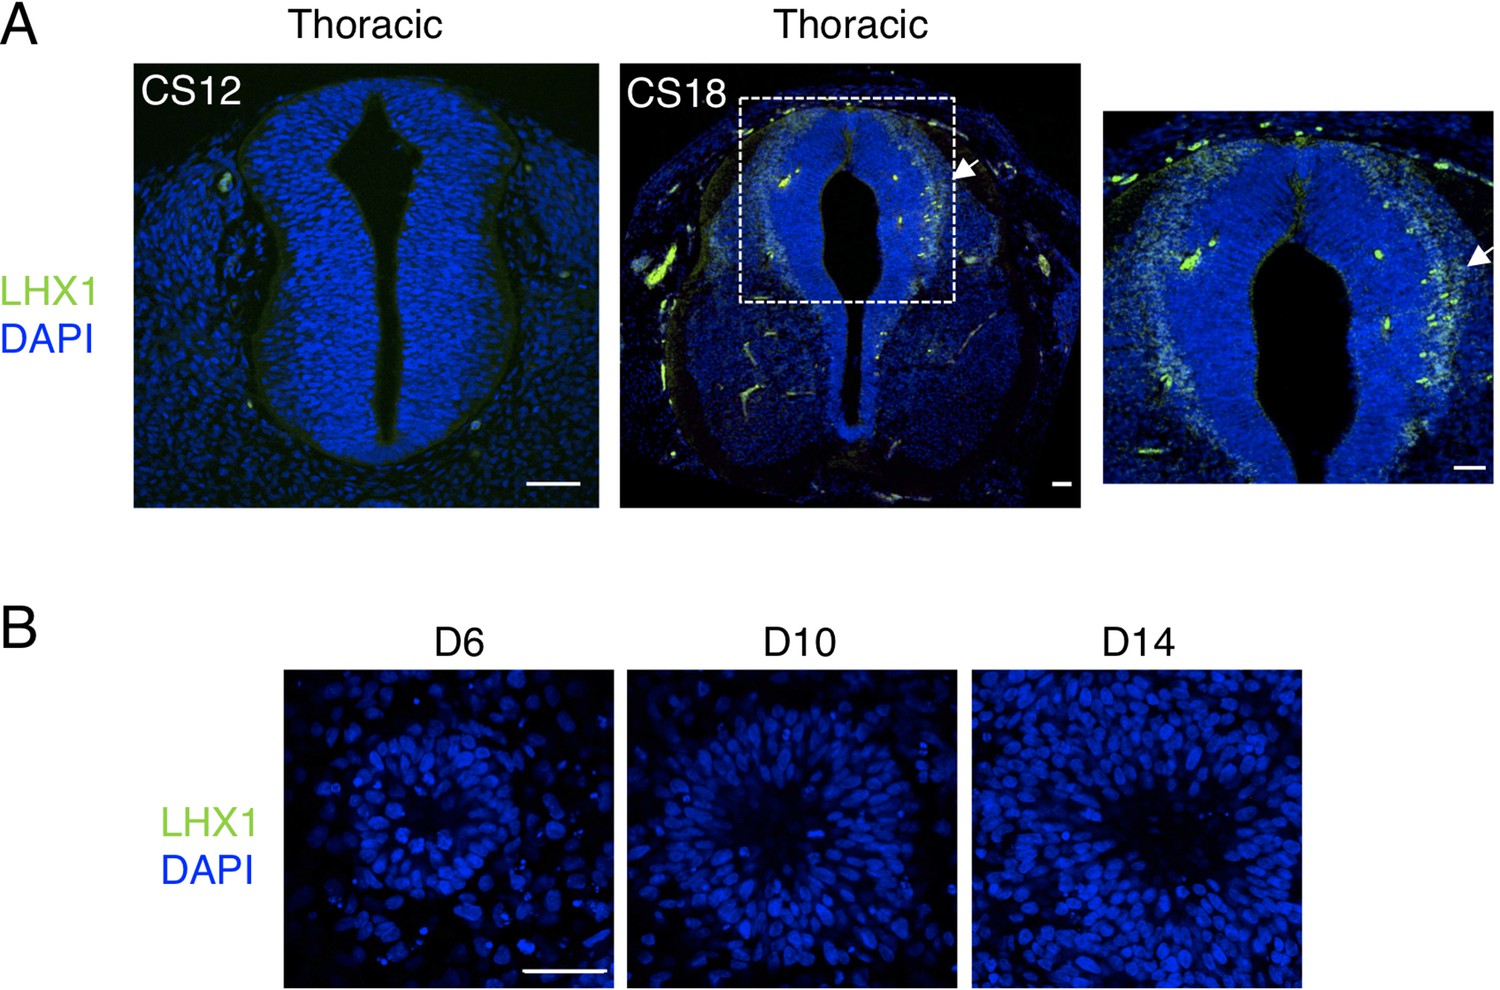
Dorsal interneurons type two expressing LHX1, dI2/LHX1, are not generated in human spinal cord neural rosettes in vitro.
(A) dl2 neuron differentiation analysed by IF for expression of LHX1 in stages CS12 and CS18 human embryonic spinal cord; note dI2 neurons are only detected at CS18 (arrow indicates LHX1 expressing cells, dashed white boxes indicate area of magnification in next adjacent image); (B) LHX1 is not detected in neural rosettes differentiated in vitro. Three sections were analysed at each stage in n = 1 CS12; n = 1 CS13; and n = 1 CS18 human embryos. Three independent cell differentiations were performed to generate rosettes. Five neural rosettes from each experiment were then analysed for quantification at each time point (n = 15). Data were analysed using non-parametric Mann–Whitney test. Scale bar = 50 μm.
Figure 3 with 1 supplement
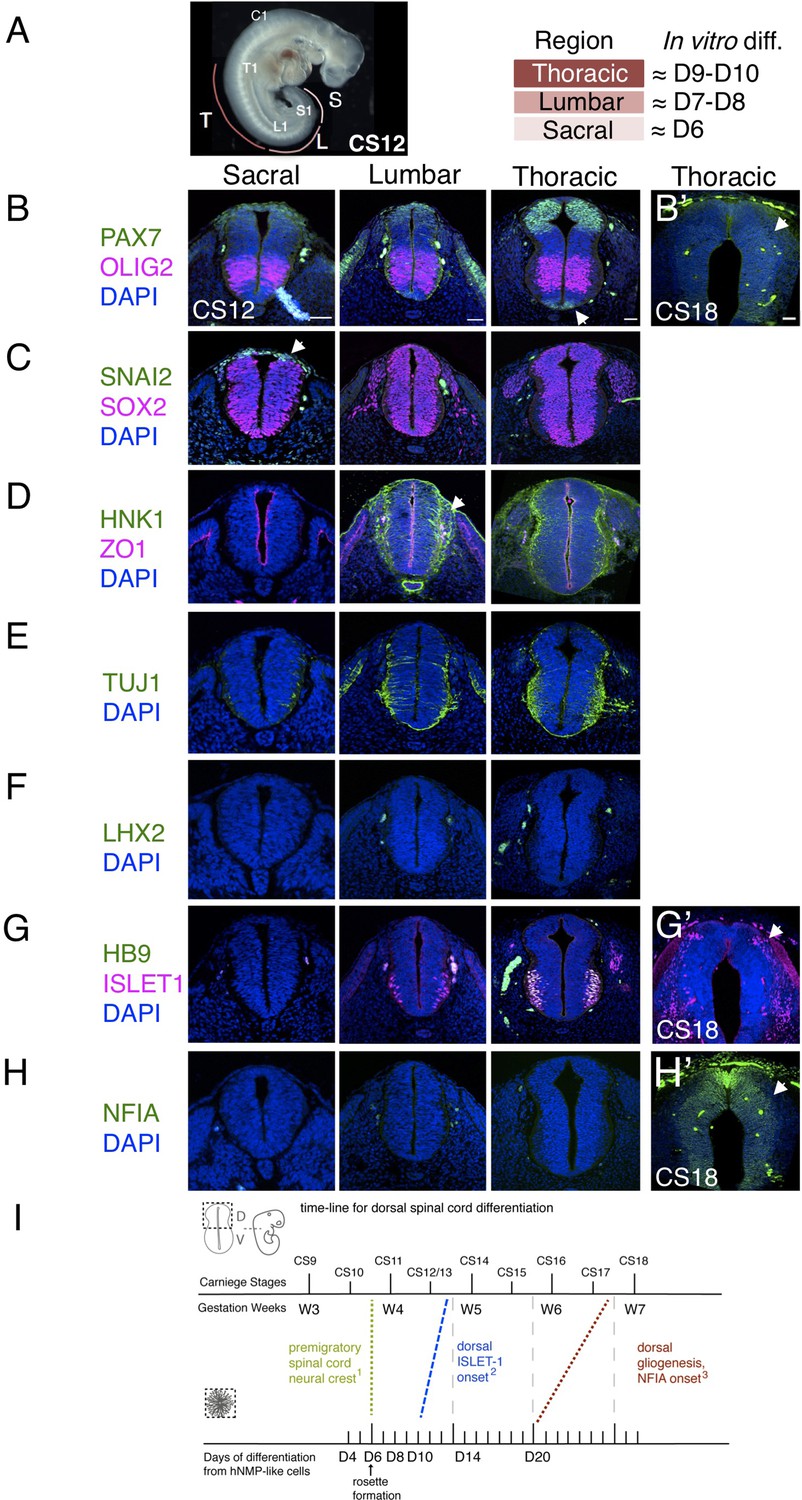
Characterization of neural progenitors and neuronal subtypes in human embryonic spinal cord and comparison with in vitro human neural rosette differentiation.
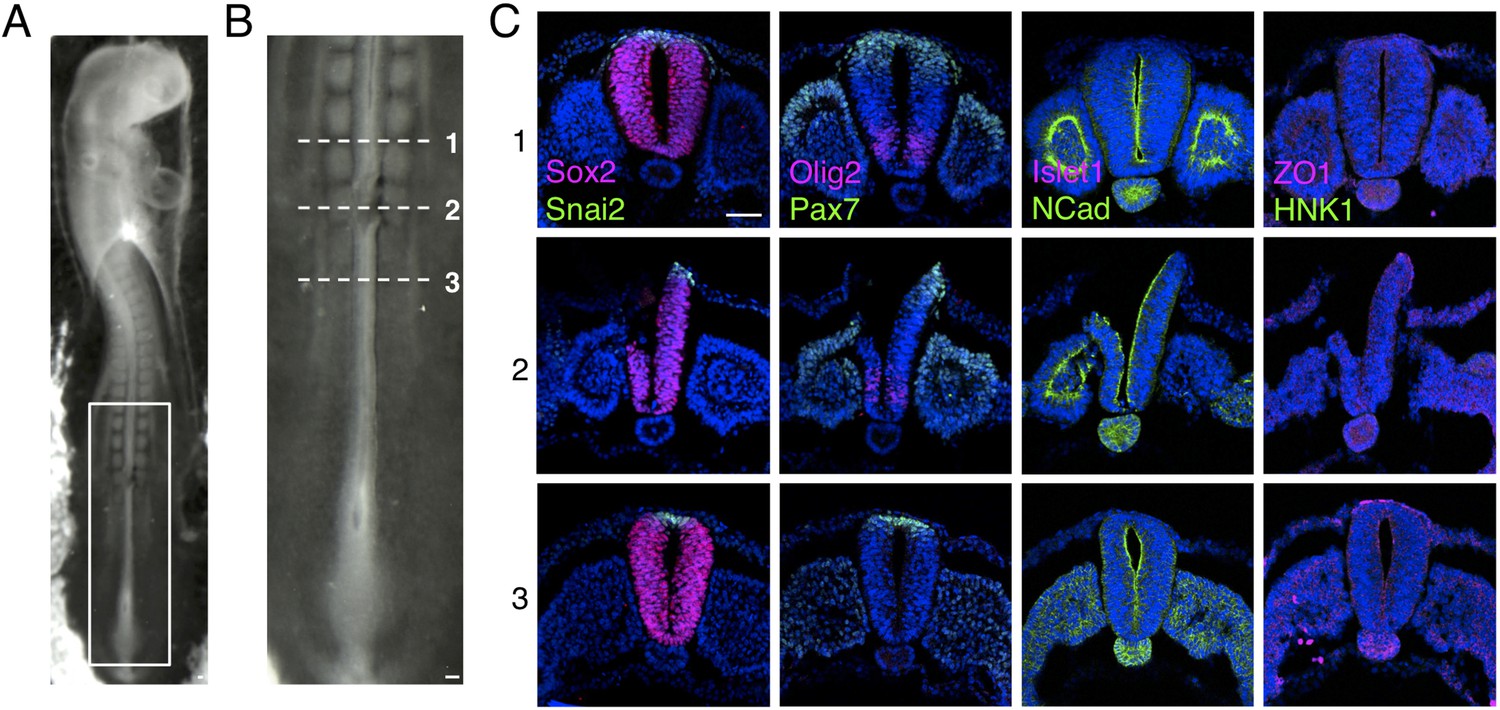
(A) CS12 human embryo with anatomical sub-regions indicated and their alignment with in vitro spinal cord rosette differentiation (see text); (B–H) transverse sections through human embryonic spinal cord at sacral, lumbar and thoracic levels at 4/4.5 weeks (CS12/CS13) and at brachial/thoracic at 7/7.5 weeks (CS18) analysed by IF for expression of (B, B’) dorsal, PAX7, or ventral, OLIG2, spinal cord progenitor markers (note novel PAX7 detection in the floor plate, arrow) and (B’) waning PAX7 at CS18 (arrow); (C) premigratory neural crest cell marker SNAI2 is only detected in sacral regions (arrow) shown here with pan-neural progenitor marker SOX2; (D) differentiating migrating neural crest expressing HNK1 emerges from the lumbar region (arrow); (E) neuronal differentiation detected with pan-neuronal marker TUJ1 is manifest dorsally in lumbar regions; dorsal interneurons indicated by (F) dI1 specific transcription factor LHX2 and (G) dI3 identifying ISLET1 expressing cells were not detected dorsally in any region of the spinal cord at CS12/CS13; (G’) dorsal ISLET1 interneurons at CS18; (H, H’) gliogenesis marker NFIA detected dorsally only at CS18; (I) Schematic aligning dorsal brachial/thoracic spinal cord differentiation in human embryo and in hPSC derived dorsal spinal cord rosettes, based on (1) Bondurand et al., 1998, O’Rahilly and Müller, 2007; (2) This study, Rayon et al., 2020, Marklund et al., 2014; (3) This study, Rayon et al., 2020; three sections were analysed at each level for each marker in n = 2 CS12/13 and n = 1 CS18 human embryos. Scale bar = 50 μm.
Figure 3—figure supplement 1
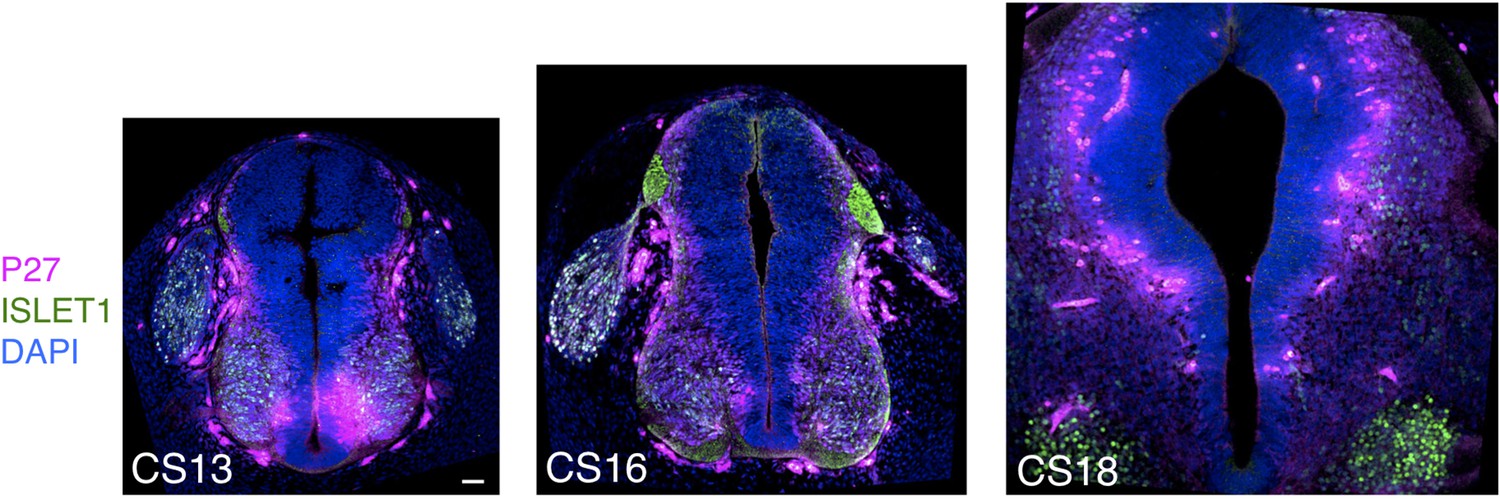
Expression patterns of neuronal markers P27 and ISLET1 in human embryonic spinal cord.
Neuronal differentiation detected with markers P27 and ISLET1 detected dorsally in the brachial/thoracic region in a CS13 embryonic stage and is strongly detected later at stages CS16 and CS18 Scale bar = Scale bar = 50 μm.
Figure 4 with 4 supplements

Iso-chronically transplanted hiPSC-derived neural rosettes exhibit cell intrinsic differentiation despite exposure to more rapidly developing chicken embryonic environment.
(A) Schematic of human dorsal spinal cord neural rosette transplantation experiment; (B-B’) two days after grafting human cells were observed in: (1) ICG: incorporated cell group or (2) ISC: incorporated single cells isolated within the chicken neural tube, or (3) CR: contiguous rosette with chick neural tube; (C–G) IF to detect key marker proteins in control (note, these non-grafted /sham operated embryos regenerate the dorsal neural tube by 2 days post-operation) and grafted embryos after 2 days incubation (C) ZO1, (D) SOX2, (E) PAX7, (F) P27, (G) ISLET1 (arrowheads indicate examples of candidate protein expressing cells in the chicken host tissue; arrow indicates examples of P27 and GFP co-expressing cells, dashed white boxes indicate area of magnification in next adjacent image), three transverse sections from each of at least three grafted chicken embryos were analysed for each marker combination and the proportions of SOX2/GFP+ ve, PAX7/GFP+ ve and P27/GFP+ ve cells in configurations 1, 2 or 3 were quantified, no ISLET1+ ve cells were found (this included three sections from three different grafts/embryos in which GFP+ ve cells were located within the chicken host Islet1 domain), each data point represents data from one histological section. Note that the small number of single cells (group 2) underlies lack of significant difference between groups (see Materials and Methods and metadata), data analysed with Mann–Whitney U test. Errors bars are ± SD. Scale bar = 50 μm.
-
Figure 4—source data 1
Quantifications indicating proportions of SOX2/GFP + ve, PAX7/GFP + ve, P27/GFP + ve and ISLET1/GFP + ve cells in configurations (1) ICG: incorporated cell group or (2) ISC: incorporated single cells isolated within the chicken neural tube, or (3) CR: contiguous rosette with chick neural tube, 2 days after isochronic transplantation.
- https://cdn.elifesciences.org/articles/67283/elife-67283-fig4-data1-v2.xlsx
Figure 4—figure supplement 1
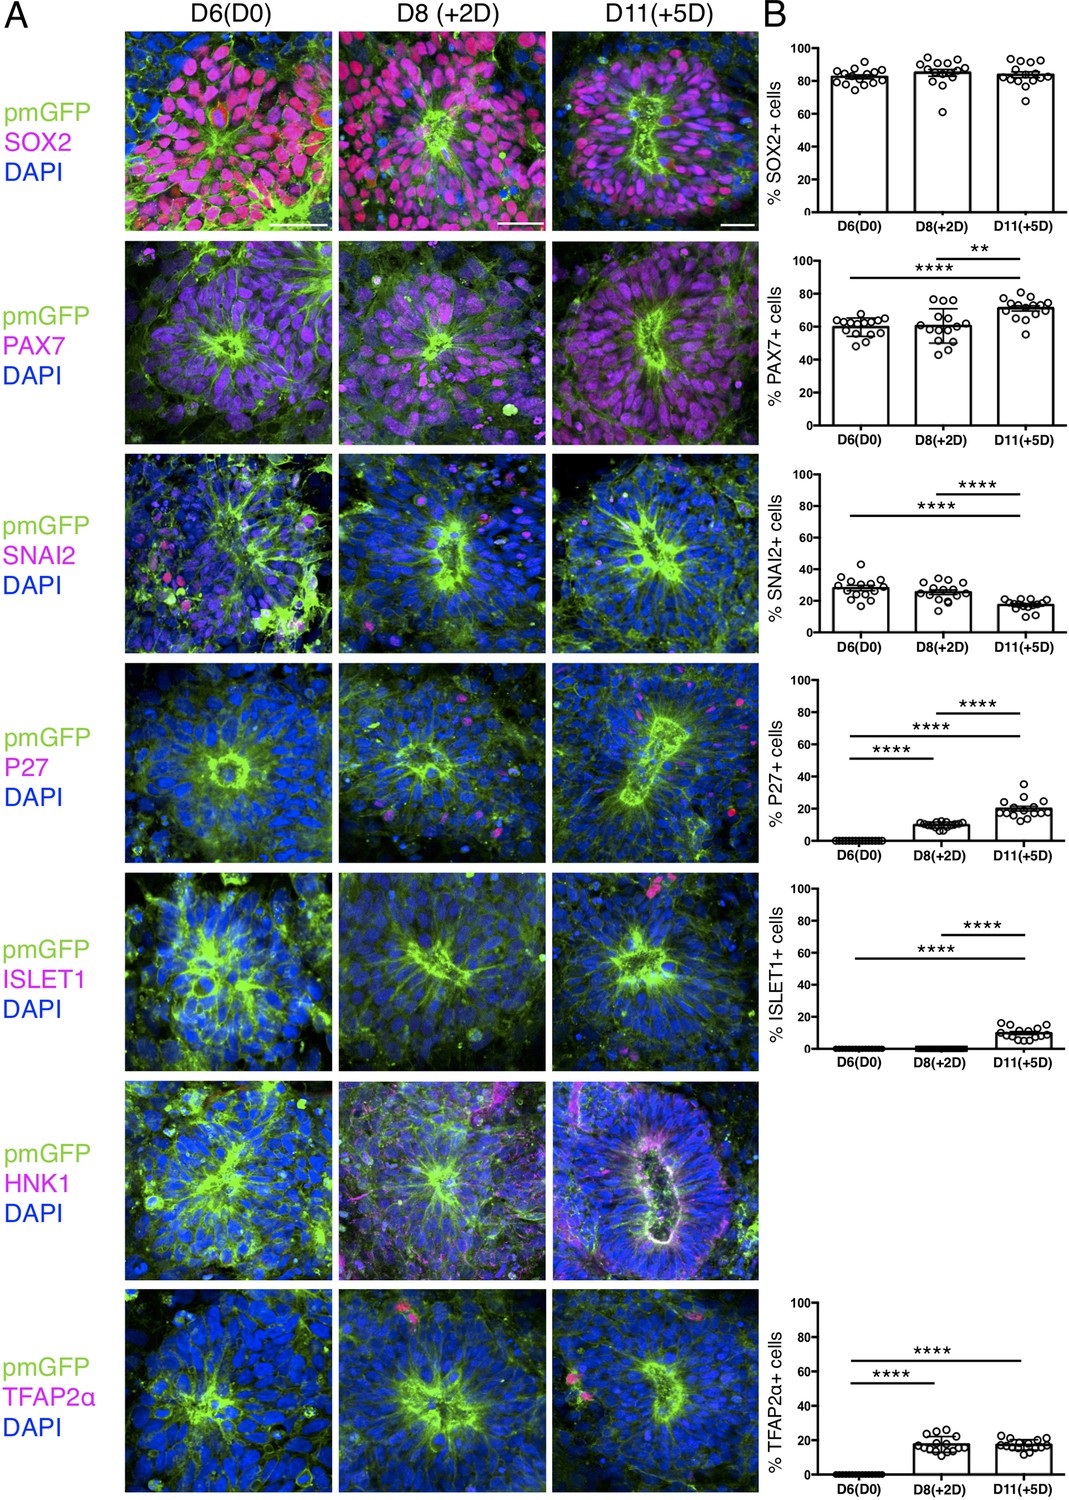
Expression patterns of key marker proteins in human iPSC derived dorsal spinal cord rosettes cultured in vitro in parallel with those iso-chronically grafted into chick spinal cord.
(A) Human dorsal spinal cord rosettes from the same differentiation assays used for Iso-chronic grafting experiments were cultured in parallel in vitro and subjected to IF for SOX2, PAX7, SNAI2, P27, ISLET1, HNK1 and TFAP2α SOX2, PAX7, and SNAI2 were expressed from D6(D0). P27, HNK1, and TFAP2α were detected from D8 (+2 D). ISLET1 was detected from D11 (+5 D). (B) Quantifications, percentage of cells in D6 rosettes expressing each marker on the day of grafting operation D6(D0), 2 days after transplantation (+2 D) which equals D8 in vitro, and 5 days after transplantation (+5 D), which equals D11 in vitro differentiation. Five rosettes from each of three independent differentiation experiments were used for quantifications, each data point represents data from a single rosette. See section ‘Materials and methods’ for statistical analysis. Errors bars are ± S.E.M. Probability of similarity, p-value: **p<0.01 and ****p<0.0001. Scale bar = 50 μm.
-
Figure 4—figure supplement 1—source data 1
Quantifications indicating proportions of cells expressing SOX2, PAX7, SNAI2, P27, ISLET1, and TFAP2α within a rosette differentiated from ChiPSC4-pmGFP from D6 cultured in parallel of transplantations experiments.
- https://cdn.elifesciences.org/articles/67283/elife-67283-fig4-figsupp1-data1-v2.xlsx
-
Figure 4—figure supplement 1—source data 2
Quantifications indicating proportions of cells expressing SOX2, PAX7, SNAI2, P27, ISLET1, and TFAP2α within a rosette differentiated from ChiPSC4-pmGFP from D8 cultured in parallel of transplantations experiments.
- https://cdn.elifesciences.org/articles/67283/elife-67283-fig4-figsupp1-data2-v2.xlsx
-
Figure 4—figure supplement 1—source data 3
Quantifications indicating proportions of cells expressing SOX2, PAX7, SNAI2, P27, ISLET1, and TFAP2α within a rosette differentiated from ChiPSC4-pmGFP from D11 cultured in parallel of transplantations experiments.
- https://cdn.elifesciences.org/articles/67283/elife-67283-fig4-figsupp1-data3-v2.xlsx
Figure 4—figure supplement 2
Dorsal region of the chicken neural tube removal prior to grafting.
(A) E2 (10–15 somite stage, HH 10/11+) chicken embryo following removal of the dorsal part of neural tube. (B) High magnification of the newly formed somite region, where the dorsal part of the neural tube was surgically removed prior to grafting. (C) Transverse sections of chicken neural tube subjected to IF for SOX2, SNAI2, PAX7, OLIG2, ISLET1, NCAD, ZO1, and HNK1 in the region anterior to the removal site (1), the removal region (2), and the region caudal to the site (3). The neural tube region removed is only composed of neural crest and neural progenitors expressing respectively SNAI2 and PAX7 and is similar to D6 human spinal cord neural rosettes. At least three chicken embryos and three sections were analysed for each marker combination. Scale bar = 50 μm.
Figure 4—figure supplement 3
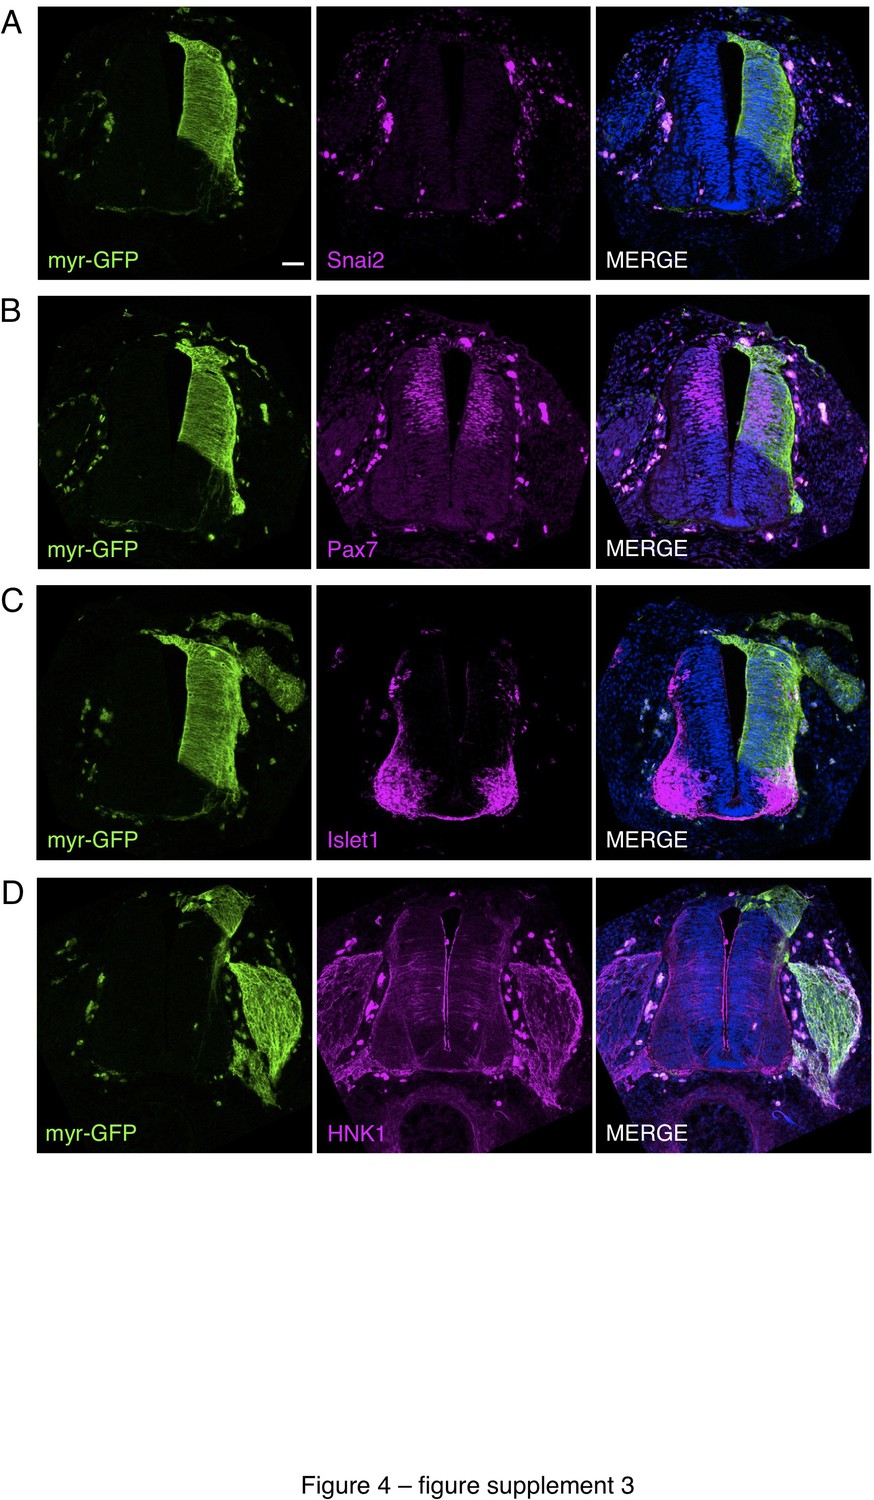
Iso-chronic, iso-topic transplantation of dorsal neural tube from chicken embryos expressing a plasma membrane tagged with GFP into wild-type chicken embryos.
To control for any disturbance in differentiation resulting from grafting procedures, the dorsal neural tube (~half of one side of the neural tube) from E2 (stage HH11-12) chicken embryos expressing plasma membrane tagged with GFP (Myr-GFP transgenic line) was transplanted in place of the same region of E2 wild-type chicken embryos. Transplanted embryos were allowed to develop for 2 days and fixed prior to analysis. (A–D) Transverse sections of transplanted chicken embryos subjected to IF for (A) Snai2, (B) Pax7, (C) Islet1, and (D) HNK1. At least three sections from three different chicken embryos and were analysed for each marker combination. Scale bar = 50 μm.
Figure 4—figure supplement 4
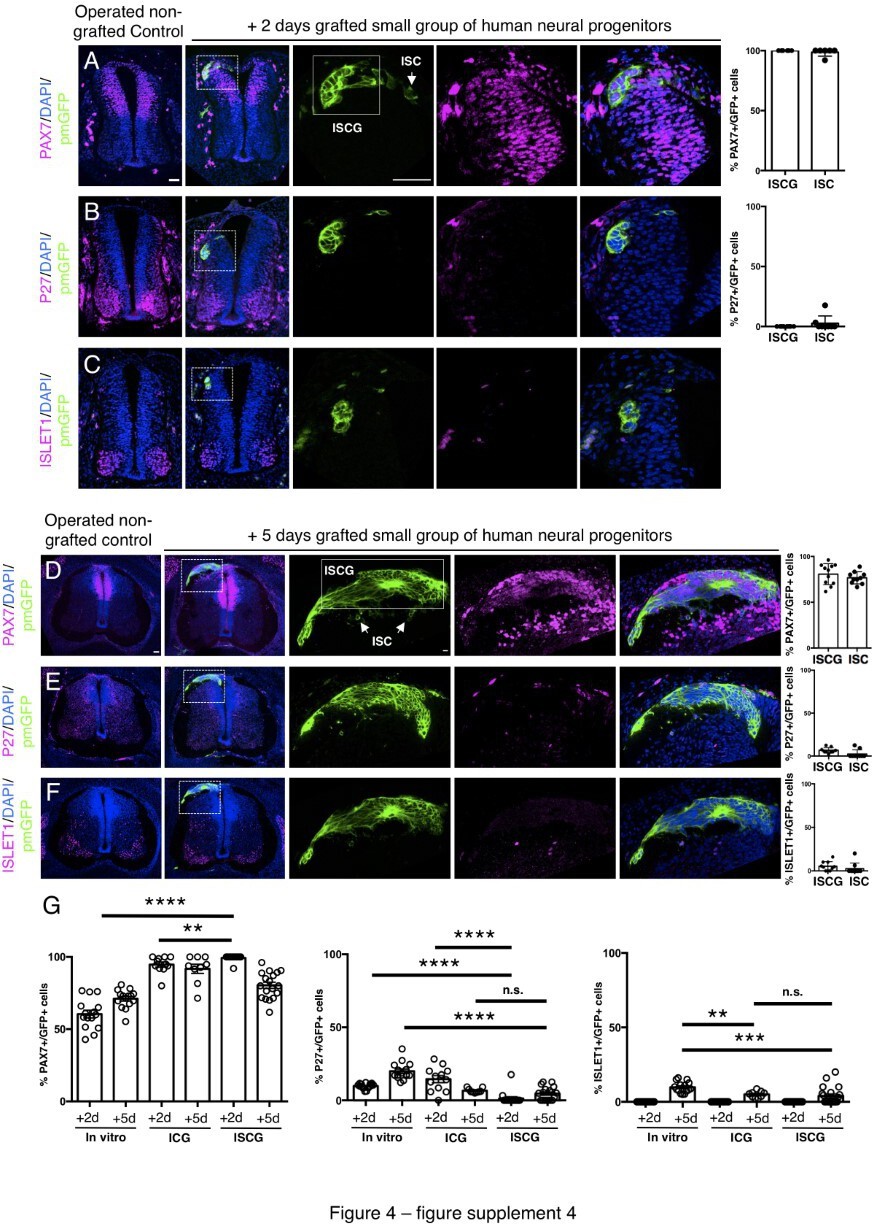
Small groups of D6 human neural progenitors exhibit similar differentiation timing to whole neural rosettes following iso-chronic transplantation.
(A–F) Detection of key marker proteins in chicken embryos after control sham operation (non-grafted) and after grafting with a small group of human neural progenitors assessed after 2 and 5 days incubation, (A and D) neural progenitor marker PAX7, (B and E) post-mitotic neuronal marker P27, and (C and F) dorsal interneuron type 3, dI3s, marker ISLET1 (note host ISLET expressing cells either side of GFP-expressing graft in C). Three transverse sections from each of at least three grafted chicken embryos were analysed for each marker and the proportions of PAX7/GFP+ ve, P27/GFP+ ve, ISLET1/GFP+ ve cells in configurations (1) ISCG: integrated small cell group, or (2) integrated single cells (ISC) were quantified, each data point represents quantification from one section (note, no ISLET1/GFP+ ve cells were found in 4 sections from three grafts/embryos in which GFP cells were located in the host ISLET1 domain). (G) Comparison of proportion of ChiPS4-pmGFP derived neural progenitors and neurons expressing PAX7, P27, and ISLET1 in rosettes cultured in vitro in parallel with those transplanted into chicken embryos (ICG within the chicken neural tube), and finally the smaller group of human transplanted cells (ISGC ), assessed after 2 and 5 days, each data point represents a single rosette (five rosettes quantified from each to three independent differentiations), see Figure 4—figure supplement 1 and proportion of cells expressing these same marker proteins in transplanted rosettes after 2 and 5 days in the chicken embryonic environment, each data point represents data from one section, with three sections from each of three grafted chick embryos, analysis Mann-Whitney U test. Errors bars are ± SD. p-values (see section ‘Materials and Methods’). Scale bar = 50 μm.
-
Figure 4—figure supplement 4—source data 1
Quantifications indicating proportions of PAX7/GFP + ve, P27/GFP + veand ISLET1/GFP + ve cells in configurations (1) ICG or (2) ISC isolated within the chicken neural tube, 2 days after isochronic transplantation of smaller group of human neural progenitors.
- https://cdn.elifesciences.org/articles/67283/elife-67283-fig4-figsupp4-data1-v2.xlsx
-
Figure 4—figure supplement 4—source data 2
Quantifications indicating proportions of PAX7/GFP + ve, P27/GFP + ve, and ISLET1/GFP + ve cells in configurations (1) ICG or (2) ISC: Incorporated Single Cells isolated within the chicken neural tube, 5 days after isochronic transplantation of smaller group of human neural progenitors.
- https://cdn.elifesciences.org/articles/67283/elife-67283-fig4-figsupp4-data2-v2.xlsx
Figure 5 with 1 supplement
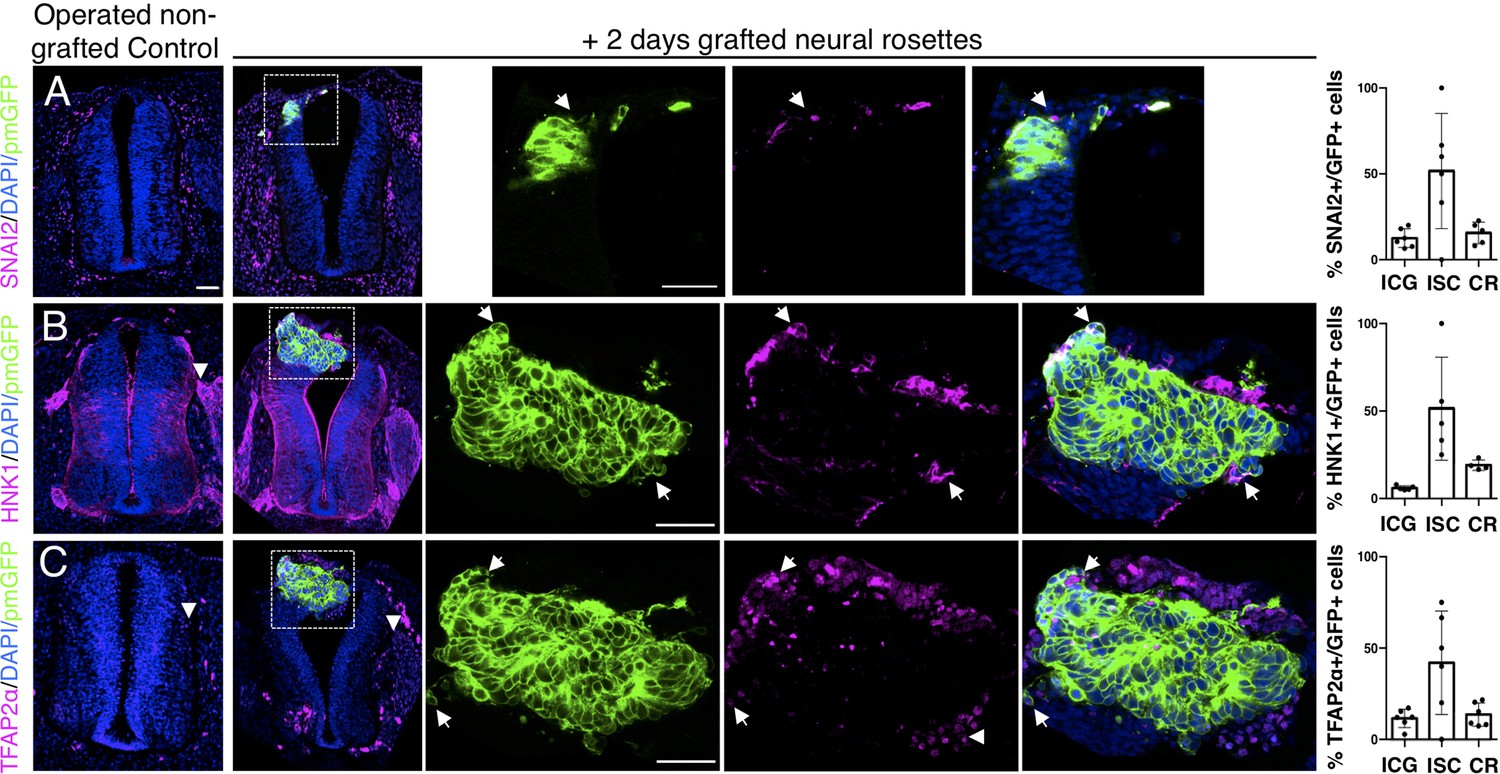
Iso-chronically transplanted hiPSC-derived neural rosettes exhibit cell intrinsic neural crest differentiation in the chicken embryonic environment.
(A–C) IF to detect key neural crest marker proteins in control (non-grafted) and grafted embryos after 2 days incubation (A) SNAIL2, (B) HNK1, (C) TFAP2α (arrowheads indicate examples of candidate protein expressing cells in the chicken host tissue; arrows indicate examples of candidate protein and GFP co-expressing cells, note most cells at graft periphery, dashed white boxes indicate area of magnification in next adjacent image). Three transverse sections from each of at least three grafted chicken embryos were analysed for each marker and the proportions of SNAIL2/GFP+ ve, HNK1/GFP+ ve, and TFAP2α /GFP+ ve cells in cell configurations (1) ICG or (2) ISC within the chicken neural tube, or (3) CR with chick neural tube, each data point represents data from one histological section, note the small number of isolated cells (group 2) underlies lack of significant difference between groups (see section ‘Materials and Methods’), data analysed with Mann–Whitney U test. Errors bars are ± SD. Scale bar = 50μm.
-
Figure 5—source data 1
Quantifications indicating proportions of SNAI2/GFP+ ve, HNK1/GFP+ ve,and TFAP2α /GFP+ ve cells in configurations (1) ICG or (2) ISC isolated within the chicken neural tube, or (3) CR with chick neural tube, 2 days after isochronic transplantation.
- https://cdn.elifesciences.org/articles/67283/elife-67283-fig5-data1-v2.xlsx
Figure 5—figure supplement 1
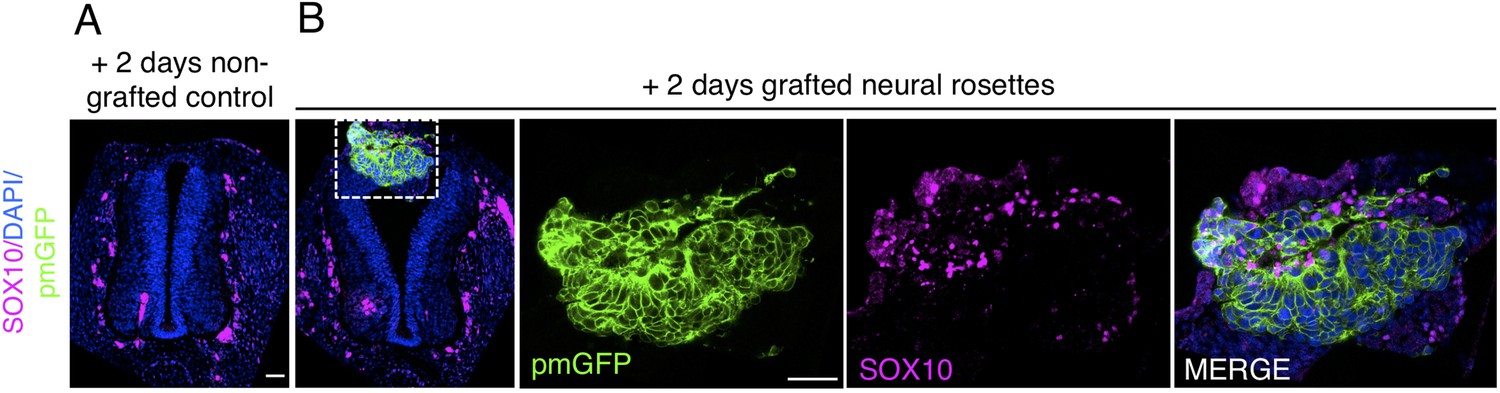
Transplanted human dorsal spinal cord rosettes express SOX10, a specific marker of differentiated neural crest 2 days after grafting.
(IF) to detect expression of the neural crest marker (A) SOX10 in control operated/non-grafted, and (B) grafted chicken embryo following 2 days incubation (dashed white box indicates area of magnification in next adjacent image). One chicken embryo and three sections were analysed. Scale bar = 50 μm.
Figure 6
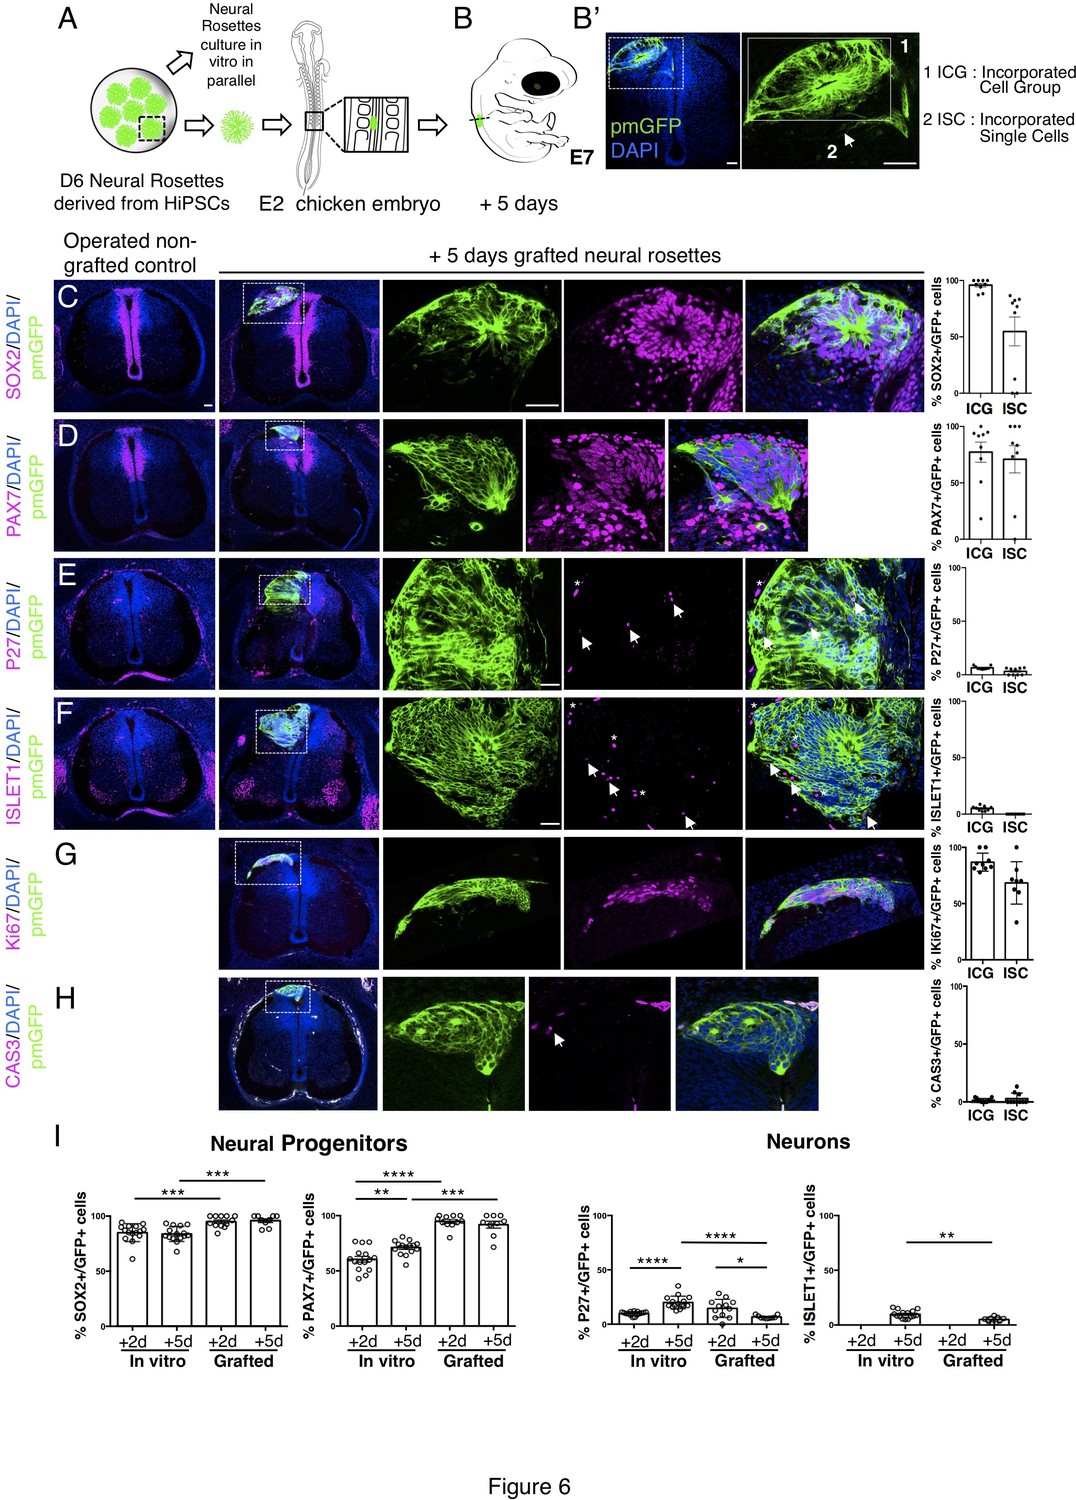
Long-term analysis reveals impaired neuronal differentiation and cell type specification in iso-chronically grafted human neural rosettes.
(A) Schematic of human dorsal spinal cord neural rosette transplantation protocol and (B-B’) transplanted cell configurations 5 days after transplantation; (C–H) IF to detect key marker proteins in control (non-grafted) and grafted chicken embryos after 5 days incubation, neural progenitor markers (C) SOX2, and (D) PAX7, post-mitotic neuronal (E) P27 and dorsal interneuron type 3, dI3s, (F) ISLET1 markers, proliferative cell marker (G) Ki67 and cell death marker (H) CASPASE-3 (arrows indicate examples of P27 or ISLET1 and GFP co-expressing cells, dashed white boxes indicate area of magnification in next adjacent image, asterisks indicate examples of host blood cells). Three transverse sections from each of at least three grafted chicken embryos were analysed for each marker and the proportions of SOX2/GFP+ ve, PAX7/GFP+ ve, P27/GFP+ ve, ISLET1/GFP+ ve, Ki67/GFP+ ve, and CAS-3/ GFP + ve cells in configurations (1) ICG or (2) ISC within the chicken neural tube were quantified, each data point represents one section analysed, no significant differences were found between expression in ICG and ISC; (G) comparison of proportion of ChiPS4-pmGFP derived neural progenitors and neurons expressing SOX2, PAX7, P27, and ISLET1 in rosettes cultured in vitro in parallel with those transplanted into chicken embryos, assessed after 2 and 5 days, each data point represents a single rosette (five rosettes sampled from each to three independent differentiations), see Figure 4—figure supplement 1 and proportions of these same marker proteins in transplanted rosettes after 2 and 5 days in chicken embryonic environment, each data point represents data from one section, with three sections from each of three grafted chick embryos, analysis Mann–Whitney U test. Errors bars are ± SD. p-values (see section ‘Materials and Methods’). Scale bar = 50 μm.
-
Figure 6—source data 1
Quantifications indicating proportions of SOX2/GFP+ ve, PAX7/GFP+ ve, P27/GFP+ ve, and ISLET1/GFP + ve cells in configurations (1) ICG or (2) ISC isolated within the chicken neural tube, 5 days after isochronic transplantation.
- https://cdn.elifesciences.org/articles/67283/elife-67283-fig6-data1-v2.xlsx
-
Figure 6—source data 2
Quantifications indicating proportions of Ki67/GFP+ ve and CAS3/GFP + ve cells in configurations (1) ICG: Incorporated Cell Group or (2) ISC: Incorporated Single Cells isolated within the chicken neural tube, 5 days after isochronic transplantation.
- https://cdn.elifesciences.org/articles/67283/elife-67283-fig6-data2-v2.xlsx
Figure 7 with 1 supplement
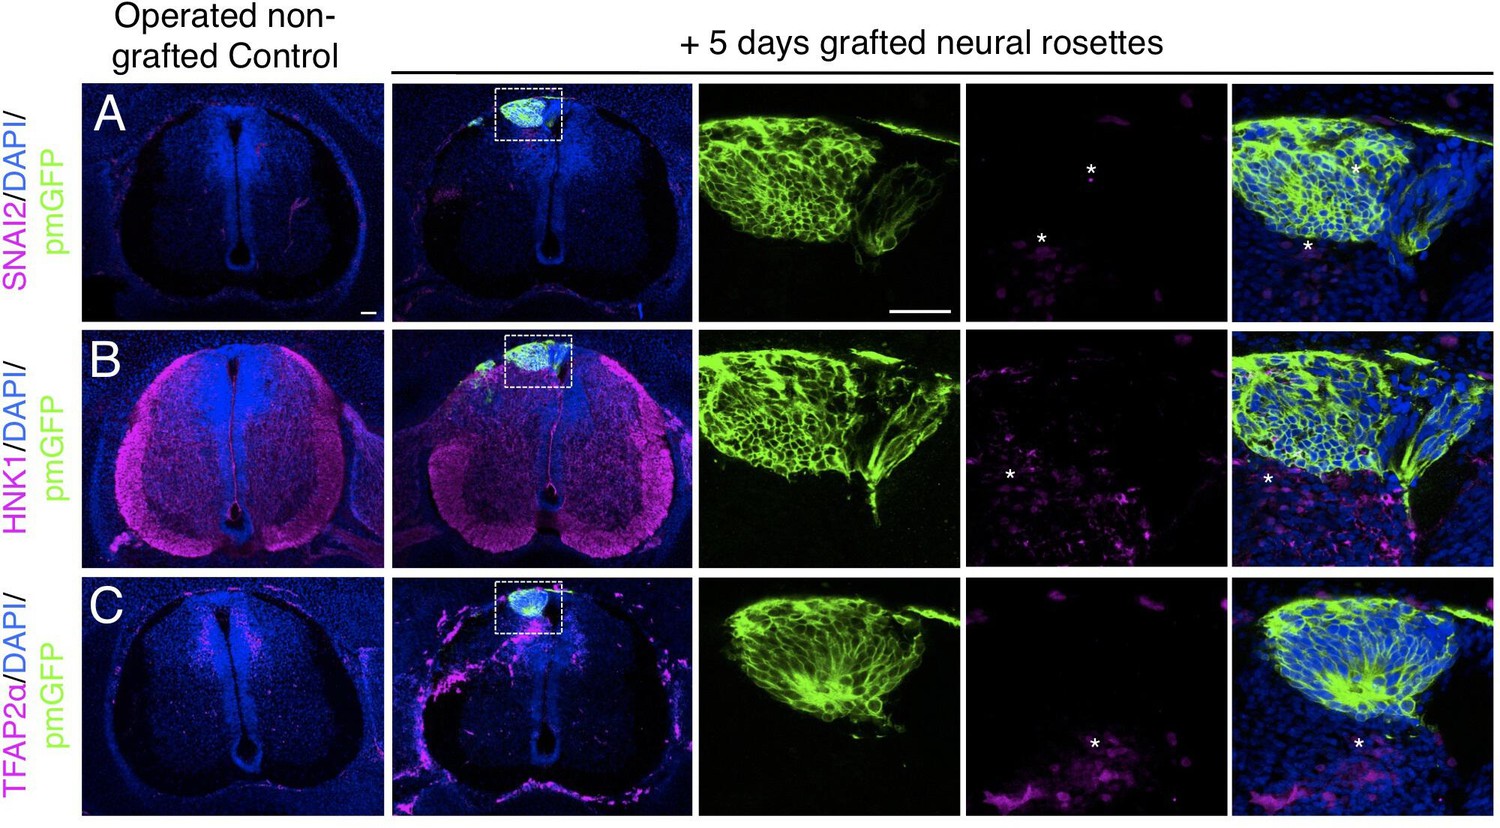
Long-term analysis reveals no neural crest differentiation in iso-chronically grafted human neural rosettes.
(A–C) IF to detect key neural crest marker proteins in control (non-grafted) and grafted chicken embryos after 5 days incubation reveals no expression of neural crest progenitor markers in any cell configurations (A) SNAI2 (1: 0/860 GFP+ cells and 2: 0/70 GFP+ cells), (B) differentiated neural crest cells HNK1 (1: 0/956 GFP+ cells and 2: 0/57 GFP+ cells) and (C) TFAP2α (1: 0/1175 GFP+ cells and 2: 0/66 GFP+ cells) (asterisks indicate host blood cells). At least three chicken embryos and three cross-sections were analysed for each marker. Scale bar = 50 μm.
-
Figure 7—source data 1
Quantifications indicating proportions of SNAI2/GFP+ ve, HNK1/GFP+ ve, and TFAP2α /GFP+ ve cells within the chicken neural tube, 5 days after isochronic transplantation.
- https://cdn.elifesciences.org/articles/67283/elife-67283-fig7-data1-v2.xlsx
Figure 7—figure supplement 1
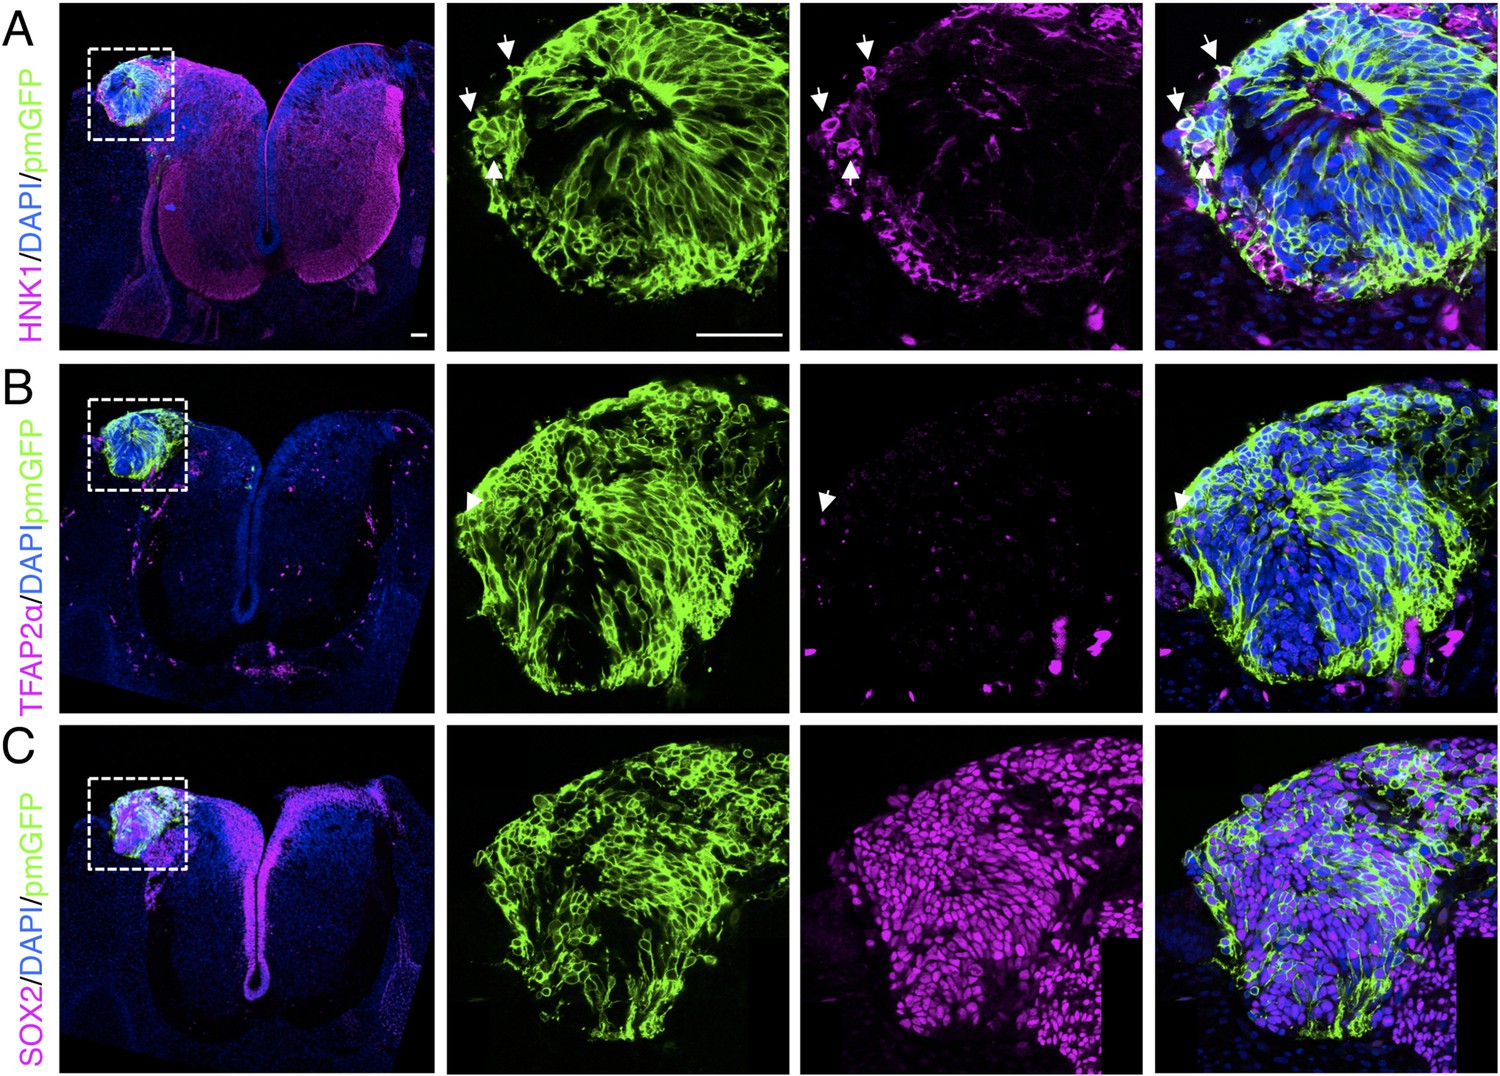
Ectopically positioned human dorsal spinal cord rosette reveals retention of ability to differentiate into neural crest.
Chicken open neural tube with a human dorsal spinal cord rosette following transplantation 5 days previously, analysed with IF to detect expression of differentiated neural crest cell markers (A) HNK1, (B) TFAP2α, and (C) pan-neural marker SOX2 (arrows indicate examples of cells co-expressing protein of interest and GFP, dashed white boxes indicate area of magnification in next adjacent image). One chicken embryo and three sections were analysed. Scale bar = 50 μm.
Figure 8
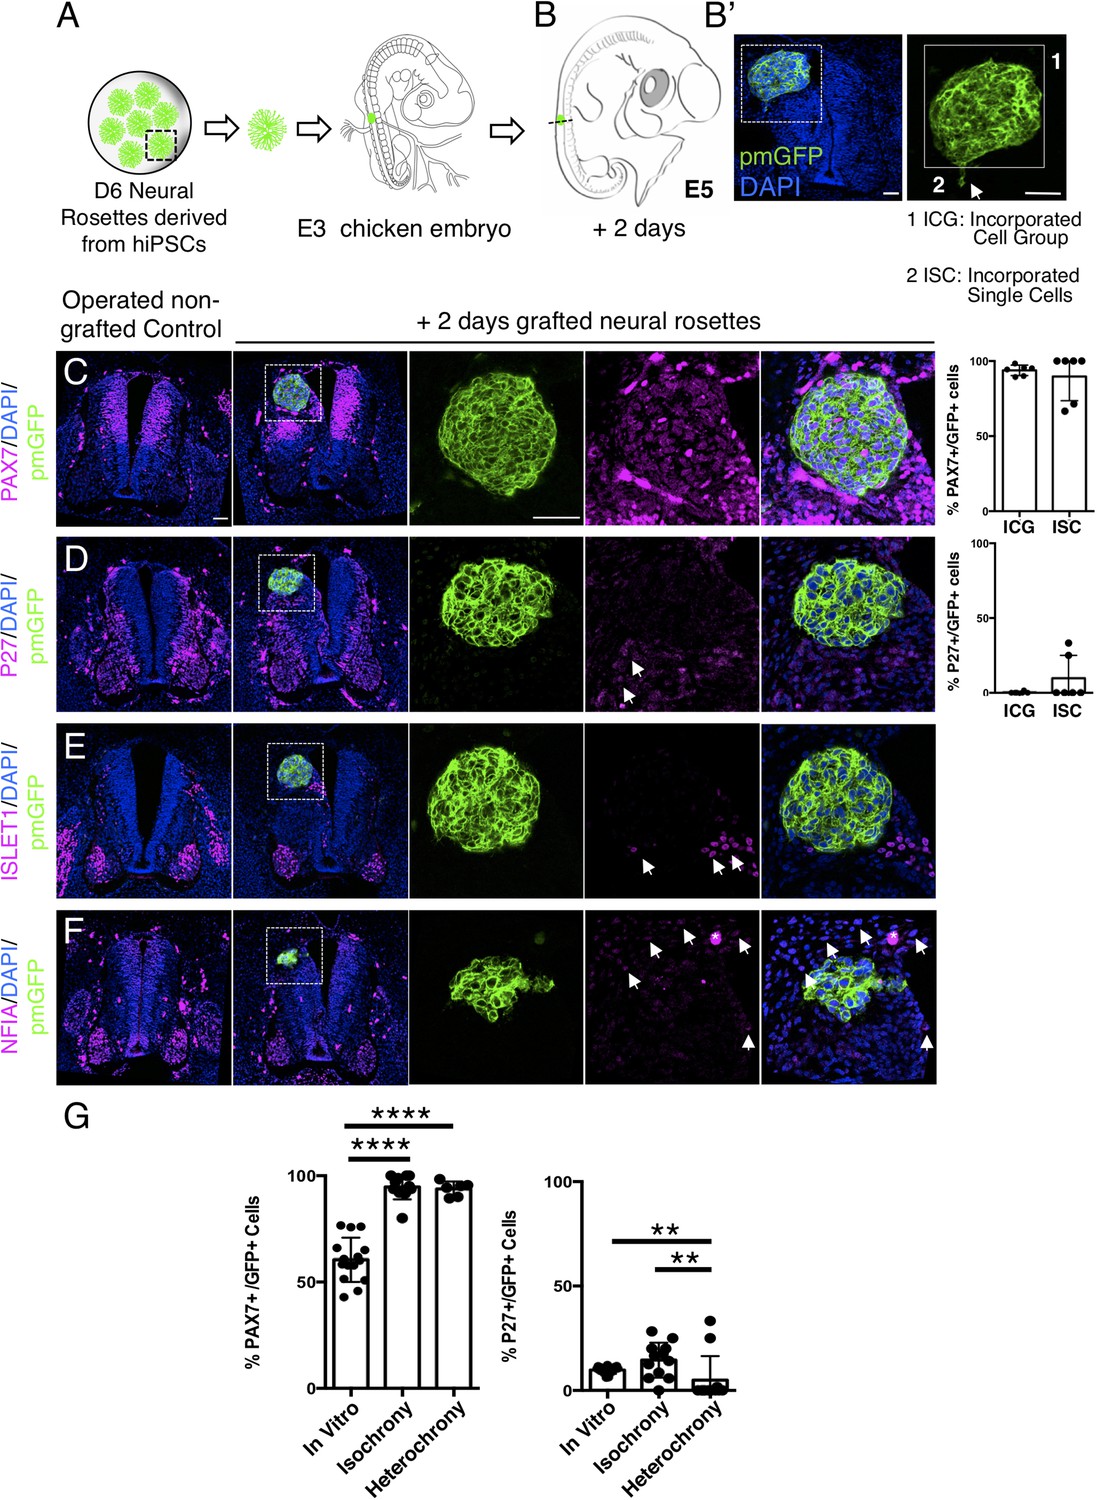
Hetero-chronically transplanted hiPSC-derived neural rosettes exhibit reduced neuronal differentiation despite exposure to more rapidly developing chicken embryonic environment.
(A) Schematic of human dorsal spinal cord neural rosette transplantation experiment; (B-B’) Two days after grafting human cells were observed in: (1) ICG or (2) ISC within the chicken neural tube. Note the E3 chicken embryo has a less regulative response to hemi-dorsal tube removal, this did not alter expression of differentiation markers, but distorted tissue morphology in some operated non-grafted controls; (C–F) IF to detect key marker proteins in control (note, these non-grafted /sham operated embryos regenerate the dorsal neural tube by 2 days post-operation) and grafted embryos after 2 days incubation (C) PAX7, (D) P27, (E) ISLET1, and (F) glial marker, NFIA (dashed white boxes indicate area of magnification in next adjacent image), three transverse sections from each of at least three grafted chicken embryos were analysed for each marker combination and the proportions of PAX7/GFP + ve and P27/GFP + ve cells in configurations 1 and 2 were quantified, each data point represents data from one histological section(see ‘Materials and Methods’); (E) comparison of proportion of ChiPS4-pmGFP derived neural progenitors and neurons expressing PAX7 and P27 in rosettes cultured in vitro in parallel with those transplanted iso-chronically and hetero-chronically into chicken embryos, assessed after 2 days, each data point represents a single rosette (five rosettes sampled from each to three independent differentiations), see Figure 4—figure supplement 1, and proportions of these same marker proteins in transplanted rosettes after 2 days in chicken embryonic environment, each data point represents all data from one section, with three sections from each of three grafted chicken embryos, analysis Mann–Whitney U test. Errors bars are± SD. p-values (see ‘Materials and Methods’). Scale bar = 50 μm.
-
Figure 8—source data 1
Quantifications indicating proportions of PAX7/GFP+ ve, P27/GFP+ ve, ISLET1/ GFP + ve, and NFIA/GFP+ ve cells in configurations (1) ICG or (2) ISC isolated within the chicken neural tube, 2 days after heterochronic transplantation.
- https://cdn.elifesciences.org/articles/67283/elife-67283-fig8-data1-v2.xlsx
Figure 9
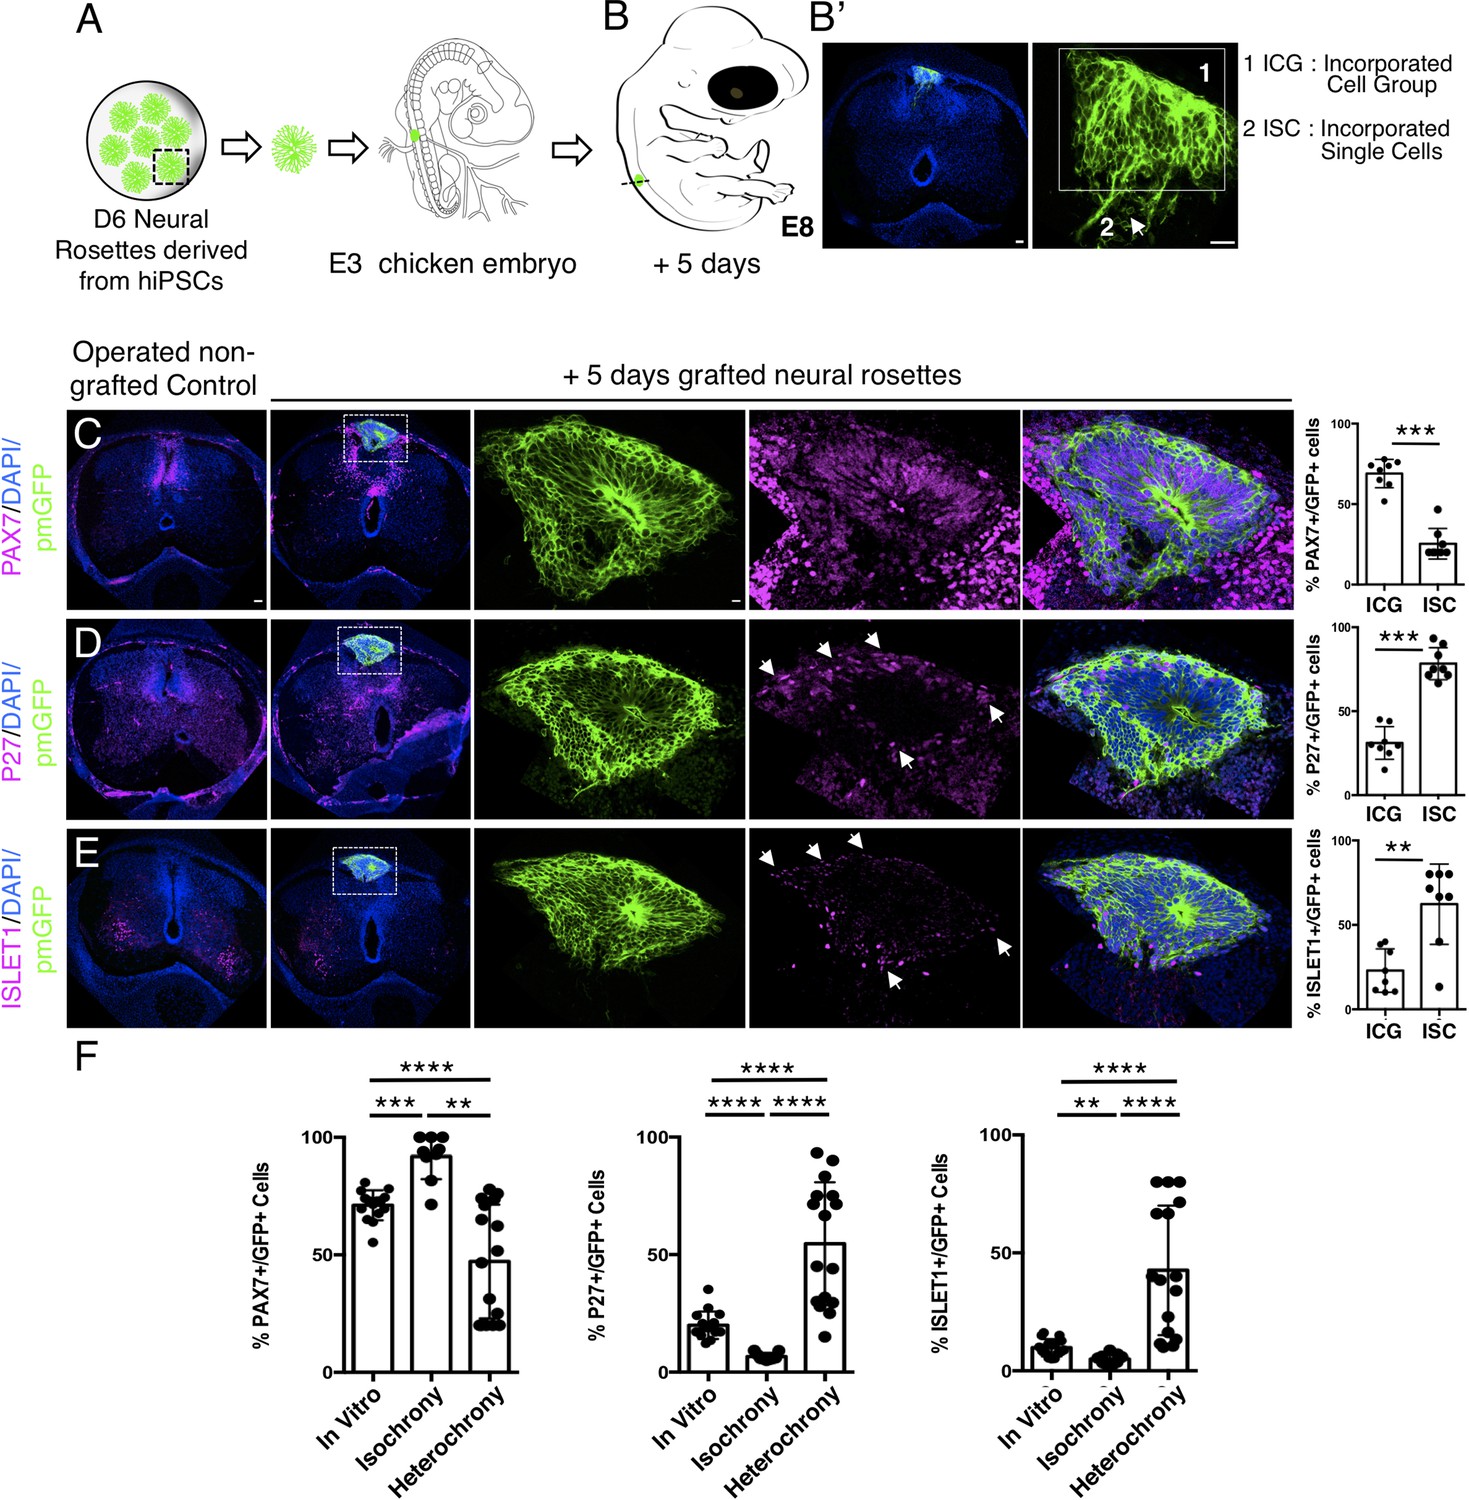
Longer-term analysis reveals increased neuronal differentiation in hetero-chronically transplanted human neural rosette.
(A) Schematic of human dorsal spinal cord neural rosette transplantation experiment; (B-B’) Five days after grafting human cells were observed in: (1) ICG or (2) ISC within the chicken neural tube. (C–E) IF to detect key marker proteins in control (non-grafted) and grafted chicken embryos after 5 days incubation, (C) neural progenitor marker PAX7, (D) post-mitotic neuronal P27, and (E) dorsal interneuron type 3, dI3s, marker ISLET1, (arrows indicate examples of P27 or ISLET1 and GFP co-expressing cells, dashed white boxes indicate area of magnification in next adjacent image). Three transverse sections from each of at least three grafted chicken embryos were analysed for each marker and the proportions of PAX7/GFP+ ve, P27/GFP+ ve, and ISLET1/GFP+ ve cells in configurations one or two were quantified, each data point represents counts from one histological section; (F) comparison of proportion of ChiPS4-pmGFP derived neural progenitors and neurons expressing PAX7, P27, or ISLET1 in rosettes cultured in vitro in parallel with those transplanted iso-chronically and hetero-chronically into chicken embryos, assessed after 5 days, each data point represents data from a single rosette (five rosettes sampled from each of three independent differentiations), see Figure 4—figure supplement 1, and proportions of these same marker proteins in transplanted rosettes after 5 days in the chicken embryonic environment, each data point represents all data from one section, with three sections from each of three grafted chick embryos, analysis Mann–Whitney U test. Errors bars are ± SD. p-values (see section ‘Materials and methods’). Scale bar = 50 μm.
-
Figure 9—source data 1
Quantifications indicating proportions of PAX7/GFP+ ve, P27/GFP+ ve, and ISLET1/ GFP + ve cells in configurations (1) ICG or (2) ISC isolated within the chicken neural tube, 5 days after heterochronic transplantation.
- https://cdn.elifesciences.org/articles/67283/elife-67283-fig9-data1-v2.xlsx
Figure 10
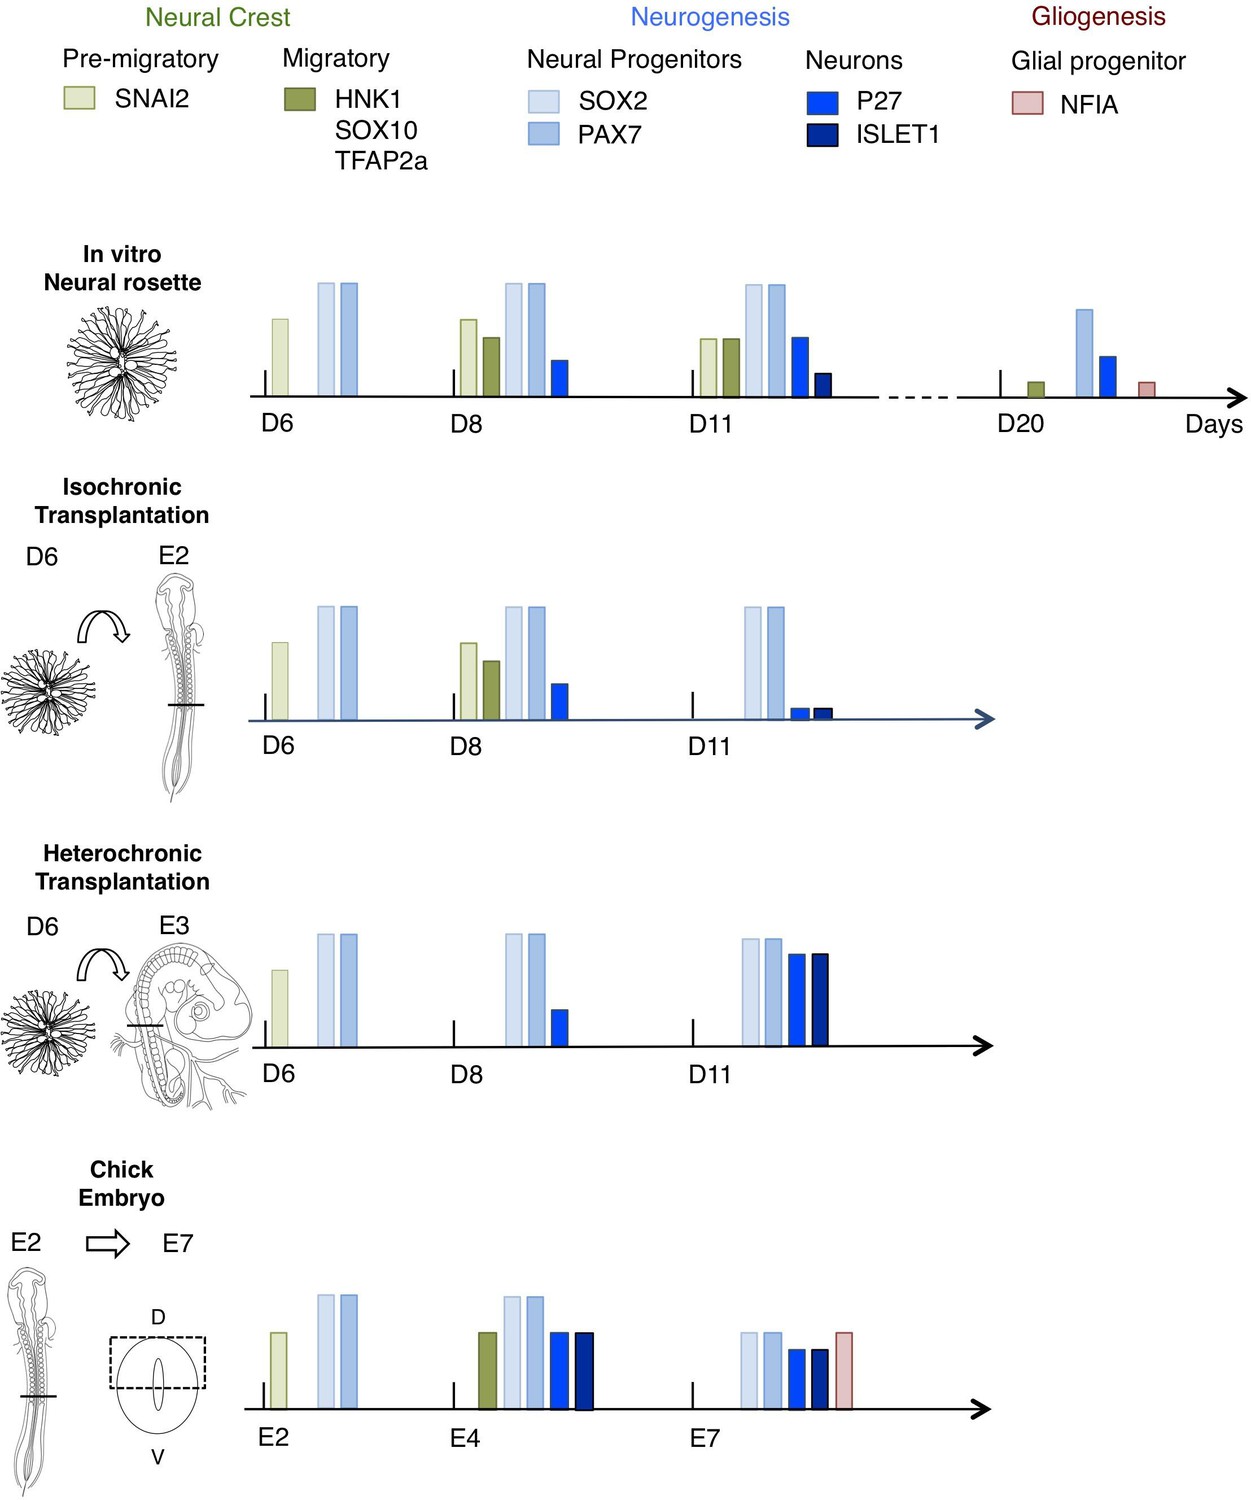
Schematic summary comparison of dorsal spinal cord differentiation in rosettes in vitro and following iso-chronic or hetero-chronic grafting and in the developing chicken embryo.
The timing of differentiation from a dorsal spinal cord neural rosette composed of SOX2/ PAX7 neural progenitors and pre-migratory neural crest cells expressing SNAI2, into neurons (expressing P27 or ISLET1) and migratory neural crest cells (expressing HNK1, TFAP2a and SOX10) and subsequent gliogenesis in these distinct conditions is indicated (D is day of rosette differentiation from NMP-Like cells in vitro, days from transplantation of D6 rosettes is shown for transplantation experiments, and E is for Embryonic day of development in the chicken embryo). Note neural crest was not detected following hetero-chronic transplantation after 2 days (D8) and was not assessed at 5 days (D11). All empty slots represent no marker detection.
Tables
Key resources table
| Reagent type (species) or resource | Designation | Source or reference | Identifiers | Additional information |
|---|---|---|---|---|
| Genetic reagent (Homo sapiens) | Human embryo tissue (stage CS12, CS13, CS16 CS18) | Human Developmental Biology Resource (HDBR: https://www.hdbr.org) | ||
| Cell line (Homo sapiens) | ChiPSC4 line | Cellartis, AB and HPCF, University of Dundee | RRID:CVCL_RM97 | Cell line maintained in HPCFUniversity of Dundee(Dr Lindsay Davidson) |
| Cell line (Homo sapiens) | hESCs line (H9) | WiCell | RRID:CVCL_9773 | |
| Cell line (Homo sapiens) | hESCs line (H1) expressing DCXCit/Y | Allen Institute and WiCell | PMID:28094016 | Dr Boaz Levi |
| Biological sample (Chicken eggs) | myr-GFP Chicken embryos | National Avian Research Facility Roslin Institute, University of Edinburgh | PMID:25812521 | |
| Antibody | anti-SOX2(Goat polyclonal) | Immune Systems | Cat# GT15098, RRID: AB_2732043 | IF (1:200) |
| Antibody | anti-ZO1(Rabbit polyclonal) | Invitrogen ThermoFisher | Cat# 40–2200RRID:AB_2533456 | IF (1:500) |
| Antibody | anti-N-Cadherin(Mouse monoclonal) | Sigma-Aldrich | Cat# C3865RRID:AB_262097 | IF (1:500) |
| Antibody | anti-TUJ1(Rabbit polyclonal) | Sigma-Aldrich | Cat# T2200RRID:AB_262133 | IF (1:1000) |
| Antibody | anti-TUJ1(Mouse monoclonal) | BioLegend | Cat# 801,201RRID:AB_2313773 | IF (1:1000) |
| Antibody | anti-OLIG2(Rabbit polyclonal) | Millipore | Cat# AB9610RRID:AB_570666 | IF (1:200) |
| Antibody | anti-LHX2(Rabbit polyclonal) | Sigma-Aldrich | Cat# HPA000838RRID:AB_2666109 | IF (1:200) |
| Antibody | anti-ISLET1(Rabbit polyclonal) | Abcam | Cat# Ab20670RRID:AB_881306 | IF (1:200) |
| Antibody | anti-HB9(Mouse monoclonal) | Developmental Studies Hybridoma Bank (DSHB) | Cat# 81.5C10RRID:AB_2145209 | IF (1:10) |
| Antibody | anti-SNAI2(Rabbit polyclonal) | Cell Signalling Technology | Cat# 9,585RRID:AB_2239535 | IF (1:200) |
| Antibody | anti-SOX10(Goat polyclonal) | R&D Systems | Cat# AF2864-SPRRID:AB_442208 | IF (1:200) |
| Antibody | anti-TFAP2α(Mouse monoclonal) | Santa Cruz | Cat# sc8975RRID:AB_2240215 | IF (1:10) |
| Antibody | anti-HNK1(Mouse monoclonal) | Developmental Studies Hybridoma Bank (DSHB) | Cat# 3H5RRID:AB_2314644 | IF (1:10) |
| Antibody | anti-P27(Mouse monoclonal) | BD Biosciences | Cat# BD610642RRID:AB_397637 | IF (1:100) |
| Antibody | anti-activated CASPASE3(Mouse monoclonal) | Sigma-Aldrich | Cat# MAB10753RRID:AB_2904207 | IF (1:200) |
| Antibody | anti-Ki67(Rat monoclonal) | Invitrogen ThermoFisher | Cat# 14-5698-82RRID:AB_10854564 | IF (1:200) |
| Antibody | anti-NFIA(Mouse monoclonal) | Sigma-Aldrich | Cat# HPA008884RRID:AB_1854421 | IF (1:200) |
| Antibody | anti-PAX7(Mouse monoclonal) | Developmental Studies Hybridoma Bank (DSHB) | Cat# PAX7RRID:AB_2299243 | IF (1:10) |
| Antibody | anti-PAX6(Mouse monoclonal) | R&D Systems | Cat# MAB1260RRID:AB_2159696 | IF (1:100) |
| Antibody | anti-goat 594(Donkey clonality unknown) | ThermoFisher | Cat# A-11058RRID:AB_142540 | IF (1:500) |
| Antibody | anti-mouse 488(Donkey clonality unknown) | ThermoFisher | Cat# A-21202RRID:AB_141607 | IF (1:500) |
| Antibody | anti-mouse 568(Donkey clonality unknown) | ThermoFisher | Cat# A-10037RRID:AB_2534013 | IF (1:500) |
| Antibody | anti-rabbit 488(Donkey clonality unknown) | ThermoFisher | Cat# A-21206RRID:AB_2535792 | IF (1:500) |
| Antibody | anti-rabbit 568(Donkey clonality unknown) | ThermoFisher | Cat# A-10042RRID:AB_2534017 | IF (1:500) |
| Recombinant DNA reagent | aPX1 (Plasmid) | Dr Timothy A. Sanders | Dr Timothy A. Sanders,University of Chicago | |
| Peptide, recombinant protein | bFGF | PreproTech | Cat# 100-18B | 20 ng/ml |
| Peptide, recombinant protein | Noggin | PreproTech | Cat# 120–10 C | 50 ng/ml |
| Commercial assay or kit | Neon Transfection System 10 μl Kit | ThermoFisher | Cat# MPK1025 | |
| Commercial assay or kit | pENTR /D-TOPO Cloning Kit | ThermoFisher | Cat# K240020 | |
| Commercial assay or kit | Gateway LR Clonase Enzyme mix | ThermoFisher | Cat# 11791019 | |
| Chemical compound, drug | All-trans-Retinoic Acid | Sigma-Aldrich | Cat# R2625 | 100 nM |
| Chemical compound, drug | CHIR 99021 | Tocris | Cat# 4,953 | 3 μM |
| Chemical compound, drug | SB431542 | Tocris | Cat# 1,614 | 10 μM |
| Chemical compound, drug | Y-27632 | Tocris | Cat# 1,254 | 10 μM |
| Software, algorithm | GraphPadPrism | GraphPad Software | RRID:SCR_002798 | https://www. graphpad. com/ |
| Other | DAPI stain | Invitrogen | D1306 | (1 μg/ml) |
| Other | Neurobasal Medium, minus phenol red | Gibco | Cat# 12348017 | 500 ml |
| Other | B-27 Supplement | Gibco | Cat# 17504044 | (1:50) |
| Other | N-2 Supplement | Gibco | Cat# A1370701 | (1:100) |
| Other | Glutamax | Gibco | Cat# 35050061 | (1:100) |
| Other | Geltrex | Life Technologies | Cat# A1413302 | |
| Other | TryPLE select | ThermoFisher | Cat# 12563011 |
Additional files
Download links
A two-part list of links to download the article, or parts of the article, in various formats.
Downloads (link to download the article as PDF)
Open citations (links to open the citations from this article in various online reference manager services)
Cite this article (links to download the citations from this article in formats compatible with various reference manager tools)
Human spinal cord in vitro differentiation pace is initially maintained in heterologous embryonic environments
eLife 11:e67283.
https://doi.org/10.7554/eLife.67283


