Role of the transcriptional regulator SP140 in resistance to bacterial infections via repression of type I interferons
- Division of Immunology and Pathogenesis, Department of Molecular and Cell Biology, University of California, Berkeley, United States
- Howard Hughes Medical Institute, University of California, Berkeley, United States
- Cancer Research Laboratory, University of California, Berkeley, United States
- Department of Pathology, University of California, San Francisco, United States
- Department of Cell Biology, Ribeirão Preto Medical School, University of São Paulo, Brazil
- The National Emerging Infectious Diseases Laboratory, Department of Medicine (Pulmonary Center), and Department of Microbiology, Boston University School of Medicine, United States
- Division of Biochemistry, Biophysics and Structural Biology, Department of Molecular and Cell Biology, University of California, Berkeley, United States
- Department of Plant and Microbial Biology, University of California, Berkeley, United States
- Department of Microbiology, New York University Grossman School of Medicine, United States
Figures
Figure 1 with 1 supplement
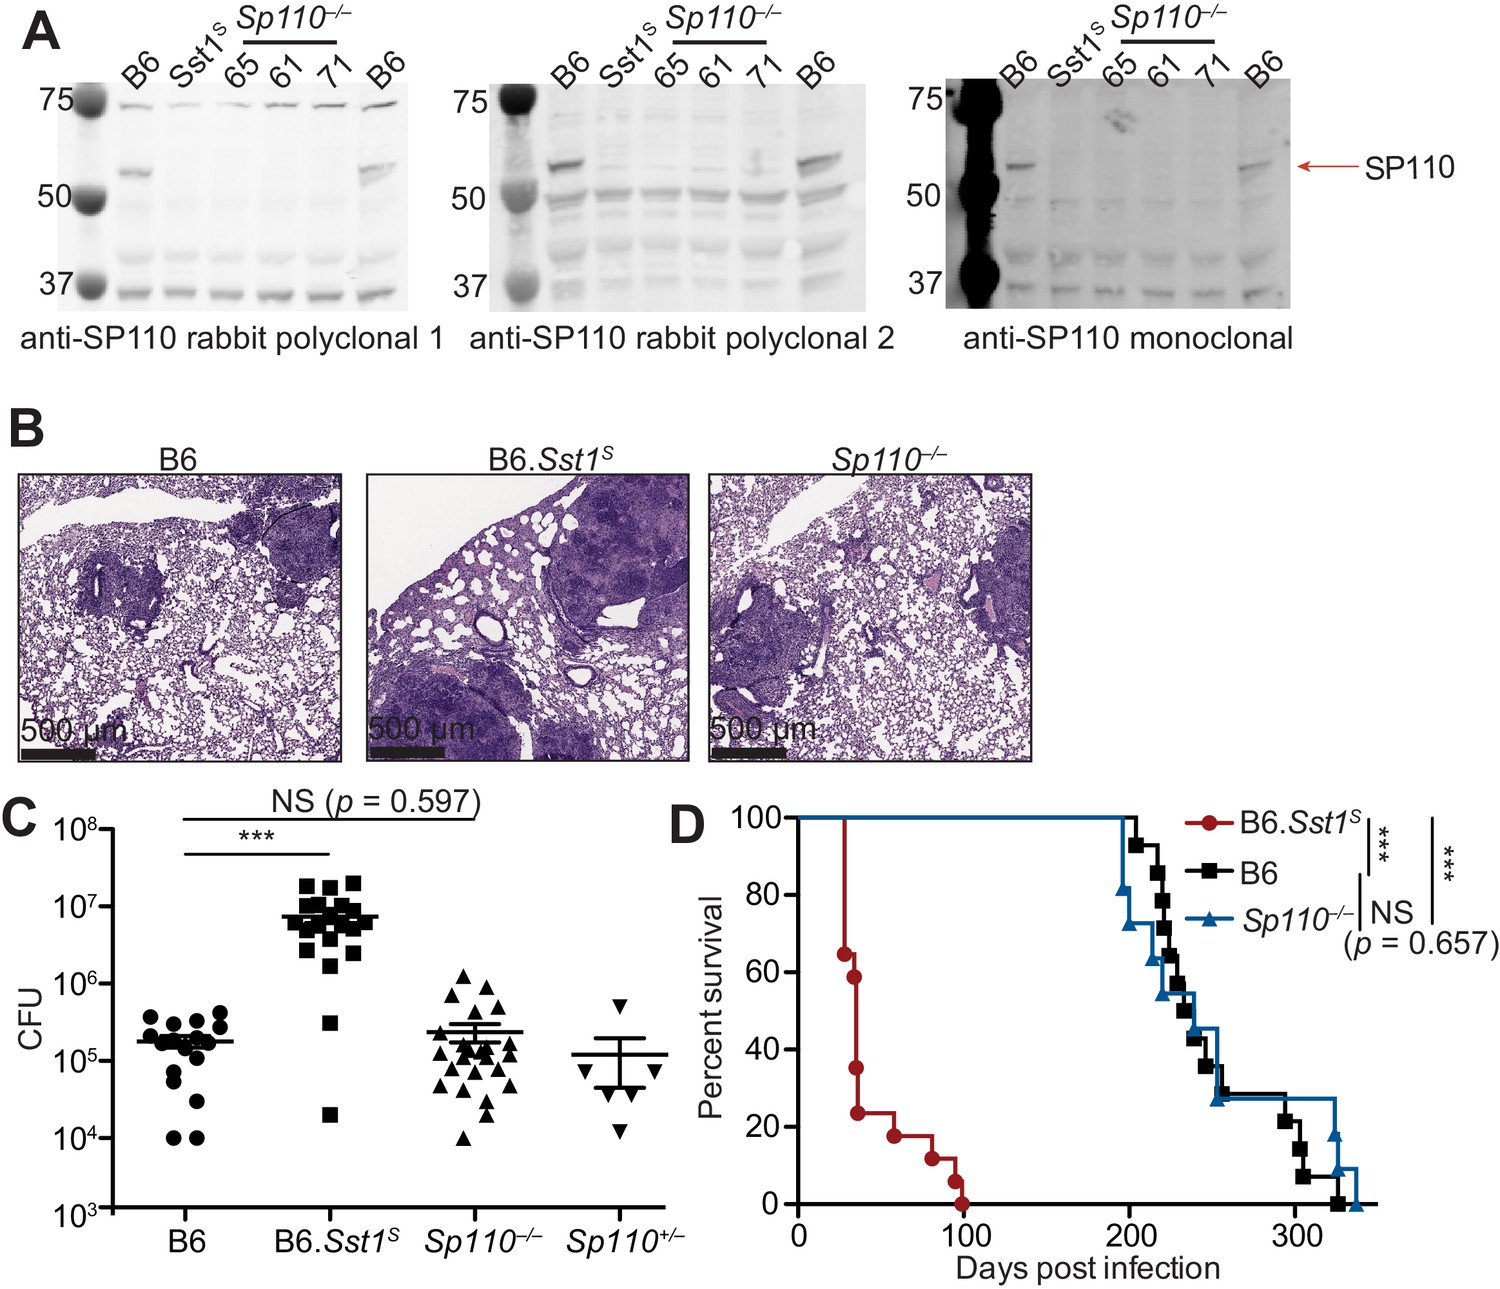
Sp110–/– mice are not susceptible to Mycobacterium tuberculosis infections.
(A) BMMs were treated with 10 U/ml of IFNγ for 24 hr and cells were lysed with RIPA buffer. Five micrograms of total protein was loaded on each lane, and immunoblot was performed with respective antibodies as shown. Molecular weight standards are shown on the left of each blot in kDa. Individual membranes were imaged separately. Three independent lines of Sp110–/– mice were analyzed (denoted lines 61, 65, and 71). (B–D) Lungs of mice infected with M. tuberculosis were stained with hematoxylin and eosin (H&E) for histology (B), measured for CFU at 25 days post-infection (Mann-Whitney test) (C), or monitored for survival (D). All except B6 mice were bred in-house, and combined results from the three independent Sp110–/– lines are shown. Representative of two experiments (B, D); combined results of three infections (C). *p≤0.05; **p≤0.01; ***p≤0.005. BMM, bone marrow-derived macrophage; CFU, colony-forming unit; RIPA, radioimmunoprecipitation assay.
Figure 1—figure supplement 1
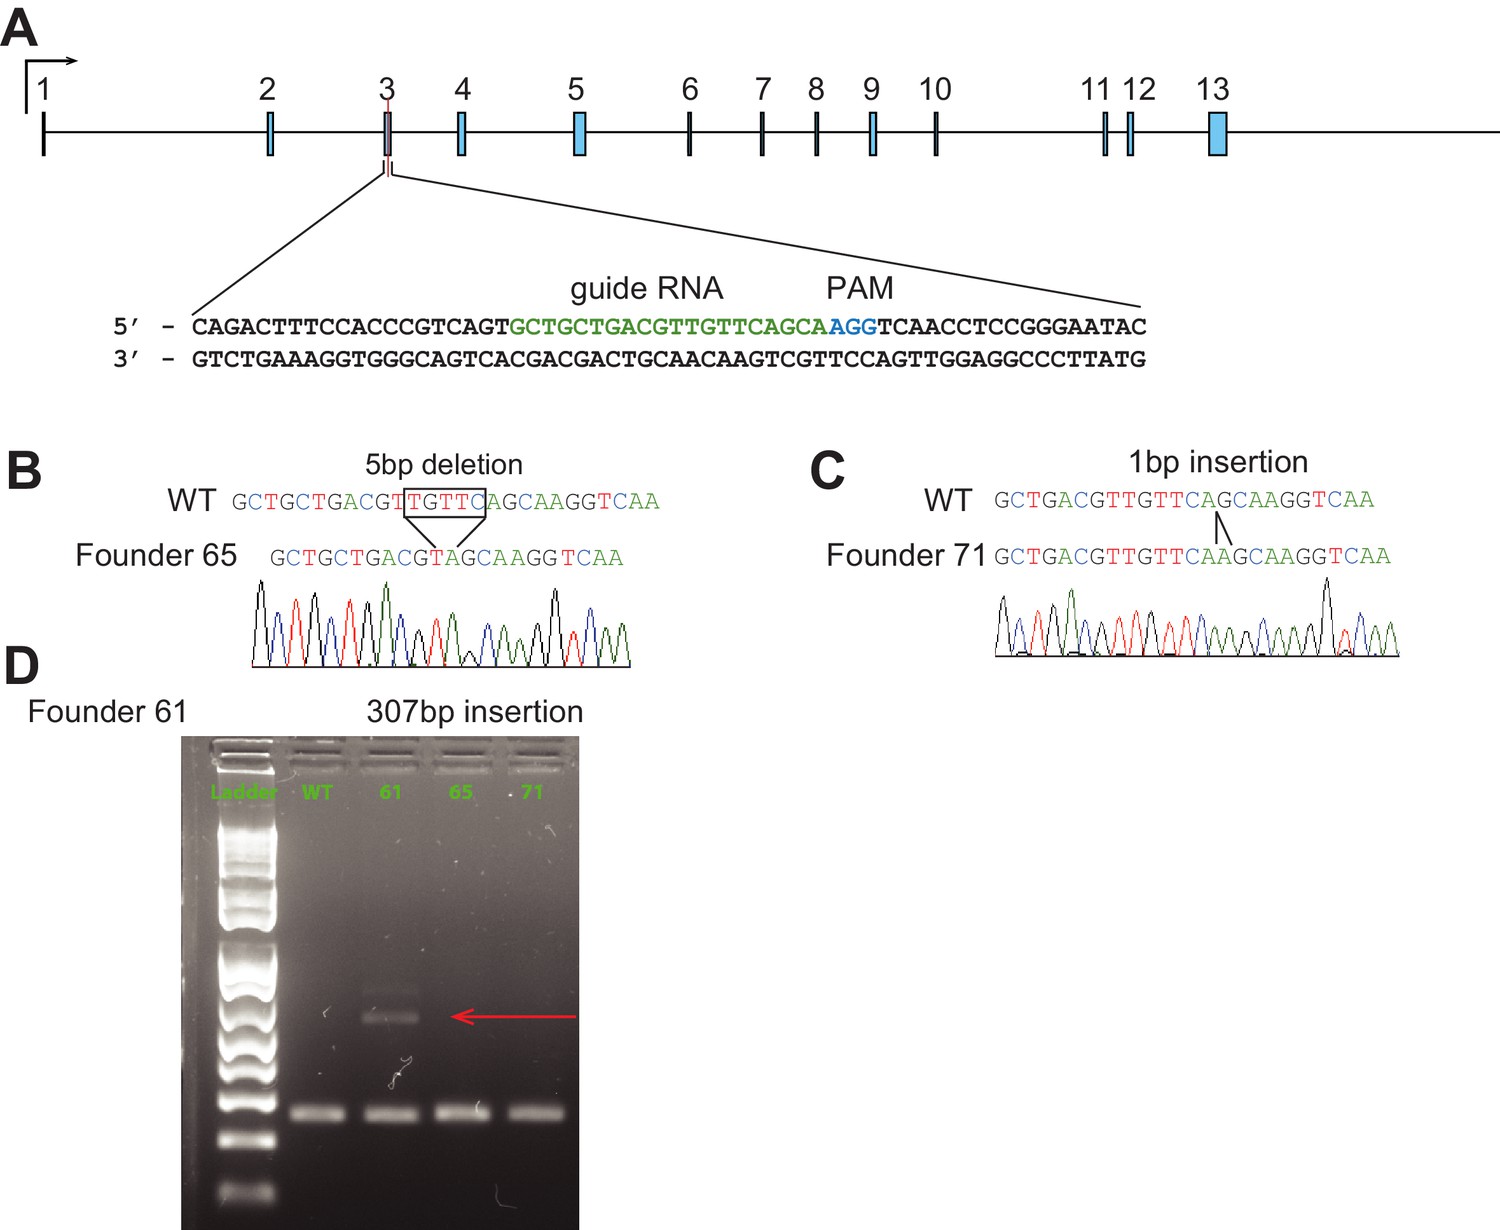
CRISPR/Cas9 targeting strategy for Sp110–/– mice.
(A) Mouse Sp110 gene. Guide RNA sequence for CRISPR/Cas9 targeting and protospacer-adjacent motif (PAM) are indicated. (B–D) Sp110 locus in wild-type (WT) and three independent lines. Homozygotes of two lines identified by sequencing (B, C), and heterozygote of the third line by PCR products separated on an agarose gel (D). Arrow indicates the mutant band. PCR, polymerase chain reaction.
Figure 2 with 4 supplements
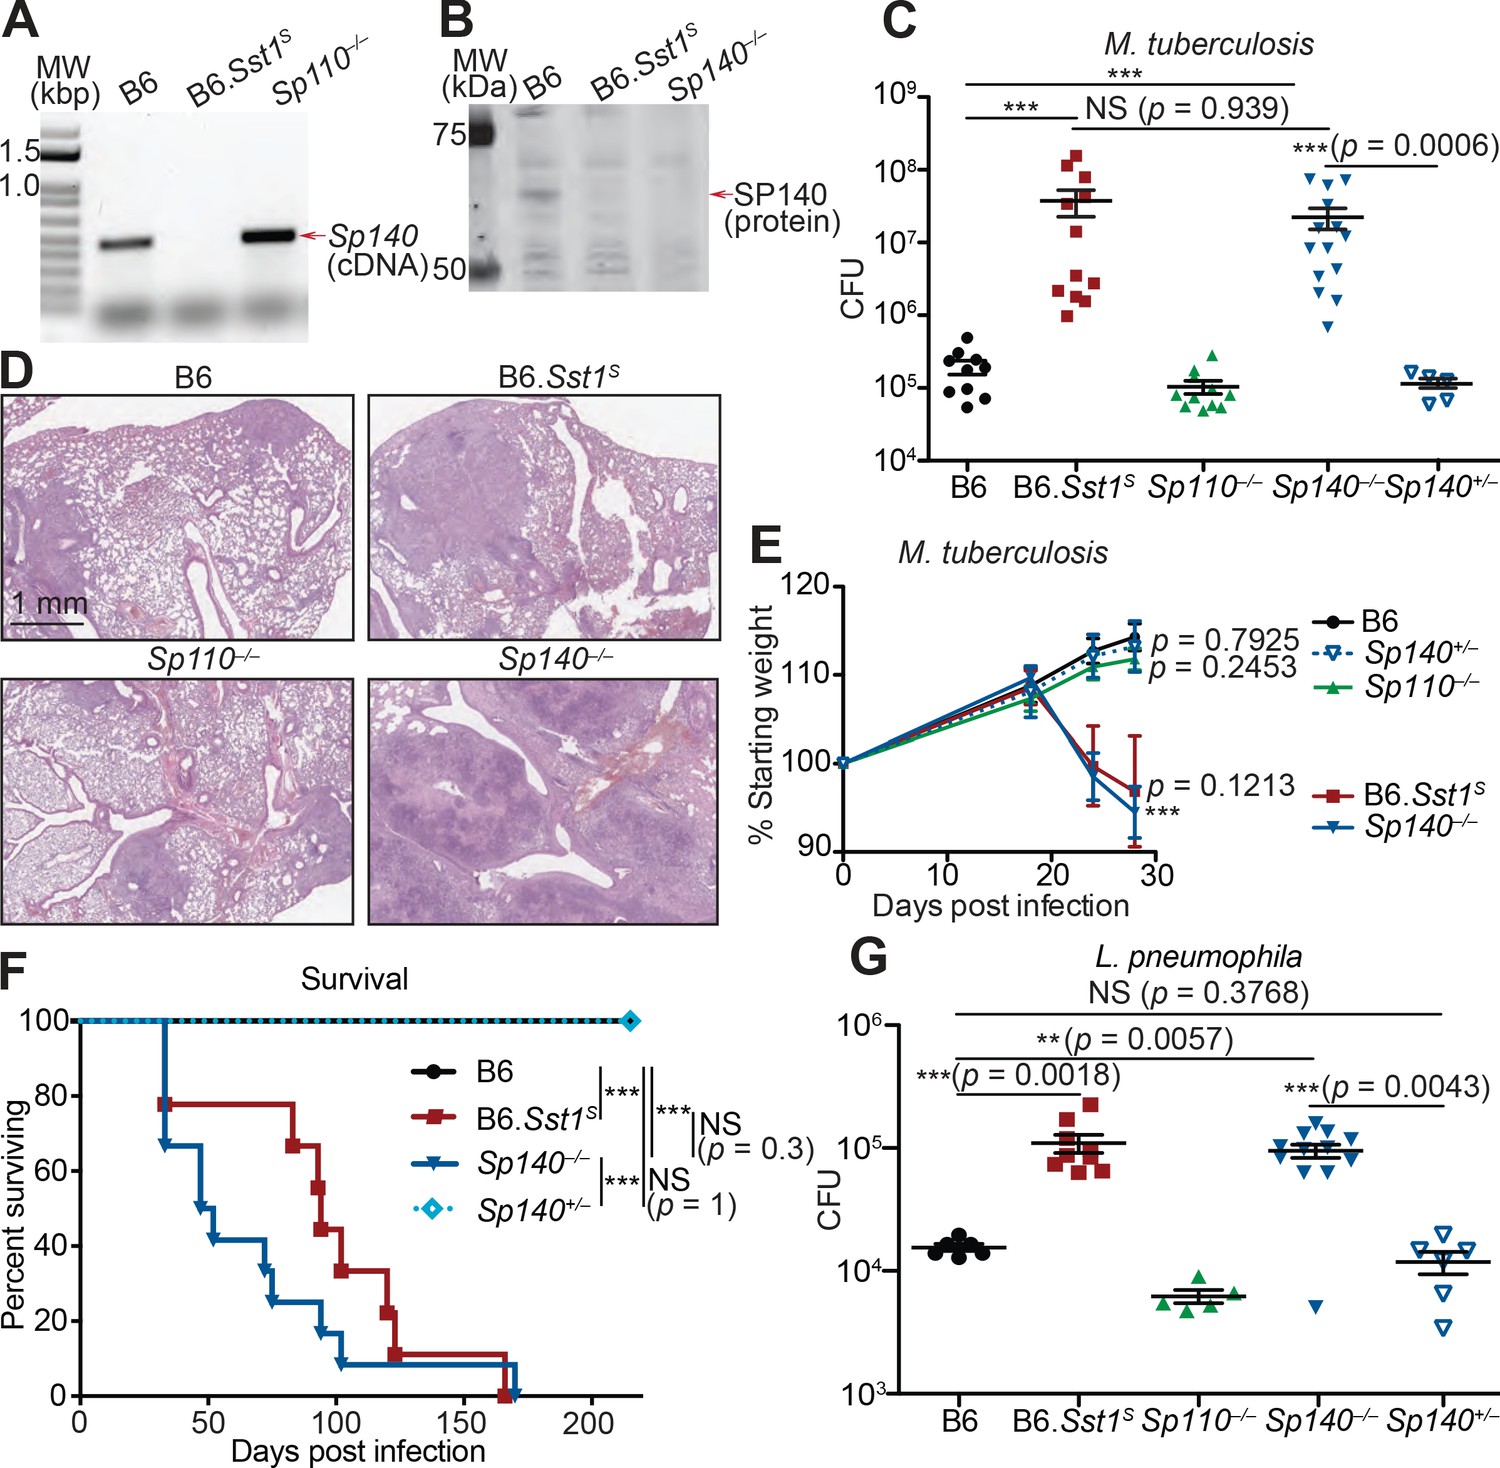
Sp140–/– mice are susceptible to bacterial pathogens.
(A) RT-PCR of cDNA from BMMs of the indicated genotypes. Red arrow indicates band corresponding to a portion of Sp140, verified by sequencing. (B) Immunoblot of lysates from Sp140–/– and B6 BMMs treated with 10 U/ml of recombinant mouse IFNγ for 24 hr. Equal amounts of protein were loaded for immunoblot with anti-SP140 antibody. (C–F) Mice were infected with Mycobacterium tuberculosis and measured for (C) lung CFU at 28 days post-infection, (E) body weight over time, and (F) survival. Statistics in (E) shows the comparison to B6 at day 28, and data are from 10 B6, 11 B6.Sst1S, 11 Sp110–/–, 14 Sp140–/–, and 6 Sp140+/–mice. (D) H&E staining of lungs at 25 days post-infection with M. tuberculosis. Full histology images are provided in Figure 2—figure supplement 2. (G) Mice were infected with Legionella pneumophila and lung CFUs were determined at 96 hr post-infection. All mice were bred in-house, Sp140–/– and Sp140+/– were littermates (C–F). (C), (E), and (G) are combined results of two independent infections. (A–D) show representative analysis of one Sp140–/– line (line 1), whereas (F, G) include a mixture of both lines 1 and 2. Results of infection of both lines with M. tuberculosis are shown in Figure 2—figure supplement 1E. (C, E, F, G) Mann-Whitney test. *p≤0.05; **p≤0.01; ***p≤0.005. BMM, bone marrow-derived macrophage; CFU, colony-forming unit; H&E, hematoxylin and eosin; RT-qPCR, real-time quantitative-polymerase chain reaction; WT, wild-type.
Figure 2—figure supplement 1
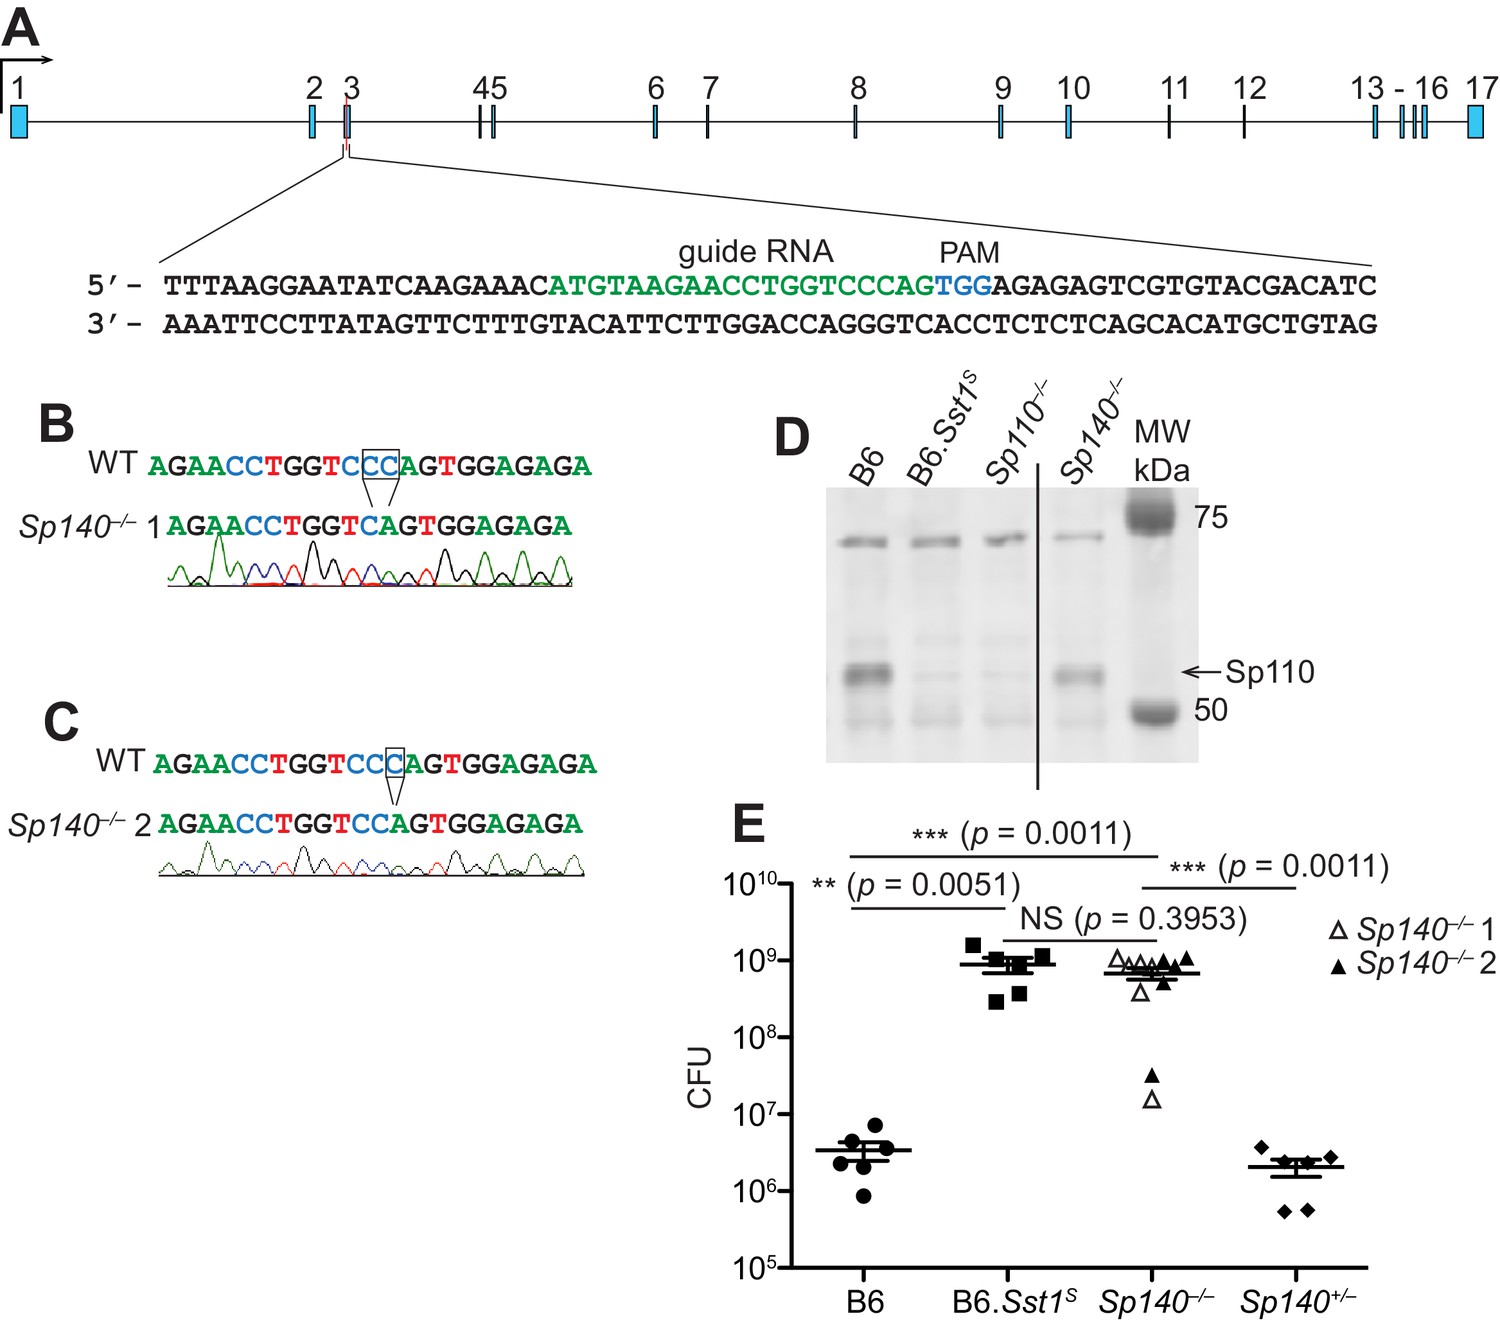
CRISPR/Cas9 targeting strategy for Sp140–/– and validation of founders.
(A) Mouse Sp140 gene. Guide RNA sequence for CRISPR/Cas9 targeting and protospacer-adjacent motif (PAM) are indicated. (B, C) Sp140 locus in wild-type (WT) and two independent founders of Sp140–/– validated by sequencing. (D) Immunoblot for SP110 using BMMs from mice of the indicated genotypes. Intervening lanes have been removed for clarity (indicated by line in the image). (E) Mycobacterium tuberculosis-infected mice were harvested for CFU at 25 days post-infection. Empty and filled triangles indicate the two independent lines of Sp140–/– used in this infection. All mice were bred in-house and Sp140+/– ± littermates with Sp140–/– line 2. Mann-Whitney test. *p≤0.05; **p≤0.01; ***p≤0.005. BMM, bone marrow-derived macrophage; CFU, colony-forming unit.
Figure 2—figure supplement 2
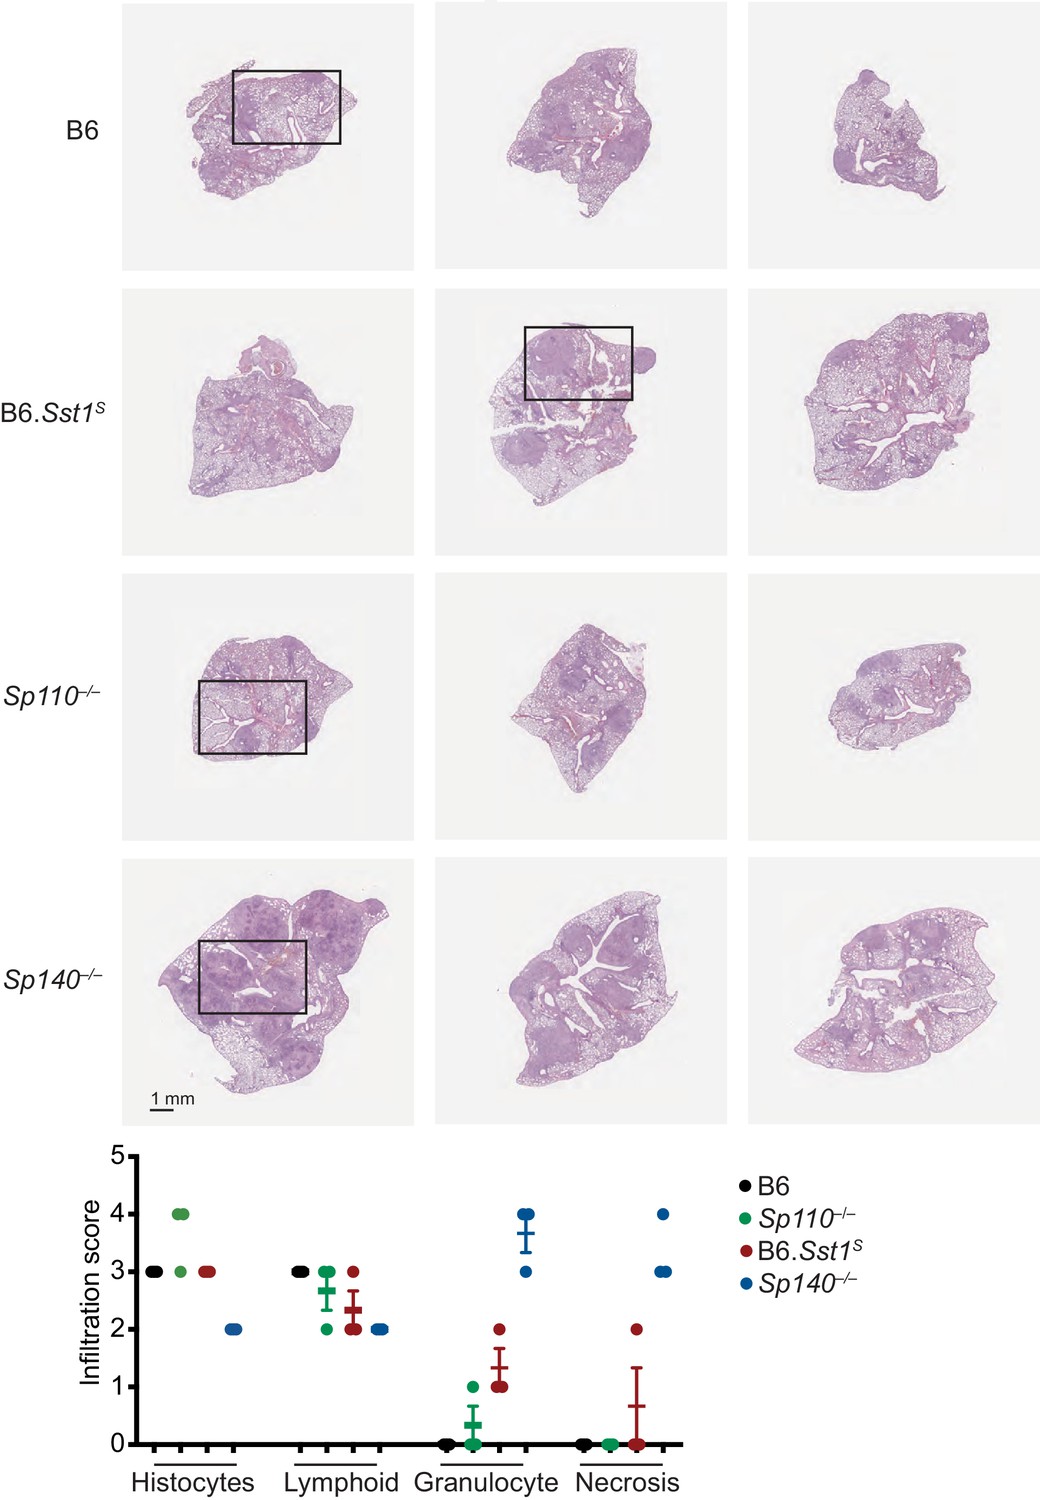
Histology of lungs from B6, B6.Sst1S, Sp110–/–, and Sp140–/– mice after infection with Mycobacterium tuberculosis.
H&E staining of entire lung sections from mice of indicated genotypes at 25 days post-infection with M. tuberculosis. Black squares denote sections shown in Figure 2C. Each image represents a lung section from a different mouse. Borders in background color have been added around each image. Scale bar applies to all images. Samples were evaluated and scored (0–4, least to most) for macrophage (histocyte), lymphoid, granulocyte infiltration, and extent of necrosis. H&E, hematoxylin and eosin.
Figure 2—figure supplement 3
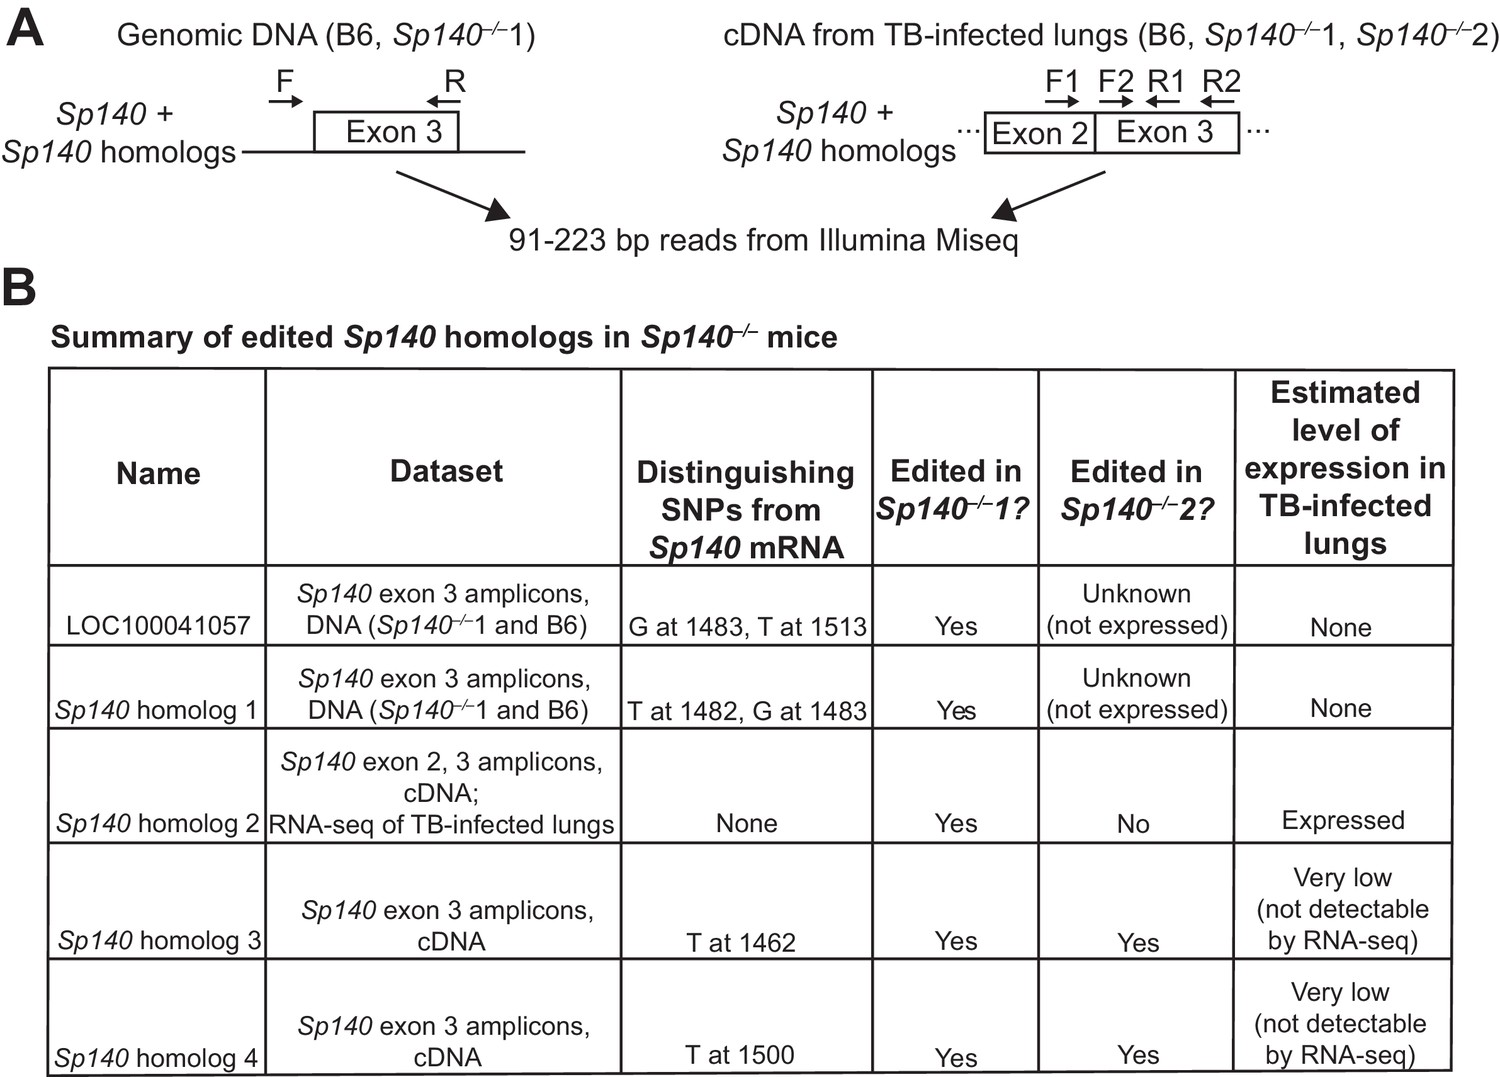
Characterization of off-target genes mutated in Sp140–/– mice.
(A) Schematic of amplicon sequencing strategy for Sp140 and Sp140 homologs. (B) Summary of edited Sp140 homologs from amplicon sequencing and RNA-seq analysis. SNPs are denoted based on the Sp140 X1 transcript. Expression level was roughly estimated from read counts. Three B6 and two Sp140–/– mice from each founder line were used as biological replicates for Sp140 exon 2/3 amplicon sequencing from cDNA, two mice per genotype were used for Sp140 exon 3 amplicon sequencing from cDNA, and one mouse per genotype was used for Sp140 exon 3 amplicon sequencing from DNA. SNP, single-nucleotide polymorphism.
Figure 2—figure supplement 4
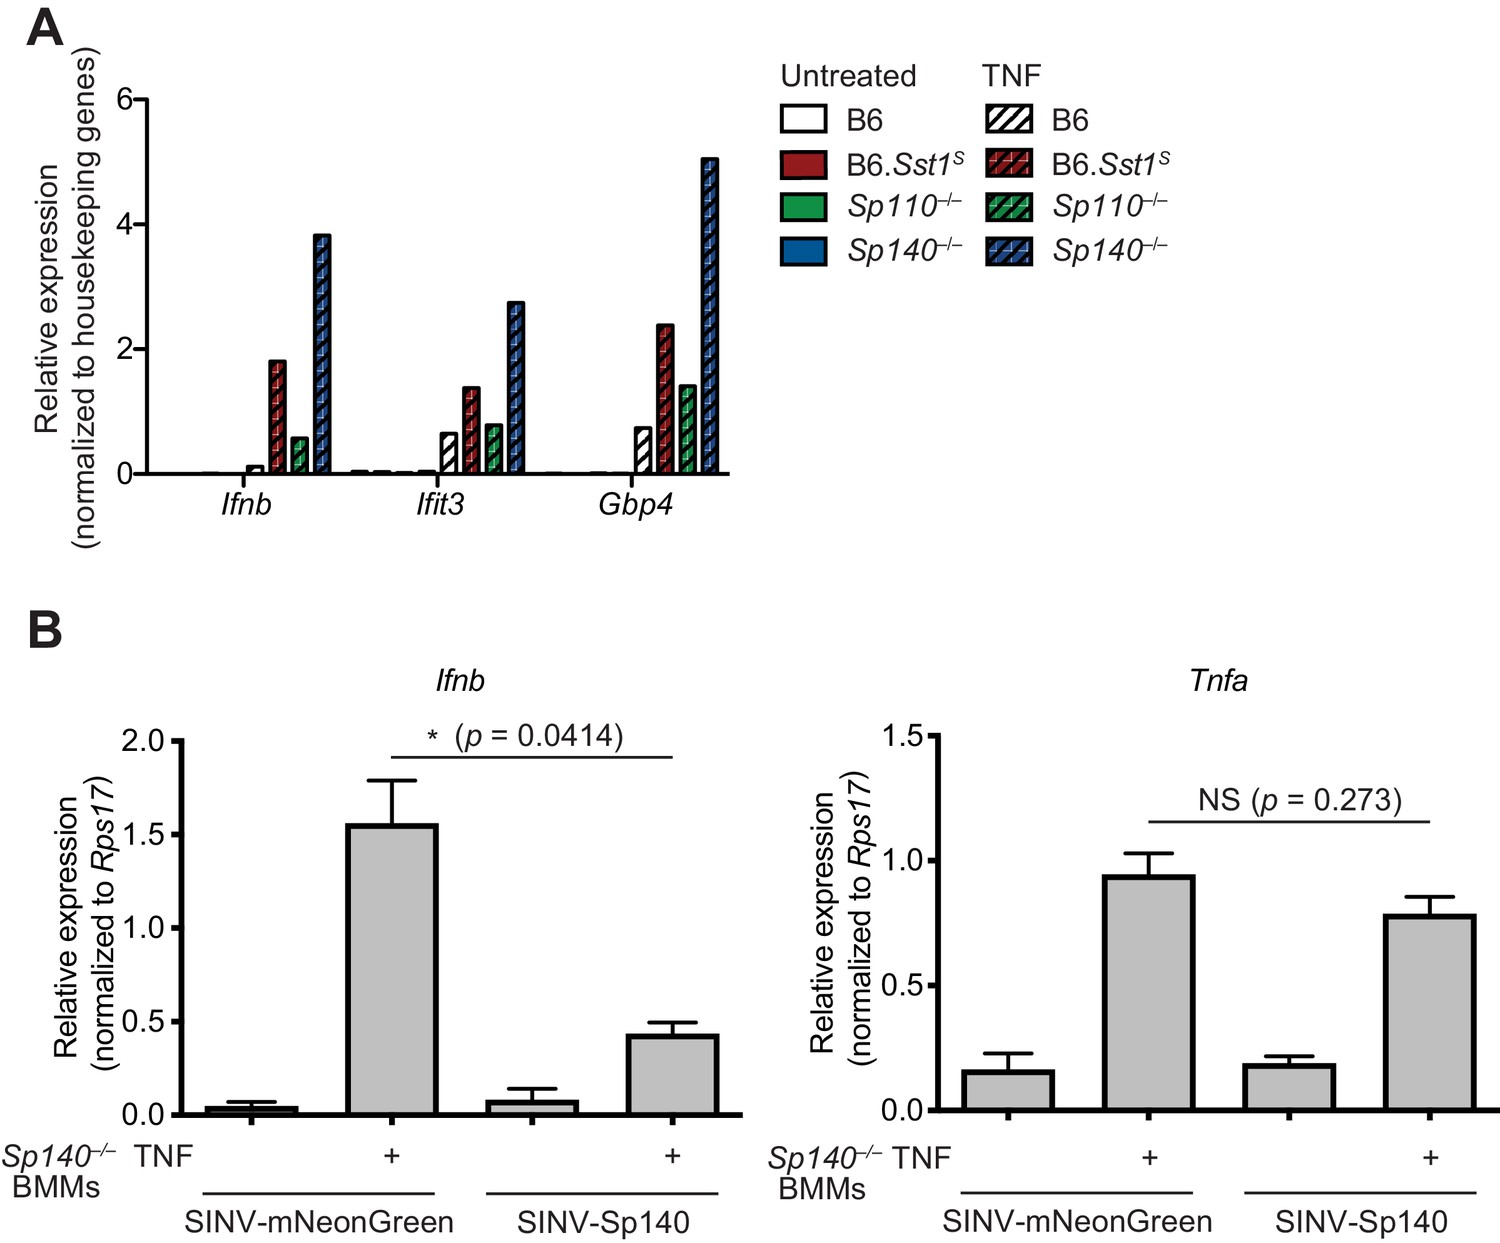
Complementation of hyper type I IFN responses in Sp140–/– BMMs.
(A) BMMs were left untreated or treated with TNF-α for 24 hr. Total RNA was used for RT-qPCR. Averages of technical duplicates for one biological replicate are shown. Data is representative of two independent experiments. (B) RT-qPCR of Sp140–/– BMMs transduced with either control SINV-minCMV-GAL4-mNeonGreen (SINV-mNeonGreen) or SINV-minCMV-Sp140 (SINV-Sp140), primed with 5 ng/mL IFN-𝛾 for 14 hr and treated with 10 ng/mL TNF-⍺ for 4 hr. *p≤0.05 calculated with an unpaired t-test with Welch’s correction. Data are representative of two independent experiments. BMM, bone marrow-derived macrophage; RT-qPCR, real-time quantitative-polymerase chain reaction.
Figure 3 with 1 supplement
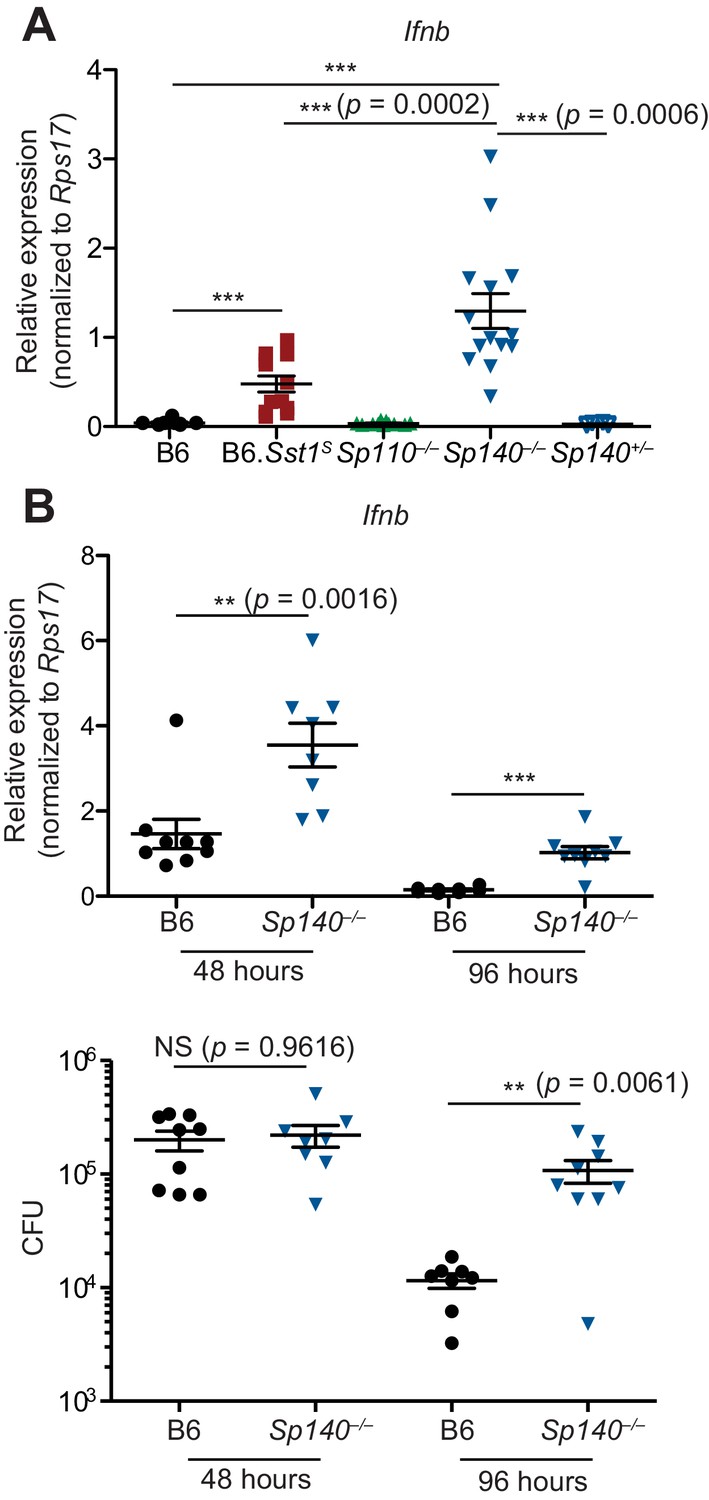
Sp140–/– mice have elevated Ifnb transcripts during bacterial infection.
(A) Mice were infected with Mycobacterium tuberculosis and at 28 days post-infection, lungs were processed for total RNA, which was used for RT-qPCR. Combined results of two independent experiments. (B) Mice were infected with Legionella pneumophila and RT-qPCR (top panel) and CFU enumeration (bottom panel) was performed on lungs collected at indicated times. Combined results of two independent infections. All mice were bred in-house, Sp140–/– and Sp140+/– were littermates. (A, B) Mann-Whitney test. *p≤0.05; **p≤0.01; ***p≤0.005. CFU, colony-forming unit; RT-qPCR, real-time quantitative-polymerase chain reaction.
Figure 3—figure supplement 1
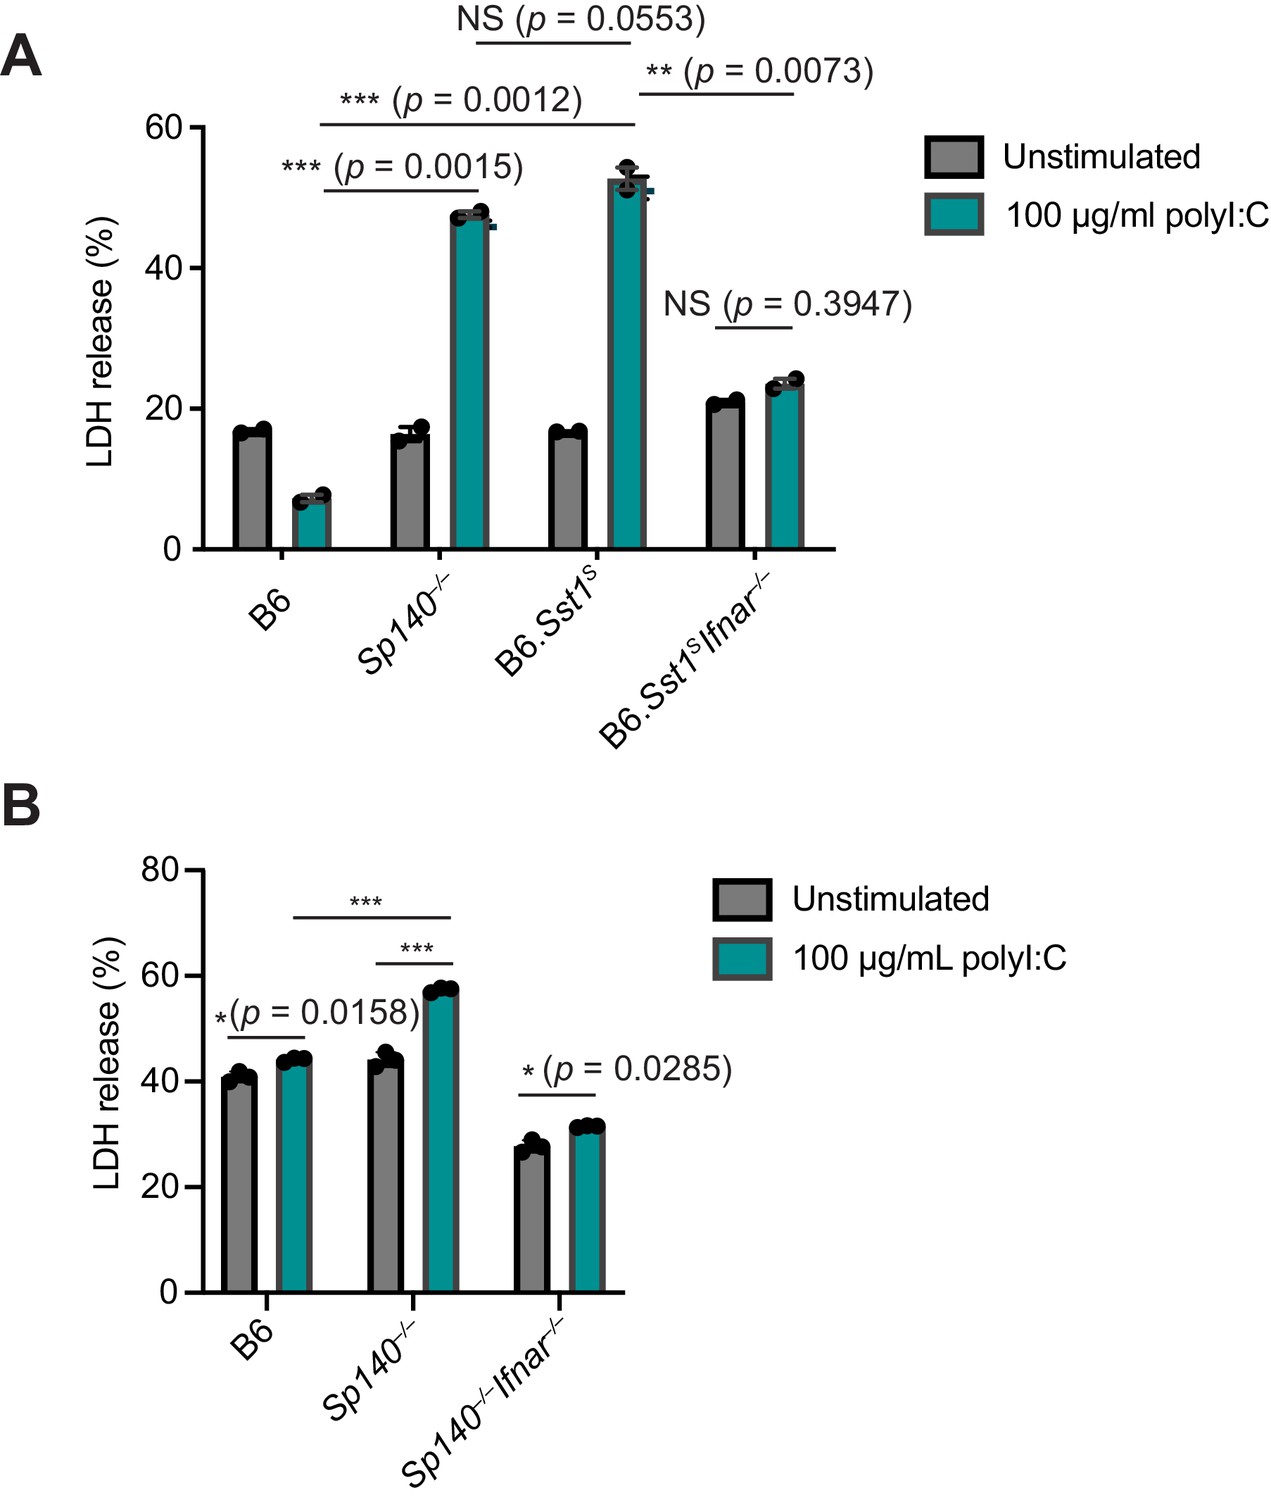
BMMs from B6.Sst1S and Sp140–/– mice show increased cell death upon stimulation with polyI:C, which is dependent upon IFNAR signaling.
LDH release from primary BMMs after 16–24 hr stimulation with 100 μg/mL polyI:C for (A) B6, Sp140–/–, B6.Sst1S, and B6.Sst1S Ifnar–/– mice. Results are technical duplicates, and representative of three independent experiments for B6 (three mice), B6.Sst1S (two mice), and Sp140–/– (two mice) samples and two independent experiments for B6.Sst1S Ifnar–/– sample (one mouse). (B) LDH release after polyI:C stimulation for primary BMMs from B6, Sp140–/–, and Sp140–/– Ifnar–/– mice. Results represent technical triplicates and are representative of two independent experiments for two mice per genotype. * p≤0.05; **p≤0.01; ***p≤0.005 as calculated with an unpaired t-test with Welch’s correction. BMM, bone marrow-derived macrophage; IFNAR, interferon alpha and beta receptor; LDH, lactate dehydrogenase.
Figure 4 with 2 supplements
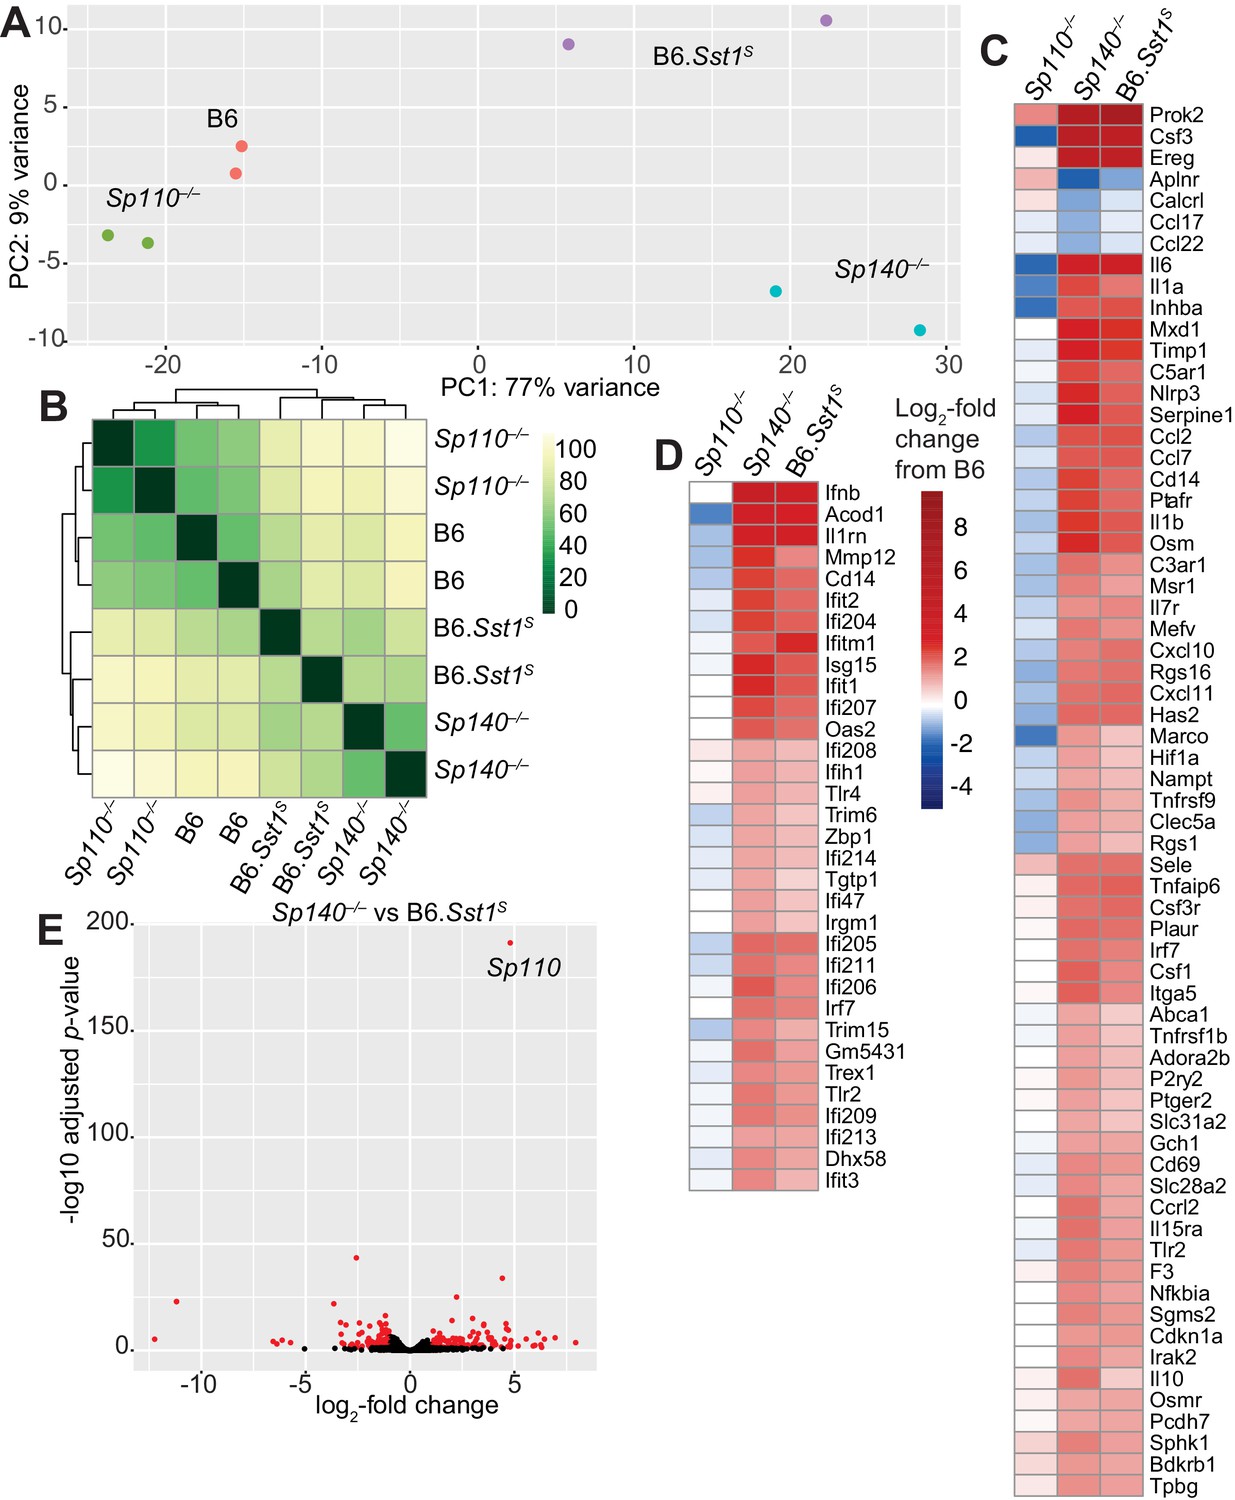
Global gene expression analysis of Sp110–/–, Sp140–/–, and B6.Sst1S lungs after Mycobacterium tuberculosis infection.
(A) PCA or (B) Euclidean distance analysis of all the samples. (C, D) Heatmaps of gene expression in log2-fold change from M. tuberculosis-infected B6. Genes shown are those significantly different between Sp140–/– and B6. (C) GSEA Hallmark inflammatory response; and (D) GO type I IFN response genes. (E) Volcano plot comparing Sp140–/– to B6.Sst1S expression. Dots in red are twofold differentially expressed with adjusted p-value ≤0.05. PCA, principal component analysis.
Figure 4—figure supplement 1
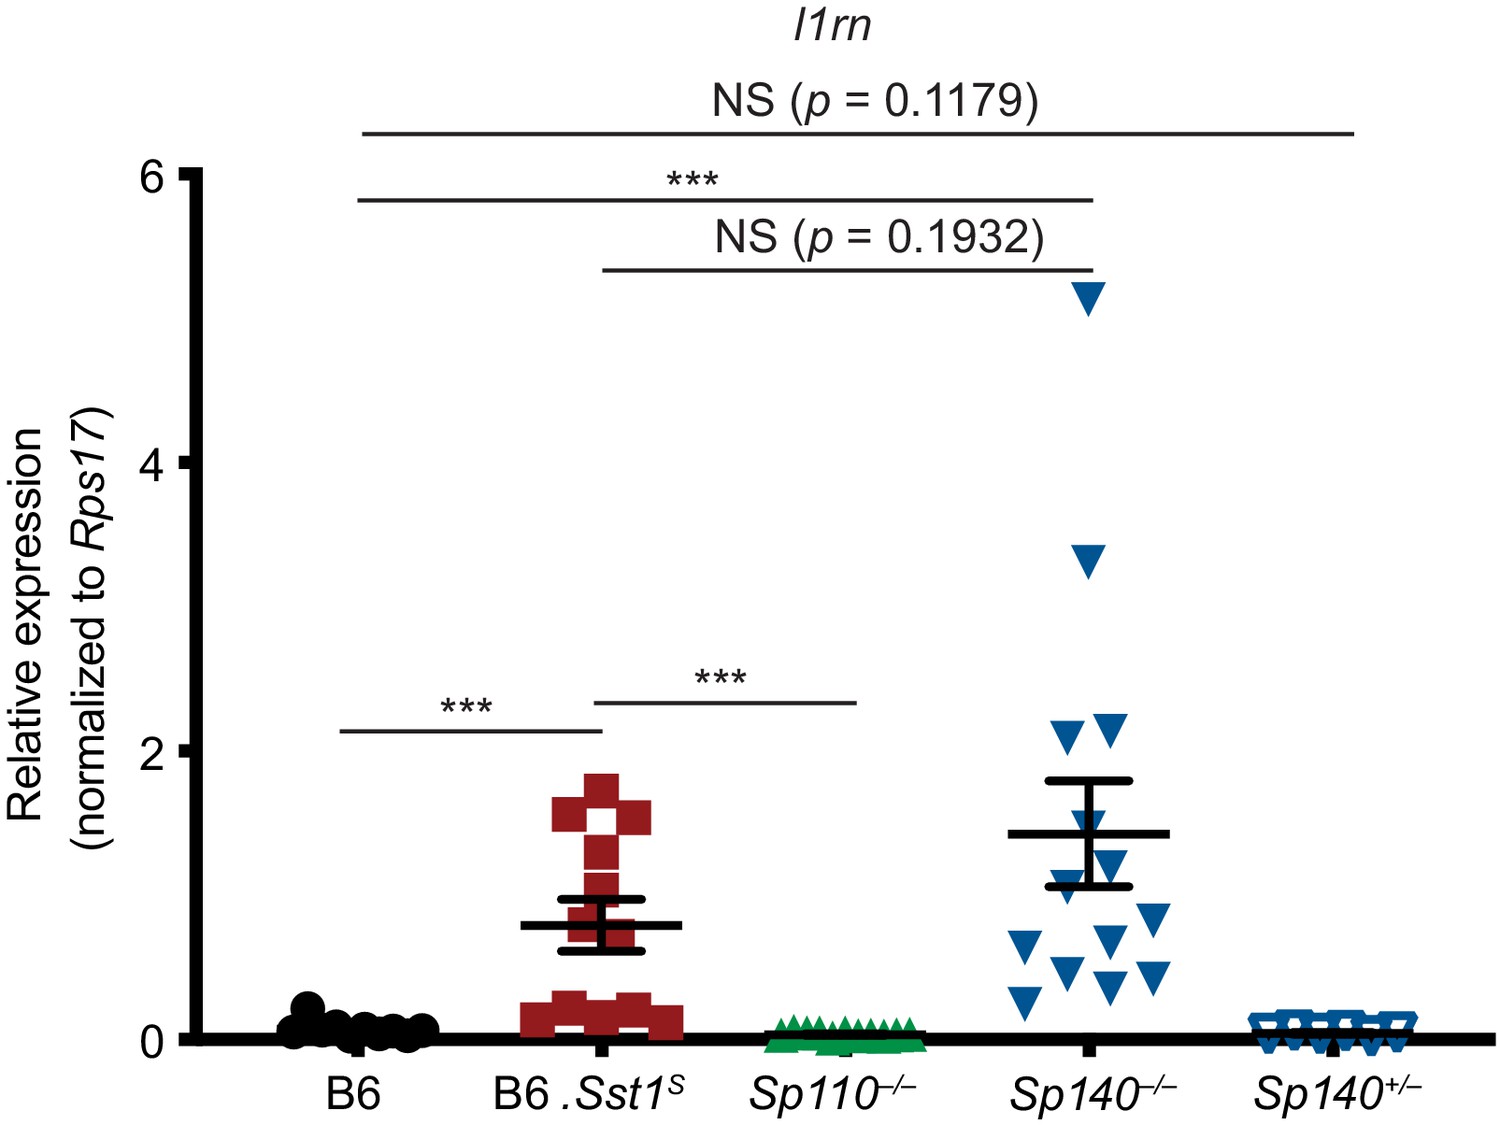
B6.Sst1S and Sp140–/– lungs exhibit elevated transcript levels of the interferon-stimulated gene Il1rn during Mycobacterium tuberculosis infection.
RT-qPCR for Il1rn (encodes IL-1Ra) extracted from lungs at 28 days post-infection with M. tuberculosis. Combined results of two independent experiments. Mann-Whitney test. *p≤0.05; **p≤0.01; ***p≤0.005. RT-qPCR, real-time quantitative polymerase chain reaction.
Figure 4—figure supplement 2
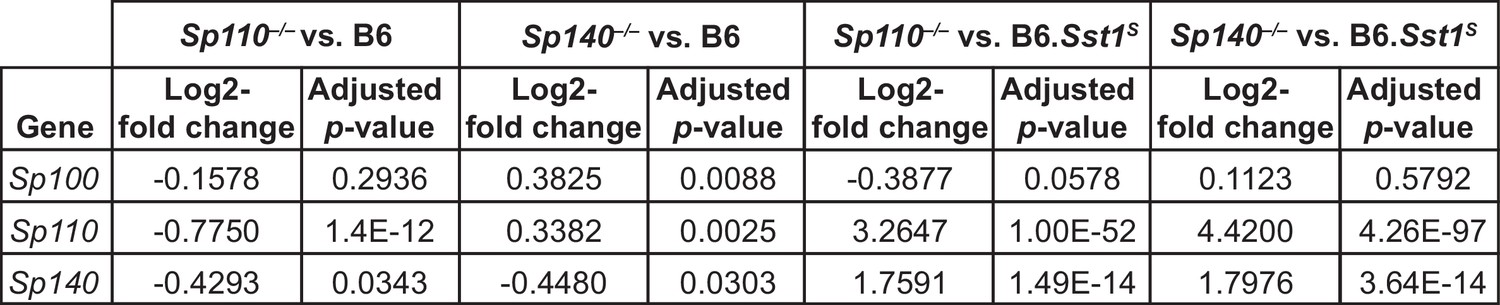
Expression of SP family members in Sp140–/– and Sp110–/– mouse lungs during Mycobacterium tuberculosis infection.
Log2-fold change and adjusted p-value for SP family members (Sp100, Sp110, and Sp140) from RNA-seq of M. tuberculosis-infected lungs from Sp110–/– and Sp140–/– mice, compared to B6 and B6.Sst1S.
Figure 5 with 1 supplement
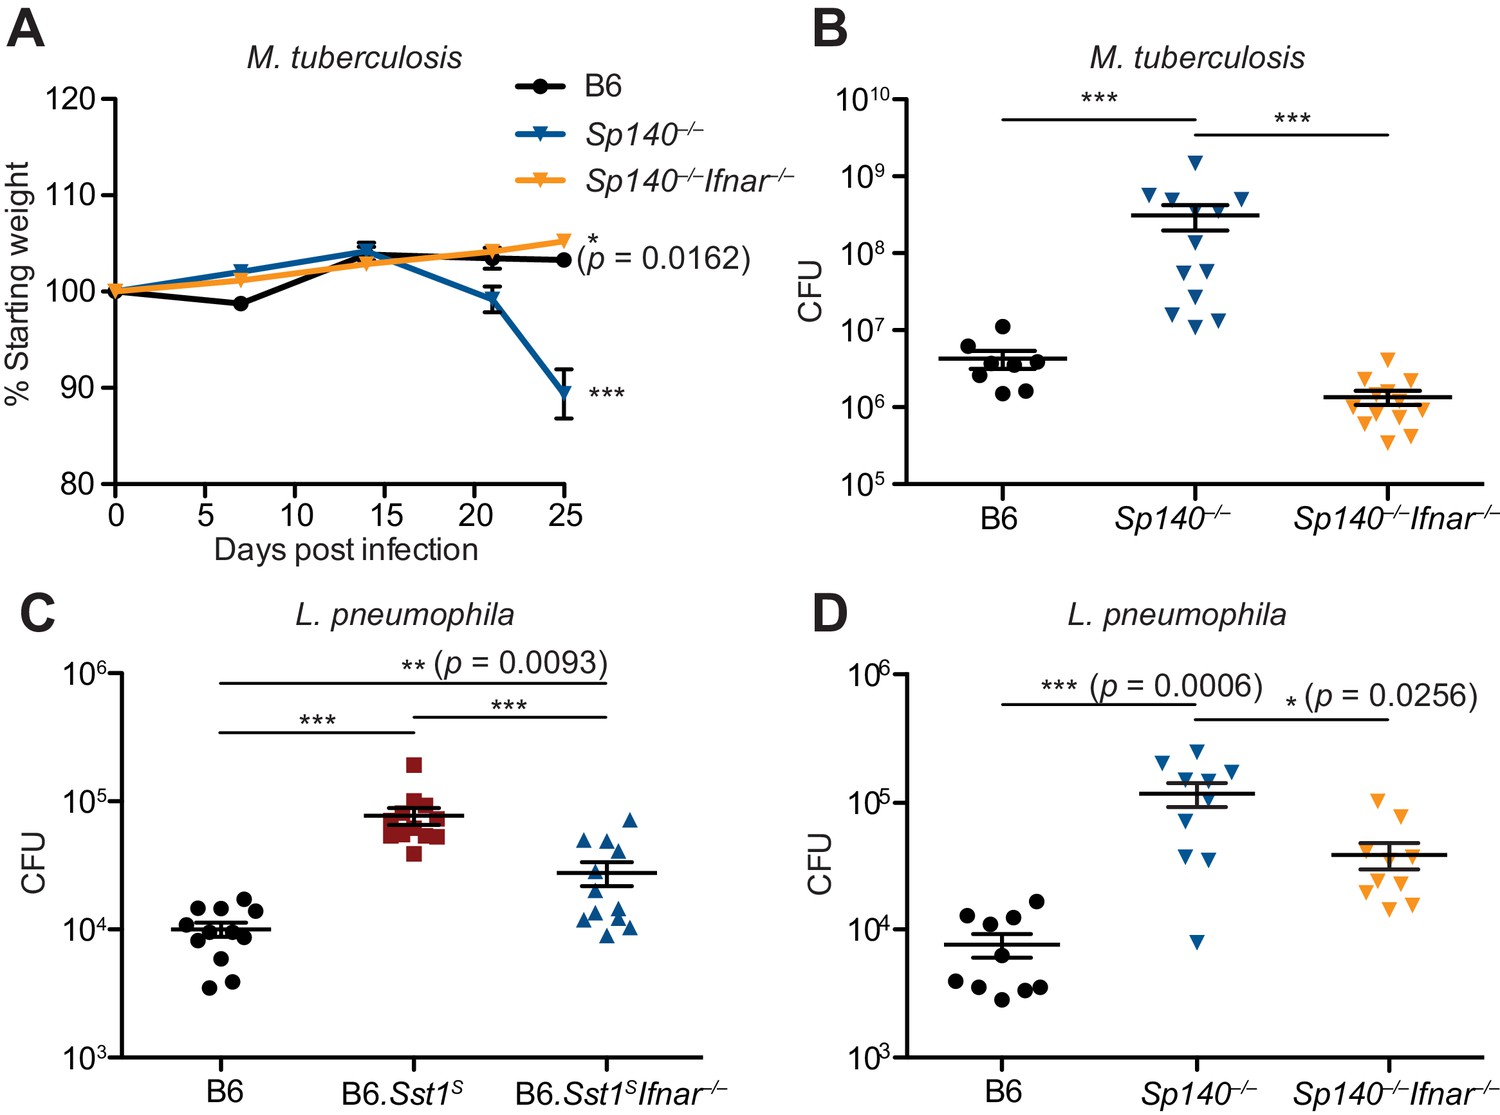
Susceptibility of Sp140–/– to Mycobacterium tuberculosis and Legionella pneumophila is dependent on type I IFN signaling.
(A, B) Mice were infected with M. tuberculosis and measured for (A) body weight, and (B) bacterial burdens at day 25. Statistics in (A) show comparison to B6; data are from 9 B6, 13 Sp140–/–, and 13 Sp140–/– Ifnar–/– mice. Combined results of two experiments. (C, D) Bacteria burden in L. pneumophila-infected mice at 96 hr. Combined results of two experiments. All mice were bred in-house (A, B, D); all but B6 were bred in-house (C). Mann-Whitney test (A–D). *p≤0.05; **p≤0.01; ***p≤0.005.
Figure 5—figure supplement 1
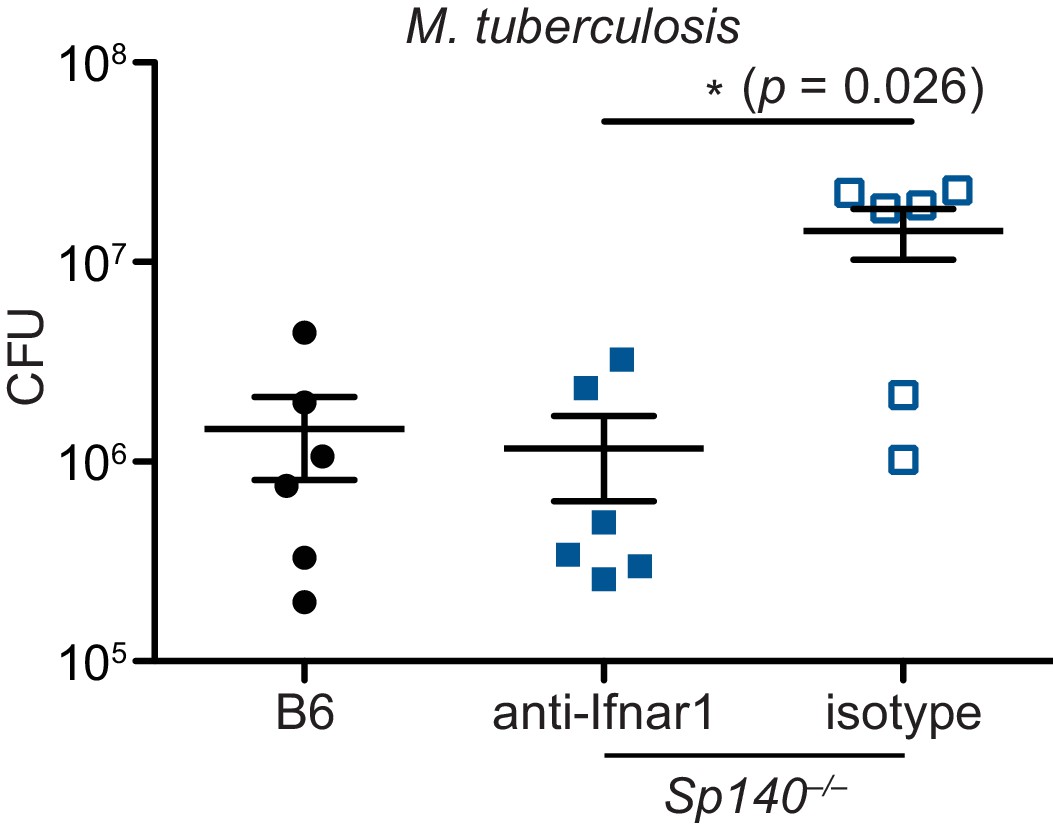
Antibody blockade of IFNAR1 reduces bacterial burden in Sp140–/– mice during Mycobacterium tuberculosis infection.
Mice were infected with M. tuberculosis and treated with either IFNAR1-blocking antibody or isotype control starting 7 days post-infection. At 25 days post-infection, lungs were harvested to enumerate CFU. Results of one experiment. All mice were bred in-house. Mann-Whitney test. *p≤0.05; **p≤0.01; ***p≤0.005. CFU, colony-forming unit.
Tables
Key resources table
| Reagent type (species) or resource | Designation | Source or reference | Identifiers | Additional information |
|---|---|---|---|---|
| Gene (Mus musculus) | Sp110 | GenBank | Gene ID: 109032 | |
| Gene (Mus musculus) | Sp140 | GenBank | Gene ID: 434484 | |
| Strain, strain background (M. tuberculosis, Erdman) | M. tuberculosis | Sarah Stanley, University of California, Berkeley | Erdman | |
| Strain, strain background (Legionella pneumophila, JR32 ΔflaA) | L. pneumophila | Dario Zamboni, University of São Paulo, Brazil | JR32 | |
| Genetic reagent (Mus musculus) | Sp110–/– | This paper | (C57BL/6J background) | |
| Genetic reagent (Mus musculus) | Sp140–/– | This paper | (C57BL/6J background) | |
| Genetic reagent (Mus musculus) | B6.129S2-Ifnar1tm1Agt/Mmjax | Jackson Laboratory | RRID:MMRRC_032045-JAX | |
| Genetic reagent (Mus musculus) | B6J.C3-Sst C3HeB/FeJKrmn | Igor Kramnik, Boston University | ||
| Cell line (Homo sapiens) | GP-2 293 | UC Berkeley Cell culture Facility | RRID:CVCL_WI48 | |
| Antibody | Rabbit polyclonal anti-mouse SP110 (serum) | Covance, this paper | WB (1:1000) | |
| Antibody | Rabbit polyclonal anti-mouse SP140 (serum) | Covance, this paper | WB (1:1000) | |
| Antibody | Mouse monoclonal anti-mouse SP110 (hybridoma) | Igor Kramnik, Boston University | WB (1:1000) | |
| Antibody | Mouse anti-human IFNGR-α chain (isotype control) | Leinco Technologies, Inc | Cat #: GIR208 | Mouse injection (500 μg) |
| Antibody | Mouse anti-mouse IFNAR1 | Leinco Technologies, Inc | Cat #: MAR1-5A3 | Mouse injection (500 μg) |
| Recombinant DNA reagent | SINV-mincmvSp140-pgkAmetrine (plasmid) | This paper | Derived from pTMGP vector (Addgene plasmid # 32716, RRID:Addgene_32716) | |
| Recombinant DNA reagent | SINV-Gal4-mincmv-mNeonGreen-pgkAmetrine (plasmid) | This paper | Derived from pTMGP vector (Addgene plasmid # 32716, RRID:Addgene_32716) | |
| Recombinant DNA reagent | pMD2.G | Addgene | RRID:Addgene_12259 plasmid #32716 | |
| Peptide, recombinant protein | Recombinant murine TNF alpha | R&D Systems | Cat #: 410-TRNC-010 | BMM stimulation (10 ng/mL) |
| Peptide, recombinant protein | Recombinant murine interferon gamma | Biolegend | Cat #: 575304 | BMM stimulation (5–10 ng/mL) |
| Peptide, recombinant protein | Retronectin | Takara | T100 | |
| Sequence-based reagent | Sp110 fwd | This paper | Genotyping primers (Sp110) | CTCTCCGCTCGGTGACTAC |
| Sequence-based reagent | Sp110 rev | This paper | Genotyping primers (Sp110) | CTGCACATGTGACAAGGATCTC |
| Sequence-based reagent | Sp140-1 fwd | This paper | Genotyping primers (Sp140) | ACGAATAGCAAGCAGGAATGCT |
| Sequence-based reagent | Sp140-1 rev | This paper | Genotyping primers (Sp140) | GGTTCCGGCTGAGCACTTAT |
| Sequence-based reagent | Sp140-2 fwd | This paper | Genotyping primers (Sp140) | TGAGGACAGAACTCAGGGAG |
| Sequence-based reagent | Sp140-2 rev | This paper | Genotyping primers (Sp140) | ACACGCCTTTAATCCCAGCATTT |
| Sequence-based reagent | Ifnb sense | This paper | RT-qPCR primers (Ifnb) | GTCCTCAACTGCTCTCCACT |
| Sequence-based reagent | Ifnb antisense | This paper | RT-qPCR primers (Ifnb) | CCTGCAACCACCACTCATTC |
| Commercial assay or kit | E.Z.N.A. Total RNA Kit I | Omega Biotek | Cat #: R6834-02 | |
| Chemical compound, drug | polyI:C | Invivogen | Cat #: tlrl-picw | BMM stimulation (100 μg/mL) |
Additional files
Download links
A two-part list of links to download the article, or parts of the article, in various formats.
Downloads (link to download the article as PDF)
Open citations (links to open the citations from this article in various online reference manager services)
Cite this article (links to download the citations from this article in formats compatible with various reference manager tools)
Role of the transcriptional regulator SP140 in resistance to bacterial infections via repression of type I interferons
eLife 10:e67290.
https://doi.org/10.7554/eLife.67290


