Temporo-cerebellar connectivity underlies timing constraints in audition
- Language and Aphasia Laboratory, Department of Neurology, Leipzig University Hospital, Germany
- Department of Neuropsychology, Max Planck Institute for Human Cognitive and Brain Sciences, Germany
- Department of Neuropsyhology and Psychopharmacology, Faculty of Psychology and Neuroscience, Maastricht University, Netherlands
- Department of Neuroscience, Max Planck Institute for Empirical Aesthetics, Germany
- Department of Psychology, New York University, United States
Figures
Figure 1
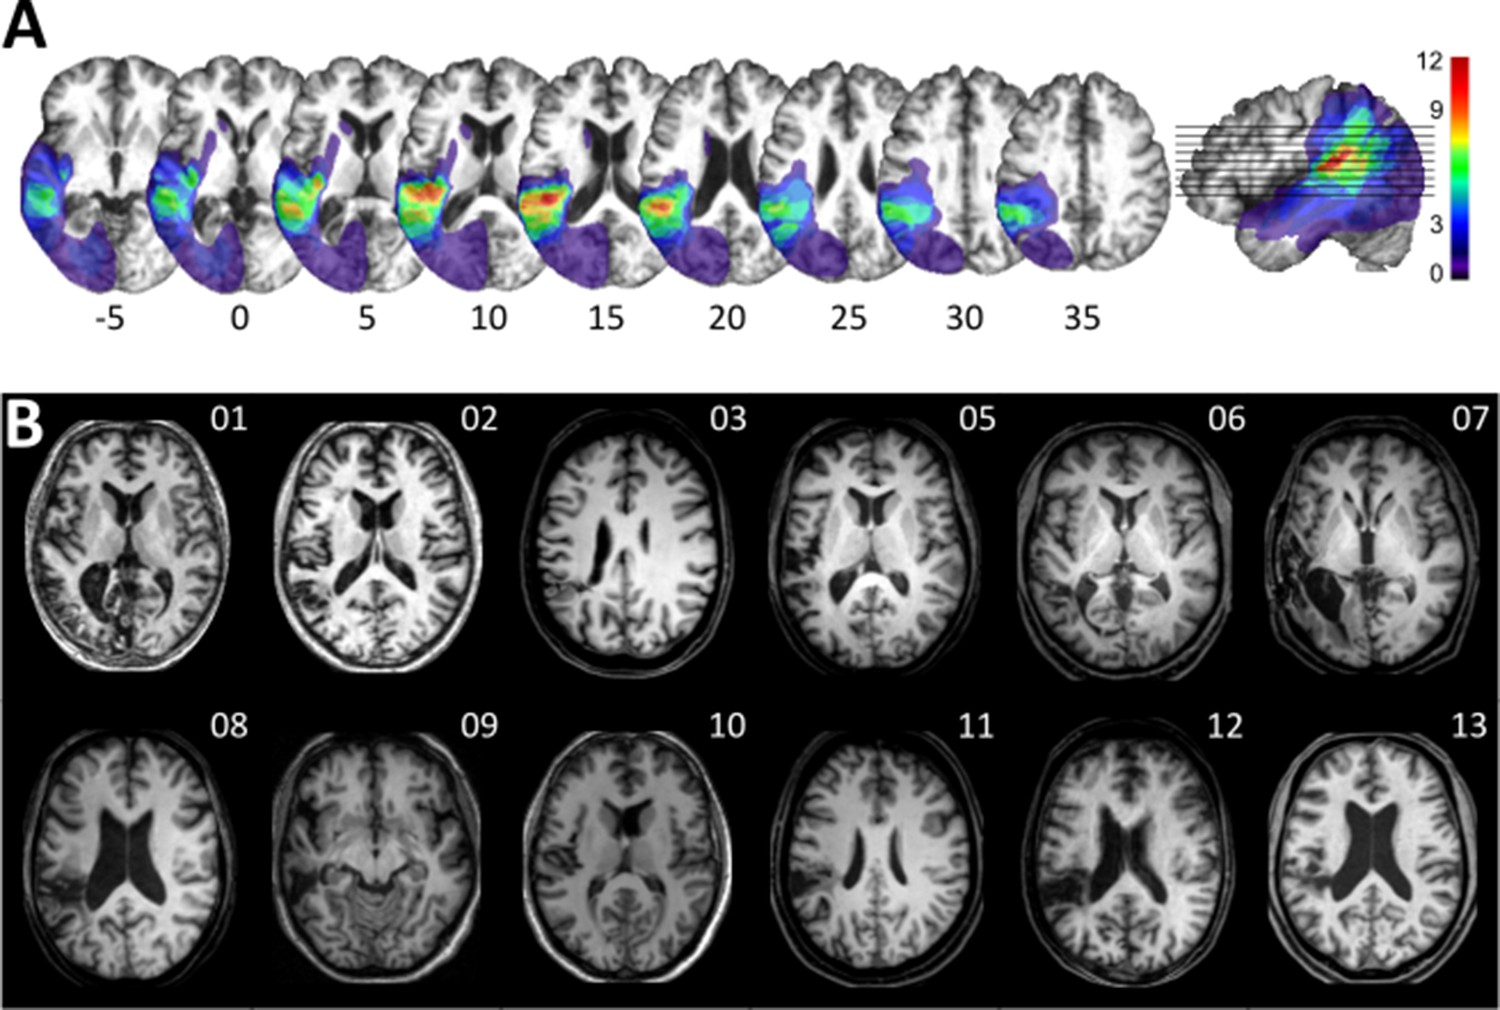
Visualization of lesion distribution.
(A) (Top row) Lesion frequency map: lesion distribution in the 12 patients superimposed on the scalp-stripped mean patient T1-weighted image. Colorbar specifies the number of patients with overlapping lesions in each voxel, with hot colors indicating that a greater number of patients had lesions in this region. Maximum lesion overlap in left posterior superior temporal gyrus (planum temporale) and underlying white matter (MNI −45,–36, 15). (B) (Bottom row) MRI imaging showing lesion location on a representative axial slice.
Figure 2
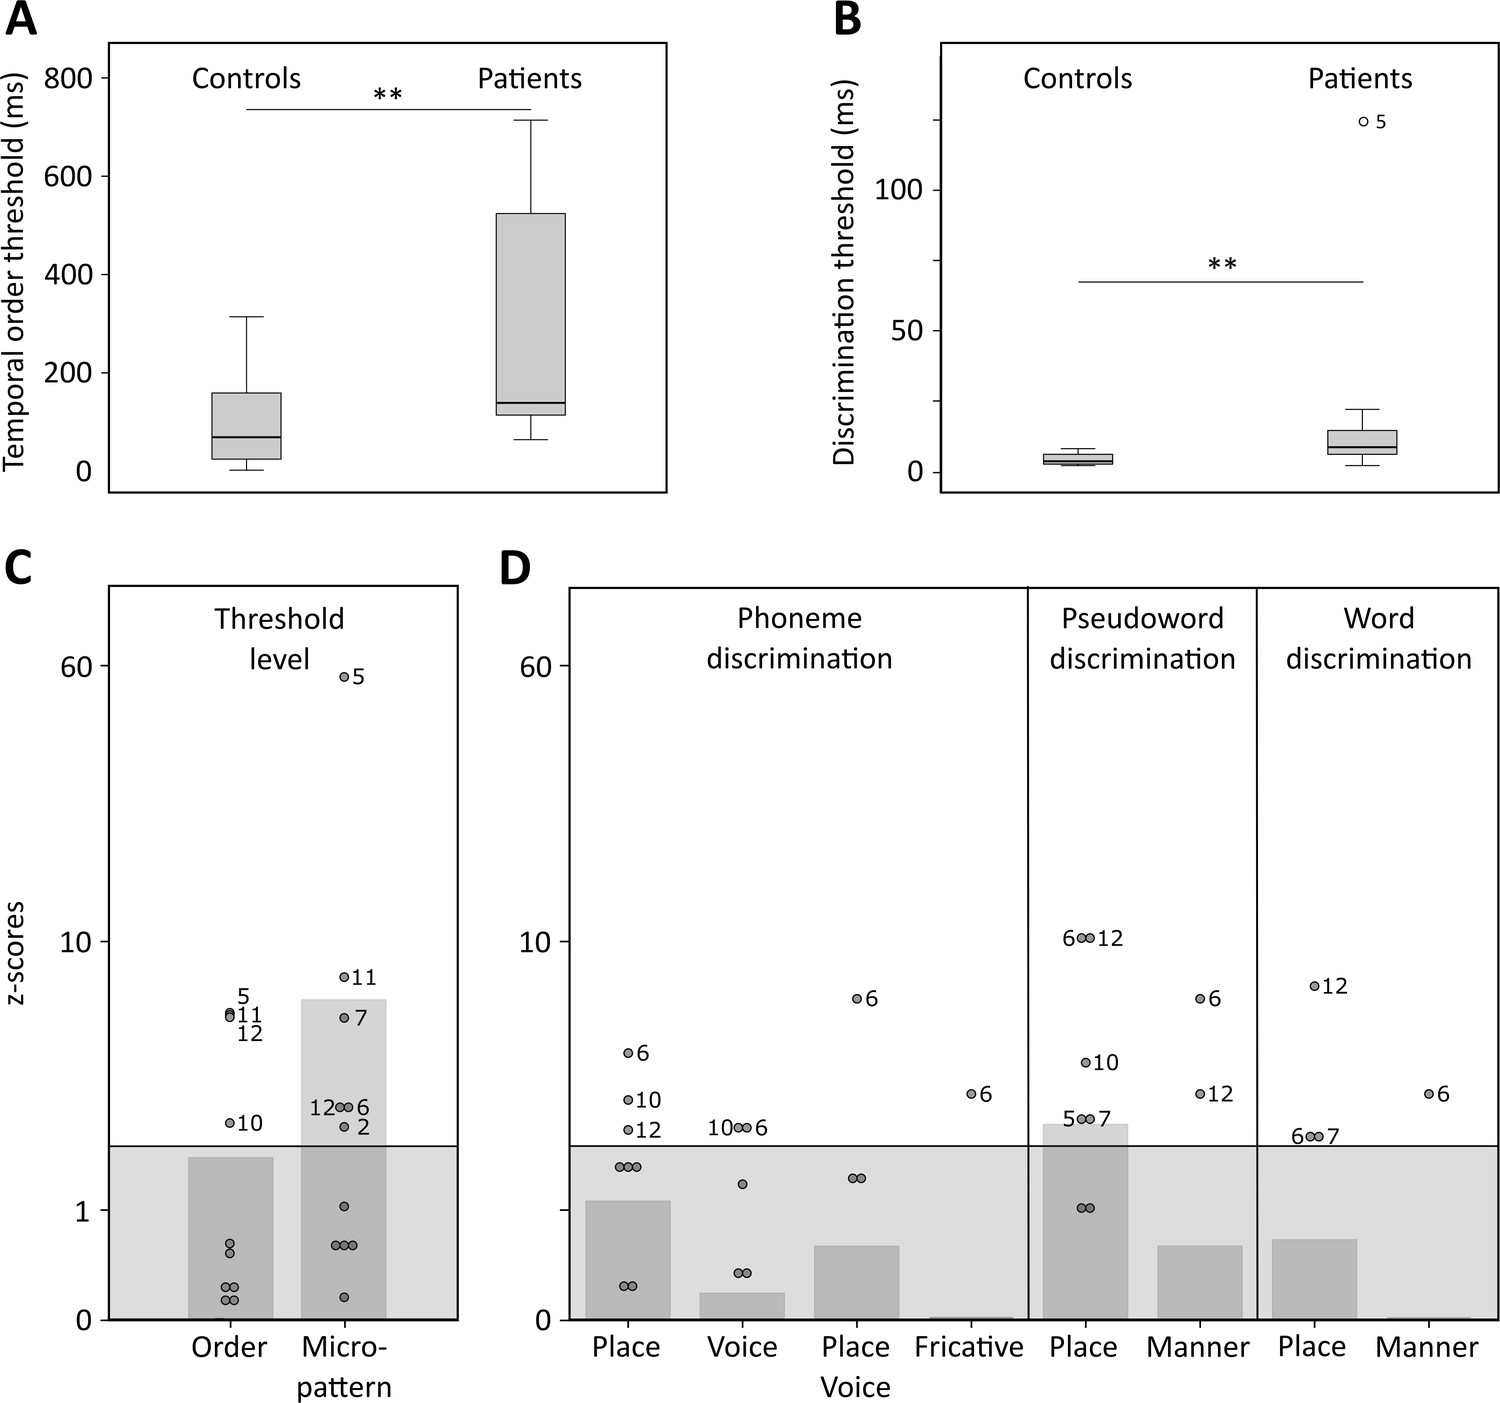
Temporal order and discrimination thresholds and identification of deficit-positive (LG+) and -negative (LG−) lesion group.
Boxplots display median (horizontal line), first and third quartile (box), data range (whiskers), and outlier (dot) of the threshold levels in milliseconds for temporal order judgments (A) and discrimination of micropatterns (B) in the control and patient group. Patients as compared to controls show higher temporal order and micropattern discrimination thresholds. To identify deficit-positive (LG+) and -negative (LG−) lesion groups, patients’ mean (bars, dark gray) and individual performance (circles) on temporal order and micropattern discrimination (C) and phoneme/word discrimination (D) were converted to into z-scores relative to control group means for each behavioral test. Values > 0 indicate worse performance than controls within (light gray) and outside (no color) plus two standard deviations (SD) of the controls mean. Patients scoring outside two SD of the controls (impaired performance, LG+) are indicated by subject number.
-
Figure 2—source data 1
Behavioral data.
- https://cdn.elifesciences.org/articles/67303/elife-67303-fig2-data1-v2.xlsx
Figure 3 with 1 supplement
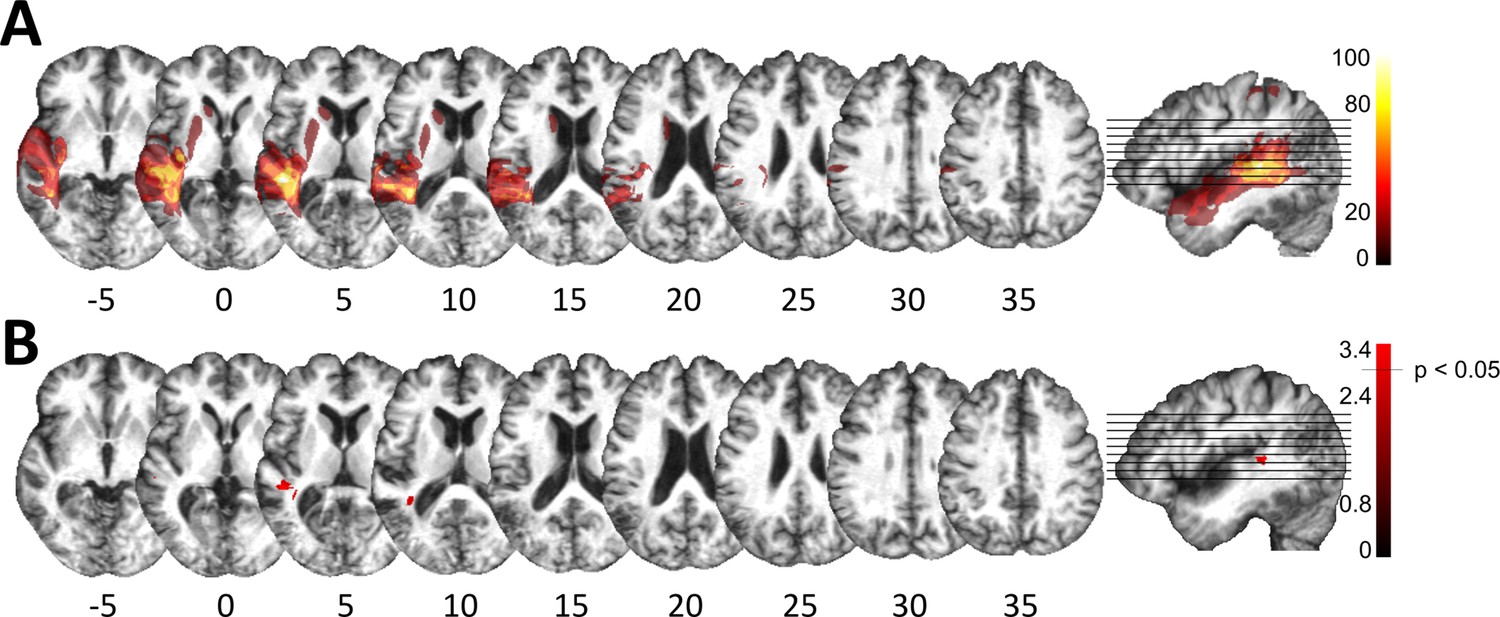
Lesion analysis of deficit-positive (LG+) and -negative (LG–) lesion group.
(A) Subtraction plot shows voxels more frequently damaged in LG+. Colorbar specifies relative frequency (percentage) of overlapping lesions in the patient group with impaired performance (LG+) after subtracting lesion overlap of LG− from lesion overlap of LG+. (B) Voxelwise statistical analyses (Liebermeister measure for binomial data, permutation FWE-corrected z-scores at α-level of p < 0.05): lesions in posterior superior temporal sulcus (STS) (Montreal Neurological Institute [MNI] −48, –34, 5 and −38, –43, 10) are significantly associated with impaired temporal information processing (LG+).
Figure 3—figure supplement 1
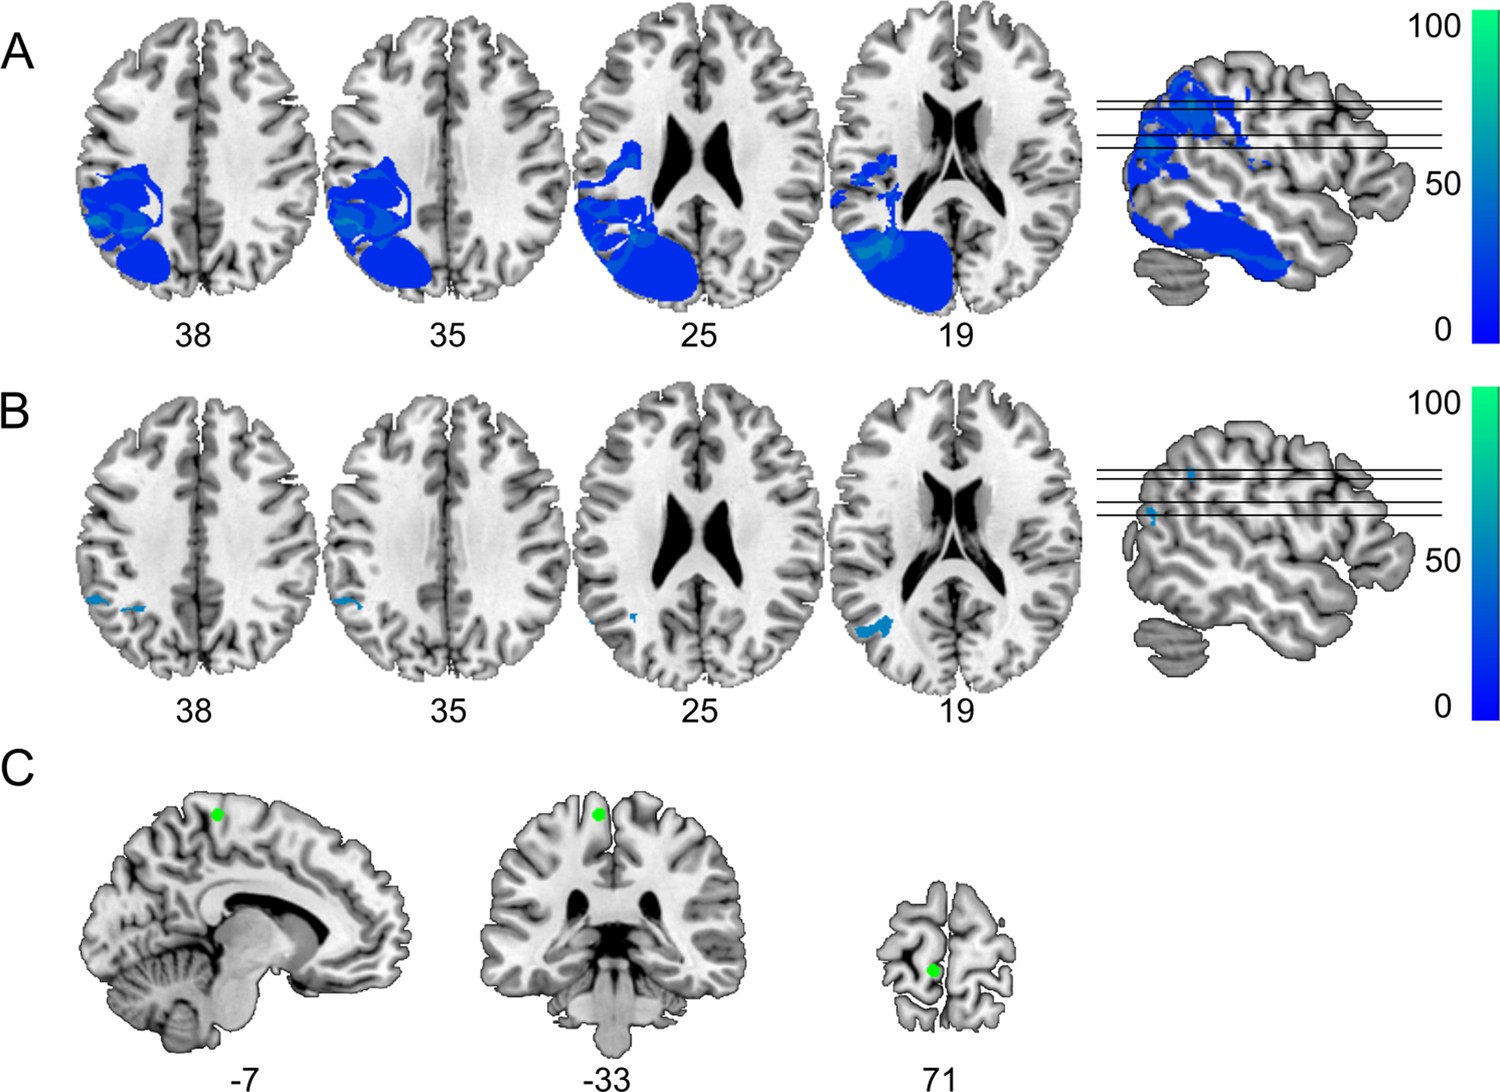
Definition of control regions for tractography.
(A) Subtraction plot shows voxels more frequently damaged in LG− relative to LG+. Colorbar specifies relative frequency (percentage) of overlapping lesions in the patient group with unimpaired performance (LG−) after subtracting lesion overlap of LG+ from lesion overlap of LG−. (B) Lesions in left inferior parietal lobe (IPL) and angular gyrus (AG) (Montreal Neurological Institute [MNI] –32 –53 38) and in the most posterior parts of the middle temporal gyrus (MTG) (MNI –43 –65 19) are more frequently associated with unimpaired temporal information processing (LG−) (deficit-negative control region). (C) Control region in the left motor cortex (foot area).
Figure 4 with 3 supplements

Lesion-informed probabilistic tractography.
Diffusion tractography based on a dataset of 12 healthy controls. Seed areas only included voxels being more frequently associated with impaired processing of temporal information. Inclusion masks were used to subdivide individual connectivity distributions into separate fiber bundles. The tracts are superimposed on the MRIcron ch2bet template in standard Montreal Neurological Institute (MNI) space (axial, coronal, and sagittal slices, corresponding MNI coordinates are indicated below). Displayed group variability maps result from binarized tract volumes (thresholded connectivity distributions) that quantify the percentage of subjects (>75%) showing connectivity between the seed masks and the respective voxel (values range from 0.0 to 1.0). Yellow: inferior fronto-occipital fasciculus (IFOF), green: superior longitudinal fasciculus (SLF), red: temporo-ponto-cerebellar tracts, dark blue: middle longitudinal fasciculus, light blue: cerebello-rubro-thalamic tract.
Figure 4—figure supplement 1
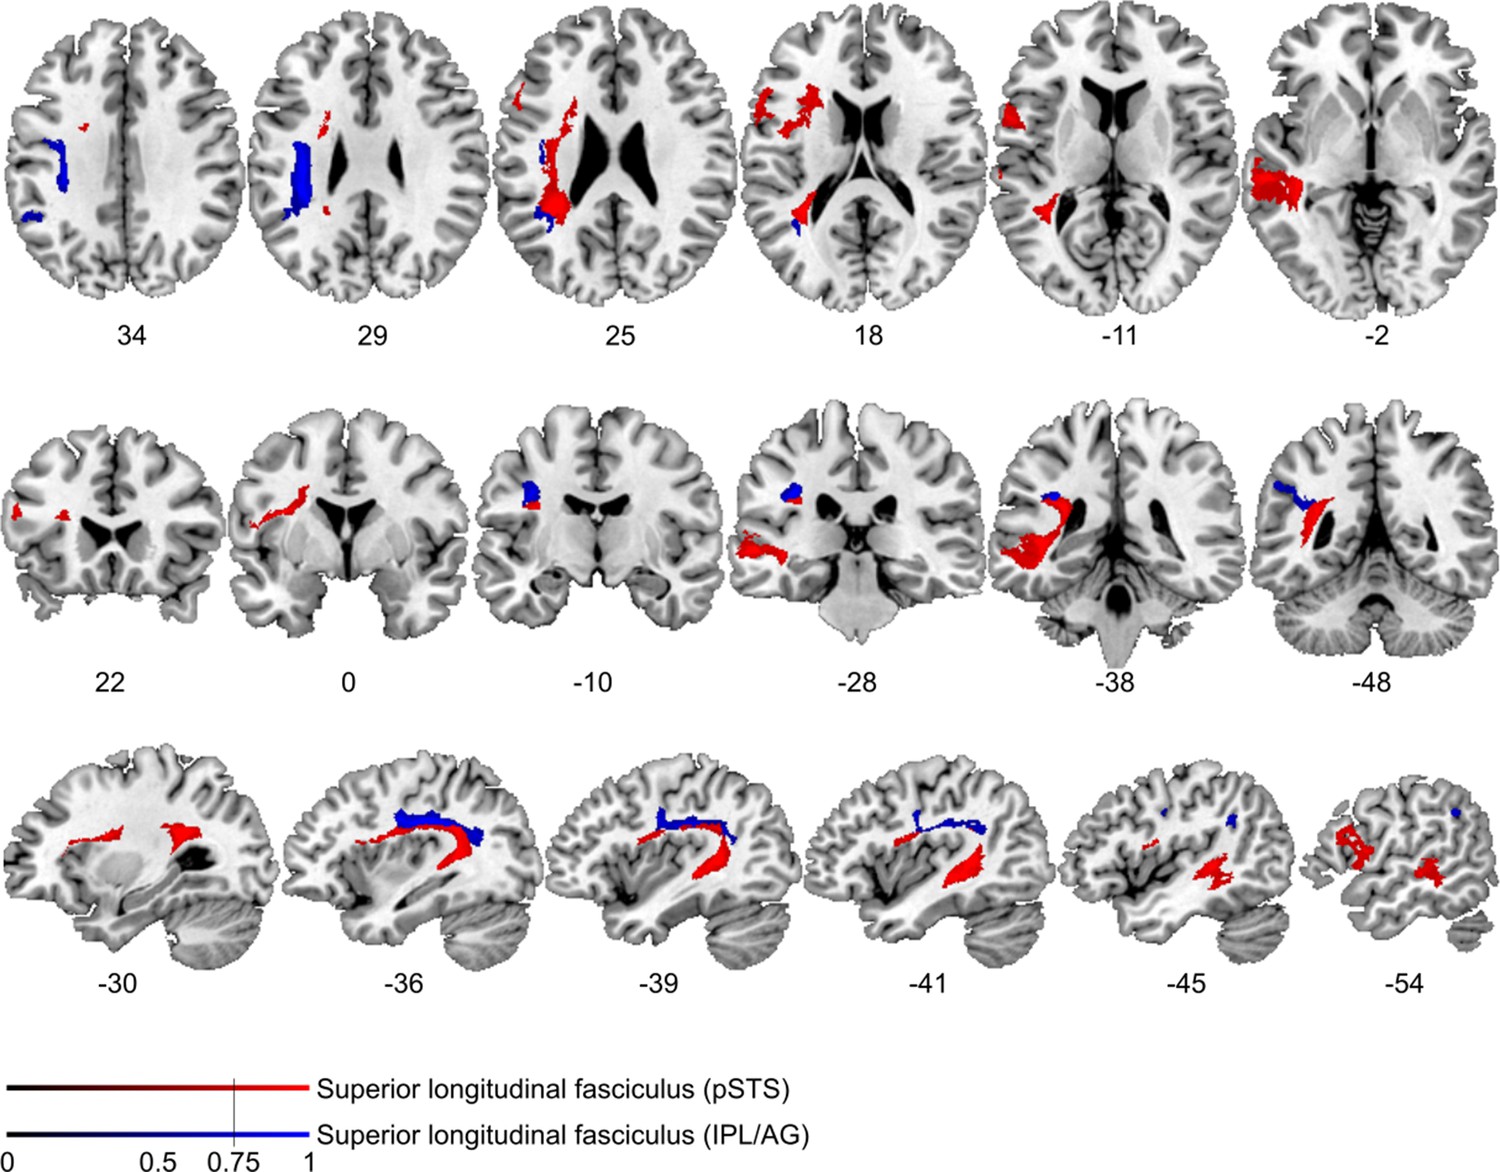
Comparison of cortico-cortical connectivity from deficit-negative control region.
Diffusion tractography based on a dataset of 12 healthy controls. Seed areas included voxels being more frequently affected in patients with unimpaired processing of temporal information (Figure 3—figure supplement 1B, blue, control region) or voxels more frequently associated with impaired processing of temporal information (Figure 3B, red). An inclusion mask was placed in the left periventricular white matter lateral to the superior corona radiata. The tracts are superimposed on the MRIcron ch2bet template in standard Montreal Neurological Institute (MNI) space (axial, coronal, and sagittal slices, corresponding MNI coordinates are indicated below). Displayed group variability maps result from binarized tract volumes (thresholded connectivity distributions) that quantify the percentage of subjects (>75%) showing connectivity between the seed masks and the respective voxel (values range from 0.0 to 1.0). Red: superior longitudinal fasciculus (SLF) originating from the original seed region in the superior temporal sulcus, blue: SLF traced from the control region, this bundle traveled further cranially with terminations in the left supplementary motor cortex corresponding to Brodman area 6.
Figure 4—figure supplement 2
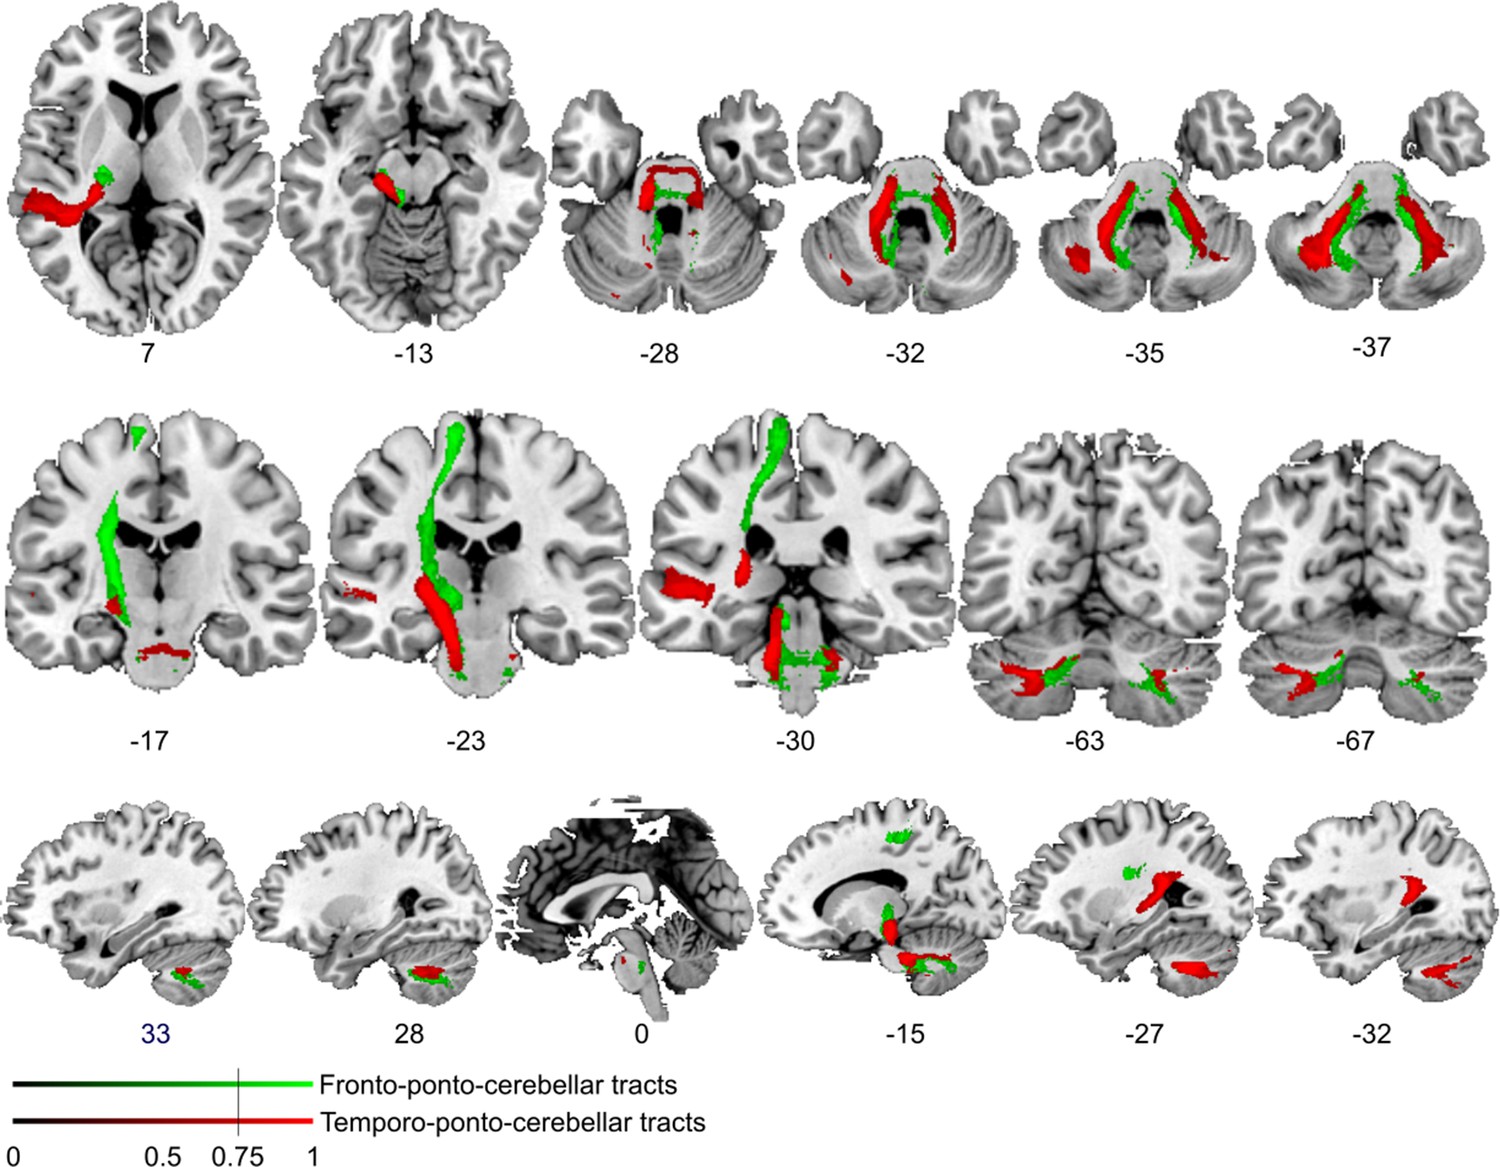
Comparison of cortico-cerebellar connectivity from control region in M1.
Diffusion tractography based on a dataset of 12 healthy controls. Seed areas included voxels in the foot area in the left primary motor cortex (Figure 3—figure supplement 1C, green, control region) or voxels more frequently associated with impaired processing of temporal information (Figure 3B, red). An inclusion mask was placed in the left and right middle cerebellar peduncle. The tracts are superimposed on the MRIcron ch2bet template in standard Montreal Neurological Institute (MNI) space (axial, coronal, and sagittal slices, corresponding MNI coordinates are indicated below). Displayed group variability maps result from binarized tract volumes (thresholded connectivity distributions) that quantify the percentage of subjects (>75%) showing connectivity between the seed masks and the respective voxel (values range from 0.0 to 1.0). Red: temporo-ponto-cerebellar tract originating from the original seed region in the superior temporal sulcus, green: fronto-ponto-cerebellar tract, this bundle traveled further medially and dorsally with terminations in the left and right cerebellar lobule VIII.
Figure 4—figure supplement 3
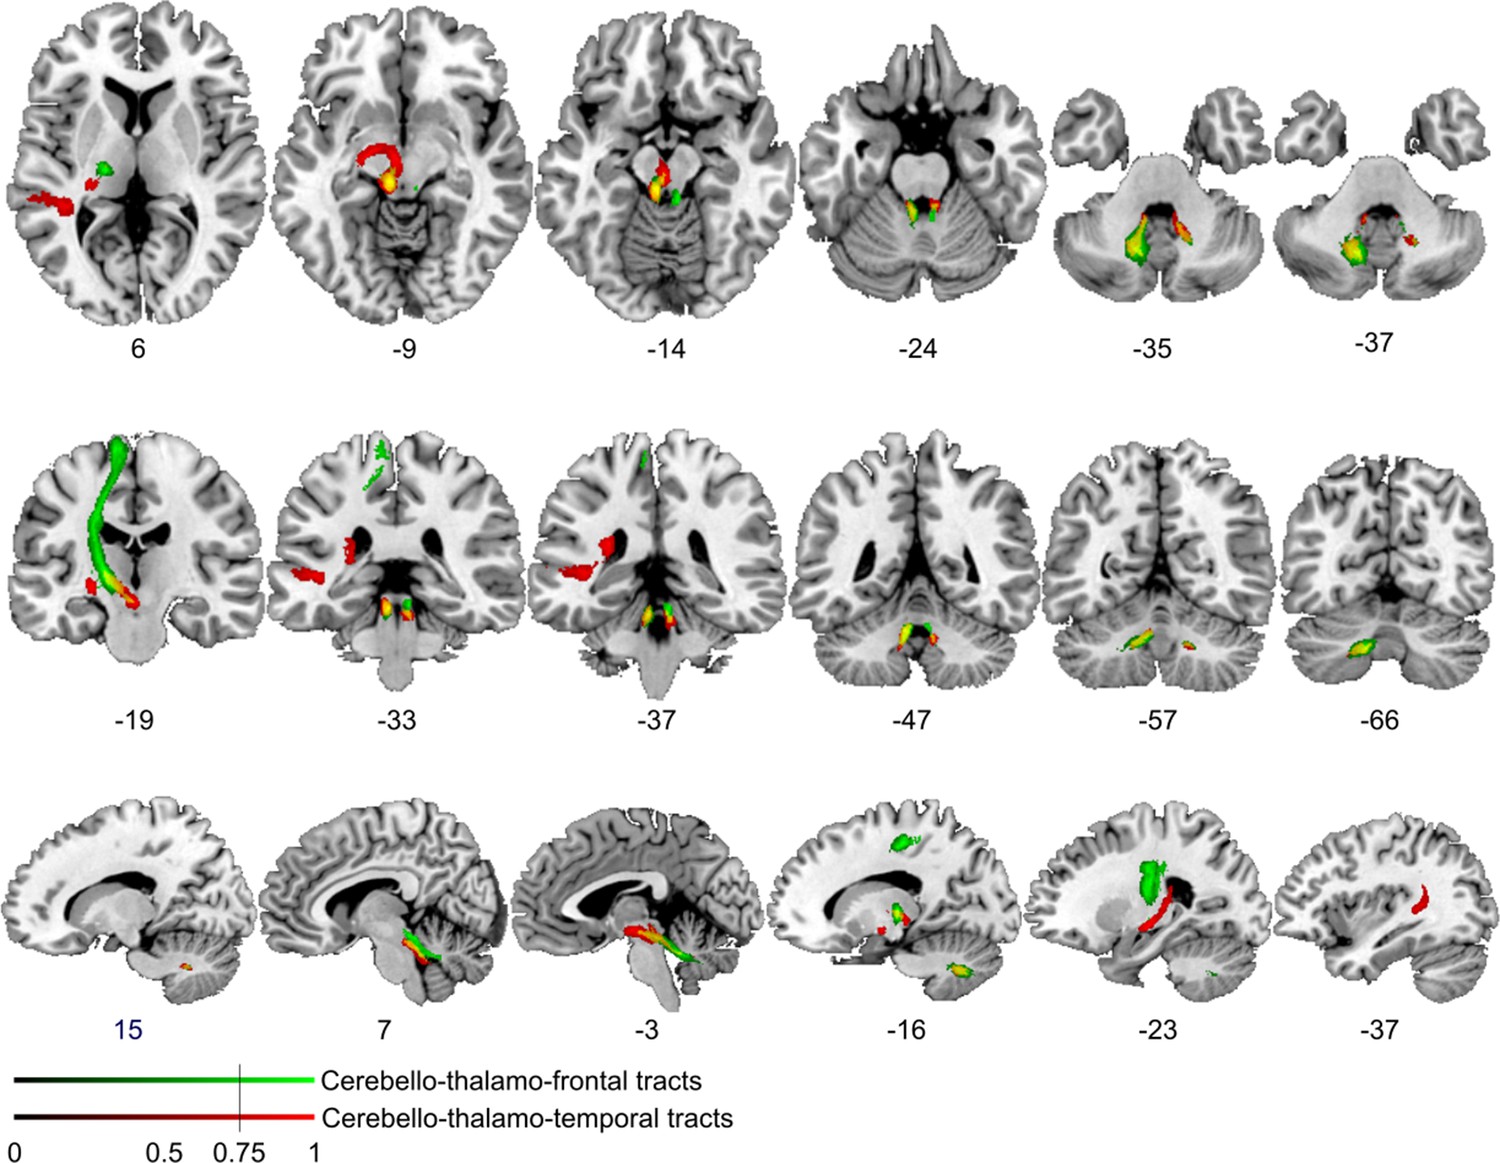
Comparison of cerebello-cortical connectivity from control region in M1.
Diffusion tractography based on a dataset of 12 healthy controls. Seed areas included voxels in the foot area in the left primary motor cortex (Figure 3—figure supplement 1C, green, control region) or voxels more frequently associated with impaired processing of temporal information (Figure 3B, red). An inclusion mask was placed in the left and right superior cerebellar peduncle. The tracts are superimposed on the MRIcron ch2bet template in standard Montreal Neurological Institute (MNI) space (axial, coronal, and sagittal slices, corresponding MNI coordinates are indicated below). Displayed group variability maps result from binarized tract volumes (thresholded connectivity distributions) that quantify the percentage of subjects (>75%) showing connectivity between the seed masks and the respective voxel (values range from 0.0 to 1.0). Red: cerebello-thalamo-temporal tract originating from the original seed region in the superior temporal sulcus, green: cerebello-thalamo-frontal tract, this bundle is not separable at the level of the cerebellum (yellow) but shows different projections in the thalamus. Fibers to the motor cortex could be delineated in the ventral lateral thalamic nuclei and fibers to the temporal cortex in the posterior thalamus.
Figure 5
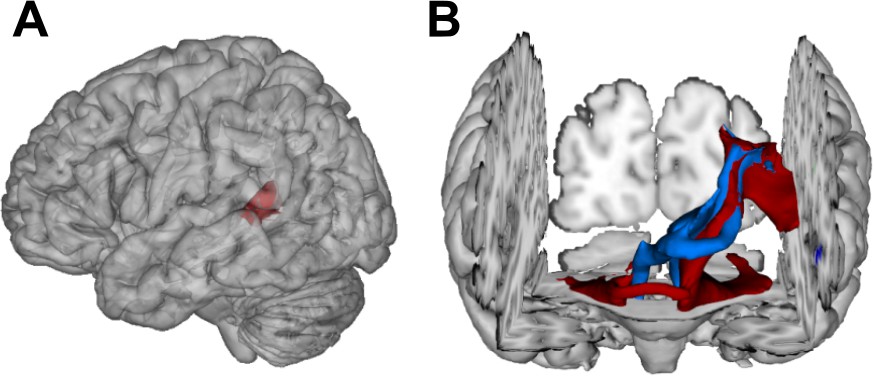
Visualization of temporal cortex-cerebellum connectivity.
Bilateral and bidirectional connectivity of seed regions (A) in the left posterior superior temporal sulcus (pSTS). (B) Temporo-ponto-cerebellar tracts (red) and cerebello-rubro-thalamo-temporal tracts (blue) connect pSTS with the postero-lateral cerebellum and the dentate nucleus, respectively.
Figure 6
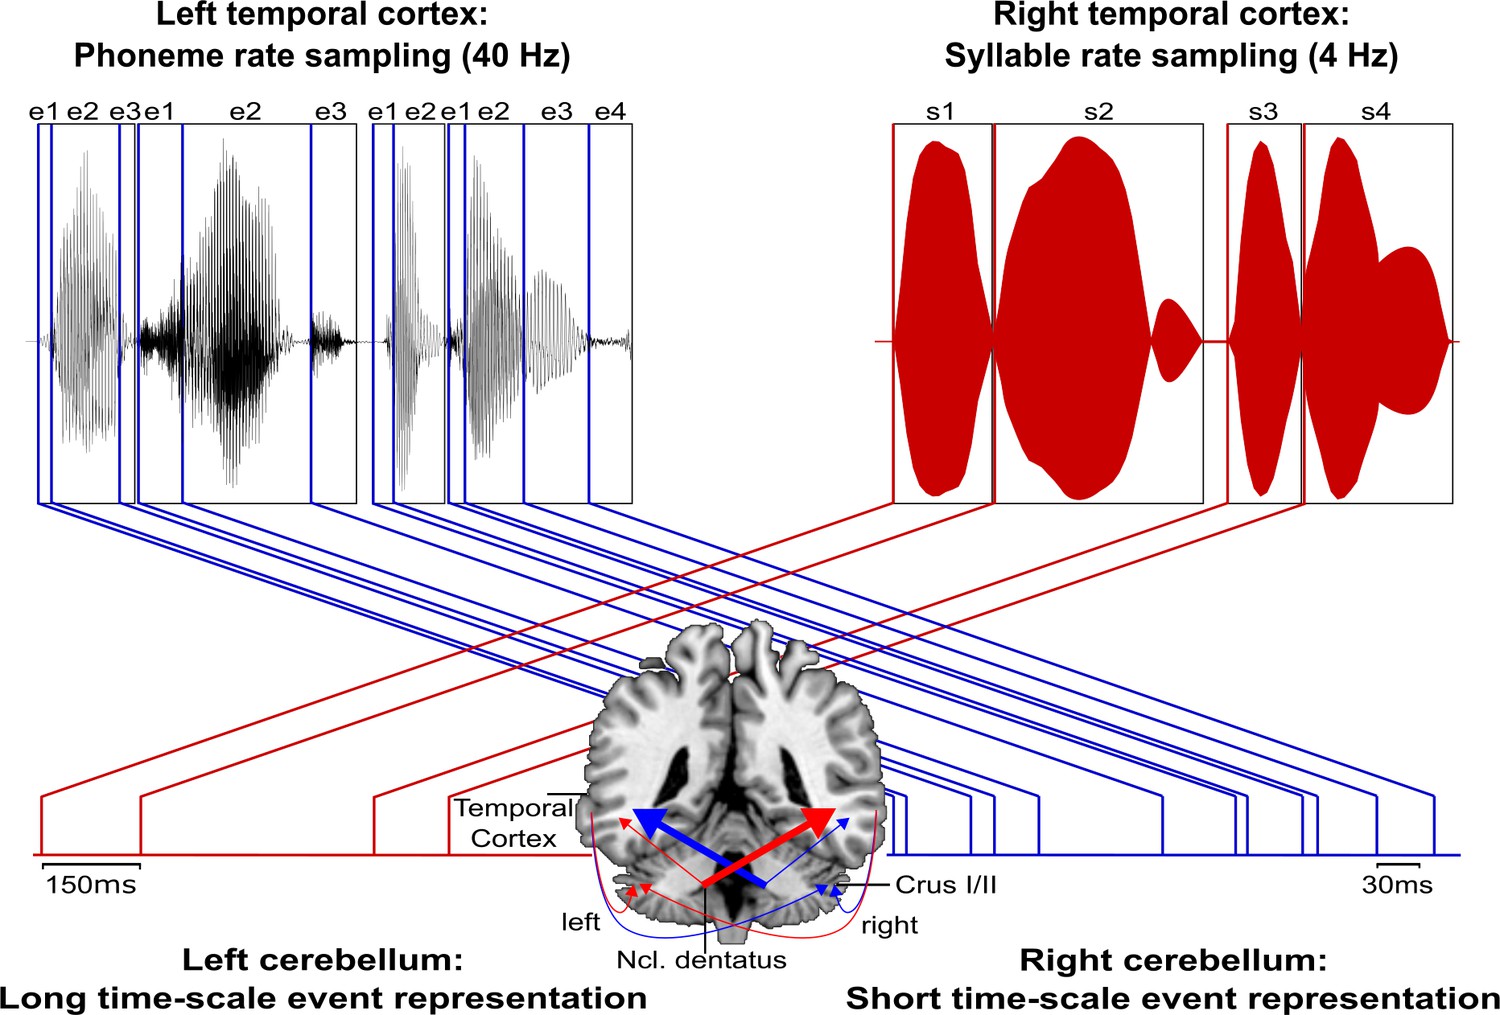
Schematic conceptualization of temporo-cerebellar interaction for internal model construction in audition.
Differential temporo-cerebellar interaction model depicting hypothesized connectivity between areas in the temporal lobe and cerebellum that may underlie sound processing at different timescales. Left and right cerebellum contribute to the encoding of event boundaries across long (red) and short (blue) timescales, respectively (Callan et al., 2007). These event representations are extracted from salient modulations of sound properties, that is, changes in the speech envelope (fluctuations in overall amplitude, red) corresponding to syllables (s1–s4) and the fine structure (formant frequency transitions, blue) corresponding to phonemes (e1–e4) (Rosen, 1992; Weise et al., 2012). Reciprocal ipsi- and cross-lateral temporo-cerebellar interactions between temporal cortex, crura I/II, and dentate nuclei yield unitary temporally structured stimulus representations conveyed by temporo-ponto-cerebellar and cerebello-rubro-thalamo-temporal projections (arrows). The resulting internal representation of the temporal structure of sound sequences, for example, speech, fits the detailed cortical representation of the auditory input to relevant points in time to guide the segmentation of a continuous input signal (waveform) into smaller perceptual units (boxes). This segmentation is further guided through weighting of information (symbolized by arrow thickness) towards the short and long timescale of sound processing in the left and right temporal cortex, respectively. This process allows distinctive sound features (e.g., word initial plosives /d/ (e1 in s1), /t/ (e1 in s2), and /b/ (e1 in s3) varying in voicing or place of articulation) to be optimally integrated at the time of their occurrence.
Tables
Table 1
Between-group comparisons of error rates for verbal discrimination tasks per category and contrastive feature.
| Variable | Group | Test statistics | |||
|---|---|---|---|---|---|
| Category | Patients(N = 12) | Controls(N = 12) | Category effect | Group effects | |
| Patients | Controls | ||||
| Words (W) | 0.02 ± 0.02 | 0.01 ± 0.01 | χ2(2) = 10.86p = 0.003 | χ2(2) = 5.72p = 0.056 | U = 83, p = 0.276 |
| Pseudowords (PW) | 0.05 ± 0.05 | 0.02 ± 0.03 | U = 96, p = 0.089 | ||
| Phonemes (P) | 0.07 ± 0.09 | 0.04 ± 0.07 | U = 95, p = 0.099 | ||
| Feature | Patients(N = 12) | Controls(N = 12) | Feature effects | Group effects | |
| Patients | Controls | ||||
| Place (W) | 0.04 ± 0.08 | 0.01 ± 0.03 | Z = –1.34p = 0.250 | Z = –1p = 0.500 | U = 79, p = 0.366 |
| Manner (W) | 0.01 ± 0.02 | 0.01 ± 0.02 | U = 72, p = 0.500 | ||
| Place (PW) | 0.16 ± 0.22 | 0.03 ± 0.05 | Z = –2.38p = 0.008 | Z = –1.342p = 0.250 | U = 101.5, p = 0.045 |
| Manner (PW) | 0.02 ± 0.05 | 0.01 ± 0.02 | U = 78.5, p = 0.366 | ||
| Place (P) | 0.23 ± 0.23 | 0.08 ± 0.14 | χ2(2) = 18.31p = 0.00004 | χ2(2) = 7.0p = 0.065 | U = 99.5, p = 0.057 |
| Fricatives (P) | 0.03 ± 0.12 | 0.03 ± 0.12 | U = 72, p = 0.500 | ||
| Voice (P) | 0.07 ± 0.1 | 0.06 ± 0.08 | U = 70.5, p = 0.466 | ||
| Place and voice (P) | 0.05 ± 0.15 | 0.03 ± 0.08 | U = 72.5, p = 0.500 | ||
-
Mean relative error rates (± SD) and non-parametric test statistics for within- (Friedman χ2 and Wilcoxon signed-rank Z-statistics, Bonferroni-adjusted significance levels set at p < 0.017) and between-subject comparisons (Mann-Whitney U test, exact p-values [one-sided]) for each category and contrastive feature.
Additional files
-
Transparent reporting form
- https://cdn.elifesciences.org/articles/67303/elife-67303-transrepform1-v2.pdf
-
Supplementary file 1
Supplementary patient data, methods and control analysis.
- https://cdn.elifesciences.org/articles/67303/elife-67303-supp1-v2.docx
Download links
A two-part list of links to download the article, or parts of the article, in various formats.
Downloads (link to download the article as PDF)
Open citations (links to open the citations from this article in various online reference manager services)
Cite this article (links to download the citations from this article in formats compatible with various reference manager tools)
Temporo-cerebellar connectivity underlies timing constraints in audition
eLife 10:e67303.
https://doi.org/10.7554/eLife.67303


