Contingency and chance erase necessity in the experimental evolution of ancestral proteins
- Department of Chemistry, University of Chicago, United States
- Department of Ecology and Evolution, University of Chicago, United States
- Department of Human Genetics, University of Chicago, United States
Figures
Figure 1

Assessing the effects of chance and contingency during evolution.
Each panel (A-D) shows the capacity of one experimental design to detect chance and contingency; the quadrants within each panel show evolutionary scenarios with varying degrees of chance and contingency. Chance (y-axis within each panel) is defined as random occurrence of events from a probability distribution in which multiple events have probability > 0 given some defined starting point; in the absence of chance, evolution is deterministic because a single outcome always occurs from any starting genotype. Contingency (x-axis within each panel) is defined as differences in this probability distribution given different starting or subsequent conditions; in the absence of contingency, outcomes are insensitive to these conditions, and all starting points lead to the same outcome or set of outcomes. Lines connect starting genotypes (white circles) to evolutionary outcomes. Quadrants show evolution under the influence of chance (orange), contingency (blue), or both (black); outcomes are necessary (brown, with dotted line) when neither chance nor contingency is important. Potential trajectories that are not observed because of deficiencies in experimental design are shown with reduced opacity. Thick black lines between quadrants in (A–D) separate evolutionary scenarios that can be distinguished from each other given each design. (A) Assessing one evolutionary replicate from one starting point provides no information about the extent to which chance, contingency, or necessity shape the outcome. (B) Assessing multiple replicates from one starting point can detect chance but provides no information about contingency. (C) Assessing one replicate each from multiple starting points can detect necessity or its absence, but cannot not distinguish between chance and contingency. (D) Studying multiple replicates from multiple starting genotypes allows chance, contingency, and necessity to be distinguished.
Figure 2 with 4 supplements
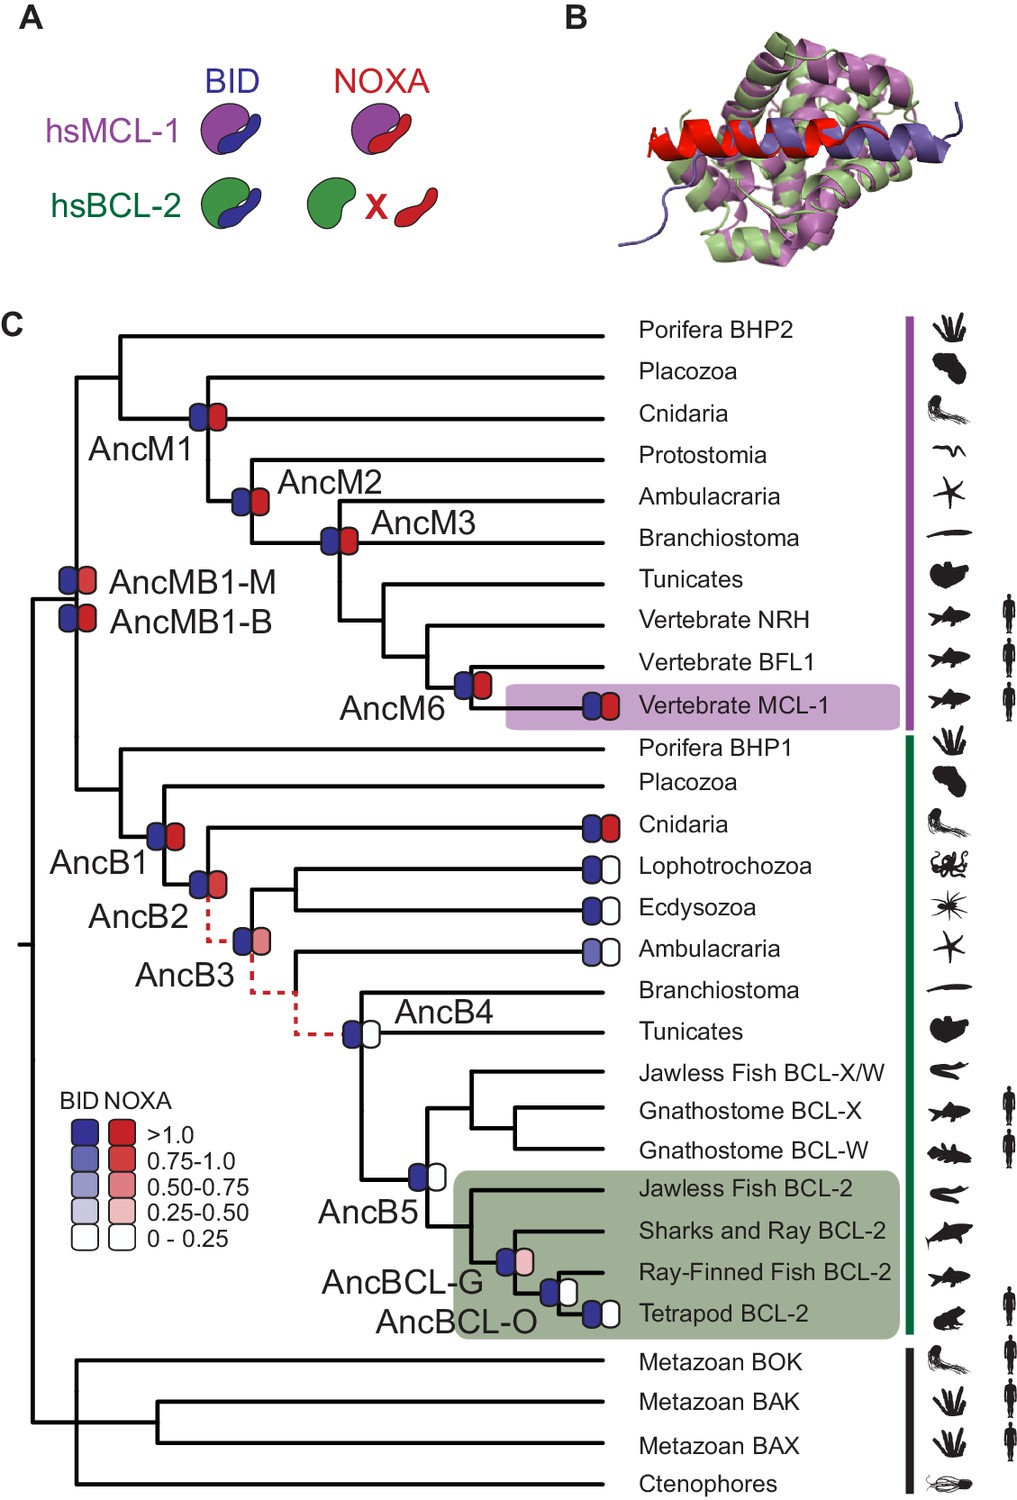
BID specificity was acquired during vertebrate BCL-2 evolution.
(A) Protein binding specificities of extant BCL-2 family members. Human MCL-1 (hsMCL-1, purple) strongly binds BID (blue) and NOXA (red), while human BCL-2 (hsBCL-2, green) strongly binds BID but not NOXA. (B) Crystal structures of MCL-1 (purple) bound to NOXA (red, PDB 2nla), and BCL-xL (green, a closely related paralog of BCL-2) bound to BID (blue, PDB 4qve). (C) Reduced maximum likelihood phylogeny of BCL-2 family proteins. Purple bar, MCL-1 class; green bar, BCL-2 class. The phylogeny was rooted using as outgroups the paralogs BOX, BAK, and BAX (black bar). Heatmaps indicate BID (blue) and NOXA (red) binding measured using the luciferase assay. Each shaded box shows the normalized mean of three biological replicates. Red dotted lines, interval during which NOXA binding was lost, yielding BID specificity in the BCL-2 proteins of vertebrates (green box). Purple box, vertebrate MCL-1. Silhouettes, representative species in each terminal group. AncMB1-M and -B are alternative reconstructions using different approaches to alignment ambiguity (see Materials and methods). For complete phylogeny, see Figure 2—figure supplement 3.
Figure 2—figure supplement 1
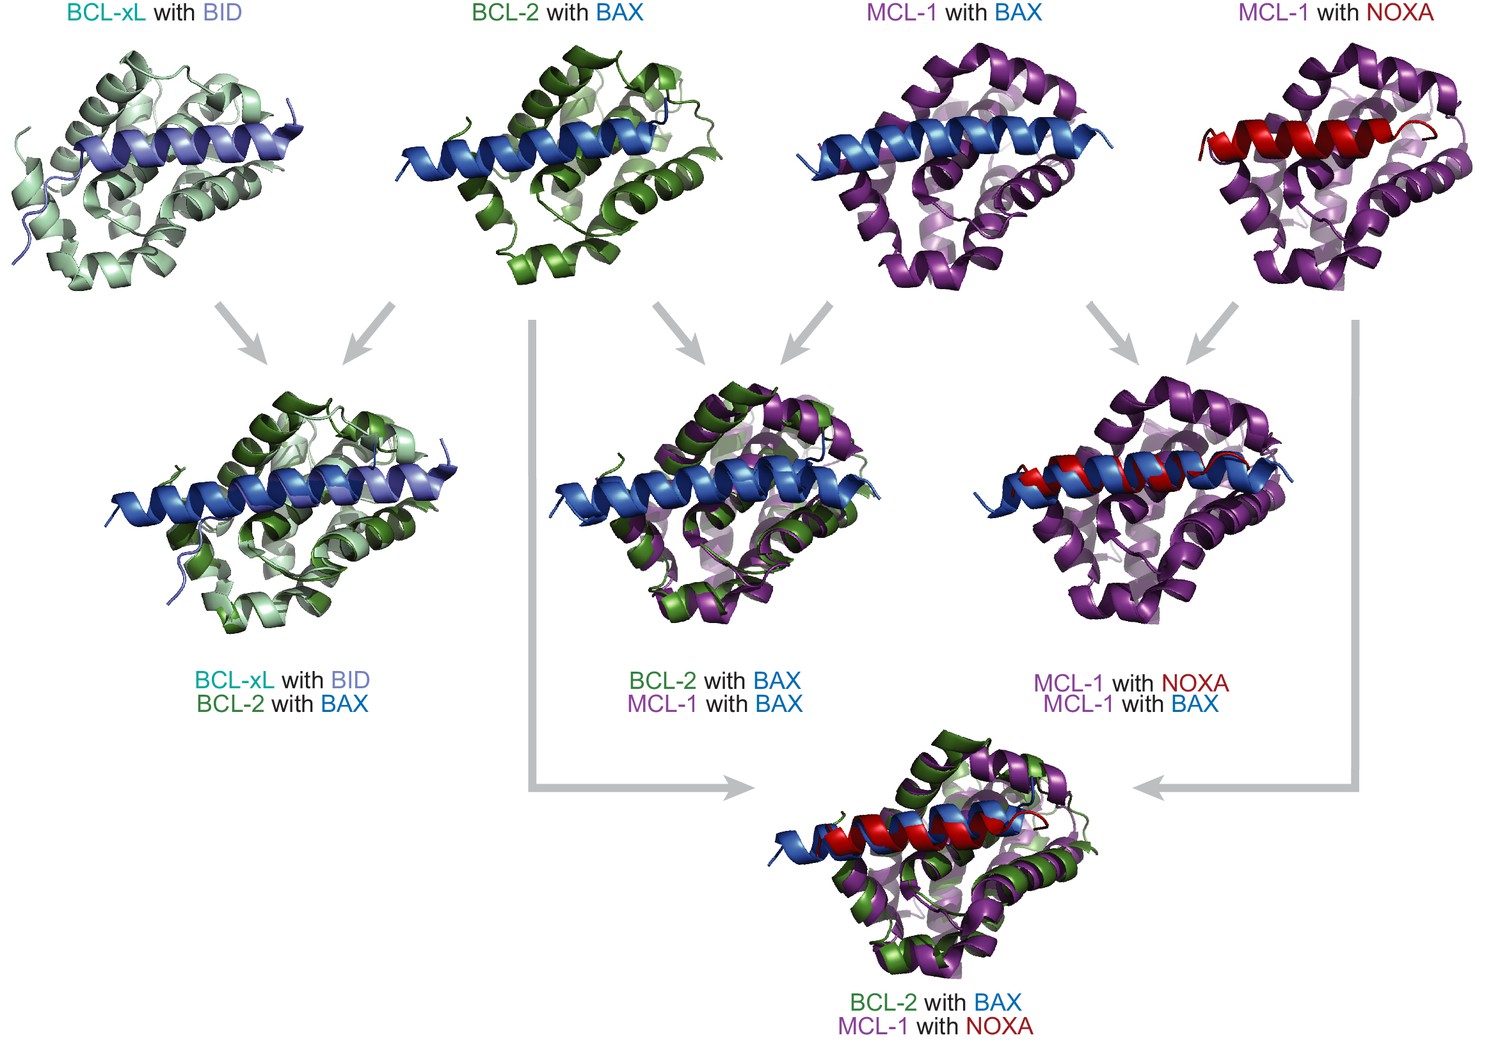
BCL-2 family proteins are structurally similar but have different binding profiles.
Crystal structures and overlays of BCL-xL (a vertebrate paralog of BCL-2, light green) bound to BID (light blue; PDB: 4qve); BCL-2 (green) bound to BAX (a protein with a BID-like binding profile, blue; PDB: 2xa0); MCL-1 (purple) bound to BAX (blue; PDB: 3pk1); and MCL-1 bound to NOXA (red; PDB: 2nla). The BCL-2 family proteins bind the coregulator proteins at the same interface.
Figure 2—figure supplement 2

Ancestral sequence reconstruction procedure in schematic form.
(1) Sequences are collected, including those of proteins conferring different functions (red v. blue)and others with unknown functions (black). These sequences may be orthologs from various species, paralogs related by gene duplication events, or both. (2) Sequences are aligned. (3) A phylogeny is inferred. (4) Using the inferred phylogeny, the aligned sequences, and a model of sequence evolution, the most likely state at each ancestral node is determined. (5) Ancestral sequences are synthesized and tested for function. (6) Functional differences among successive ancestral proteins indicate functional changes during evolutionary history (red bar).
Figure 2—figure supplement 3
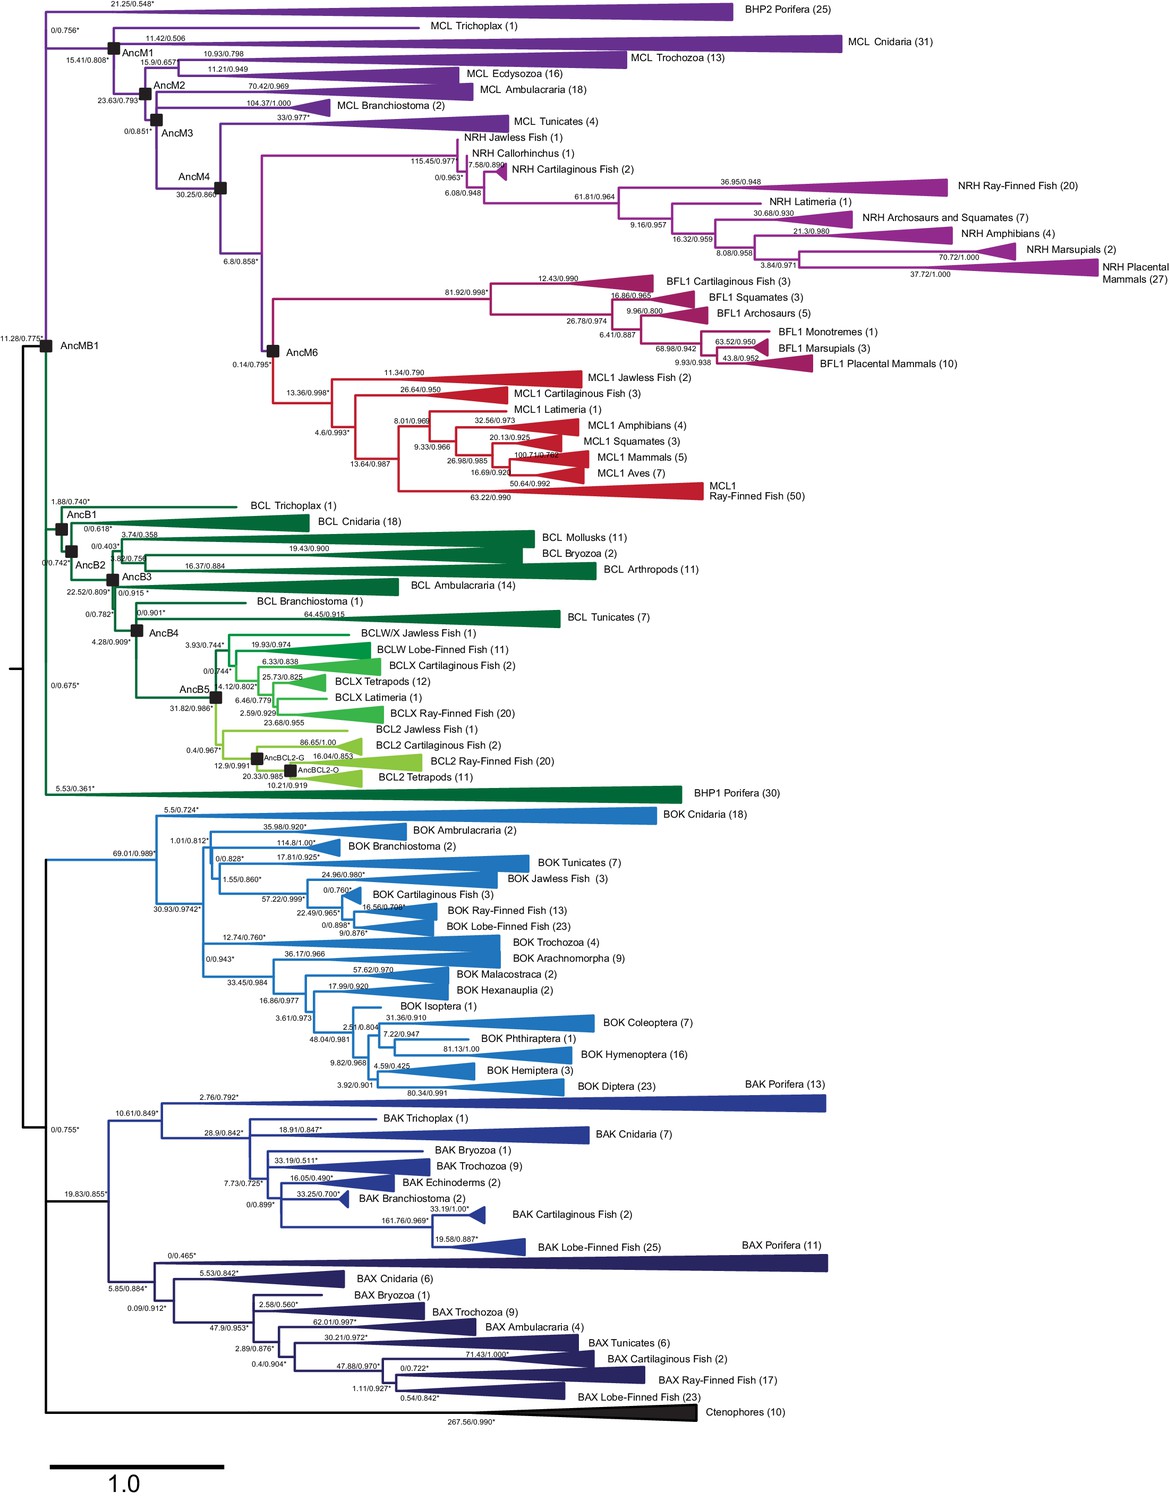
Maximum likelihood phylogeny of BCL-2 family proteins.
Light green, vertebrate BCL-2; light-medium and dark-medium green, vertebrate BCLX and BCLW, respectively; dark green, non-vertebrate sequences most closely related to vertebrate BCL-2; red, vertebrate MCL-1; maroon, vertebrate BFL1; light purple, vertebrate NRH; dark purple, non-vertebrate sequences most closely related to vertebrate MCL-1; dark blue, BAX; medium blue, BAK; light blue, BOK; black, ctenophore sequences. Parentheses, number of sequences in each clade. Black squares, ancestral sequences reconstructed and tested. Node labels, approximate likelihood ratio statistics and transfer bootstrap values. Asterisks, nodes constrained to be congruent with known taxonomic relationships.
Figure 2—figure supplement 4
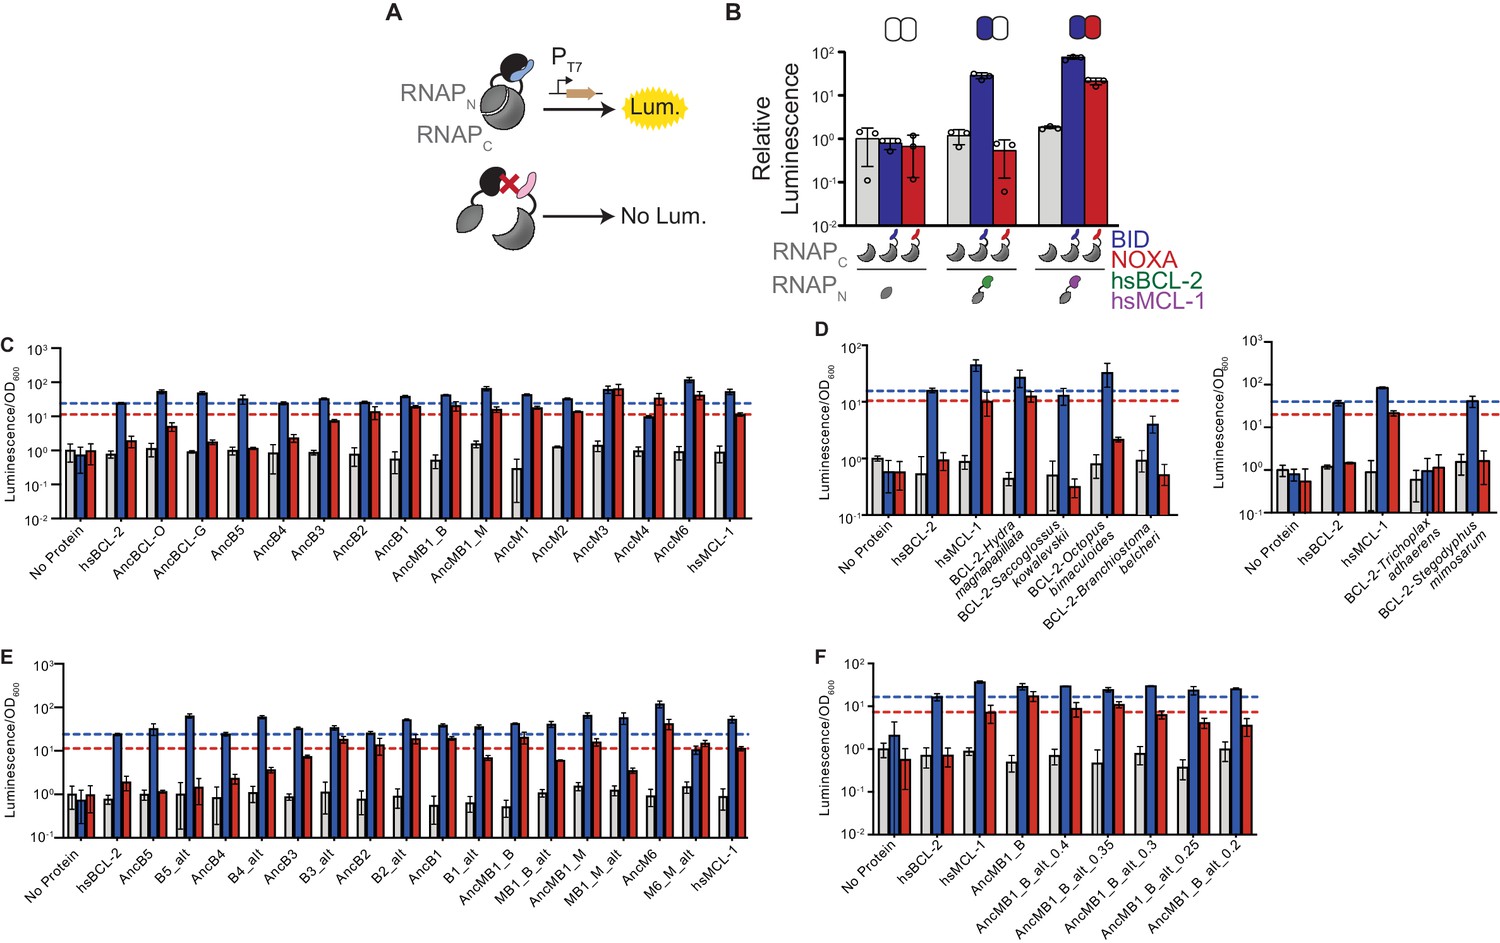
Binding of BID and NOXA to extant and ancestral proteins.
(A) Schematic of the luciferase reporter assay to assess PPIs. If a BCL-2 family protein (black) binds a coregulator protein (blue), the split T7 RNAP biosensor (gray) assembles and drives luciferase expression. If a coregulator (pink) is not bound, no luciferase is expressed. (B) Interactions of human BCL-2 and MCL-1 with BID (blue bars) and NOXA (red) in the luciferase assay, compared to no-coregulator control (gray). Activity is scaled relative to no-coregulator control with no-BCL-2 protein. Columns and error bars, mean ± SD of three biological replicates (circles). Shaded boxes above show the same data in heatmap form: BID activity is normalized relative to hsBCL-2 with BID; NOXA activity is normalized to hsMCL-1 with NOXA. (C) Interactions of ancestral reconstructed proteins with BID (blue) and NOXA (red) in the luciferase assay, compared to no-coregulator control (gray). Activity is scaled relative to no-coregulator control with no-BCL-2 family protein. Columns and error bars, mean ± SD of three biological replicates. hsBCL-2 with BID (dashed blue line). hsMCL-1 with NOXA (dashed red line). (D) Same as (C), but for extant species Hydra magnapapillata (Cnidaria), Octopus bimaculoides (Lophotrochozoa), Saccoglossus kowalevskii (Hemichordata), Branchiostoma belcheri (Cephalochordata), Trichoplax adhaerens (Placozoa), and Stegodyphus mimosarum (Ecdysozoa). (E) Same as (C), but contains alternative reconstructions (Alt) for each ancestral protein, which combine all plausible alternative amino acid states (PP > 0.2) in a single ‘worst-case’ alternative reconstruction. (F) Same as (C), but contains multiple alternative reconstructions for AncMB1_B. In each case, all plausible alternative amino acid states with PP greater than the listed value are included in a single ‘worst-case’ alternative reconstruction.
Figure 3 with 3 supplements
Continuous directed evolution of specificity in modern and ancestral BCL-2 family proteins.
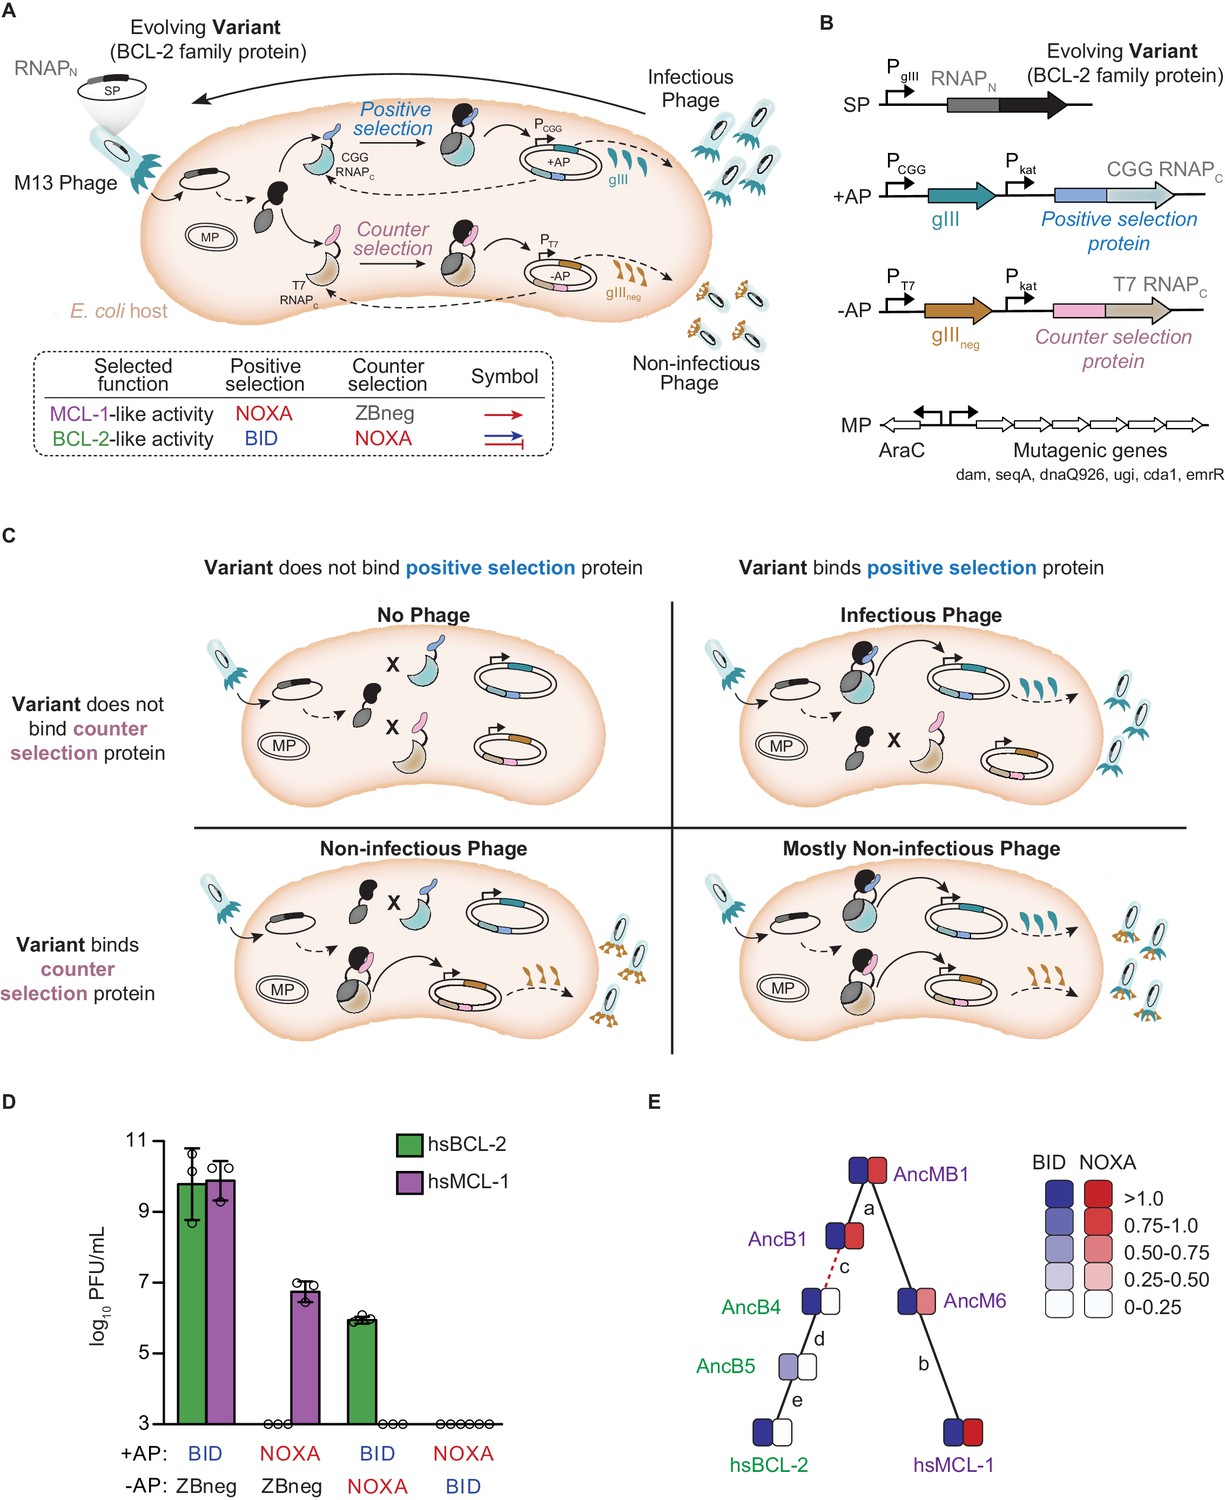
(A) Top: Components of the PACE system for evolving PPI specificity. Solid arrows show potential binding events. Dashed arrows show potential protein expression. The protein targeted for altered specificity (black) is fused to the N-terminus of RNA polymerase (RNAPN, dark gray) and placed into the M13 phage genome (SP, selection plasmid). Upon infection of host E. coli, the target gene-RNAPN fusion is expressed. Host cells carry accessory plasmids (+AP and −AP) that contain the C-terminus of RNAP (RNAPC) fused to peptides for which specificity is desired (blue, positive selection protein; pink, counterselection protein). Binding of the target protein to either the selection protein or counterselection protein reconstitutes a functional RNAP. Binding of RNAP to the corresponding promoter results in the expression of either gIII (teal) or gIIIneg (gold). gIII is necessary to produce infectious phage. gIIIneg is a dominant-negative version of gIII which results in the production of non-infectious phage. An arabinose-inducible mutagenesis plasmid in the system (MP) increases the mutation rate of the evolving protein. Bottom: PACE schemes for evolving PPI specificities. To select for BCL-2 like specificity, positive selection to bind BID was imposed with counterselection to avoid binding NOXA (blue arrow and red bar). To evolve MCL-1 like activity, positive selection to bind NOXA (red arrow) was imposed after a phase of selection for BID binding, both with counterselection to avoid nonspecific binding using a control zipper peptide (ZBneg). (B) Map of the phage SP, the positive and counterselection accessory plasmids (+AP and −AP), and the MP. (C) Selection for protein variants with the desired specificity. Upper left: Infection by a phage carrying a protein variant that binds neither the positive selection nor the counterselection protein results in production of little to no progeny phage. Upper right: Infection by a phage carrying a protein variant that binds only the positive selection protein results in expression of gIII and production of infectious phage. Lower left: Infection by a phage carrying a protein variant that binds only the counterselection protein results in expression of gIIIneg and production of non-infectious phage. Lower right: Infection by a phage carrying a protein variant that binds the positive selection and counterselection proteins results in expression of both gIII and gIIIneg, leading to production of primarily non-infectious phage. (D) Growth assays to assess selection and counterselection. Plaque forming units (PFU) after culturing 1000 phage-containing hsBCL-2 (green) or hsMCL-1 (purple) on E. coli containing various APs. Detection limit 103 PFU/mL. Bars show mean ± SD of three replicates (circles). (E) Phylogenetic relations of starting genotypes used in PACE. Each starting genotype was selected to acquire a new specificity in four independent replicates. Green, proteins selected to gain NOXA binding; purple, proteins selected to lose NOXA binding. Red dashed line, interval during which NOXA binding was historically lost, yielding BID specificity in the BCL-2 clade. Letters, index of phylogenetic intervals between ancestral proteins referred to in Figure 5.
Figure 3—figure supplement 1
Using PACE to evolve target PPI specificity of BCL-2 family proteins.
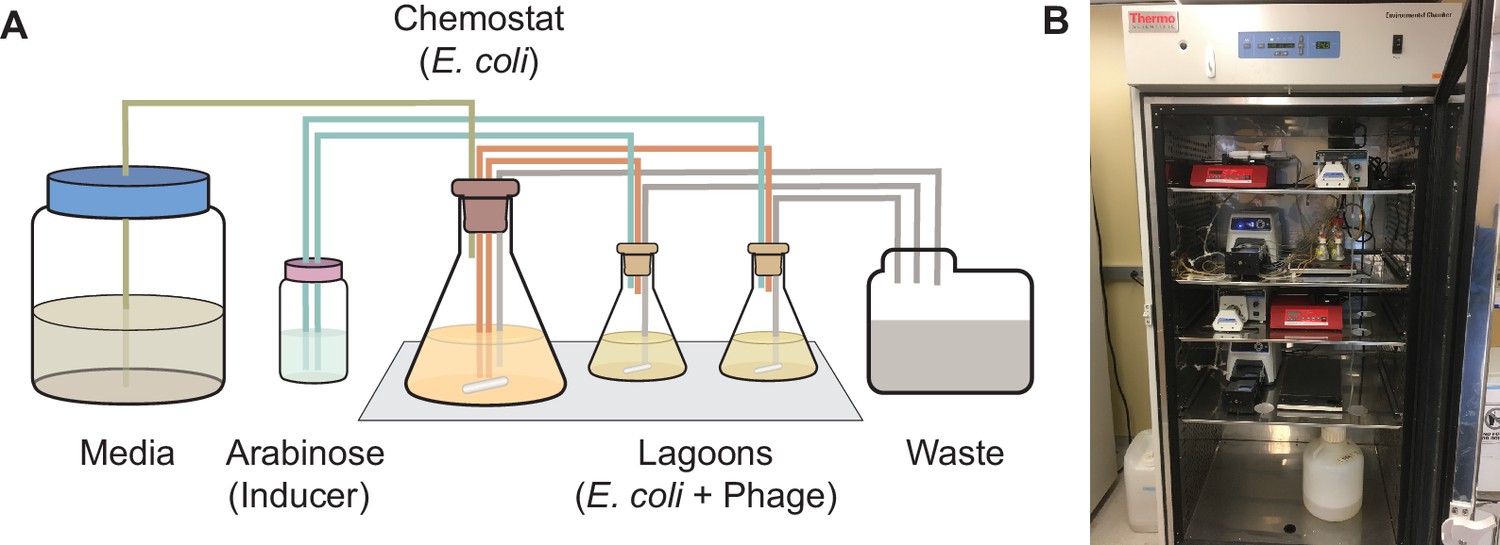
(A) Schematic of a PACE experiment. Davis Rich carboy media flows into the chemostat, which contains E. coli with the positive selection (+AP), counterselection (−AP), and mutagenesis plasmids (MP). The cells then flow into the lagoons, which contain phage with the evolving BCL-2 family protein. Arabinose is pumped into the lagoons to induce the mutagenesis plasmid in the E. coli. Both chemostats and lagoons are connected to the waste to maintain proper volume, cell density, and flow rate. (B) Picture of representative PACE experiment from this work.
Figure 3—figure supplement 2
Selection schemes and phage titers for changes in PPI specificity.
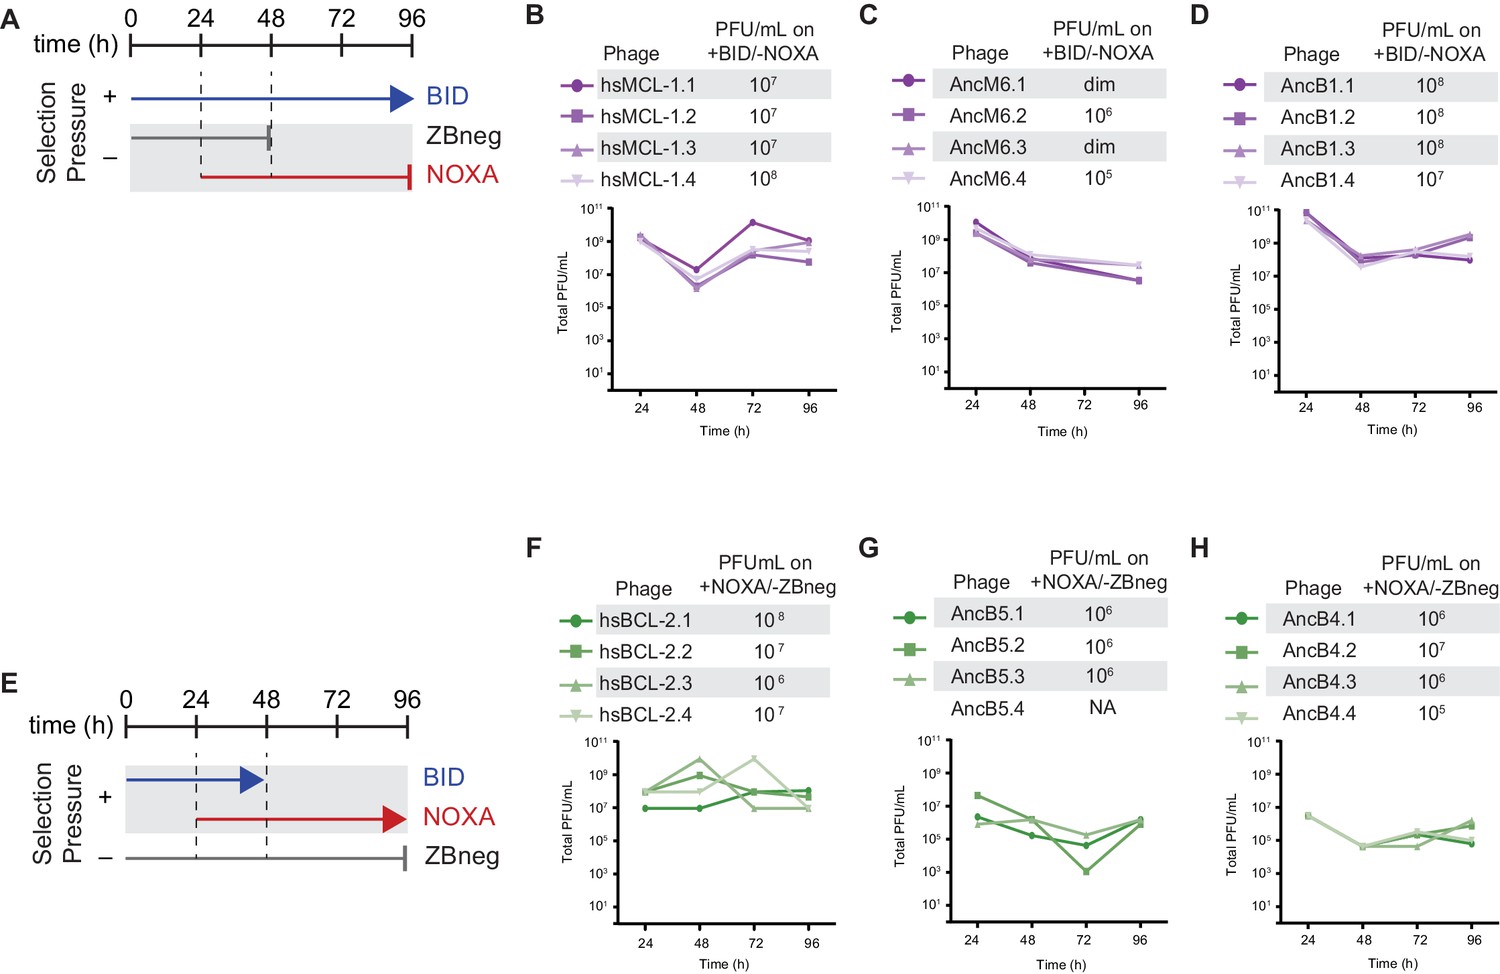
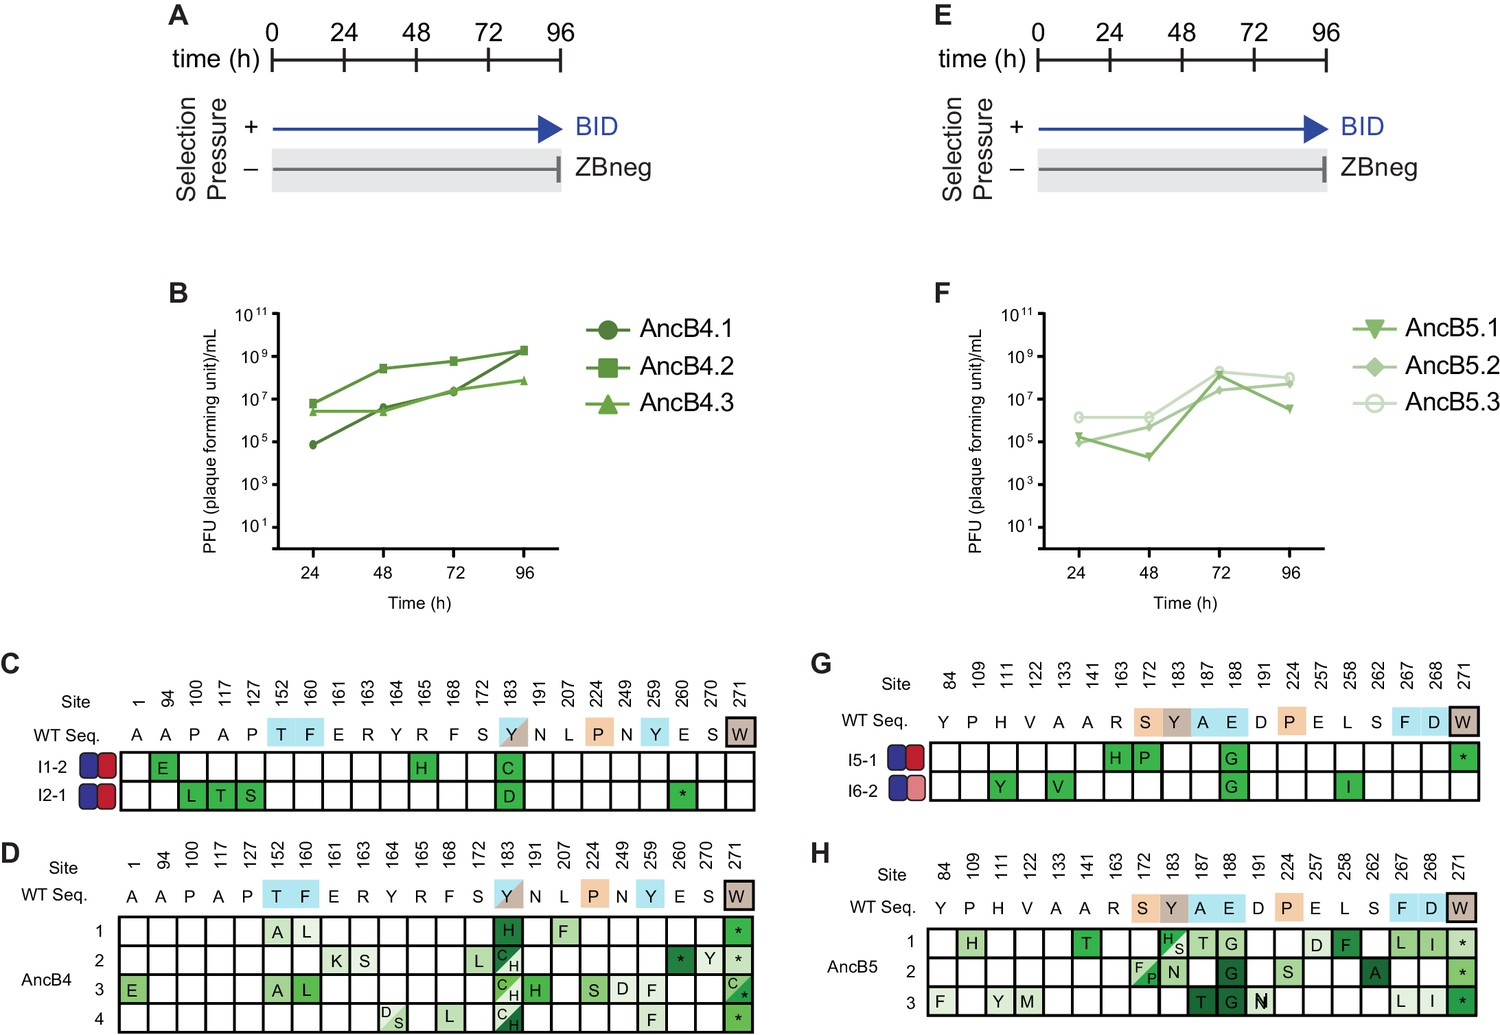
(A) Timeline of PACE experiments when hsMCL-1, AncM6, and AncB1 were evolved to lose NOXA binding. ZBneg is a control zipper peptide. (B) Phage titers (PFU/mL) over time (bottom) and activity-dependent phage titers at the end of the PACE experiments (top) when hsMCL-1 was evolved to lose NOXA binding. Activity-dependent plaque assays used plasmids 28–46 and Jin 487. (C) Same as (E) for AncM6. ‘dim’ means plaques were visible but weak, and therefore not quantifiable. (D) Same as (E) for AncB1. (E) Timeline of PACE experiments when hsBCL-2, AncB5, and AncB4 were evolved to gain NOXA binding. (F) Phage titers (PFU/mL) over time (bottom) and activity-dependent phage titers at the end of the PACE experiments (top) when hsBCL-2 was evolved to gain NOXA binding. Activity-dependent plaque assays used plasmids 28–48 and 29–39. (G) Same as (H) for AncB5. (H) Same as (H) for AncB4.
Figure 3—figure supplement 3
Fluorescence polarization of PACE-evolved variants.
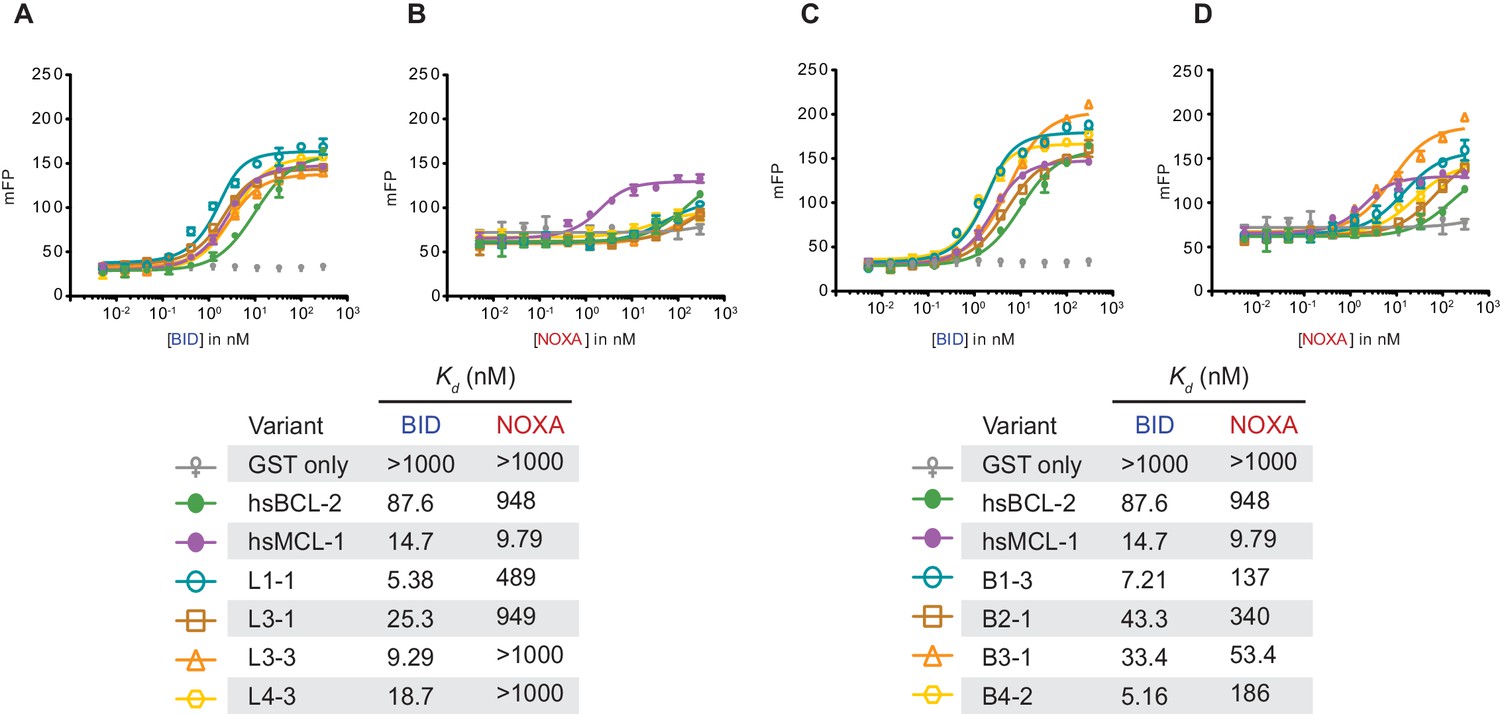
(A) BID fluorescence polarization for hsMCL-1 variants evolved to lose NOXA binding. Bars are the mean of three replicates; error bars, SD. mFP, normalized measured fluorescent polarization. Kd estimates are shown below in the table. (B) Same as (A), but for NOXA binding. (C) BID fluorescence polarization for hsBCL-2 variants evolved to gain NOXA binding. (D) Same as (C), but for NOXA binding.
Figure 4 with 6 supplements

Chance and contingency shape evolutionary outcomes.
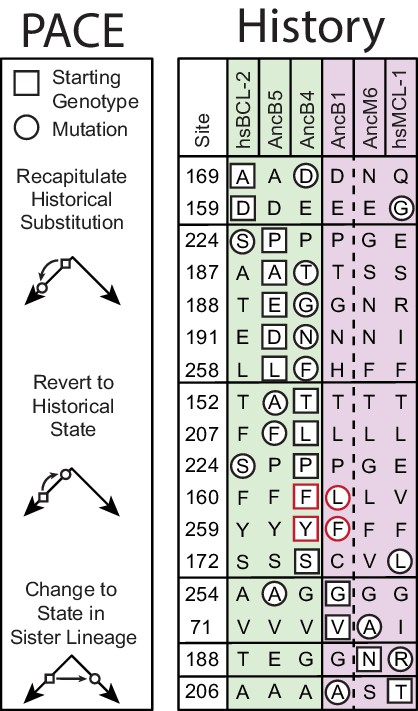
(A) Phenotypic outcome of PACE experiments when proteins with MCL-1-like specificity were selected to maintain BID and lose NOXA binding. For each starting genotype, the BID (blue) and NOXA (red) binding activity of the starting genotype and three phage variants isolated from each evolved replicate (number) are shown as heatmaps. (B) Phenotypic outcome of PACE experiments when proteins with BCL-2-like specificity were selected to gain NOXA binding. (C) Frequency of acquired states in PACE experiments when proteins with MCL-1-like specificity were selected to maintain BID and lose NOXA binding. Rows, outcomes of each replicate trajectory. Columns, sites that acquired one or more non-wild-type amino acids (letters in cells) at frequency >5%; color saturation shows the frequency of the acquired state. Site numbers and wild-type amino acid (WT AA) states are listed. Gray, sites that do not exist in AncB1. (D) Frequency of acquired states when BCL-2-like proteins were selected to gain NOXA binding. (E) Repeatability of acquired states across replicates. The 100 non-WT states acquired in all experiments were categorized as occurring in 1 or >1 replicate trajectory from 1 or >1 unique starting genotype, with the number in each category shown. The vast majority of states evolved in just one replicate from one starting point (black). (F) Historical substitutions that contributed to the change in PPI specificity rarely occur or revert during PACE. Rows, substitutions that historically occurred between AncB1 and AncB4, the ancestral proteins that flank the loss of NOXA on the phylogeny. For each substitution, columns show whether the historical ancestral or derived state was acquired in PACE trajectories from each ancestral starting point. Purple and green boxes, PACE acquisition of ancestral or derived state, respectively, in each replicate. White boxes, neither state acquired.
Figure 4—figure supplement 1
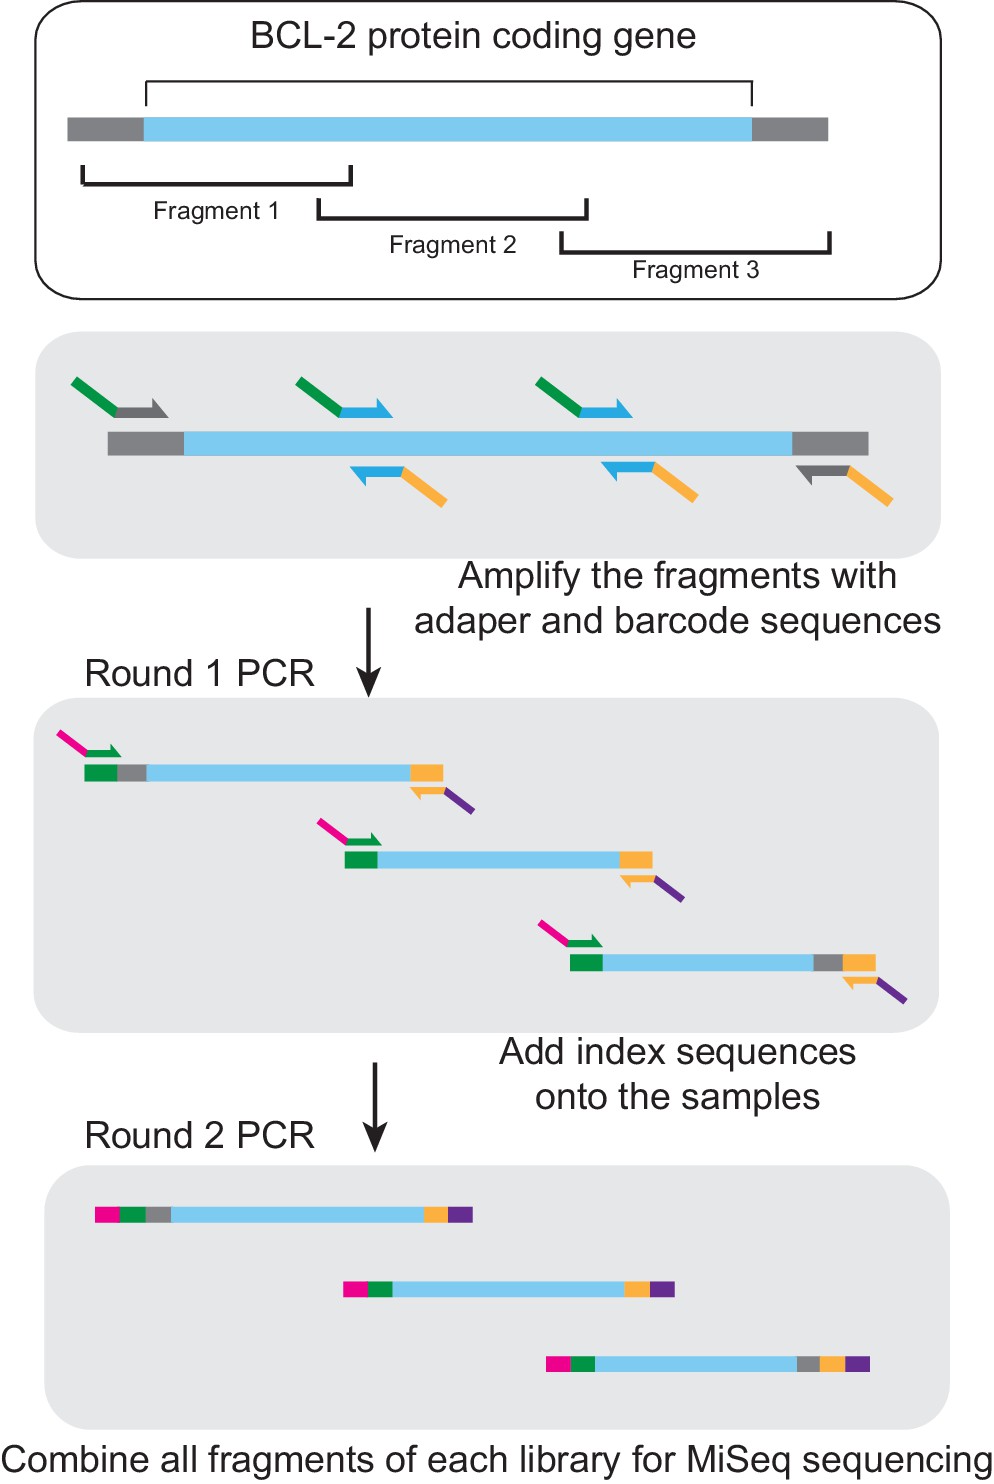
MiSeq library preparation.
After isolation of phage DNA, the coding region of the evolving BCL-2 family protein was amplified in three overlapping fragments, each of which was smaller than 300 bp. The DNA fragments were then amplified using sequence-specific primers. MiSeq adapters were added in a second PCR step. These fragment libraries were combined and used for MiSeq sequencing. Blue, target gene coding region. Gray, adjacent vector sequence. Green, forward adapter and barcode sequence. Orange, reverse adapter and barcode sequence. Magenta, index one sequence. Purple, index two sequence.
Figure 4—figure supplement 2
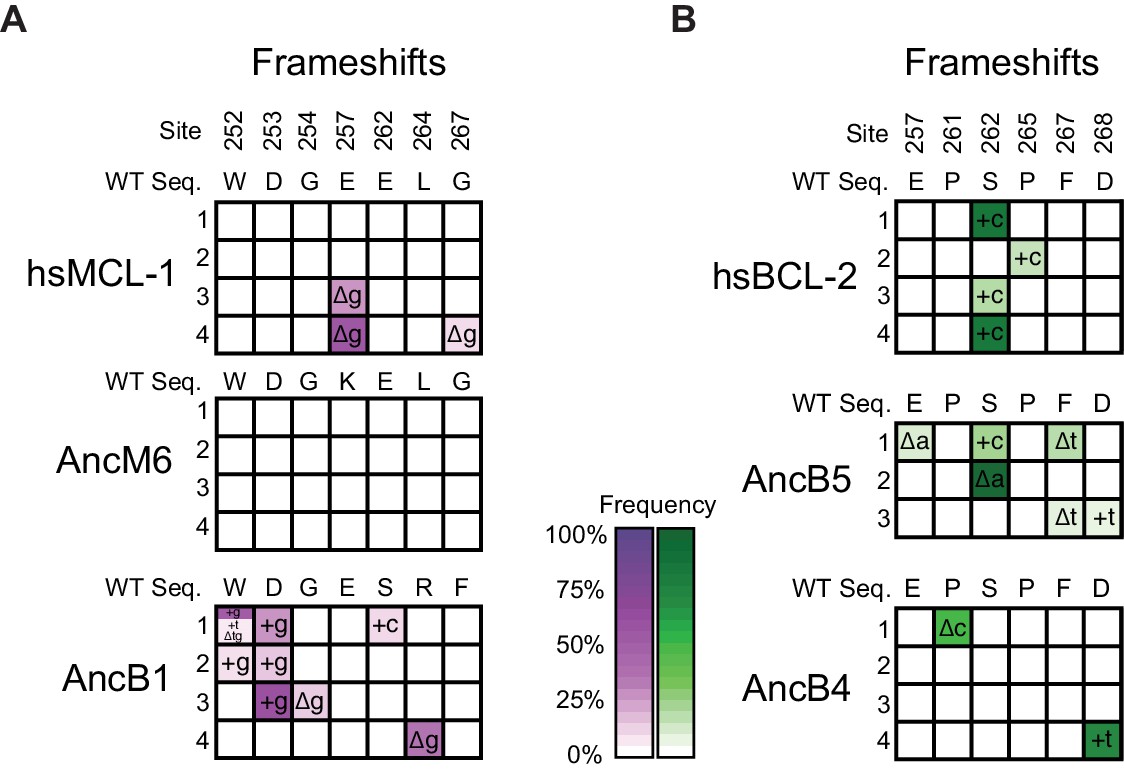
Frequency of insertions and deletions during PACE.
(A) Allele frequency of frameshifts in replicate PACE experiments started from hsMCL-1, AncM6, and AncB1 evolved to lose NOXA binding. Site numbers and wild-type (WT) amino acid states are listed above each sequence. Each row represents an independent replicate population. Non-wild-type insertions and deletions that reached >5% in frequency are shown, with frequency proportional to color saturation. Split cells show populations with multiple non-WT states > 5%. Plus (+) indicates an addition of a nucleotide. Delta (Δ) indicates a deletion of a nucleotide. (B) Same as (A), but for replicate PACE experiments of hsBCL-2, AncB5, and AncB4 evolved to gain NOXA binding.
Figure 4—figure supplement 3
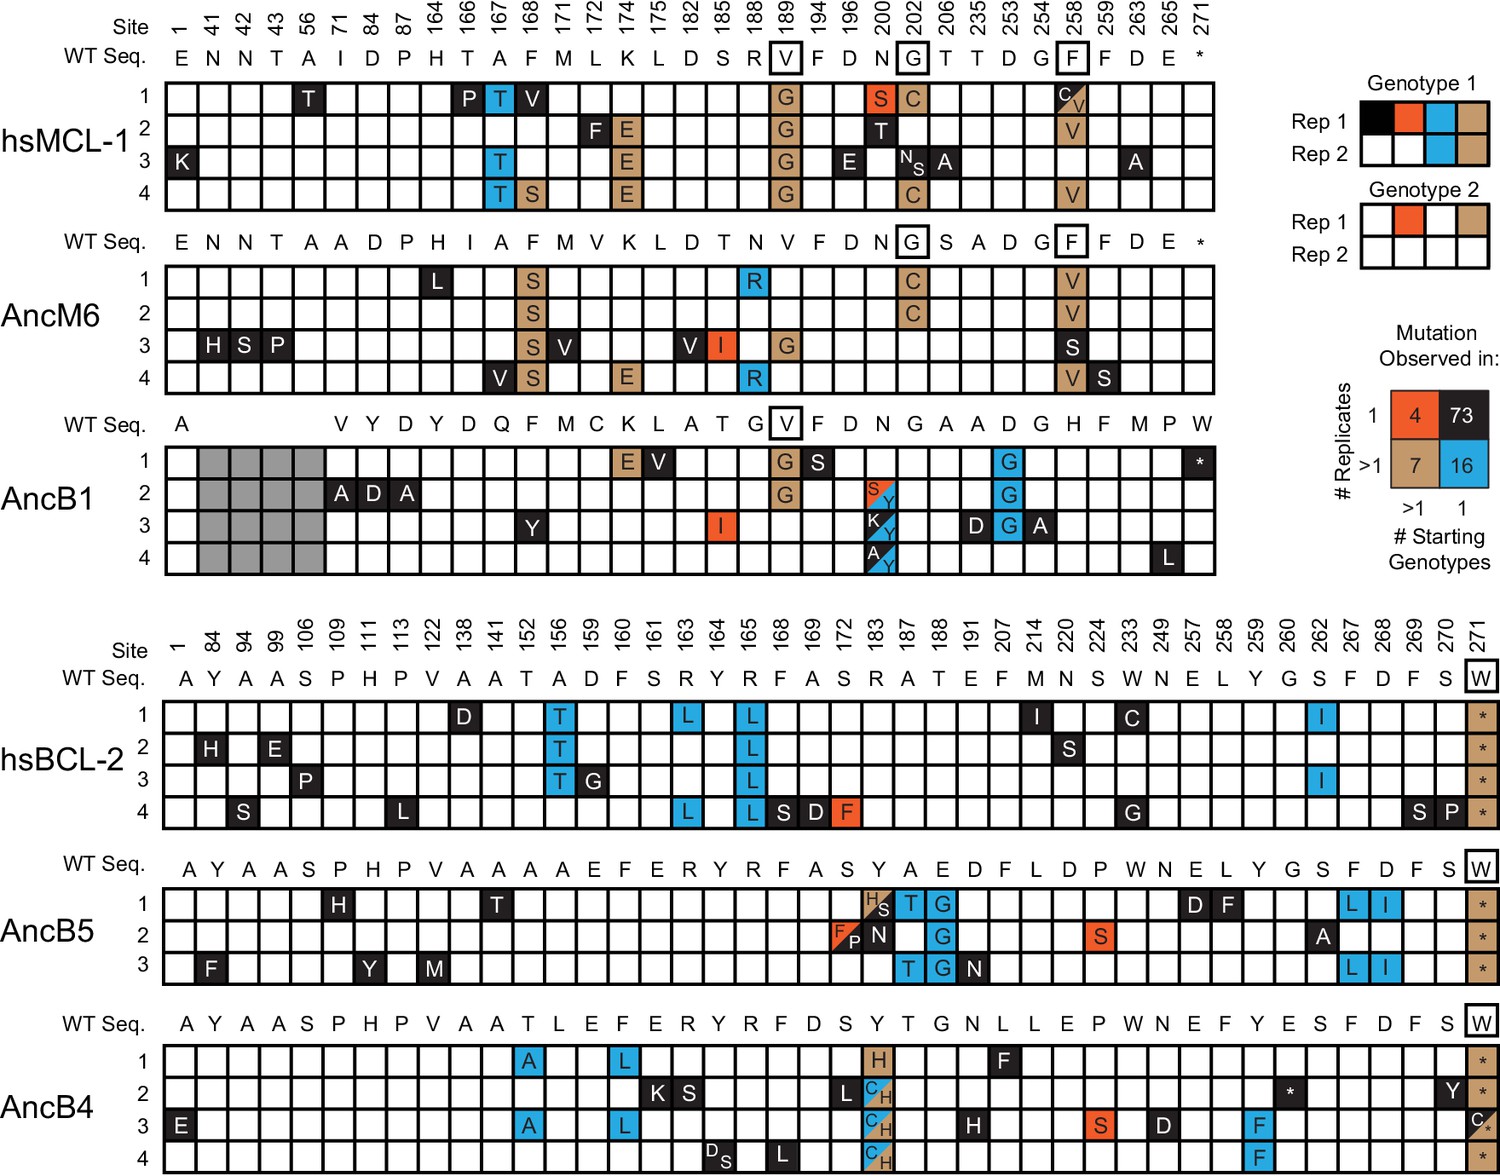
Categories of the 100 non-WT states observed for each non-WT state.
Black box with white letters, mutant states observed in only one replicate. Teal, mutant states observed in multiple replicates from the same starting genotype. Orange, mutant states observed in a single replicate from multiple different starting genotypes. Brown, mutant states observed in multiple replicates from the same starting genotype and in at least one other replicate from a different starting genotype. Black box outline, mutant states observed in multiple replicates from the same starting genotype and from multiple replicates from a different starting genotype. Gray boxes are sites that do not exist in a particular sequence.
Figure 4—figure supplement 4
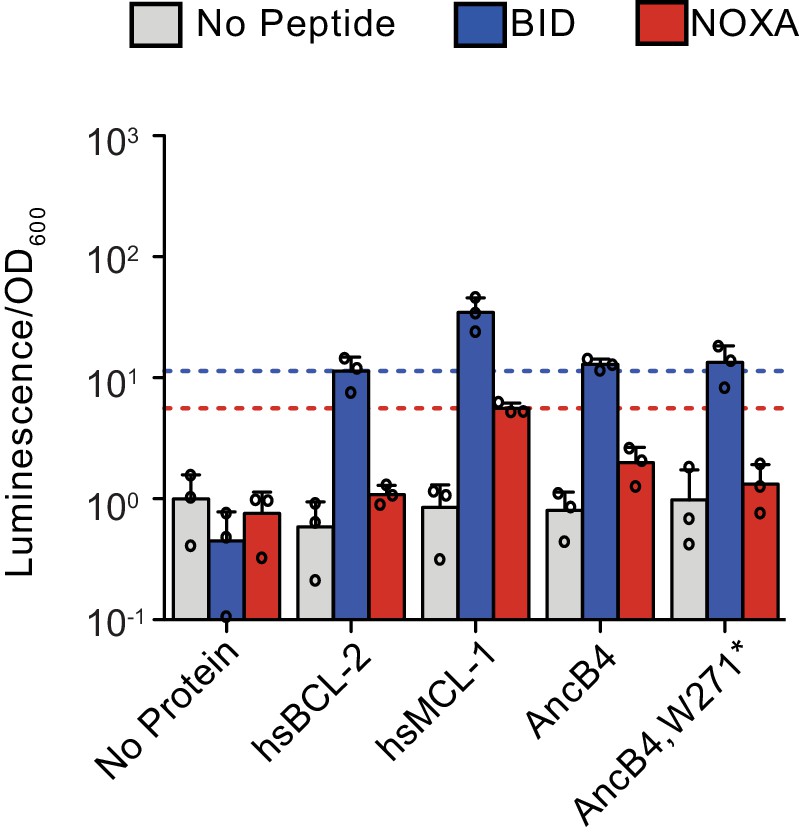
Effect of w271* mutation on BID and NOXA binding.
Activity is scaled relative to the control experiment with no- BCL-2 family protein and no-coregulator peptide. Bars show the mean ± SD of three biological replicates (circles). Gray bar, no-coregulator peptide. Blue bar, BID. Red bar, NOXA. Blue dotted lines mark the average signal of hsBCL-2 with BID, and red dotted lines mark the average signal of hsMCL-1 with NOXA.
Figure 4—figure supplement 5
Historical distribution of PACE mutations.
Historical WT states for each starting genotype are listed. Green, hsBCL-2 link function. Purple, hsMCL-1 like function. Solid vertical line, historical interval in which function changed. Dashed vertical line, location of the phylogeny root. For each PACE mutation, the genotype on which it arose is in a square. The nearest historical state that the mutation matches is in a circle. PACE mutations can either recapitulate historical substitutions, revert to historical states, or switch to a state found in a sister lineage. PACE mutations that revert historical states that changed during the interval at the same time as the change in function or outlined in red.
Figure 4—figure supplement 6
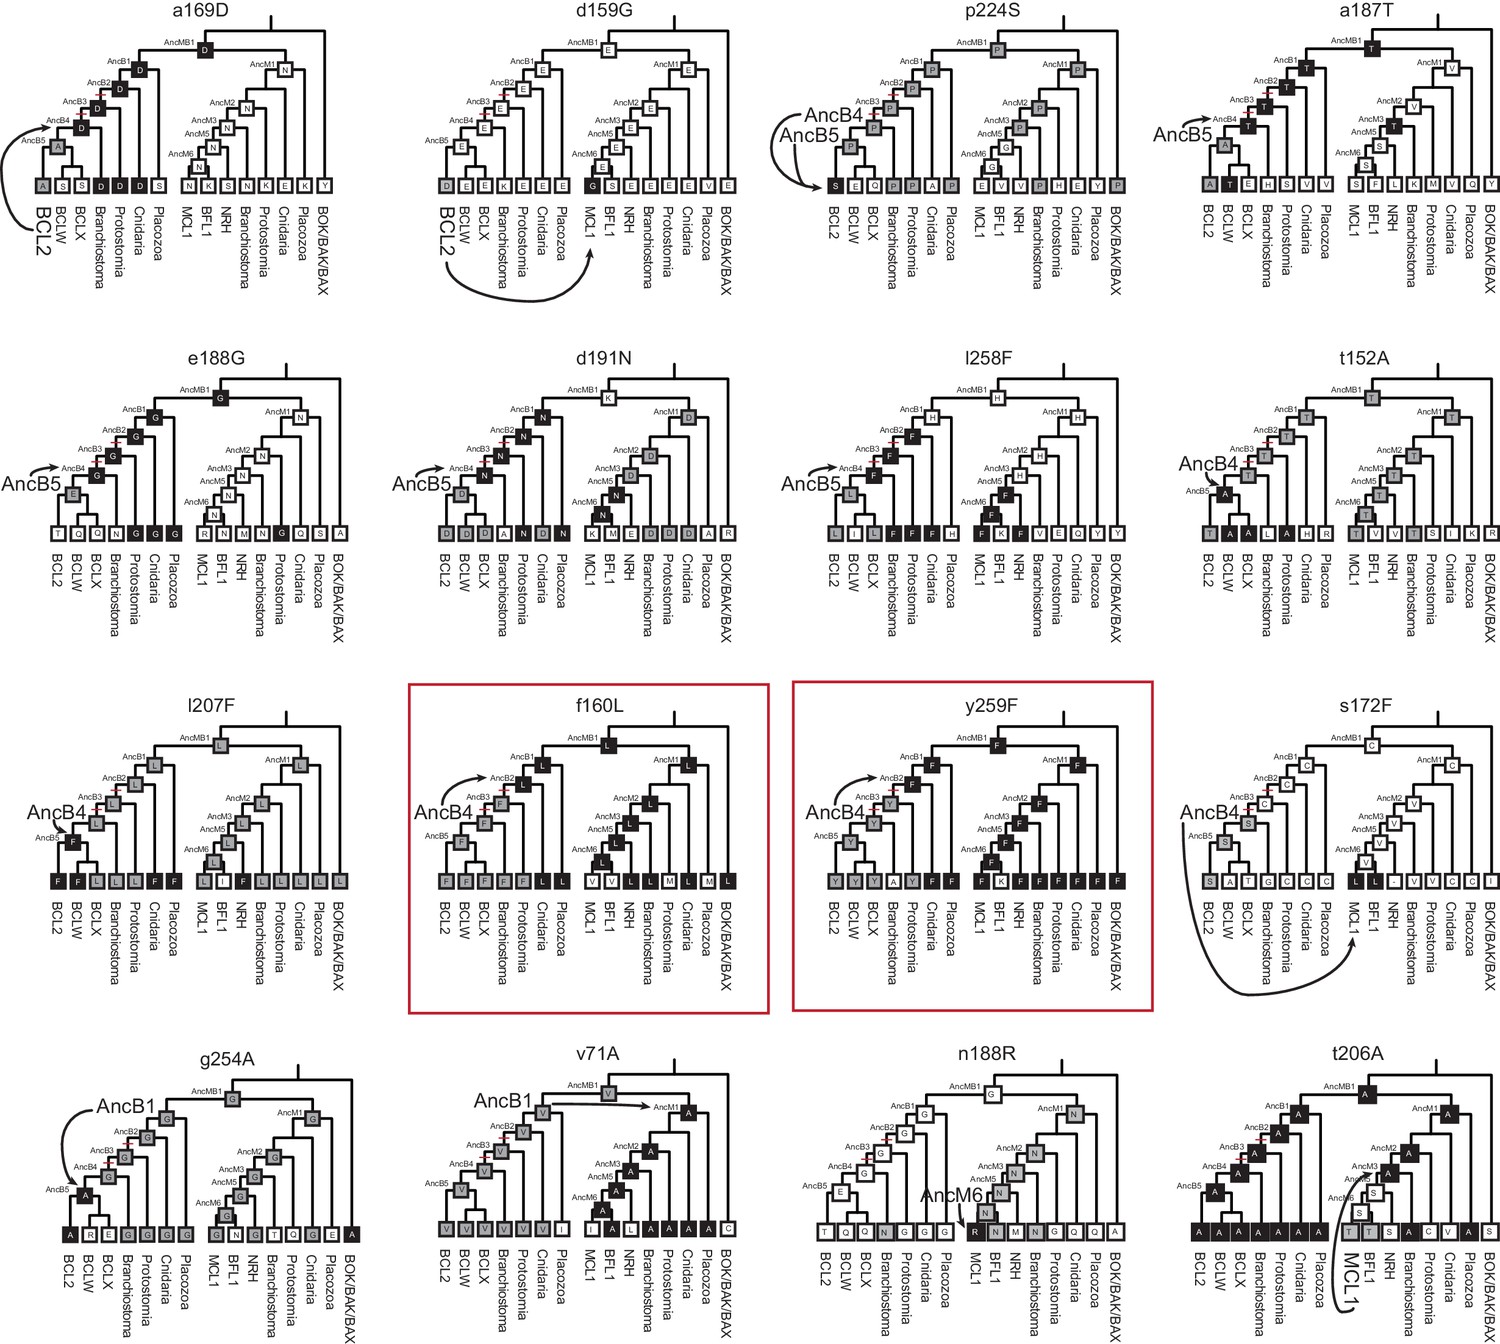
Phylogenetic recapitulation of PACE mutations.
Mutation state and position are given above each cladogram. Lowercase letters, WT state for PACE. Uppercase letters, mutant state for PACE. Each cladogram shows the estimated most likely state for each ancestral node and the majority state for each extant clade. Gray boxes; same WT state as the sequence in which the PACE mutation emerged. Black boxes; same WT state as the PACE mutation. Arrows point from the starting genotype for PACE (larger font) to the closest genotype with the PACE mutation. Red boxes show the two instances in which substitutions that occurred during the historical interval in which NOXA specificity was lost (red hash marks on phylogeny) also occurred during PACE.
Figure 5 with 1 supplement
Effects of chance and contingency.
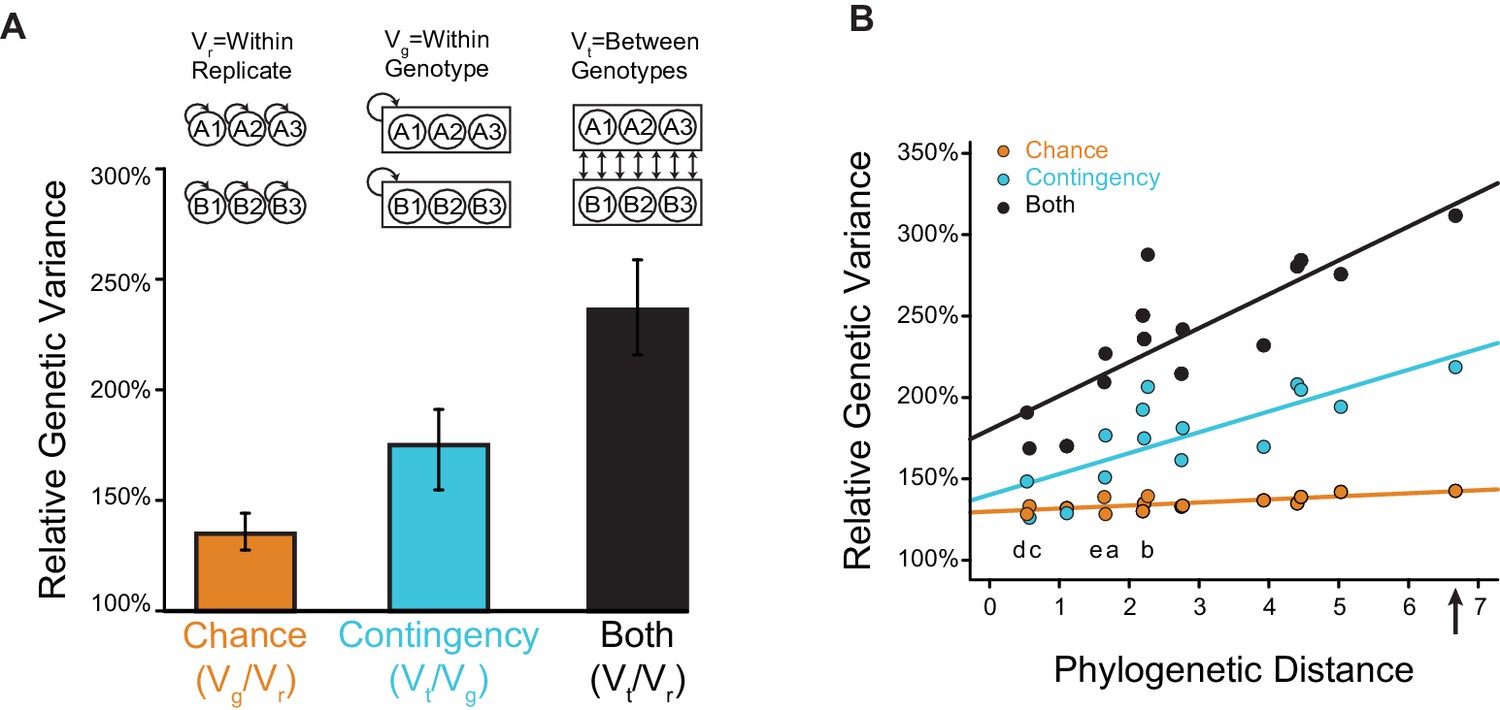
(A) Variation in evolutionary sequence outcomes caused by chance (orange), contingency (teal), and both (black). Inset: schematic for estimating the effects of chance and contingency. Chance was estimated as the average genetic variance among replicates from the same starting genotype (Vg) divided by the within-replicate genetic variance (Vr). Contingency was estimated as the average genetic variance among replicates from different starting genotypes (Vt) divided by the average genetic variance among replicates from the same starting genotype (Vg). Combined effects of chance and contingency were estimated as the average genetic variance among replicates from different starting genotypes (Vt) compared to the within-replicate genetic variance (Vr). Genetic variance is the probability that two randomly drawn alleles are different in state. Error bars, 95% confidence intervals on the mean by bootstrapping PACE replicates. (B) Change in the effects of chance and contingency over phylogenetic distance. Each point is for a pair of starting proteins used for PACE, comparing the phylogenetic distance (the total length of branches separating them, in substitutions per site) to the effects of chance (orange), contingency (teal), or both (black), when PACE outcomes are compared between them. Solid lines, best-fit linear regression. Letters indicate the phylogenetic branch indexed in Figure 3E. The combined effect of chance and contingency increased significantly with phylogenetic distance (slope = 0.19, p=2×10⁻⁵), as did the effect of contingency alone (slope = 0.11, p=0.007). The effect of chance alone did not depend on phylogenetic distance (slope = 0.02, p=0.5). The combined effect of chance and contingency increased significantly faster than the effect of contingency alone (0.08, p=0.04). Arrow, phylogenetic distance between extant hsMCL-1 and hsBCL-2 proteins, which share AncMB1 as their most recent common ancestor.
Figure 5—figure supplement 1
Change in chance and contingency over time.
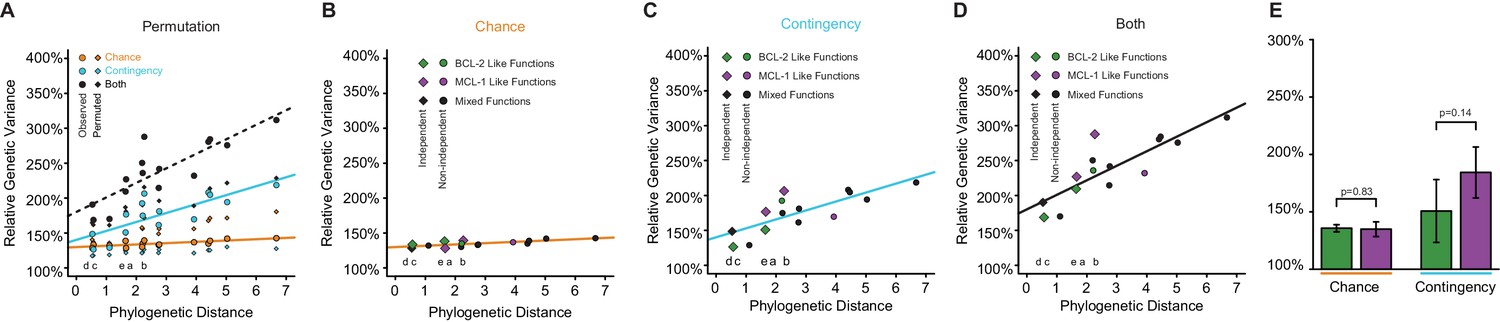
(A) Relationship between phylogenetic distance between pairs of starting genotypes for experimental evolution (ancestral or extant proteins, as the total branch lengths separating them) and the effects of chance (orange), contingency (teal), or both (black) on the outcomes of evolution between them. Lines are best fits from linear models. Circles are observed values. Diamonds are averages of 1000 permutations of starting genotype labels. This shuffling of genotype labels results in more genetic variance among samples from the same ‘starting genotype’ than the observed data, and less genetic variance between samples from different ‘starting genotypes’ than the observed data. Letters indicate the specific branch from Figure 3E. (B) Change in chance over time. Green, both starting genotypes had BCL-2 like function. Purple, both starting genotypes had MCL-1 like function. Black, starting genotypes differed in function. Phylogenetically independent comparison are shown as diamonds. The effect of chance did not change with phylogenetic distance when restricting analysis to comparisons that are phylogenetically independent (slope = 0.042, p=0.71) and genotypes selected for the same function (slope = 0.029, p=0.82). (C) Change in contingency over time. Green, both starting genotypes had BCL-2 like function. Purple, both starting genotypes had MCL-1 like function. Black, starting genotypes differed in function. Phylogenetically independent comparison are shown as diamonds. The effect of contingency increased with phylogenetic distance and was marginally significant when restricting analysis to comparisons that are phylogenetically independent (slope = 0.31, p=0.07), and genotypes selected for the same function (slope = 0.42, p=0.05). (D) Change in the combined effect of chance and contingency over time. Green, both starting genotypes had BCL-2 like function. Purple, both starting genotypes had MCL-1 like function. Black, starting genotypes differed in function. Phylogenetically independent comparison are shown as diamonds. The combined effect of chance and contingency increased with phylogenetic distance when restricting analysis to comparisons that are phylogenetically independent (slope = 0.50, p=0.009) and genotypes selected for the same function (slope = 0.63, p=0.01). (E) Effects of chance and contingency do not depend on the selection regime. Each column shows the portion of genetic variance among trajectories that was caused by chance or contingency, relative to the within-population variance (see Figure 5A). Green, trajectories in which BCL-2 like starting genotypes were selected to gain NOXA binding. Purple, trajectories in which MCL-1 like starting genotypes were selected to lose NOXA binding but maintain BID binding (purple). Error bars, 95% confidence intervals on the mean. p-values estimated by t-test.
Figure 6
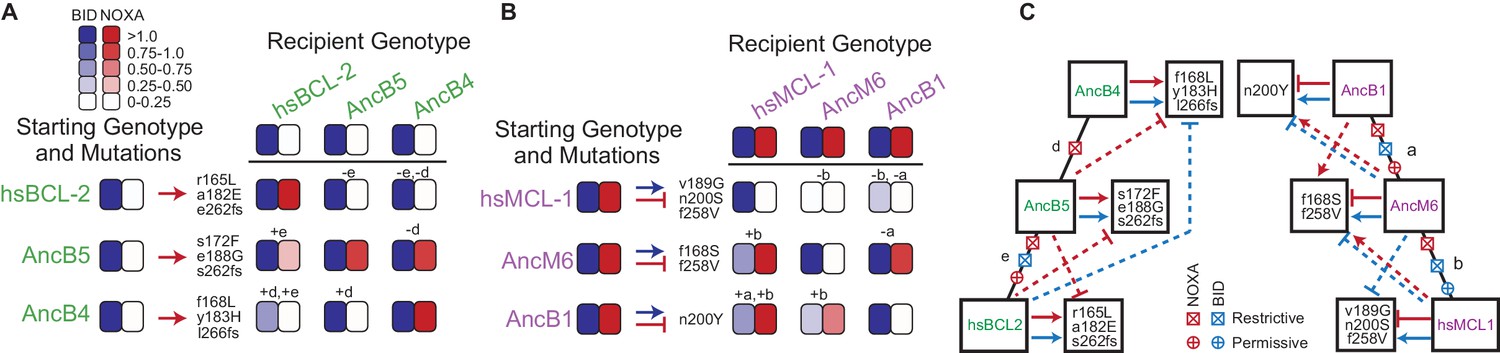
Sources of contingency.
(A) Epistatic incompatibility of PACE mutations in other historical proteins. Effects on activity are shown when amino acid states acquired in PACE under selection to acquire NOXA binding (red arrows) are introduced into ancestral and extant proteins. The listed mutations that occurred during PACE launched from each starting point (rows) were introduced as a group into the protein listed for each column. Observed BID (blue) and NOXA (red) activity in the luciferase assay for each mutant protein are shown as heatmaps (normalized mean of three biological replicates). Letters indicate the phylogenetic branch in Figure 3E that connects the PACE starting genotype to the recipient genotype. Plus and minus signs indicate whether mutations were introduced into a descendant or more ancestral sequence, respectively. (B) Effects on activity when amino acids acquired in PACE under selection to lose NOXA binding and acquire BID binding are introduced into different ancestral and extant proteins, represented as in (A). (C) Epistatic interactions between historical substitutions and PACE mutations. Restrictive historical substitutions (X) cause mutations that alter PPI specificity in an ancestor to abolish either BID (blue) or NOXA (red) activity when introduced into later historical proteins. Permissive substitutions (+) cause PACE mutations that alter PPI specificity in a descendent to abolish either BID or NOXA activity in an ancestor. Arrow, gain or maintenance of binding. Blunt bar, loss of binding. Mutations that confer selected functions in PACE are shown in the boxes at the end of solid arrows or bars. Solid lines, functional changes under PACE selection. Dashed lines, functional effects different from those selected for when PACE-derived mutations are placed on a different genetic background.
Figure 7 with 2 supplements

Sources of chance.
(A) Dissecting the effects of sets of mutations (white boxes) that caused hsMCL-1 to lose NOXA binding during four PACE trajectories. Filled boxes show the effect of introducing a subset of mutations into hsMCL-1 (normalized mean relative from three biological replicates). Solid lines show the effect of introducing v189G, which was found in all four sets. Dotted lines, effects of the other mutations in each set. (B) Structural location of mutations in (A). Alpha-carbon atom of mutated residues are shown as purple spheres on the structure of MCL-1 (light gray) bound to NOXA (red, PDB 2nla). (C) Location of repeated mutations when hsMCL-1, AncM6, and AncB1 were selected to lose NOXA binding (purple spheres), represented on the structure of MCL-1 (gray) bound to NOXA (red, PDB 2nla). (D) Location of repeated mutations when hsBCL-2, AncB5, and AncB4 were selected to gain NOXA binding (green spheres), on the structure of hsBCL-xL (gray) bound to BID (blue, PDB 4qve).
Figure 7—figure supplement 1
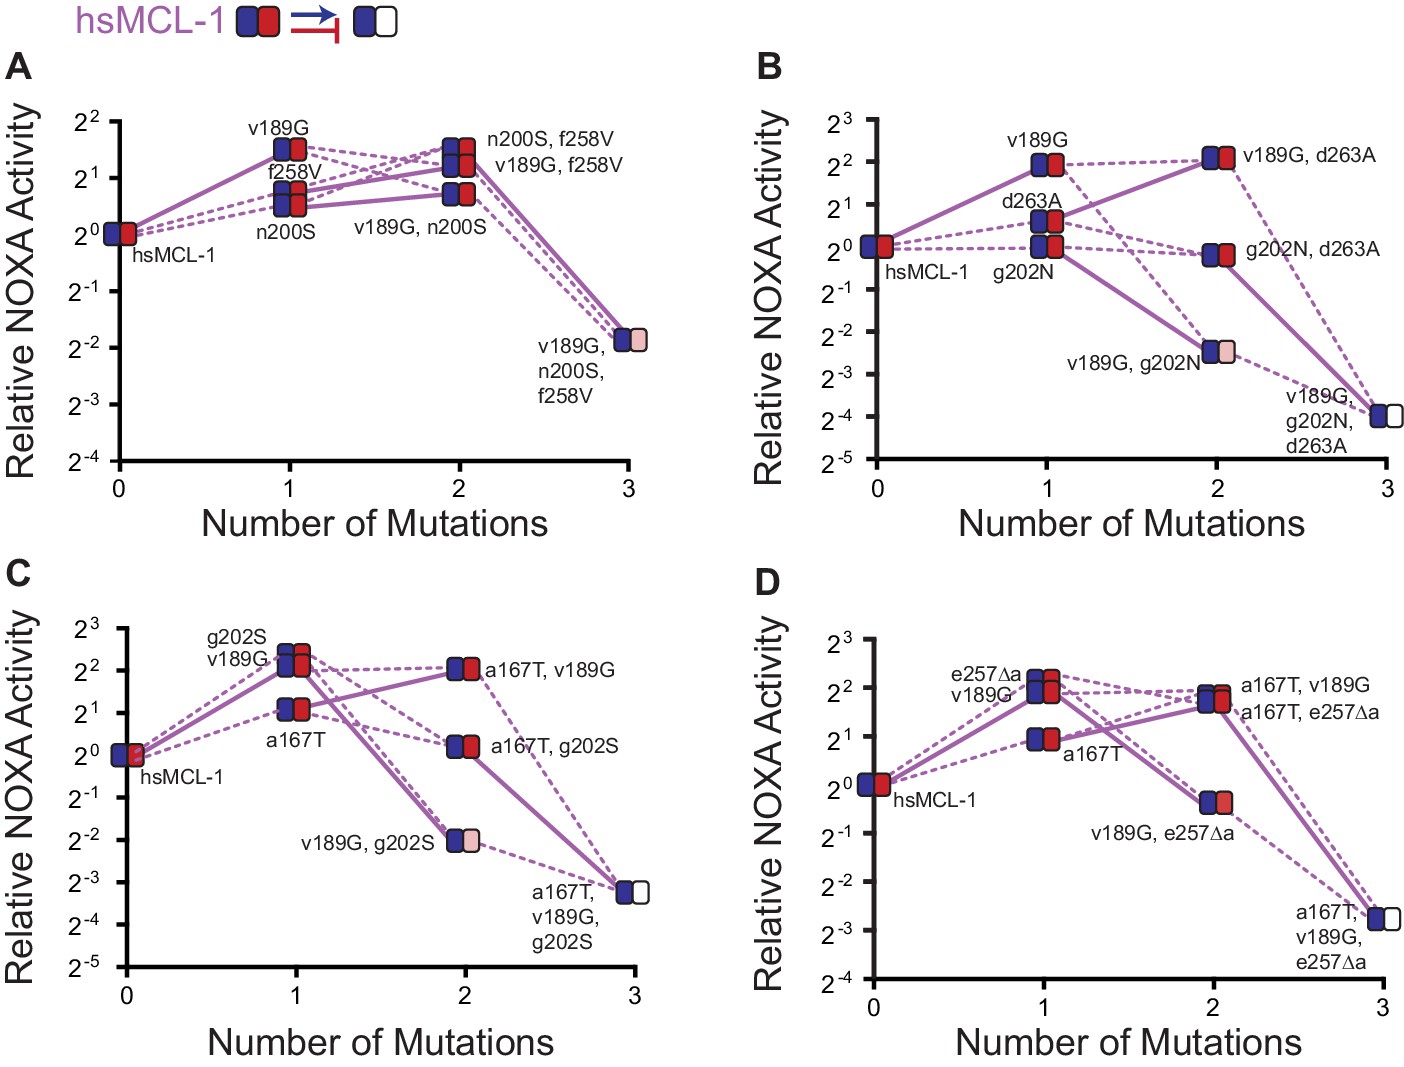
Effects on NOXA binding of hsMCL-1 PACE-derived mutations.
Each panel shows NOXA binding (y-axis) for a unique variant as additional mutations are added (x-axis). Values are the mean of three biological replicates. Heatmaps show the effects of each mutation on BID (blue) and NOXA (red) activity, and each shaded box represents the normalized mean of three biological replicates. Lines connect genotypes that differ by a single mutation. Solid lines show the effects of the v189G mutation. Dashed lines show the effects of all other mutations. Mutations come from variants L1-1 (A), L3-1 (B), L3-3 (C), and L4-3 (D).
Figure 7—figure supplement 2
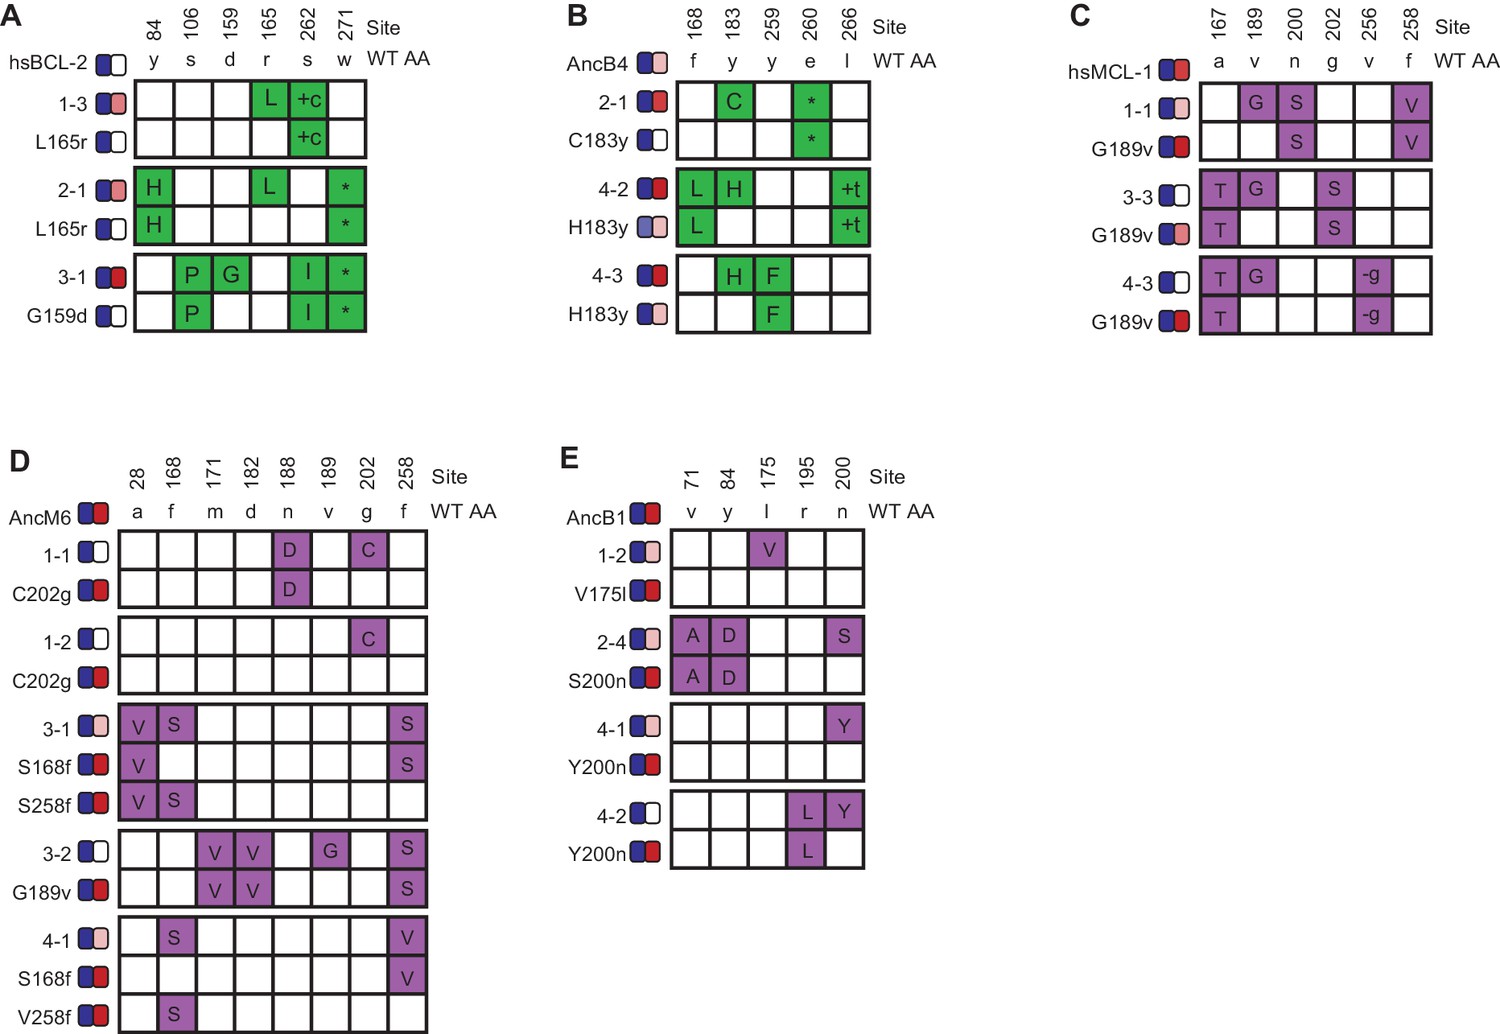
Phenotypic effects of reverting frequent PACE-derived mutations.
Individual variants were isolated from PACE experiments that selected for the gain of NOXA binding in hsBCL-2 (A) and AncB4 (B) and the loss of NOXA binding in hsMCL-1 (C), AncM6 (D), and AncB1 (E). For each variant, non-WT states are colored. Sites and WT amino state are indicated at top. Heatmaps on the left show binding to BID and NOXA in the luciferase assay for each variant and their corresponding mutant without the key mutation. Each shaded box represents the normalized mean of three biological replicates.
Figure 8 with 4 supplements

Sources of determinism.
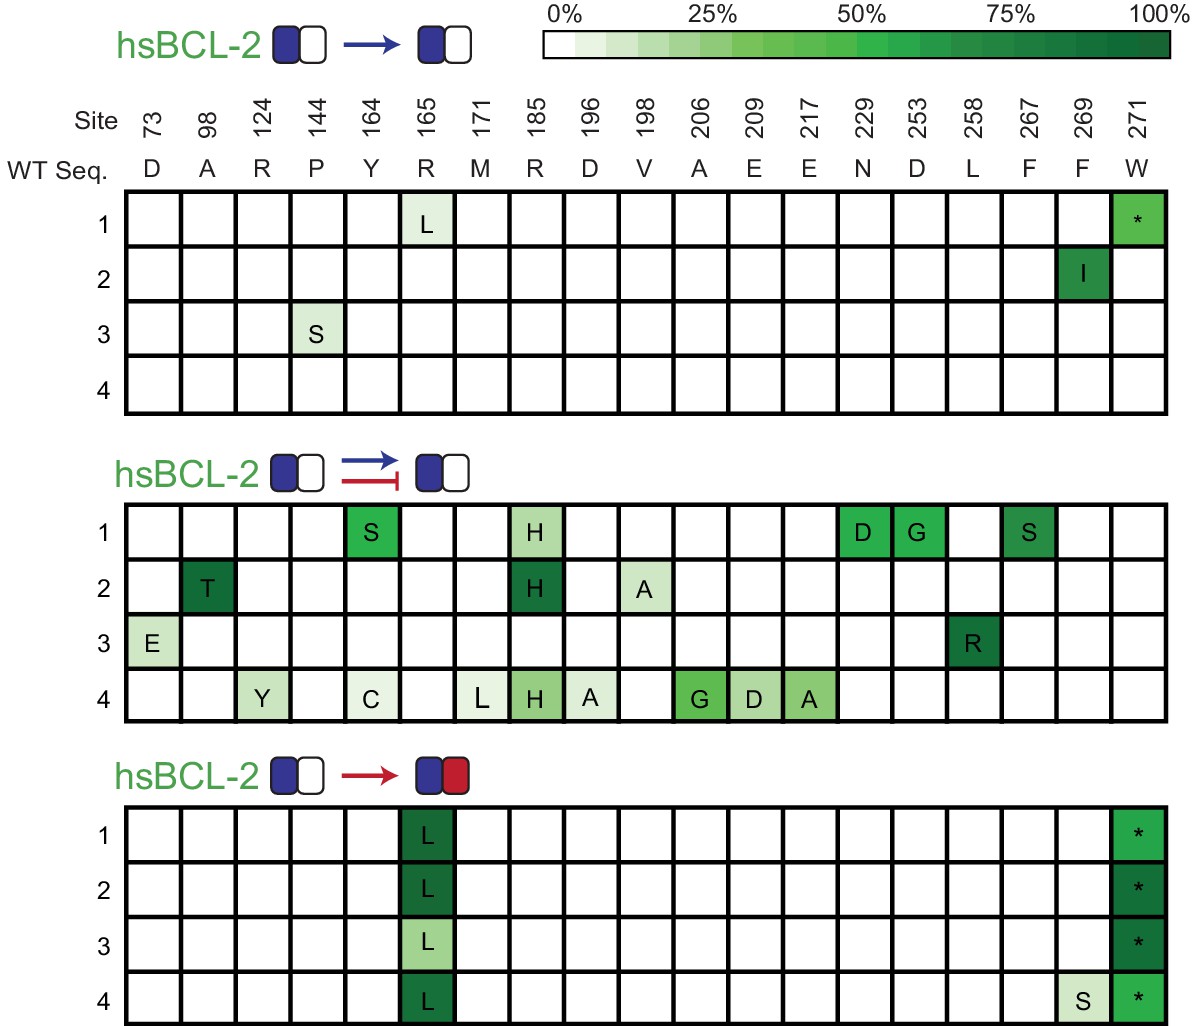
(A) Evolution of NOXA-binding phage under various selection regimes. Frequency was calculated as the ratio of plaque forming units (PFU) per milliliter on E. coli cells that require NOXA binding to the PFU on cells that require BID binding to form plaques. Wild-type hsBCL-2 (green) and hsMCL-1 (purple) are shown as controls. Arrow, positive selection for function. Bar, counterselection against function. Blue, BID. Red, NOXA. Bars are the mean of four trajectories for each condition (points). (B) Phenotypes and genotypes of hsBCL-2 variants that evolved NOXA binding under selection to maintain only BID binding. Sites and WT amino state are indicated at top. For each variant, non-WT states acquired are shown in green. Heatmaps show binding to BID and NOXA in the luciferase assay for each variant (normalized mean of three biological replicates).
Figure 8—figure supplement 1
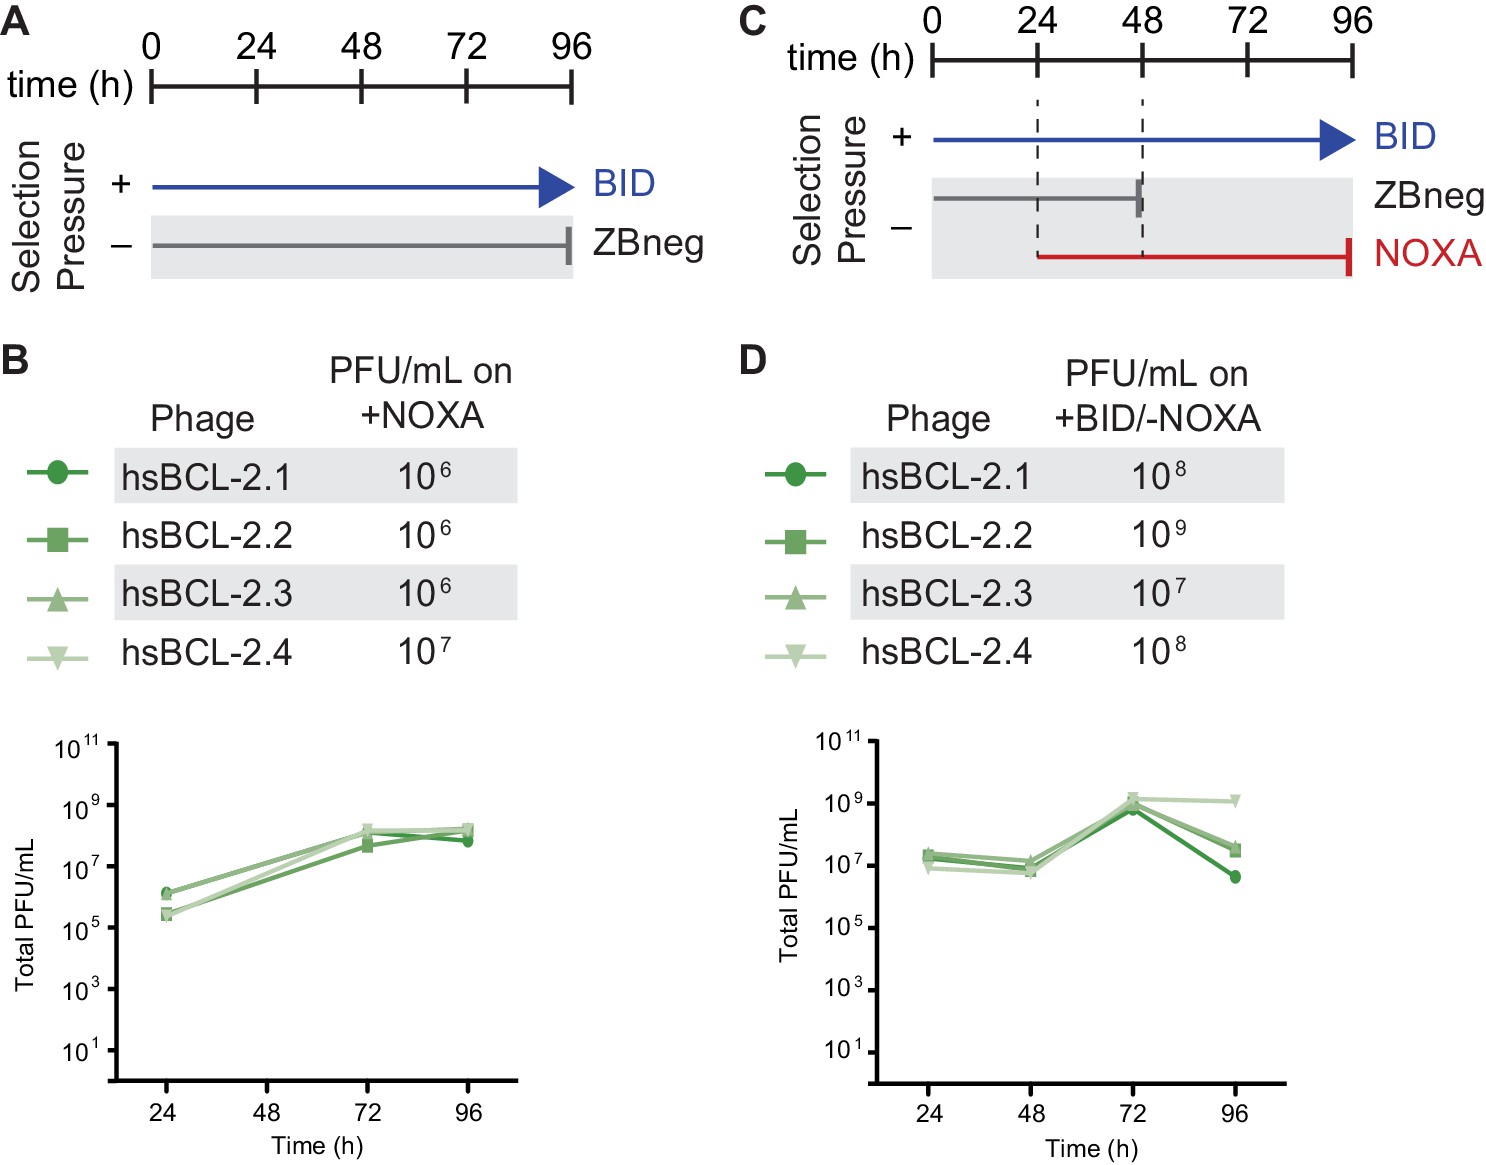
Selection schemes and phage titers for fortuitous NOXA binding of hsBCL2.
(A) Timeline of PACE experiments when hsBCL-2 was evolved with positive selection to maintain only BID binding. Selection conditions shown as arrows and blunt bars: arrow, selection for binding to BID (blue); blunt bar, selection against binding to ZBneg (gray). (B) Phage titers (PFU/mL) over time (bottom) and activity-dependent phage titers on NOXA at the end of the PACE experiment (top) when hsBCL-2 was evolved to maintain BID binding. Activity-dependent plaque assays used plasmid 28–48. (C) Timeline of PACE experiments when hsBCL-2 was evolved with positive selection to maintain BID binding and negative selection against NOXA binding. Selection conditions shown as arrows and blunt bars: arrow, selection for binding to BID (blue); gray blunt bar, selection against binding to Zbneg; red blunt bar, selection against binding to NOXA. (D) Same as (B), but for hsBCL-2 evolved to bind BID and not NOXA. Activity-dependent plaque assays used plasmids 28–48 and Jin 487.
Figure 8—figure supplement 2
Allele frequency of non-wt states during PACE.
Allele frequency of non-wild-type states when hsBCL-2 was evolved to maintain BID binding (top) or when hsBCL-2 was evolved to simultaneously maintain BID binding and lose NOXA binding (middle). For comparison, the same sites are also shown for when hsBCL-2 was evolved to gain NOXA binding (bottom). Site numbers and wild-type (WT) amino acid states are listed above each sequence. Each row represents an independent replicate population. Non-wild-type amino acids that reached > 5% in frequency are shown, with frequency proportional to color saturation.
Figure 8—figure supplement 3
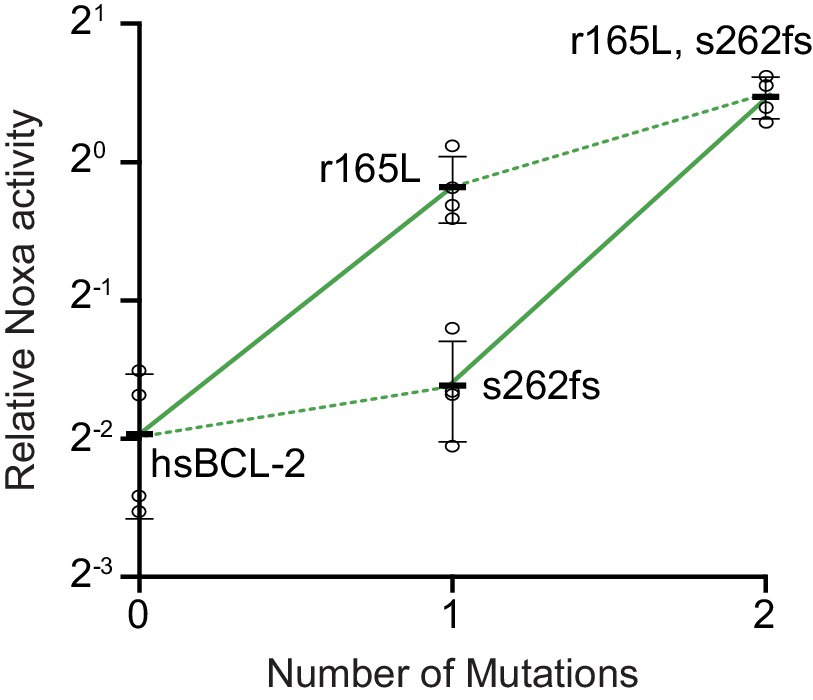
Effect on NOXA binding of the key r165L mutation.
Bars are the mean ± SD of three biological replicates (circles). Solid lines show the effects of the r165L mutation while dotted lines show the effect of a frameshift (fs) at site 262.
Figure 8—figure supplement 4
Selection and phage titers for fortuitous NOXA binding of AncB4 and AncB5.
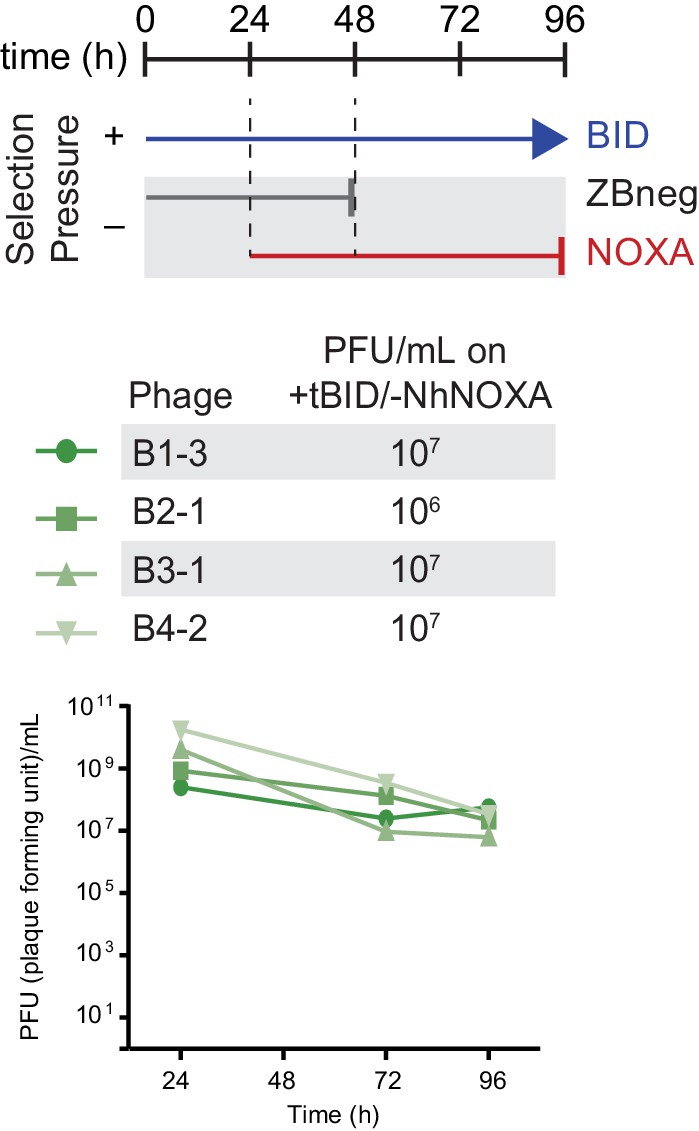
(A) Timeline of PACE experiments when AncB4 was evolved with positive selection to maintain only BID binding. Selection conditions shown as arrows and blunt bars: arrow, selection for binding to BID (blue); blunt bar, selection against binding to ZBneg (gray). (B) Phage titers (PFU/mL) over time when AncB4 was evolved to maintain BID binding. (C) Phenotypes and genotypes of individual AncB4 variants that were isolated from PACE when selecting for BID binding and screened for the gain of NOXA binding. Site numbers and wild-type (WT) amino acid states are indicated at the top. Heatmaps on the left show binding to BID (blue) and NOXA (red) in the luciferase assay for each variant, and each shaded box represents the normalized mean of three biological replicates. (D) Non-wild-type amino acid states that reached >5% in frequency are shown for PACE when AncB4 was evolved to gain NOXA binding, for comparison with (C). Frequency is proportional to color saturation. Split cells show populations with multiple non-WT states > 5%. Each row represents an independent replicate lagoon. Color of WT state indicate if the mutation was seen among multiple replicates of the same starting genotype (teal), a single replicate from multiple starting genotypes (orange), or in multiple replicates and multiple starting genotypes (brown). Black box outline indicates mutant states observed in multiple replicates from the same starting genotype and from multiple replicates from a different starting genotype. (E) Same as (A) but for AncB5. (F) Same as (B) but for AncB5. (G) Same as (C) but for AncB5. (H) Same as (D) but for AncB5.
Figure 9 with 2 supplements

Contingency affects the evolution of novel specificity.
Starting genotypes that can bind both BID and NOXA (left) were selected to lose only BID or NOXA binding. Heatmaps show binding to BID and NOXA in the luciferase assay for each starting genotype (on the left) and for three individual variants picked at the end of one or more PACE trajectories (index numbers). Each box displays the normalized mean of three biological replicates for one variant. Trajectories initiated from starting points produced by PACE (green) and then selected for a non-historical function (loss of BID binding) went extinct .
Figure 9—figure supplement 1
Selection scheme and phage titers for the gain of NOXA specificity.
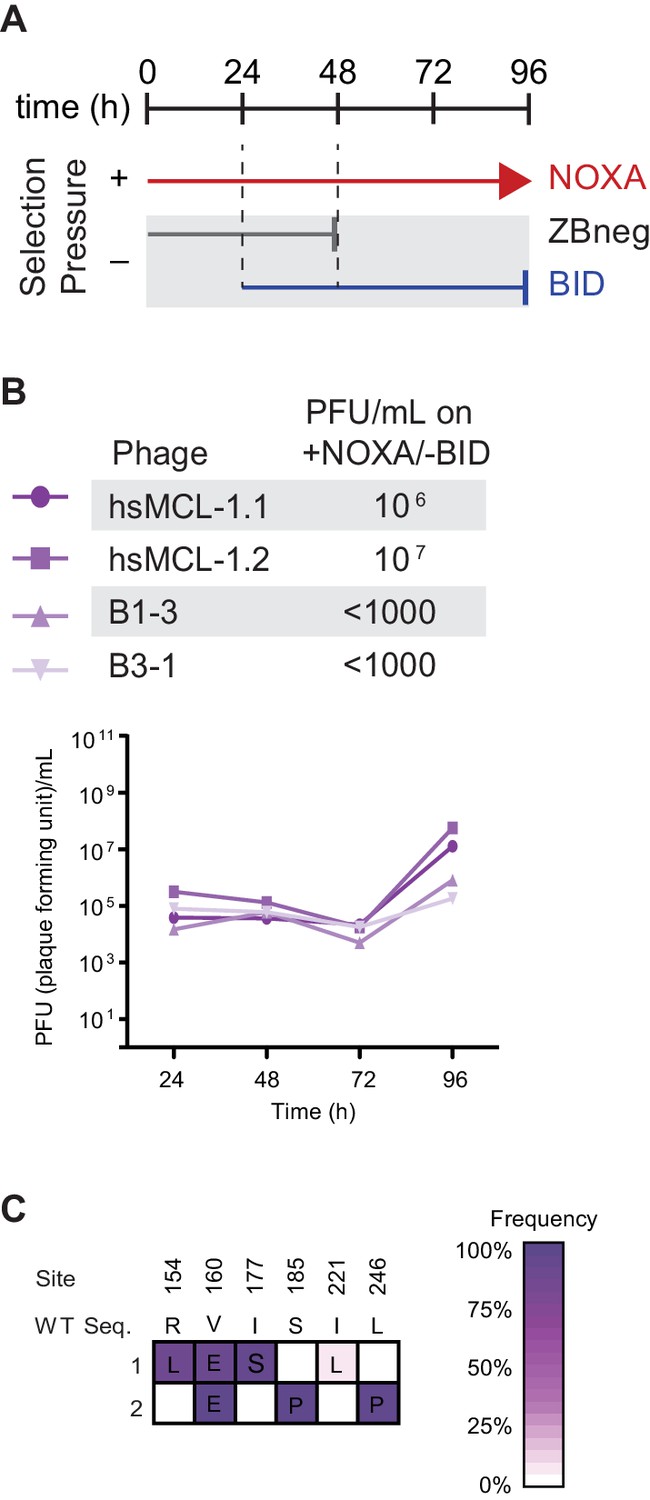
(A) Timeline of PACE experiments where hsMCL-1 and two previously evolved NOXA-binding hsBCL-2 variants were evolved to maintain NOXA binding and lose BID binding. Selection conditions: arrow, selection for binding NOXA (red); blunt bar, selection against binding a specific peptide (BID [blue] or ZBneg [gray]). (B) Phage titers (PFU/mL) over time (bottom) and activity-dependent phage titers at the end of the PACE experiment (top) where hsMCL-1 and NOXA-binding hsBCL-2 variants were evolved for binding NOXA and against BID. Activity-dependent plaque assays used plasmids 28–48 and Jin 518. Limit of detection = 103 PFU/mL. (C) Allele frequency of non-wild-type states after hsMCL-1 was evolved to maintain NOXA binding and lose BID binding. Site numbers and wild-type (WT) amino acid states are listed above each sequence. Each row represents an independent replicate lagoon. Non-wild-type amino acid frameshifts that reached >5% in frequency are shown, with frequency proportional to color saturation.
Figure 9—figure supplement 2
Selection scheme and phage titers for the regain of BID specificity.
Phage titers (PFU/mL) over time (bottom) and activity-dependent phage titers at the end of the PACE experiment (top) where NOXA-binding hsBCL-2 variants were evolved to lose NOXA binding.
Activity-dependent plaque assays used plasmids 28–46 and Jin 487.
Tables
Key resources table
| Reagent type (species) or resource | Designation | Source or reference | Identifiers | Additional information |
|---|---|---|---|---|
| Strain, strain background (Escherichia coli) | S1030 | Carlson et al., 2014 | ||
| Strain, strain background (Escherichia coli) | 1059 | Carlson et al., 2014 | ||
| Strain, strain background (Escherichia coli) | NEB 10-beta | NEB | Cat# C3019I | |
| Strain, strain background (Escherichia coli) | BCL21 (DE3) | NEB | Cat# C2530H | |
| Peptide, recombinant protein | BID | GenScript | This Study | Human BID peptide used for fluorescence polarization (see Materials and methods) |
| Peptide, recombinant protein | NOXA | Genscript | This study | Human NOXA peptide used for fluorescence polarization (see Materials and methods) |
| Commercial assay or kit | DNA clean and concentrator kit | Zymo | Cat# D4013 | |
| Commercial assay or kit | MiSeq Reagent Kit v3 | Illumina | Cat# MS-102–3003 | |
| Chemical compound, drug | Q5 DNA Polymerase | NEB | Cat# M0491 | |
| Chemical compound, drug | Phusion DNA polymerase | ThermoFisher Scientific | Cat# F518L | |
| Chemical compound, drug | Isopropyl-b-D-thiogalactopyranoside (IPTG) | bioWORLD | Cat# 21530057 | |
| Chemical compound, drug | His60 Ni Superflow Resin | Takara | Cat# 635660 | |
| Software, algorithm | Geneious | Geneious | 10.1.3 | |
| Software, algorithm | R | CRAN | 3.5.1 | |
| Software, algorithm | RStudio | RStudio | 1.1.456 | |
| Software, algorithm | PROT Test | Abascal et al., 2005 | 3.4.2 | |
| Software, algorithm | RAXML-ng | Kozlov and Stamatakis, 2019 | 0.6.0 |
Additional files
-
Supplementary file 1
Luciferase assay data for all experiments.
- https://cdn.elifesciences.org/articles/67336/elife-67336-supp1-v2.xlsx
-
Supplementary file 2
Posterior probabilities for reconstructed ancestral sequences.
For each sequence, the site, maximum likelihood (ML) amino acid state, and posterior probability (PP) are given, along with the highest posterior probability alternative (ALT) state and posterior probability for this alternative state. Locations of paralog-specific insertions are shown as gaps. For each reconstructed sequence, the average posterior probability for the maximum likelihood states and the alternative states is given, as are the number of sites where the posterior probability of a non-maximum likelihood state is greater than 0.2. Finally, the average, maximum, minimum, and variance among reconstructed ancestors are given for the average maximum likelihood posterior probability and the number of non-maximum likelihood states greater than 0.2 posterior probability.
- https://cdn.elifesciences.org/articles/67336/elife-67336-supp2-v2.xlsx
-
Supplementary file 3
List of PACE experiments, amino acid alignments of hsBCL-2 and hsMCL-1 with their structural global alignment, and mutations found in individual variants isolated from PACE.
fs is frameshift, aa is amino acid, co is codon change.
- https://cdn.elifesciences.org/articles/67336/elife-67336-supp3-v2.xlsx
-
Supplementary file 4
PACE library and high-throughput sequencing (HTS) data.
PACE experiments are listed in the tab ‘Library-info’, which contains the name, purpose of the experiment, and HTS experiment numbers. The tab ‘Primers for HTS’ lists all the primer sequences used for HTS library constructions. The tab ‘MiSeq reads number’ include the read number of each library in this MiSeq run and the library sample information. The library samples are labeled as X*-end or X*-$$. ‘X’ indicates the specific PACE experiment, ‘*’ the experimental replicate, ‘end’ means samples were collected after 96 hr when the experiment finished, and ‘$$’ indicates the time point after removing chemostat A (e.g. ‘B2-24’ is a sample from replicate 2 of evolution B and collected 24 hr after removing chemostat A, which is 72 hr from the start of PACE). The tab ‘genotype’ includes the aligned protein sequences with corresponding residue numbers. The ‘Frequency’ tab contains the non-wild-type amino acid frequency of each sample for each site.
- https://cdn.elifesciences.org/articles/67336/elife-67336-supp4-v2.xlsx
-
Supplementary file 5
Descriptions of plasmids and sequences used.
- https://cdn.elifesciences.org/articles/67336/elife-67336-supp5-v2.xlsx
-
Transparent reporting form
- https://cdn.elifesciences.org/articles/67336/elife-67336-transrepform-v2.pdf
Download links
A two-part list of links to download the article, or parts of the article, in various formats.
Downloads (link to download the article as PDF)
Open citations (links to open the citations from this article in various online reference manager services)
Cite this article (links to download the citations from this article in formats compatible with various reference manager tools)
Contingency and chance erase necessity in the experimental evolution of ancestral proteins
eLife 10:e67336.
https://doi.org/10.7554/eLife.67336


