The effect of host community functional traits on plant disease risk varies along an elevational gradient
- Department of Evolutionary Biology and Environmental Studies, University of Zürich, Switzerland
- Faculty of Biological and Environmental sciences, University of Helsinki, Finland
Figures
Figure 1

Relationships among hosts parasites and their environment at the scale of host communities.
(A) The disease triangle (McNew, 1960) suggests that a combination of host, parasite, and environmental factors will influence whether disease is observed in a given location. Here, we conceptualize the disease triangle at the community level as consisting of three overlapping or interacting factors to demonstrate how the influence of environmental gradients on disease risk might depend on how these factors overlap. We highlight three potential processes that might occur in these areas of overlap, but acknowledge that other processes likely occur in these areas as well. (B) Conceptual metamodel of an environmental gradient directly influencing disease risk (path a), and indirectly influencing disease risk, both by altering host community structure (i.e. mediation; paths b and c), and by modifying how host community structure influences disease risk (i.e. moderation of the relationship between host traits and host competence, which we refer to as the trait-competence relationship; path d).
Figure 2 with 1 supplement
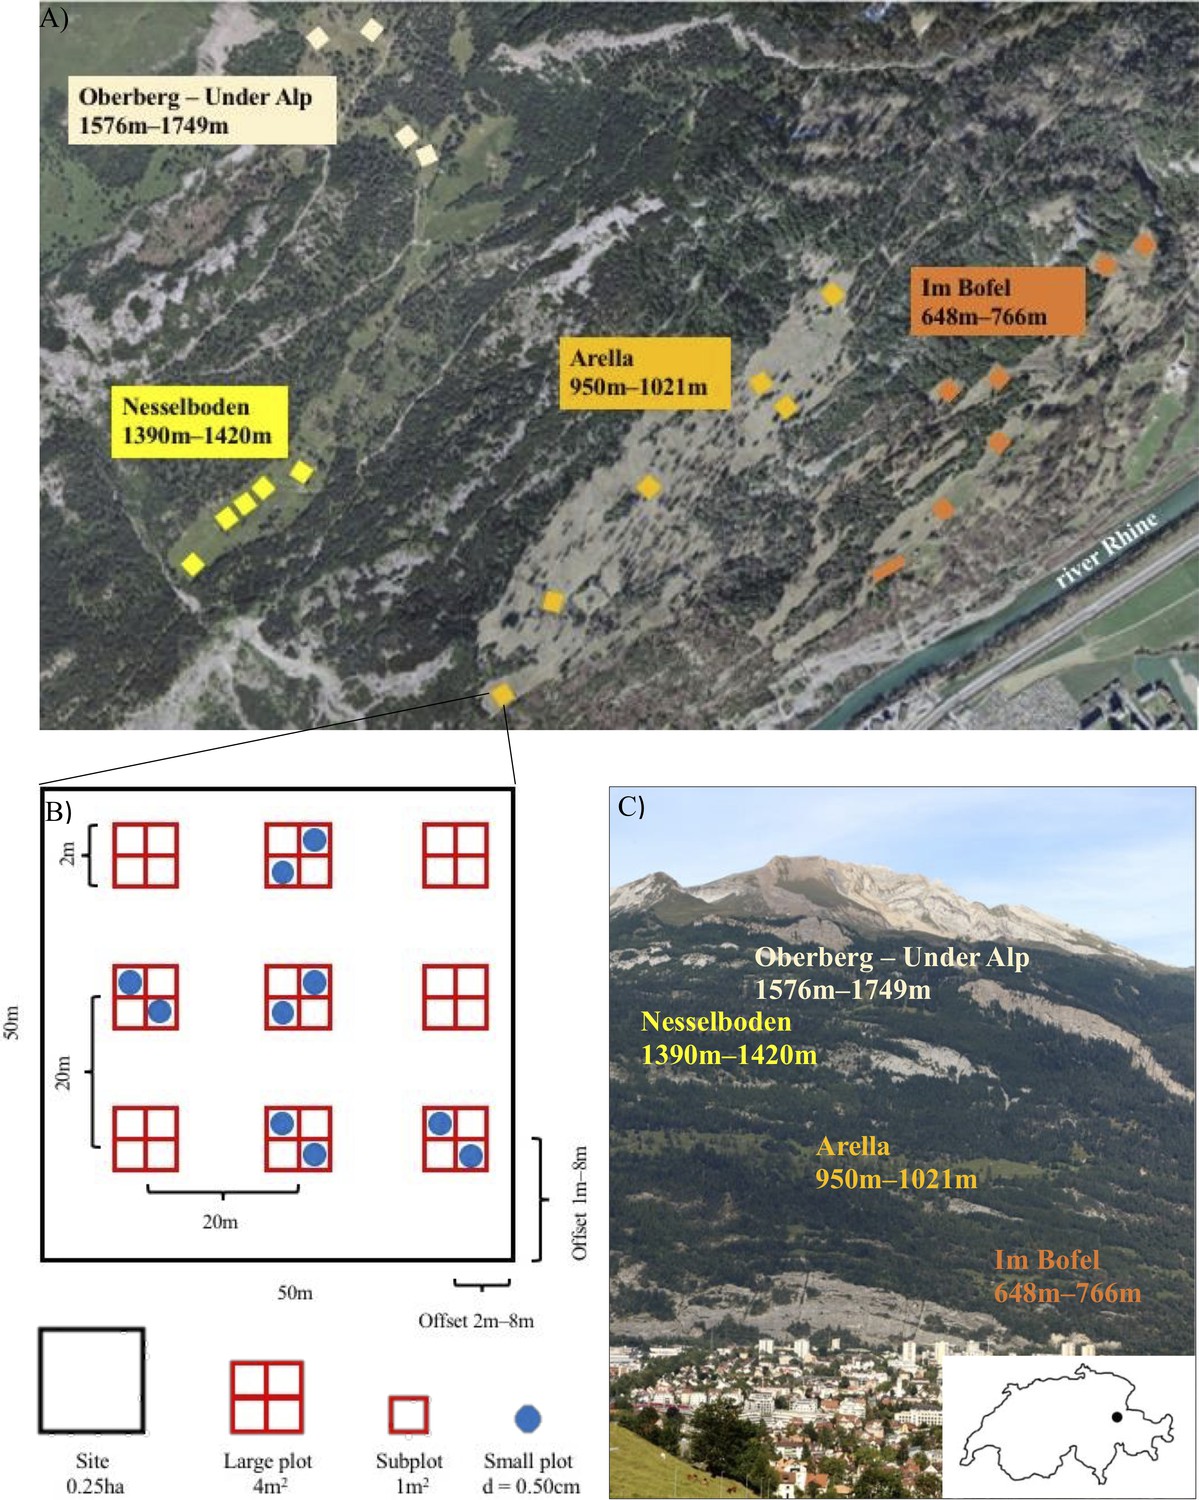
Overview of the Calanda Biodiverstity Observatory.
(A) Study meadows and sites on mount Calanda. Photo: Federal Office of Topography SwissTopo 2020, editing: Mikko Jalo (B) Example of the arrangement of large and small plots within a site. (C) The study meadows on mount Calanda. Photo and editing: Mikko Jalo.
Figure 2—figure supplement 1
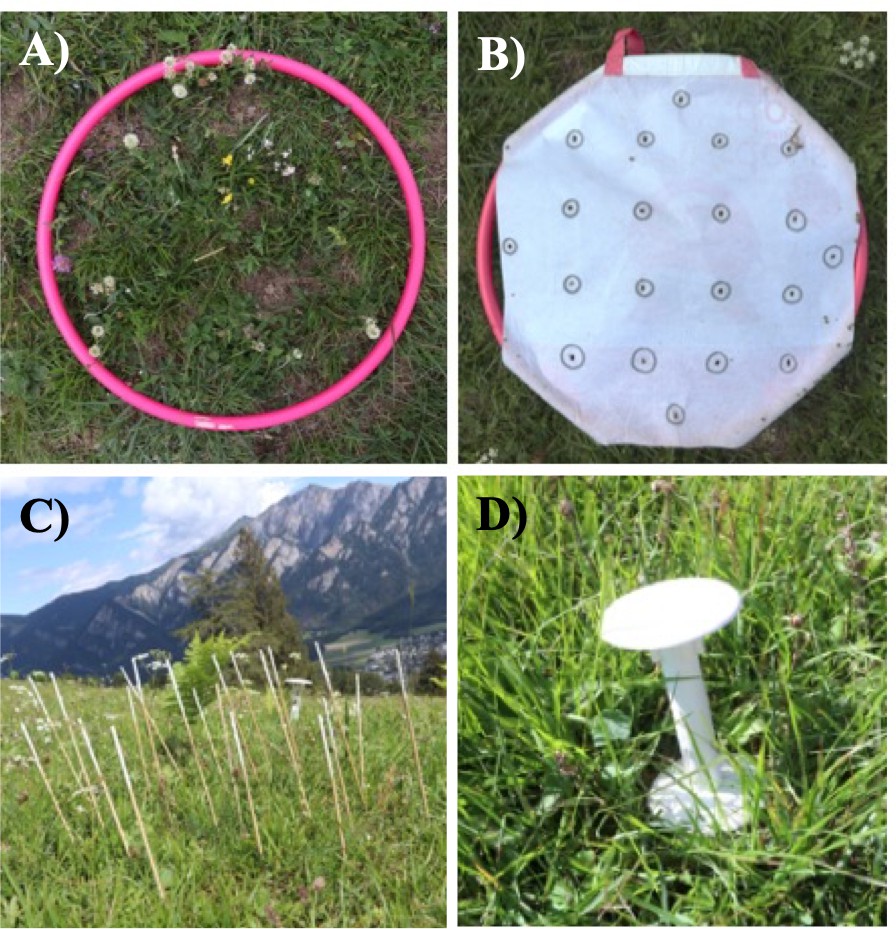
Images representing survey methods.
(A) The vegetation survey was carried out in small plots that were marked with a central stick and delineated by a 50 cm-diameter hula hoop. The disease survey was carried out by (B) placing 20 grill sicks through a 50 cm-diameter hula hoop covered with canvas containing 20 evenly spaced holes and (C) surveying the plant most touching each grill stick for foliar disease symptoms. (D) Air temperature, soil surface temperature, soil temperature, and soil moisture were recorded in 15 min intervals using TOMST-4 data loggers that were placed in the central large plot of each site. Photos: Mikko Jalo.
Figure 3 with 2 supplements
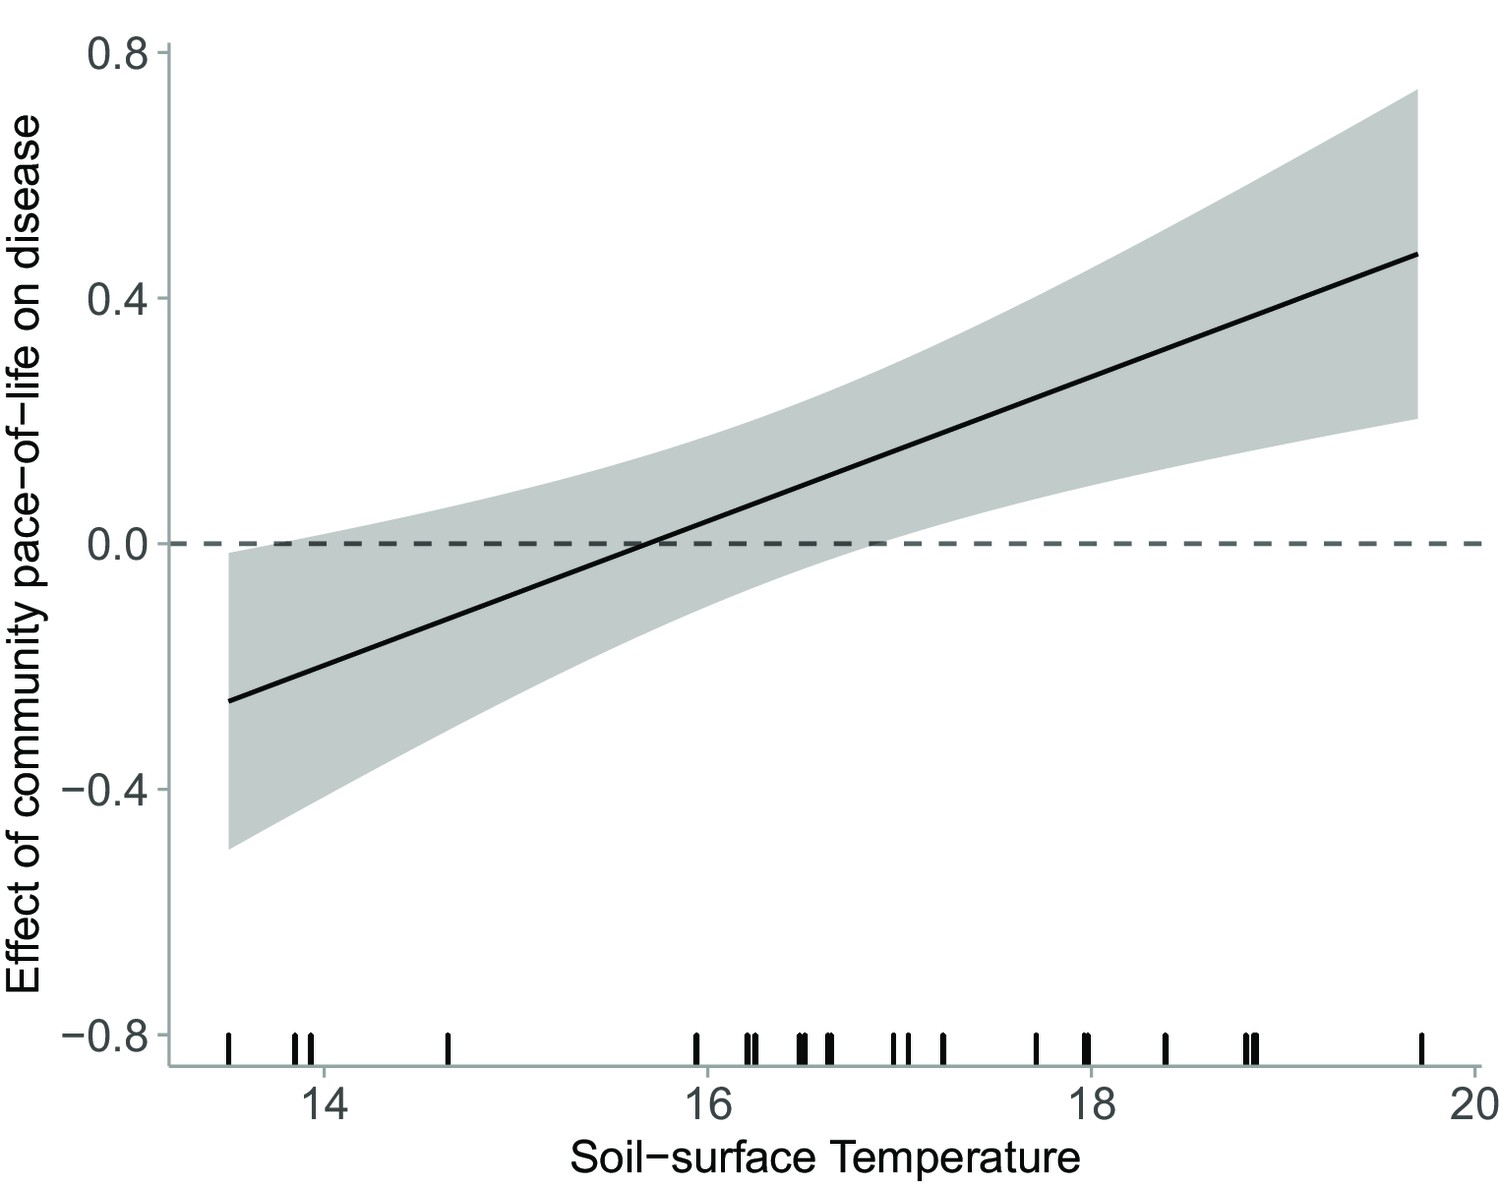
Effect of host community pace-of-life on disease as a function of increasing soil-surface temperature.
Model estimated effects of soil-surface temperature on the slope of the relationship between host community pace-of-life and (square-root-transformed) parasite community load (i.e. the interactive effect of host community pace-of-life and soil-surface temperature on disease, which represents a changing trait-competence relationship), estimated from the raw (i.e. unstandardized) coefficients of the linear mixed model testing effects of environmental conditions, community structure, and their interaction on disease. The rug along the x‐axis shows the distribution of the empirical data. Communities that experience the highest soil-surface temperatures (i.e. located at the lowest elevation) exhibit the strongest positive relationship between host pace-of-life and disease. That positive relationship weakens as temperature declines, and below mean-soil surface temperatures of 17.5 C (i.e. above 1000 m), there is no relationship between host pace-of-life and disease.
Figure 3—figure supplement 1
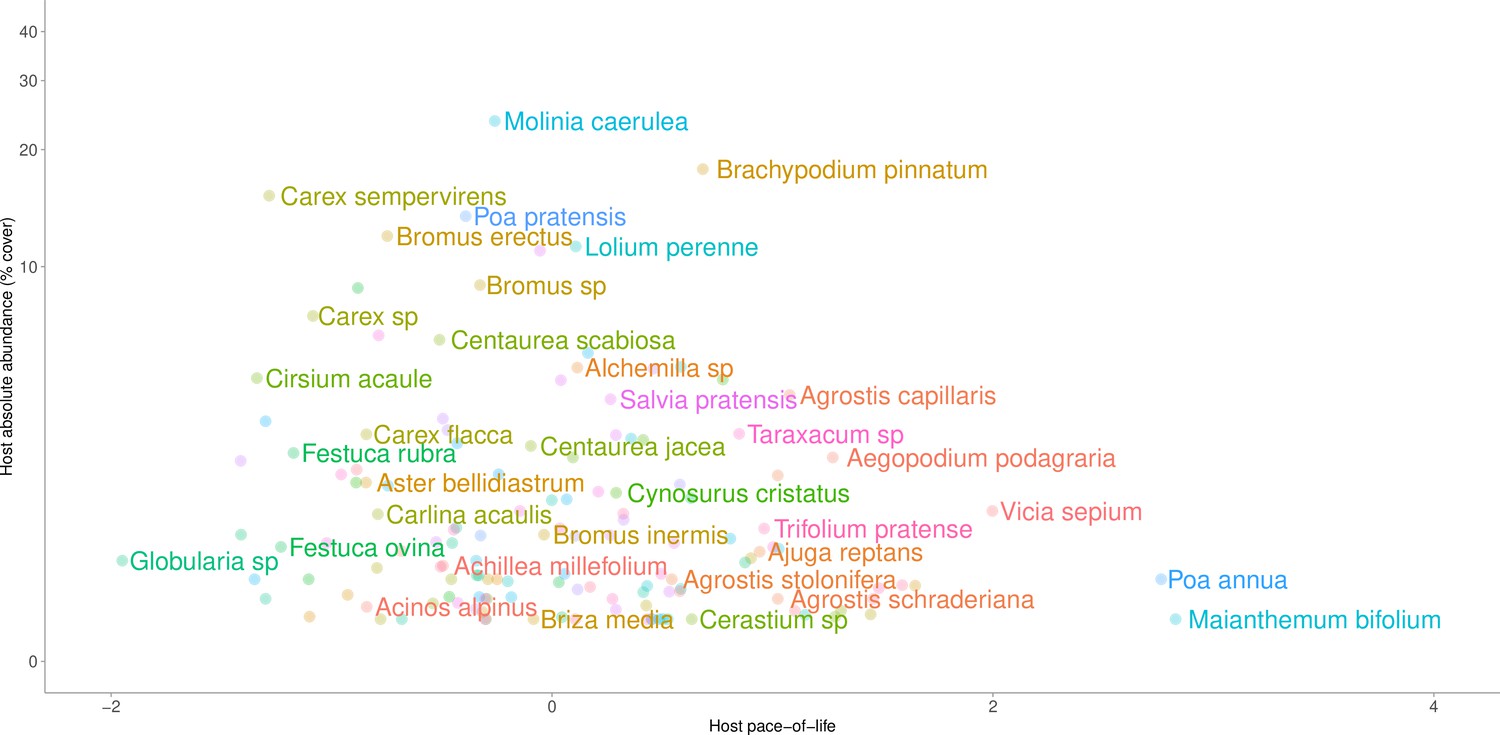
Host taxa arranged by their mean absolute vegetative cover in plots where those taxa occur (y axis) and host pace-of-life (x-axis).
Increasing values of host-pace-of life are associated with increases in specific leaf area, leaf chlorophyll content, leaf nitrogen, and leaf phosphorus, and with shorter leaf lifespans. Taxa with the highest local abundance tended to exhibit intermediate life-history strategies, while taxa exhibiting extreme life-history strategies tended to be locally rare.
Figure 3—figure supplement 2
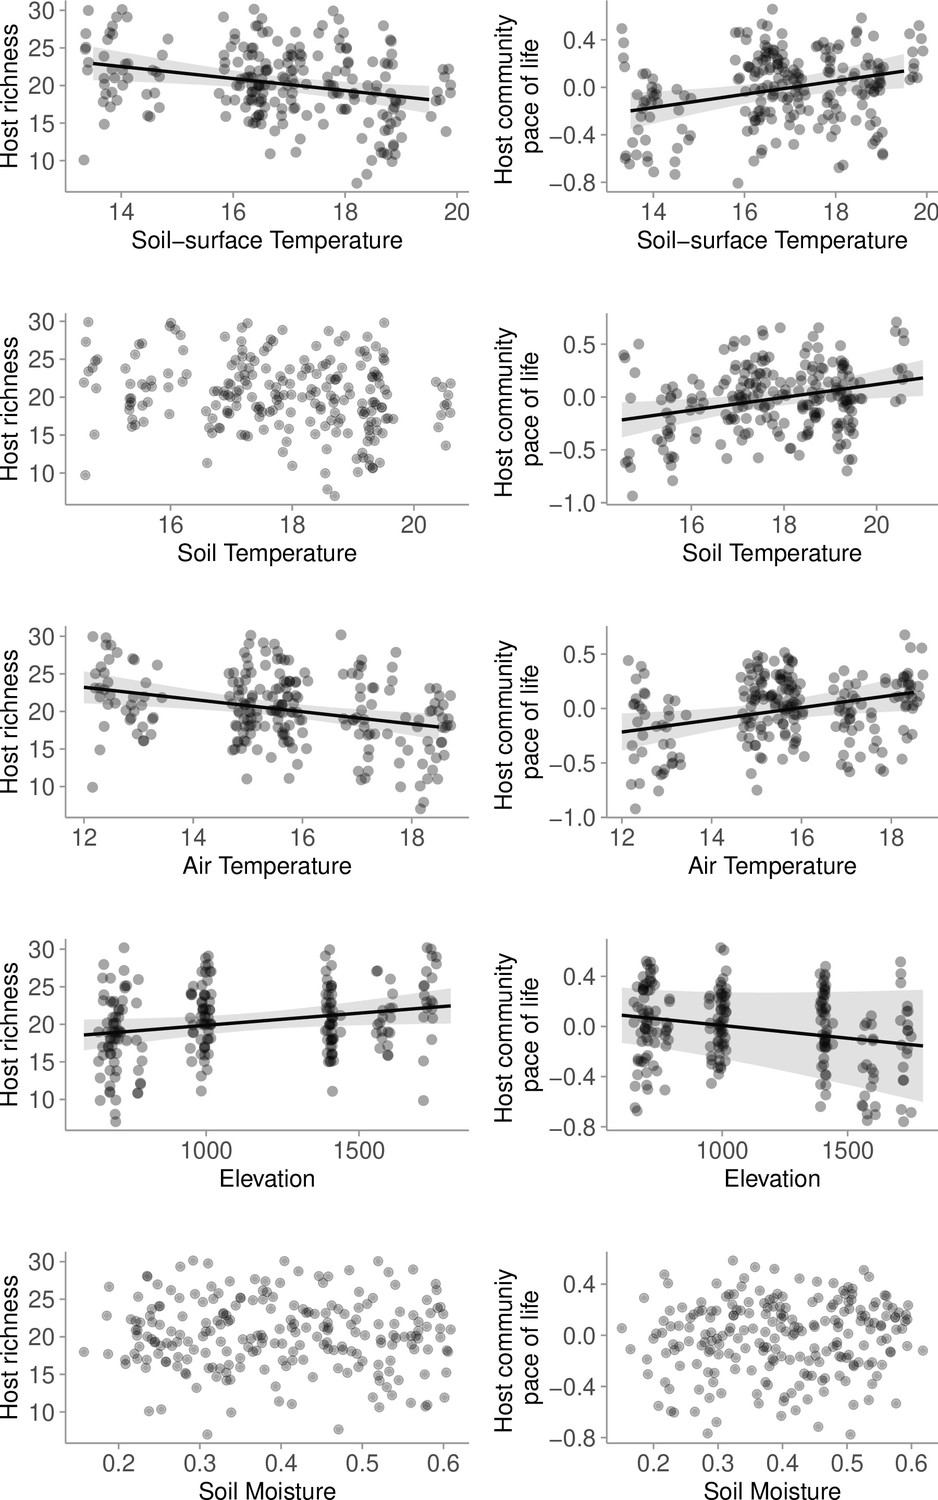
Relationship between host richness, host community pace-of-life (together measuring host community structure), soil-surface temperature, soil temperature, air temperature, and elevation.
Species richness generally declined with increasing temperatures associated with lower elevation. Host community pace-of-life generally increased with higher temperatures associated with lower elevation. Relationship between soil moisture and either host richness or pace-of-life were not supported by statistical models.
Figure 4
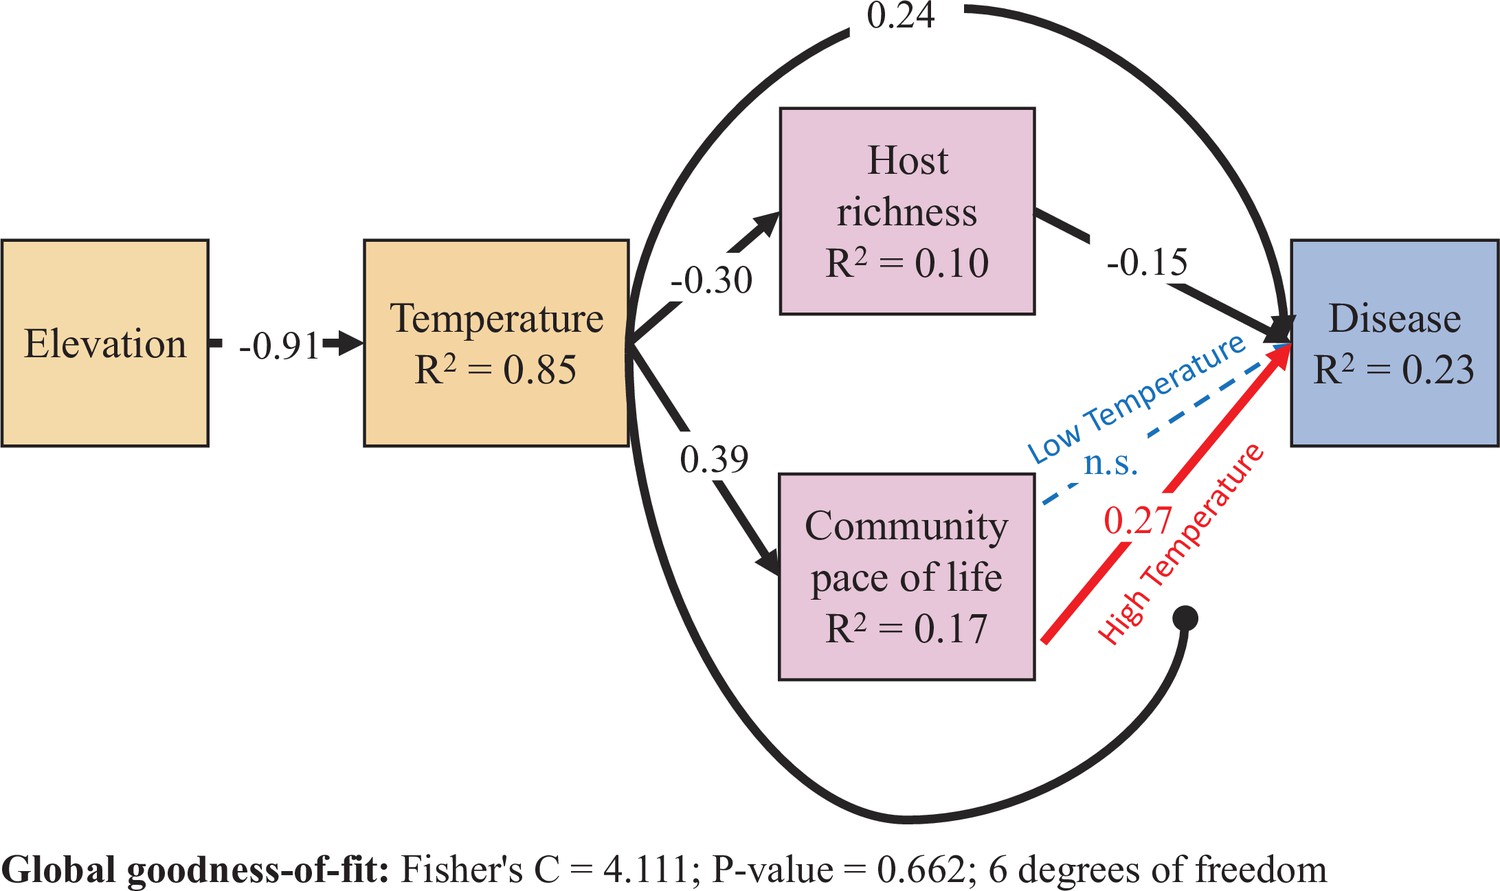
Results from the piecewise structural equation model.
Dashed lines are not supported by the model (p > .05). All coefficients are scaled by the ratio of the standard deviation of x divided by the standard deviation of y (i.e. standardized estimates), and therefore differ from the values in Figure 3. Correlations between errors were not supported by the model and are not shown. Colors are drawn to highlight the statistical interaction between host community pace-of-life and temperature. The High and Low Temperature coefficients are estimated with the reference temperature set to one standard deviation above and below the mean temperature, respectively. All other coefficients are estimated from a model using mean-centered values for temperature and community pace-of-life. Higher soil-surface temperature, associated with lower elevation, increased disease through three non-mutually exclusive pathways: directly via abiotic constraints, and indirectly both via shifting host community structure as well as by altering the trait-competence relationship.
Tables
Table 1
Results of type II analysis of deviance test on the mixed model of disease, testing whether each factor influenced square-root transformed community parasite load.
| Predictor | Estimate | Chisq | Df | P |
|---|---|---|---|---|
| Soil-surface Temperature | 0.044 | 7.4236 | 1 | 0.0064 |
| Soil Moisture | –0.254 | 0.1390 | 1 | 0.7092 |
| Host Richness | –0.009 | 5.3325 | 1 | 0.0209 |
| Host Pace-of-Life | 0.133 | 1.6970 | 1 | 0.1926 |
| Temperature × Richness | 0.004 | 2.6551 | 1 | 0.1032 |
| Temperature × Pace-of-Life | 0.118 | 11.2498 | 1 | 0.0008 |
| Moisture × Richness | –0.288 | 2.7677 | 1 | 0.0962 |
| Moisture × Pace-of-Life | –2.037 | 0.5647 | 1 | 0.4524 |
Additional files
-
Supplementary file 1
Supplementary Tables.
(a) Timing of grazing, vegetation and disease surveys and temperature measurements at each site. Recovery days represents the amount of time between the end of grazing activities and the beginning of the vegetation survey at each site. (b) Results of Type II Analysis of Deviance tests on models quantifying the effects of soil moisture and either soil-surface temperature, soil temperature, air temperature, or elevation on two measures of host community structure (Host Richness, Host Pace-of-Life). (c) Results of Type II Analysis of Deviance test on mixed models of disease, using soil temperature, air temperature, or elevation to evaluate factors that influenced square-root transformed community parasite load. (d) Coefficient estimates from the structural equation model fit with mean-centered soil-surface temperature and host pace-of-life. Estimates are provided both raw (Estimate) and scaled by the ratio of the standard deviation of x divided by the standard deviation of y (Std Estimate) to facilitate comparisons. Correlations among dependent variables are indicated by ~~. (e) Calanda Biodiversity Observatory Vegetation list. This list includes species that were observed during the vegetation survey as well as taxa observed outside of the plots during extensive preliminary surveys of Mount Calanda. (f) Comparison of different models quantifying the relationship between host community traits and disease. Each model contained square-root transformed community parasite load as the response, and elevation, host community species richness, richness-independent phylogenetic diversity, and some combination of host traits as fixed effects. To estimate whether the effect of host community structure depends on elevation, we also included in the model the pairwise interactions between each measure of host community structure and elevation as additional fixed effects, The Pace-of-Life model includes host community pace-of-life as a latent factor, and is the model reported in the manuscript. The All Traits model includes all single traits in place of the pace-of-life latent factor. The Chlorophyll, Leaf Longevity, Leaf Nitrogen, Leaf Phosphorus, and Specific Leaf Area models include a single trait in place of the latent factor.
- https://cdn.elifesciences.org/articles/67340/elife-67340-supp1-v2.docx
-
Transparent reporting form
- https://cdn.elifesciences.org/articles/67340/elife-67340-transrepform1-v2.pdf
Download links
A two-part list of links to download the article, or parts of the article, in various formats.
Downloads (link to download the article as PDF)
Open citations (links to open the citations from this article in various online reference manager services)
Cite this article (links to download the citations from this article in formats compatible with various reference manager tools)
The effect of host community functional traits on plant disease risk varies along an elevational gradient
eLife 10:e67340.
https://doi.org/10.7554/eLife.67340


