Information content differentiates enhancers from silencers in mouse photoreceptors
- Edison Family Center for Genome Sciences and Systems Biology, Washington University School of Medicine, United States
- Department of Genetics, Washington University School of Medicine, United States
- Department of Pathology and Immunology, Washington University School of Medicine, United States
Figures
Figure 1 with 2 supplements
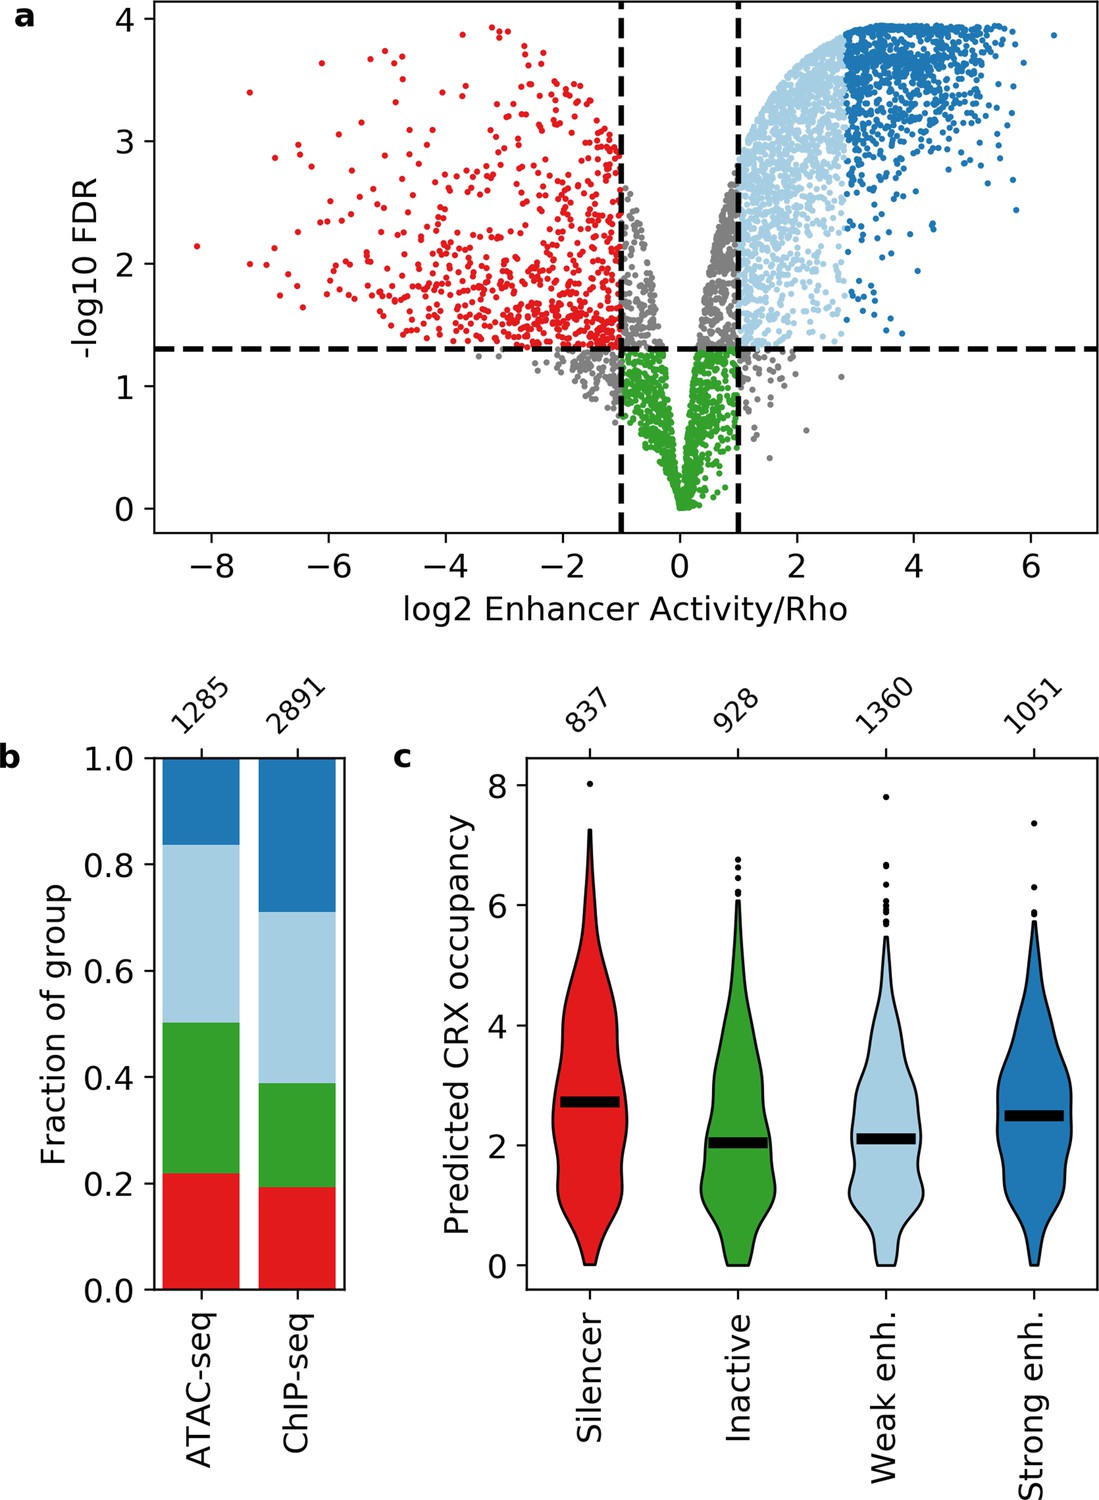
Activity of putative cis-regulatory sequences with cone-rod homeobox (CRX) motifs.
(a) Volcano plot of activity scores relative to the Rho promoter alone. Sequences are grouped as strong enhancers (dark blue), weak enhancers (light blue), inactive (green), silencers (red), or ambiguous (gray). Horizontal line, false discovery rate (FDR) q = 0.05. Vertical lines, twofold above and below Rho. (b) Fraction of ChIP-seq and ATAC-seq peaks that belong to each activity group. (c) Predicted CRX occupancy of each activity group. Horizontal lines, medians; enh., enhancer. Numbers at top of (b and c) indicate n for groups.
Figure 1—figure supplement 1
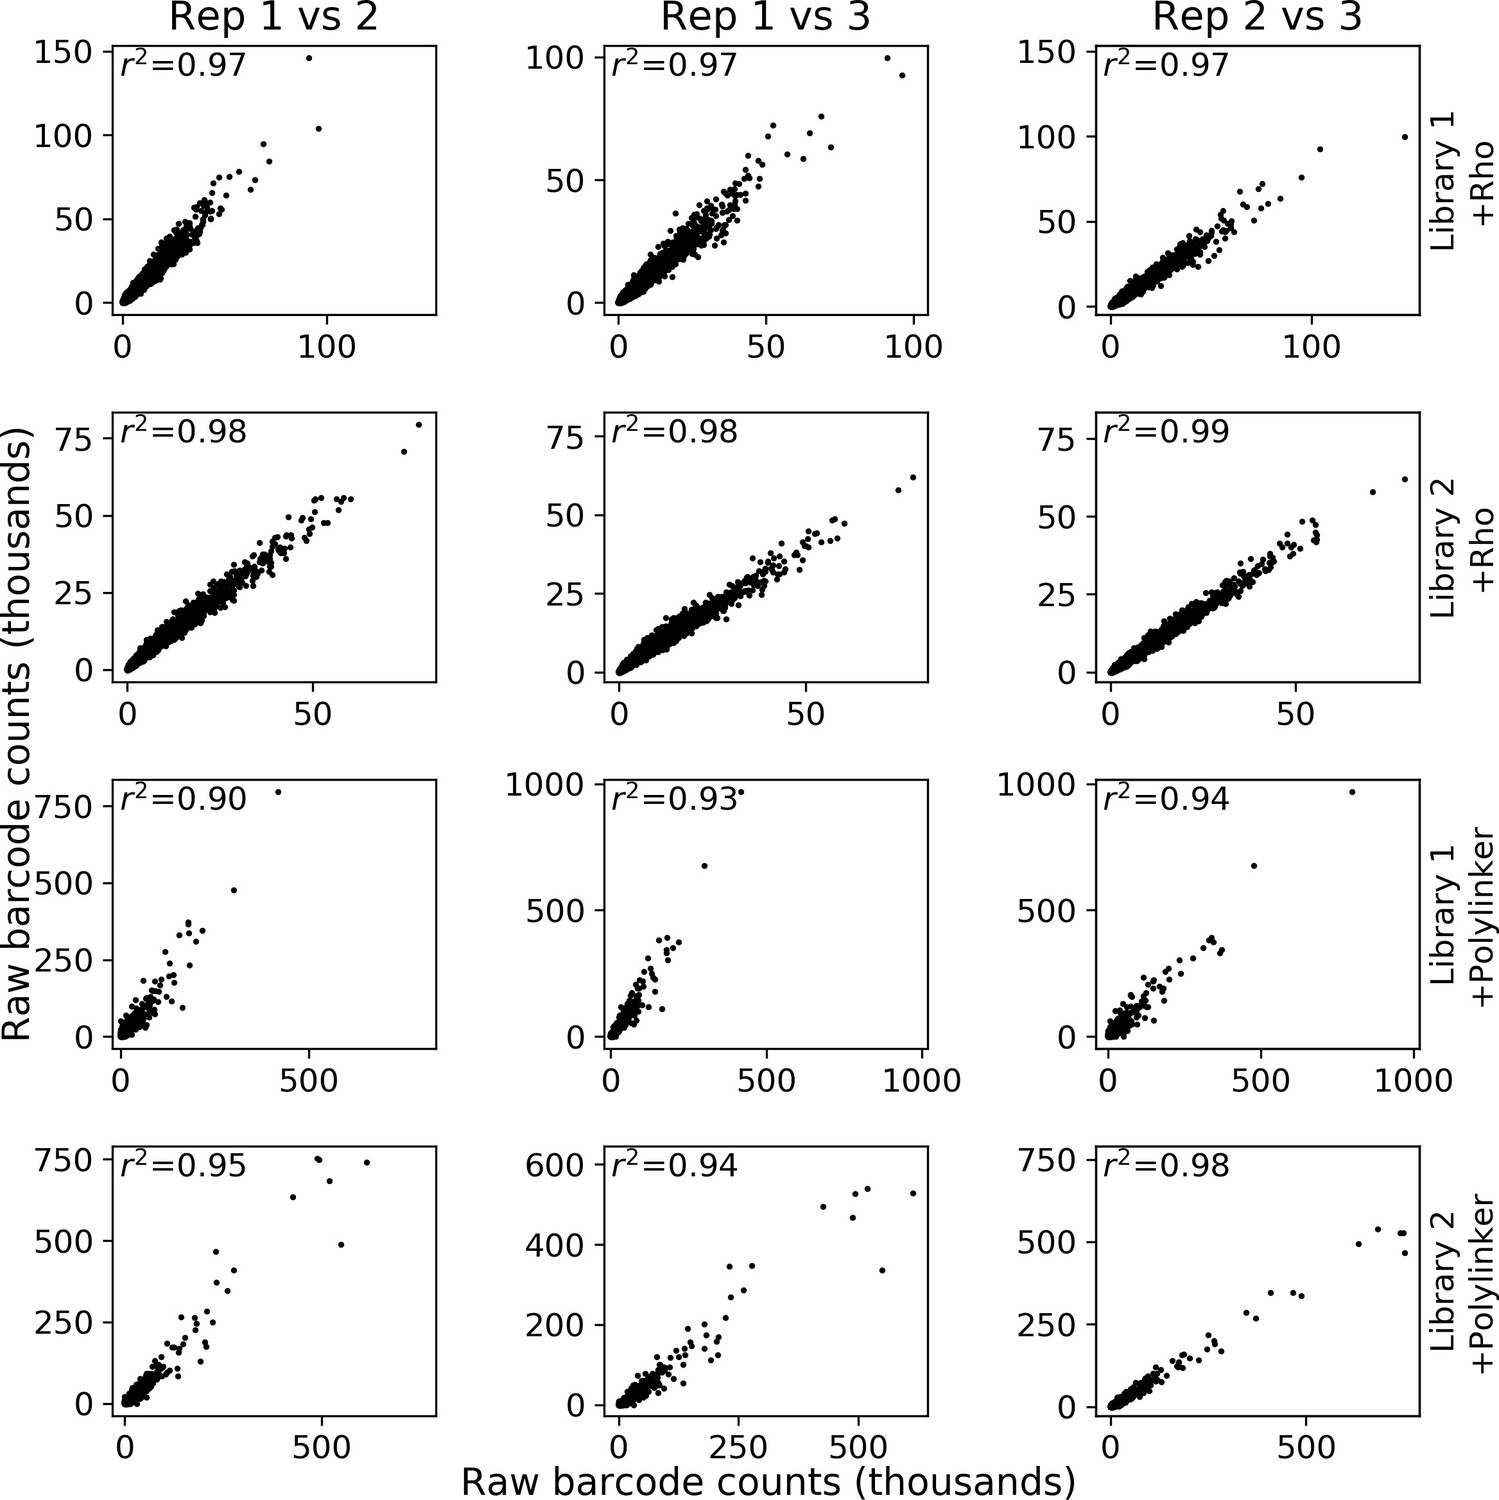
Reproducibility of massively parallel reporter assay (MPRA) measurements.
Each row represents a different library and experiment. For each column, the first replicate in the title is the x-axis and the second replicate is the y-axis.
Figure 1—figure supplement 2
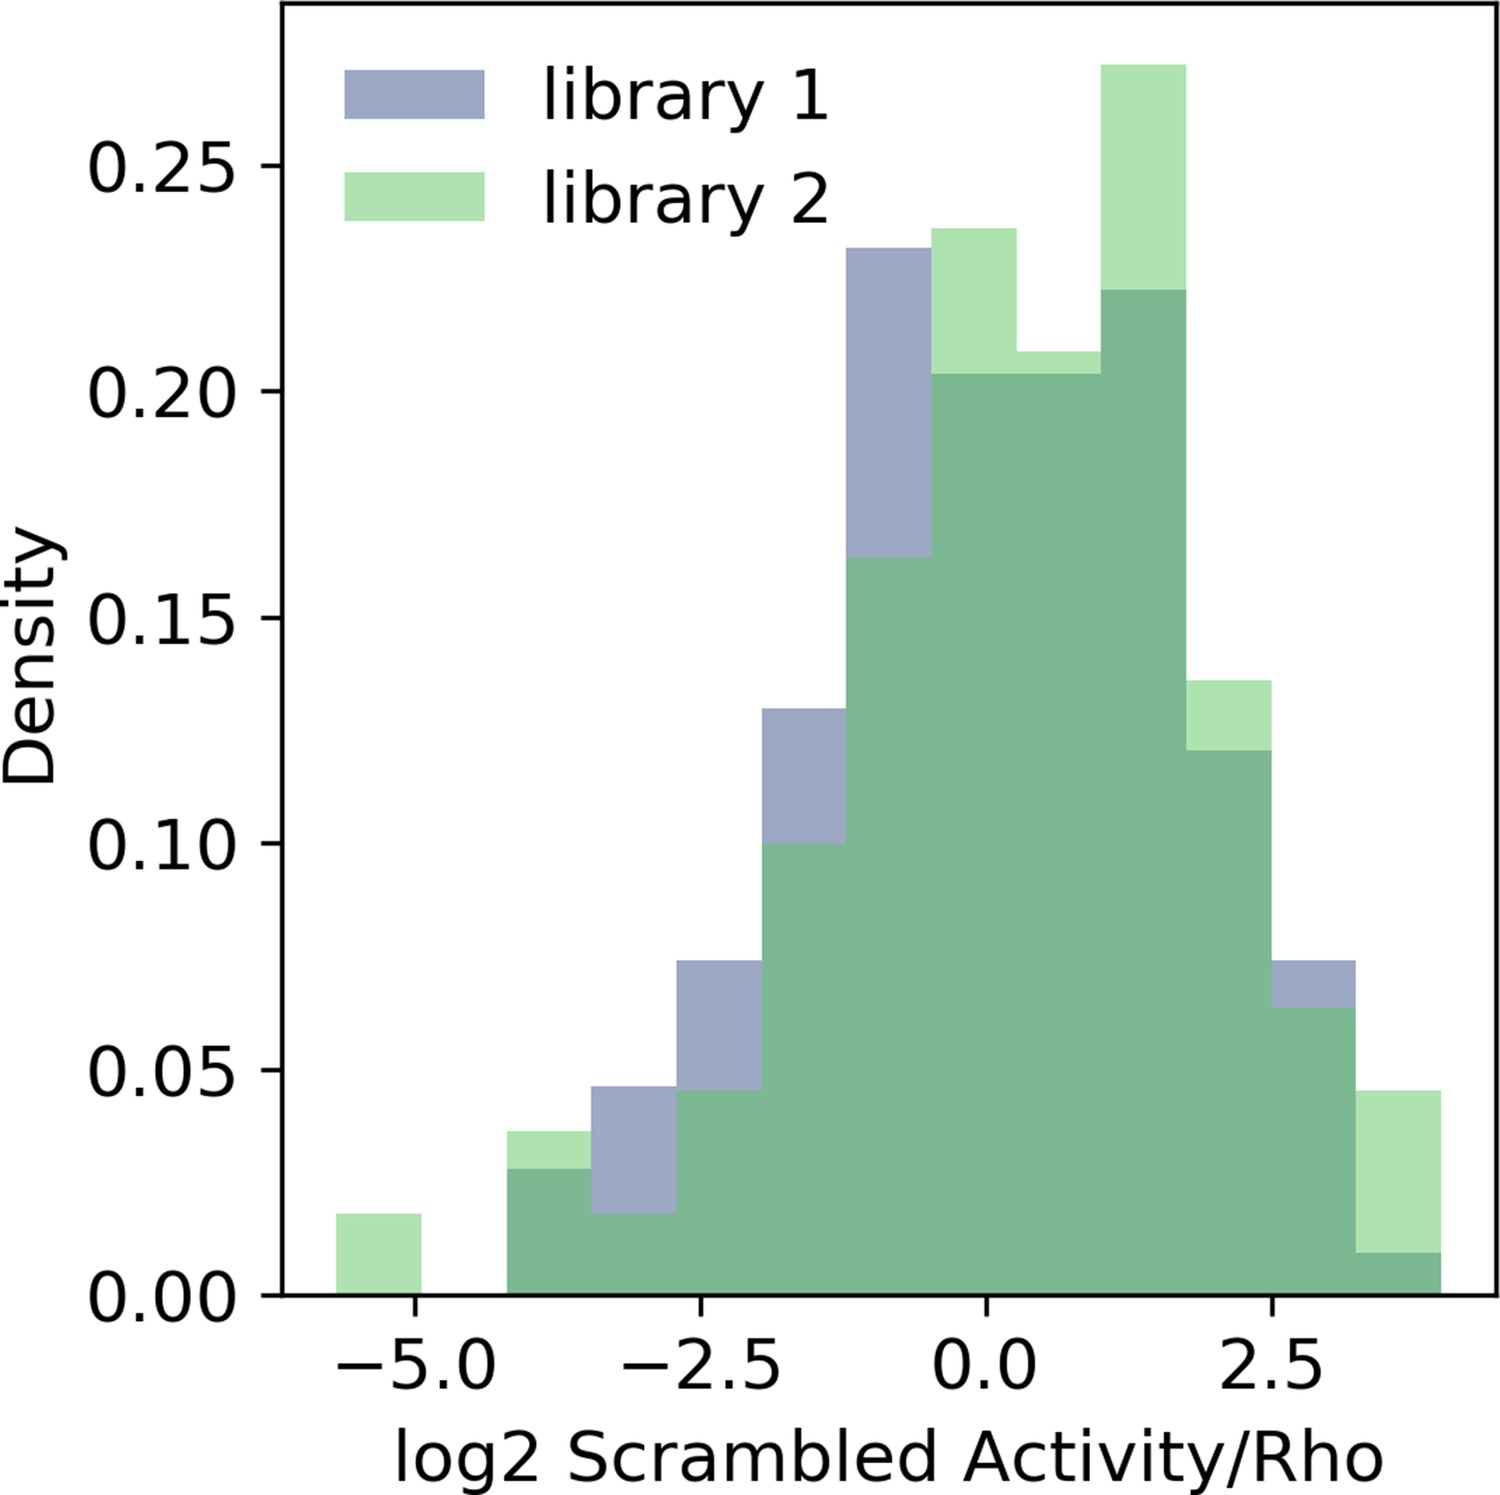
Calibration of massively parallel reporter assay (MPRA) libraries with the Rho promoter.
Probability density histogram of the same 150 scrambled sequences in two libraries after normalizing to the basal Rho promoter.
Figure 2 with 3 supplements

Strong enhancers contain a diverse array of motifs.
(a) Receiver operating characteristic for classifying strong enhancers from silencers. Solid black, 6-mer support vector machine (SVM); orange, eight transcription factors (TFs) predicted occupancy logistic regression; aqua, predicted cone-rod homeobox (CRX) occupancy logistic regression; dashed black, chance; shaded area, 1 standard deviation based on fivefold cross-validation. (b and c) Total predicted TF occupancy (b) and frequency of TF motifs (c) in each activity class. (d) Frequency of co-occurring TF motifs in strong enhancers. Lower triangle is expected co-occurrence if motifs are independent. (e) Frequency of activity classes, colored as in (b), for sequences in CRX, NRL, and/or MEF2D ChIP-seq peaks. (f) Frequency of TF ChIP-seq peaks in activity classes. TFs in (c) are sorted by feature importance of the logistic regression model in (a).
Figure 2—figure supplement 1
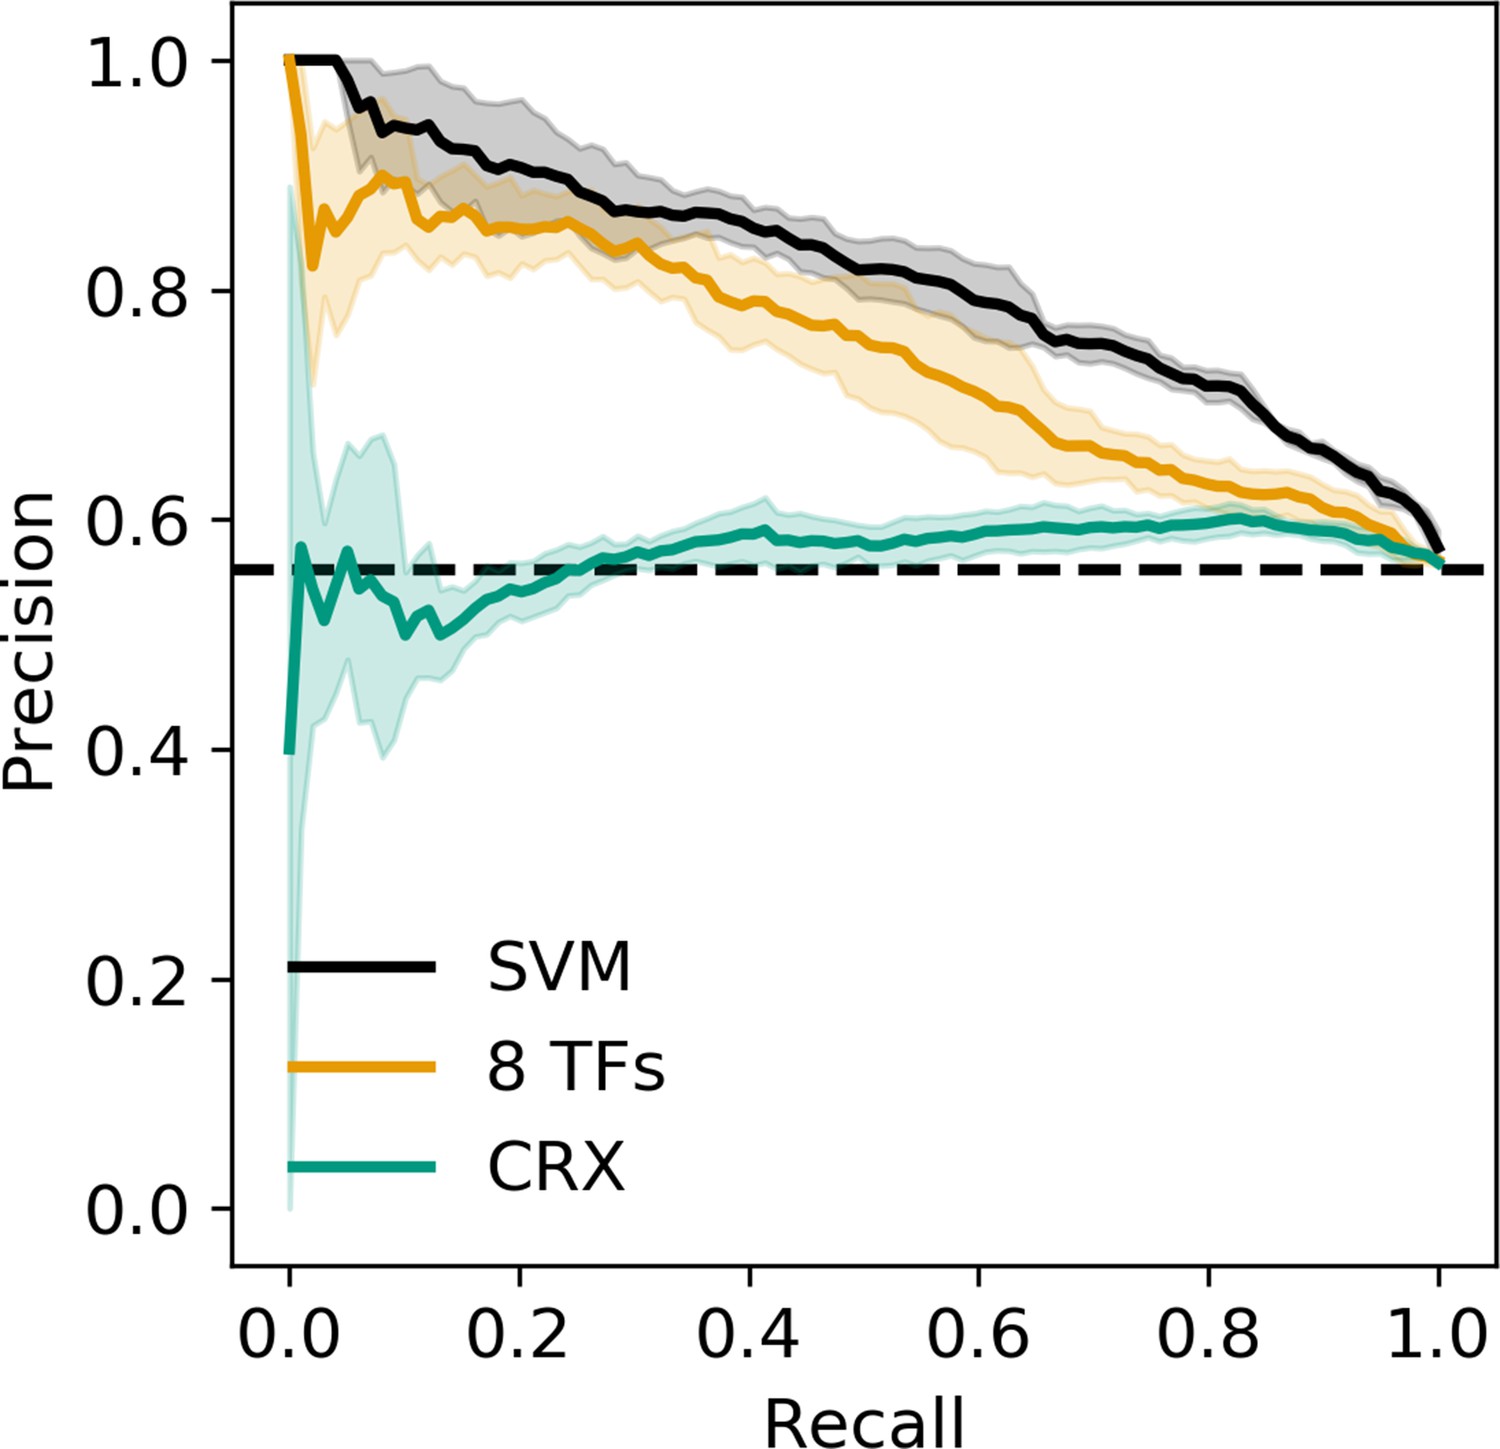
Precision recall curve for strong enhancer vs. silencer classifiers.
Solid black, 6-mer support vector machine (SVM); orange, eight transcription factors (TFs) predicted occupancy logistic regression; aqua, predicted cone-rod homeobox (CRX) occupancy logistic regression; dashed black, chance; shaded area, 1 standard deviation based on fivefold cross-validation.
Figure 2—figure supplement 2
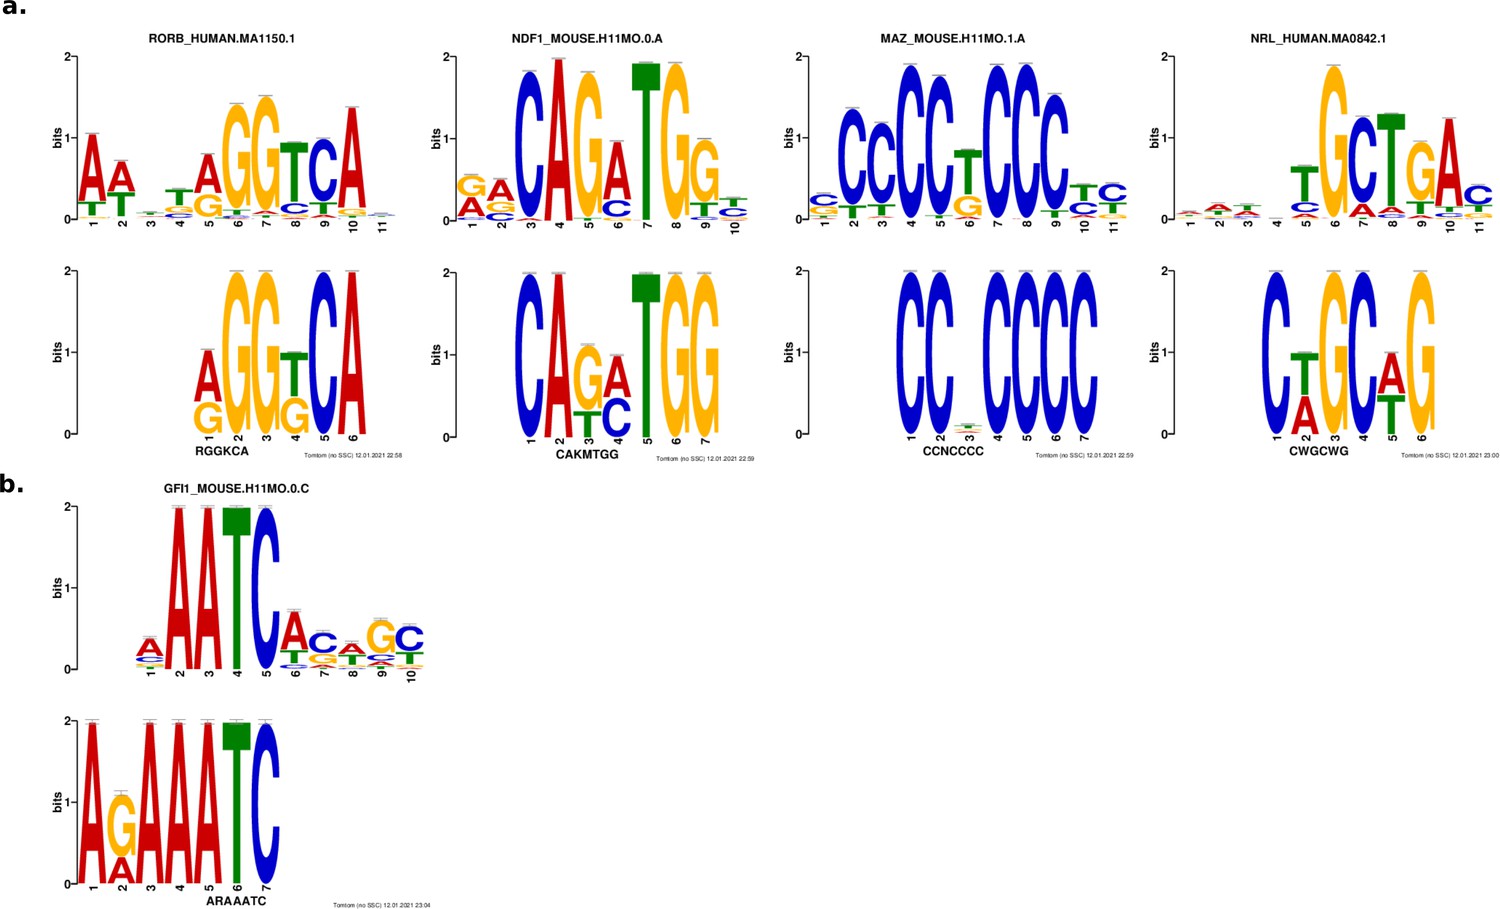
Results from de novo motif analysis.
Motifs enriched in strong enhancers (a) and silencers (b). Bottom, de novo motif identified with DREME; top, matched known motif identified with TOMTOM.
Figure 2—figure supplement 3
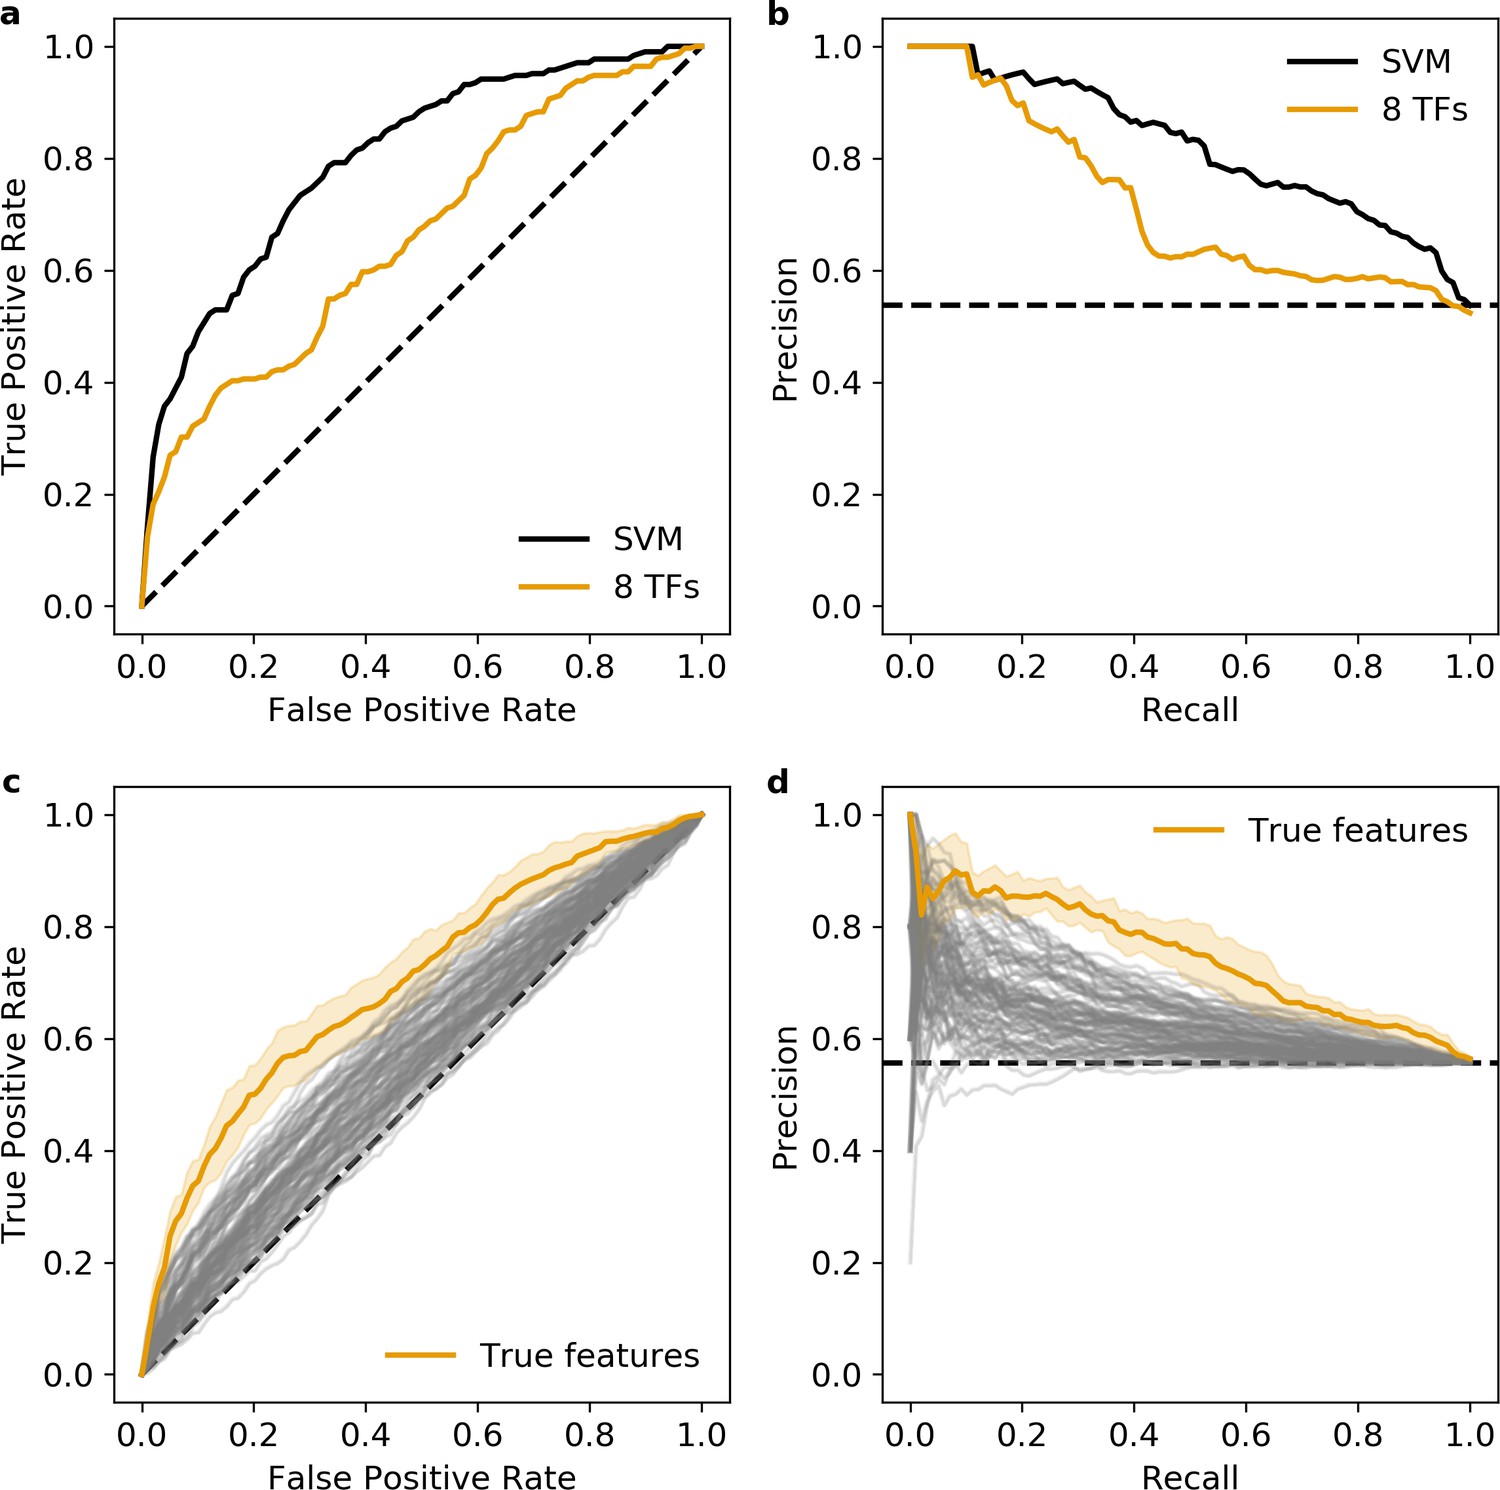
Additional validation of the eight transcription factors (TFs) predicted occupancy logistic regression model.
(a and b) Predictions of the 6-mer support vector machine (SVM) (black) and eight TFs predicted occupancy logistic regression model (orange) on an independent test set. (c and d) Null distribution of 100 logistic regression models trained using randomly selected motifs (gray) compared to the true features (orange). Shaded area, 1 standard deviation based on fivefold cross-validation. (a and c) Receiver operating characteristic, (b and d) precision recall curve. Dashed black line represents chance in all panels.
Figure 3 with 1 supplement

Information content classifies strong enhancers.
(a) Information content for different activity classes. (b) Receiver operating characteristic of information content to classify strong enhancers from silencers (orange) or inactive sequences (indigo).
Figure 3—figure supplement 1
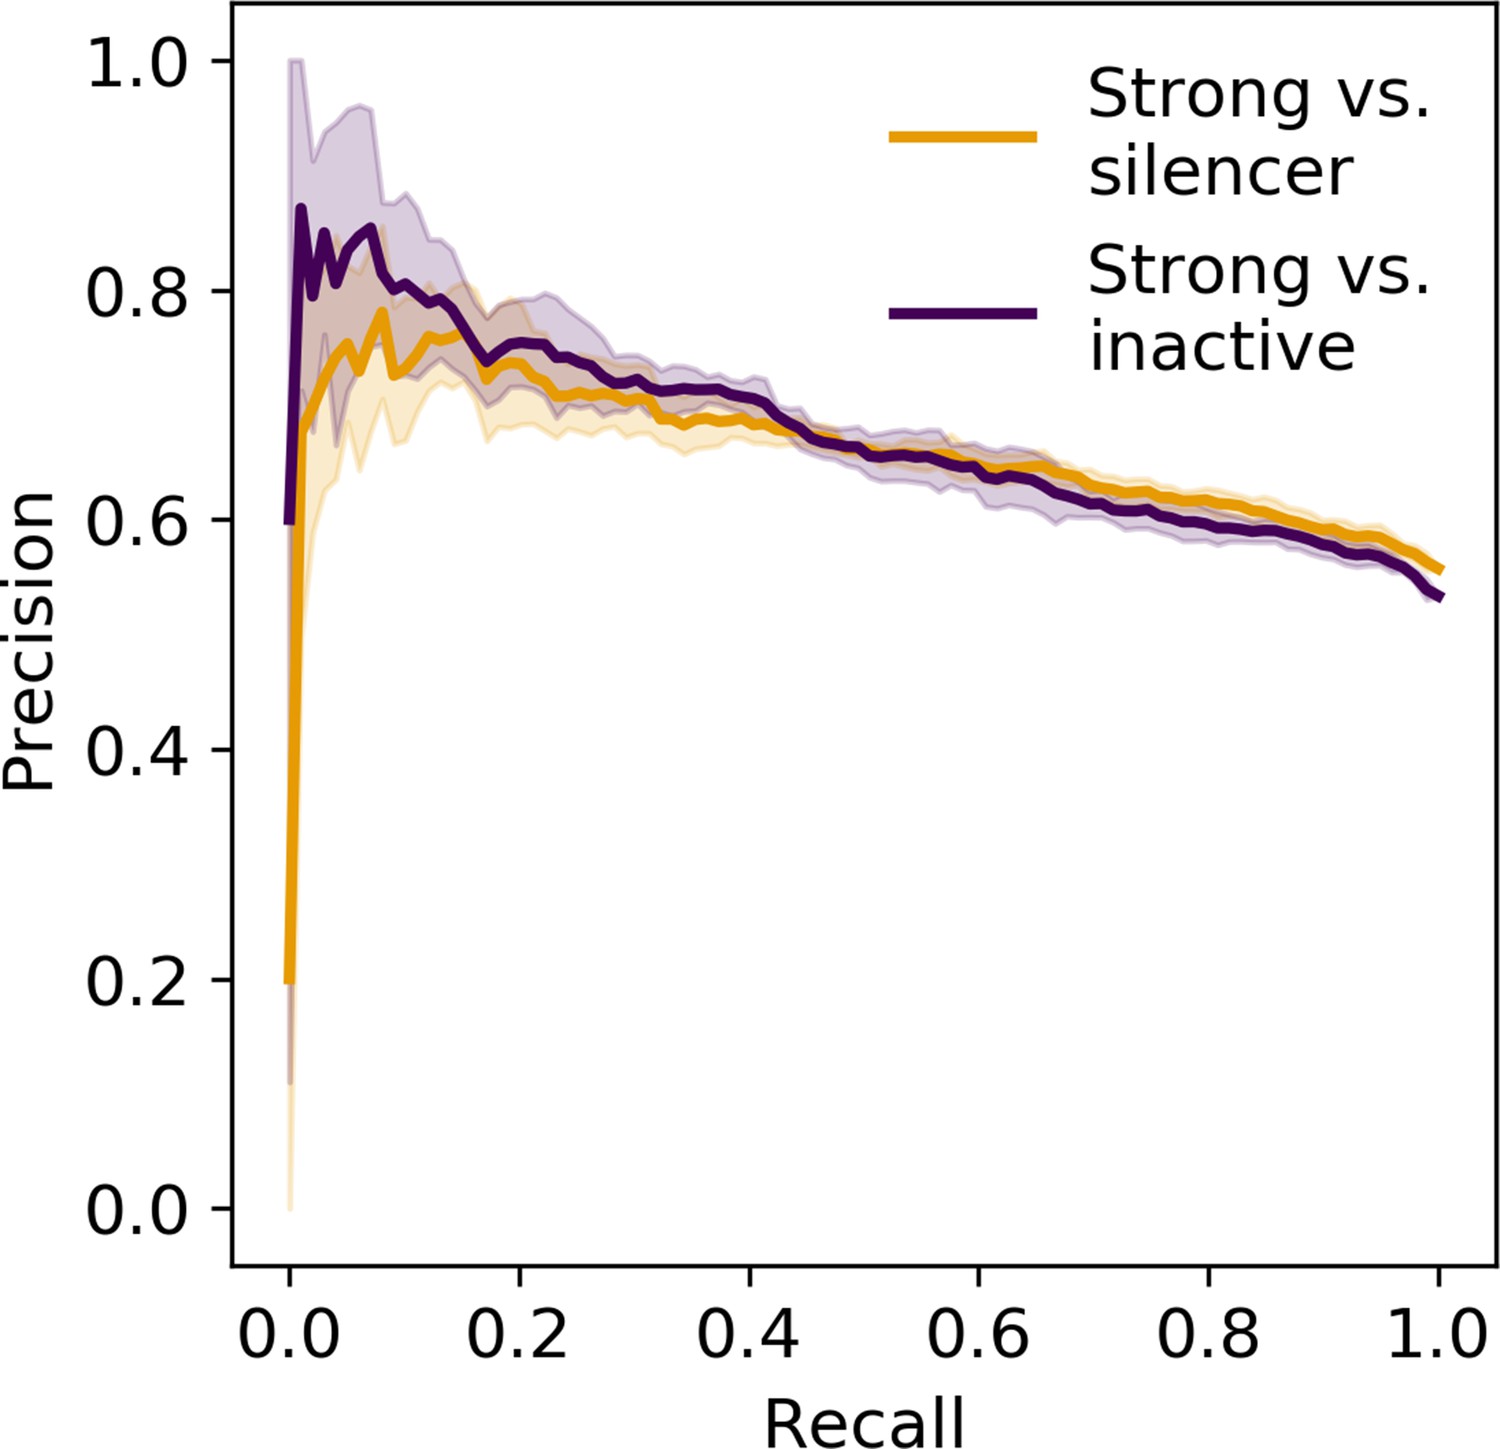
Precision recall curve of logistic regression classifier using information content.
Orange, strong enhancer vs. silencer; indigo, strong enhancer vs. inactive; shaded area, 1 standard deviation based on fivefold cross-validation.
Figure 4
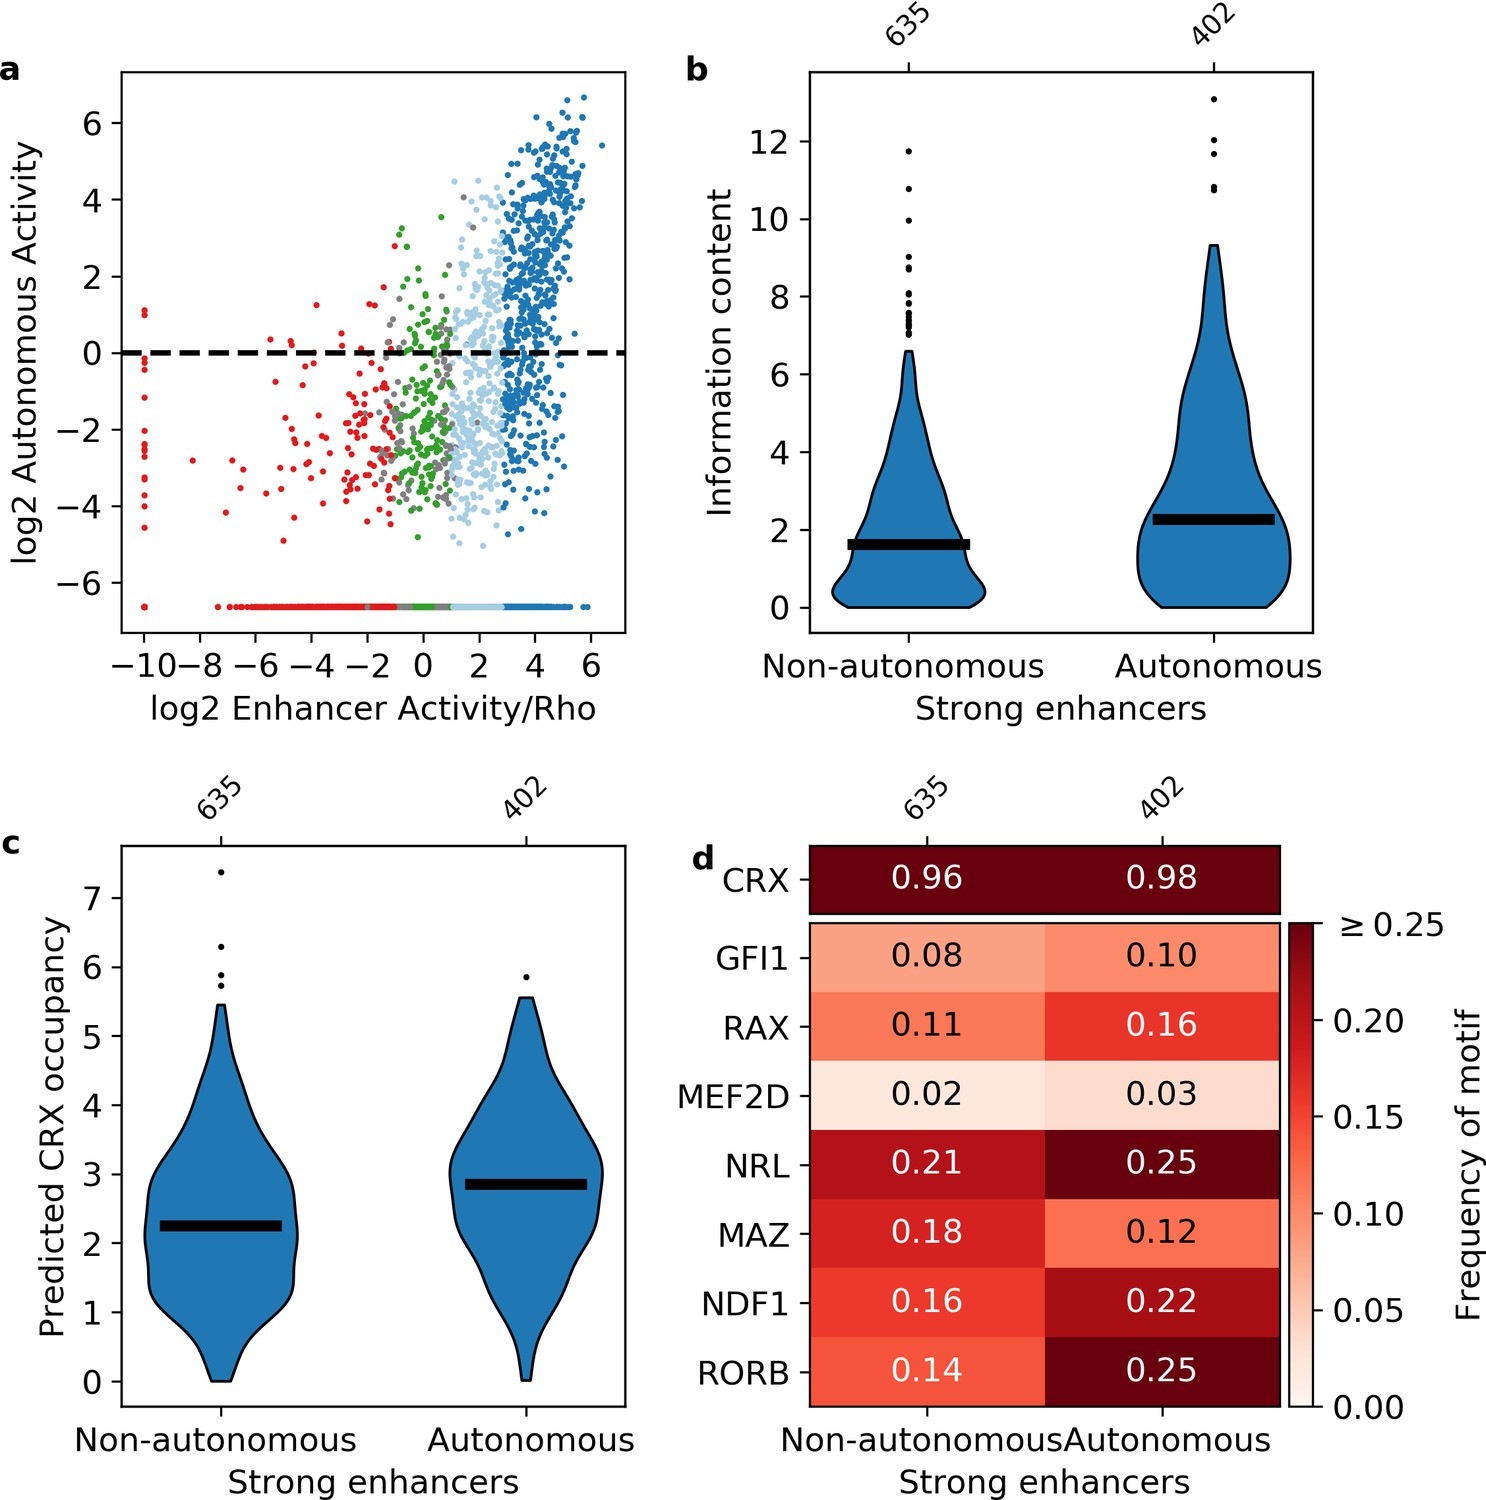
Sequence features of autonomous and non-autonomous strong enhancers.
(a) Activity of library in the presence (x-axis) or absence (y-axis) of the Rho promoter. Dark blue, strong enhancers; light blue, weak enhancers; green, inactive; red, silencers; gray, ambiguous; horizontal line, cutoff for autonomous activity. Points on the far left and/or very bottom are sequences that were present in the plasmid pool but not detected in the RNA. (b–d) Comparison of autonomous and non-autonomous strong enhancers for information content (b), predicted cone-rod homeobox (CRX) occupancy (c), and frequency of transcription factor (TF) motifs (d).
Figure 5
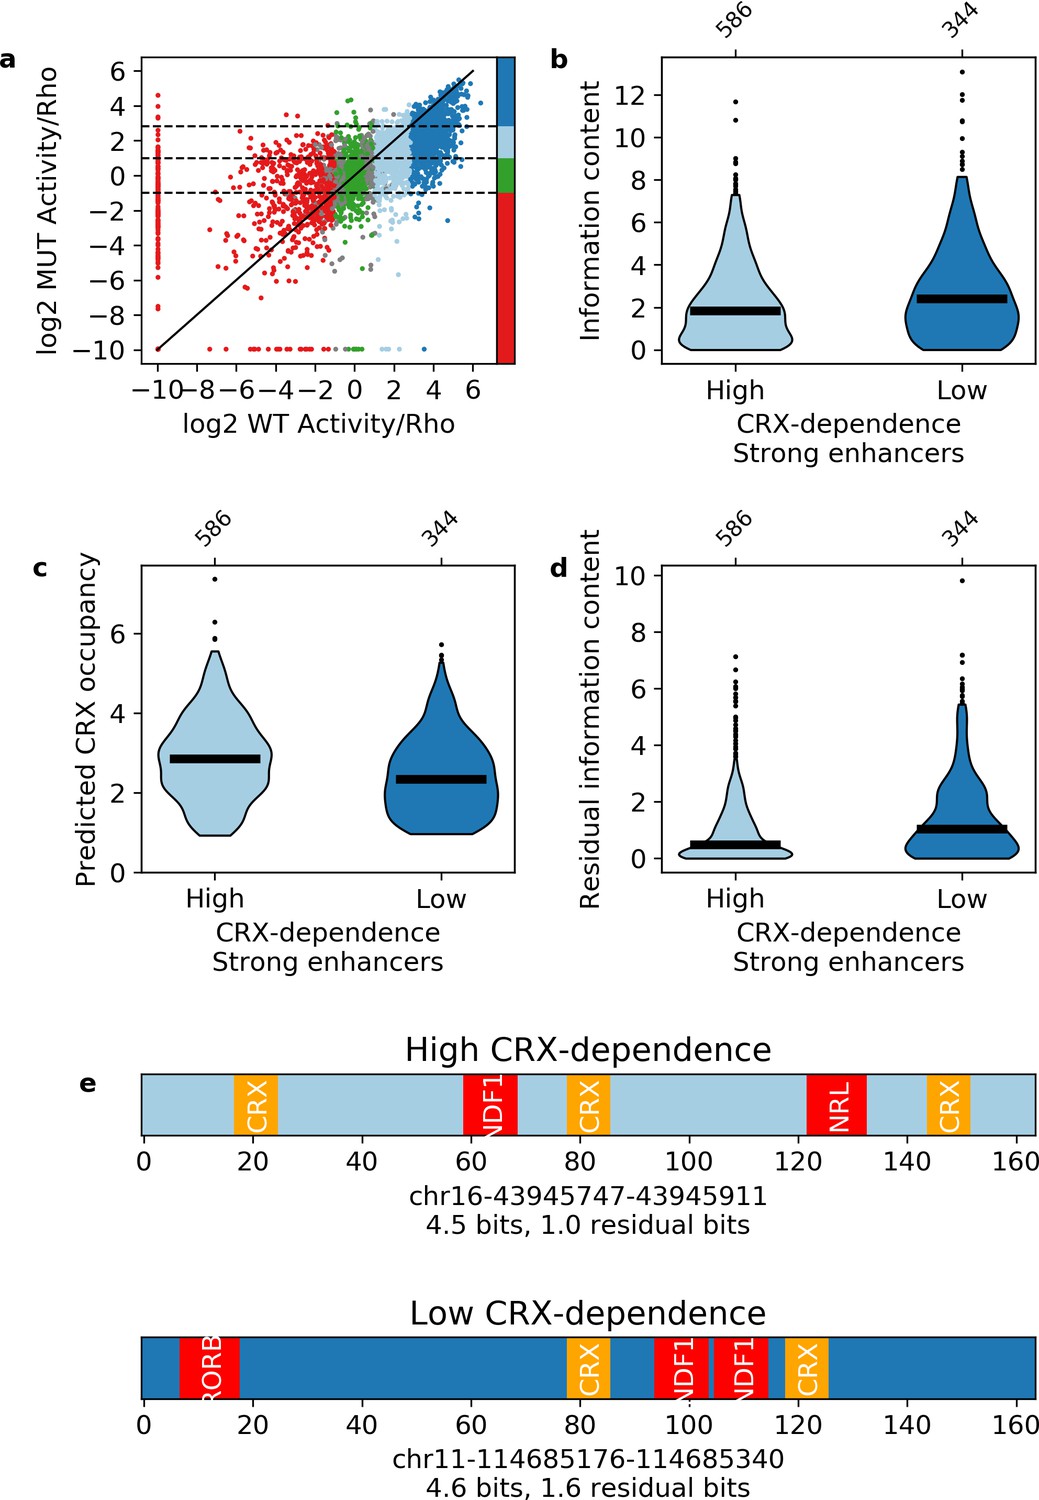
Independence of transcription factor (TF) motifs in strong enhancers.
(a) Activity of sequences with and without cone-rod homeobox (CRX) motifs. Points are colored by the activity group with CRX motifs intact: dark blue, strong enhancers; light blue, weak enhancers; green, inactive; red, silencers; gray, ambiguous; horizontal dotted lines and color bar represent the cutoffs for the same groups when CRX motifs are mutated. Solid black line is the y = x line. (b–d) Comparison of strong enhancers with high and low CRX dependence for information content (b), predicted CRX occupancy (c), and residual information content (d). (e) Representative strong enhancers with high (top) or low (bottom) CRX dependence.
Tables
Key resources table
| Reagent type (species) or resource | Designation | Source or reference | Identifiers | Additional information |
|---|---|---|---|---|
| Strain, strain background (Mus musculus, male and female) | CD-1 | Charles River | Strain code 022 | |
| Recombinant DNA reagent | Library1 | This paper | Listed in Supplementary file 1 | |
| Recombinant DNA reagent | Library2 | This paper | Listed in Supplementary file 2 | |
| Recombinant DNA reagent | pJK01_Rhominprox-DsRed | Kwasnieski et al., 2012 | AddGene plasmid # 173,489 | |
| Recombinant DNA reagent | pJK03_Rho_basal_DsRed | Kwasnieski et al., 2012 | AddGene plasmid # 173,490 | |
| Sequence-based reagent | Primers | IDT | Listed in Supplementary file 6 | |
| Commercial assay or kit | Monarch PCR Cleanup Kit | New England Biolabs | T1030S | |
| Commercial assay or kit | Monarch DNA Gel Extraction Kit | New England Biolabs | T1020L | |
| Commercial assay or kit | TURBO DNA-free | Invitrogen | AM1907 | |
| Commercial assay or kit | SuperScript III Reverse Transcriptase | Invitrogen | 18080044 | |
| Software, algorithm | Bedtools | https://bedtools.readthedocs.io/en/latest/ | RRID:SCR_006646 | |
| Software, algorithm | MEME Suite | https://meme-suite.org/ | RRID:SCR_001783 | |
| Software, algorithm | ShapeMF | https://github.com/h-samee/shape-motif, Samee, 2021 | DOI:10.1016/j.cels.2018.12.001 | |
| Software, algorithm | Numpy | https://numpy.org/ | DOI:10.1038/s41586-020-2649-2 | |
| Software, algorithm | Scipy | https://www.scipy.org/ | DOI:10.1038/s41592-019-0686-2 | |
| Software, algorithm | Pandas | https://pandas.pydata.org/ | DOI:10.5281/zenodo.3509134 | |
| Software, algorithm | Matplotlib | https://matplotlib.org/ | DOI:10.5281/zenodo.1482099 | |
| Software, algorithm | Logomaker | https://github.com/jbkinney/logomaker, Justin, 2021 | DOI:10.1093/bioinformatics/btz921 |
Additional files
-
Supplementary file 1
FASTA file of all sequences in library 1.
Sequences were named using the following nomenclature: ‘chrom-start-stop_annotations_variant’. ‘Chrom’, ‘start’, and ‘stop’ correspond to the mm10 genomic coordinates of the sequences in BED format. ‘Annotations’ is a four-letter string where the first position indicates CRX-binding status (ChIP-seq peak or Unbound), the second position indicates CRX motif status (PWM hit, Shape motif, or Both PWM and shape motif), the third position indicates ATAC-seq status (peak in Rods but not cones, peak in Cones but not rods, peak in both rod and cone Photoreceptors, or peak in None of the above), and the fourth position indicates histone ChIP-seq status (‘Enhancer marked’ with H3K27Ac+H3K4me3-, ‘Promoter marked’ with H3K27Ac+H3K4me3+, Q for H3K27Ac-H3K4me3+, or Neither mark). ‘Variant’ indicates whether the sequence is genomic (‘WT’), mutated CRX motifs (‘MUT-allCrxSites’), scrambled shape motif (‘MUT-shape’), or a scrambled control (‘scrambled’).
- https://cdn.elifesciences.org/articles/67403/elife-67403-supp1-v2.txt
-
Supplementary file 2
FASTA file of all sequences in library 2.
Sequences were named as in Supplementary file 1.
- https://cdn.elifesciences.org/articles/67403/elife-67403-supp2-v2.txt
-
Supplementary file 3
Expression measurements and annotations of all sequences.
Values are tab-delimited. Rows are named based on the sequence name from Supplementary files 1 and 2 without the ‘variant’ information. Columns ending in ‘_WT’ indicate the wild-type sequence with the Rho promoter, ‘_MUT’ as the CRX motif mutant sequence with the Rho promoter, and ‘_POLY’ as the wild-type sequence with the Polylinker. Sequences with the scrambled shape motif were excluded from the ‘_MUT’ columns. Columns are named as follows: label, the sequence name from Supplementary files 1 and 2 without the ‘variant’ information; expression, average activity of the sequence, NaN indicates sequence was missing from the plasmid pool; expression_std, standard deviation of activity; expression_reps, number of replicates in which the sequence was measured; expression_pvalue, p-value from Welch’s t-test of log-normal data for the null hypothesis that the activity of the sequence with Rho is no different than the Rho promoter alone; expression_qvalue, FDR-correction of the p-values; library, which library contains the sequence; expression_log2, log2 average activity of the sequence; group_name, activity classification of the sequence with the Rho promoter; plot_color, hex code for visualization; variant, the ‘variant’ portion of the sequence identifier; wt_vs_mut_log2, log2 fold change between the wild-type and mutant version of the sequence, NaN indicates the wild-type and/or mutant version was not measured; wt_vs_mut_pvalue, p-value from Welch’s t-test for the null hypothesis that the wild-type and mutant sequences have the same activity; wt_vs_mut_qvalue, FDR-correction of the p-values; autonomous_activity, Boolean value for if the wild-type sequence is autonomous with the Polylinker; crx_bound, nrl_bound, and mef2d_bound, Boolean values for if the sequence overlaps a ChIP-seq peak for the corresponding TF; binding_group, string denoting each of the eight possible combinations of CRX, NRL, and MEF2D binding.
- https://cdn.elifesciences.org/articles/67403/elife-67403-supp3-v2.txt
-
Supplementary file 4
Predicted occupancy scores for each transcription factor (TF) and each sequence.
Values are tab-delimited. Rows are named based on the sequence name from Supplementary files 1 and 2 including the ‘variant’ information. Columns are the predicted occupancy scores for the denoted TF.
- https://cdn.elifesciences.org/articles/67403/elife-67403-supp4-v2.txt
-
Supplementary file 5
Information content and related metrics for each sequence.
Values are tab-delimited. Rows are named based on the sequence name from Supplementary files 1 and 2, including the ‘variant’ information. Columns are named as follows: total_occupancy, total predicted occupancy of all eight transcription factors (TFs); diversity, number of TFs with predicted occupancy above 0.5; entropy, information content (which is also entropy).
- https://cdn.elifesciences.org/articles/67403/elife-67403-supp5-v2.txt
-
Supplementary file 6
Primers used in this study.
- https://cdn.elifesciences.org/articles/67403/elife-67403-supp6-v2.xlsx
-
Transparent reporting form
- https://cdn.elifesciences.org/articles/67403/elife-67403-transrepform1-v2.docx
Download links
A two-part list of links to download the article, or parts of the article, in various formats.
Downloads (link to download the article as PDF)
Open citations (links to open the citations from this article in various online reference manager services)
Cite this article (links to download the citations from this article in formats compatible with various reference manager tools)
Information content differentiates enhancers from silencers in mouse photoreceptors
eLife 10:e67403.
https://doi.org/10.7554/eLife.67403


