Glycan-based shaping of the microbiota during primate evolution
- Instituto Gulbenkian de Ciência, Portugal
Figures
Figure 1 with 4 supplements
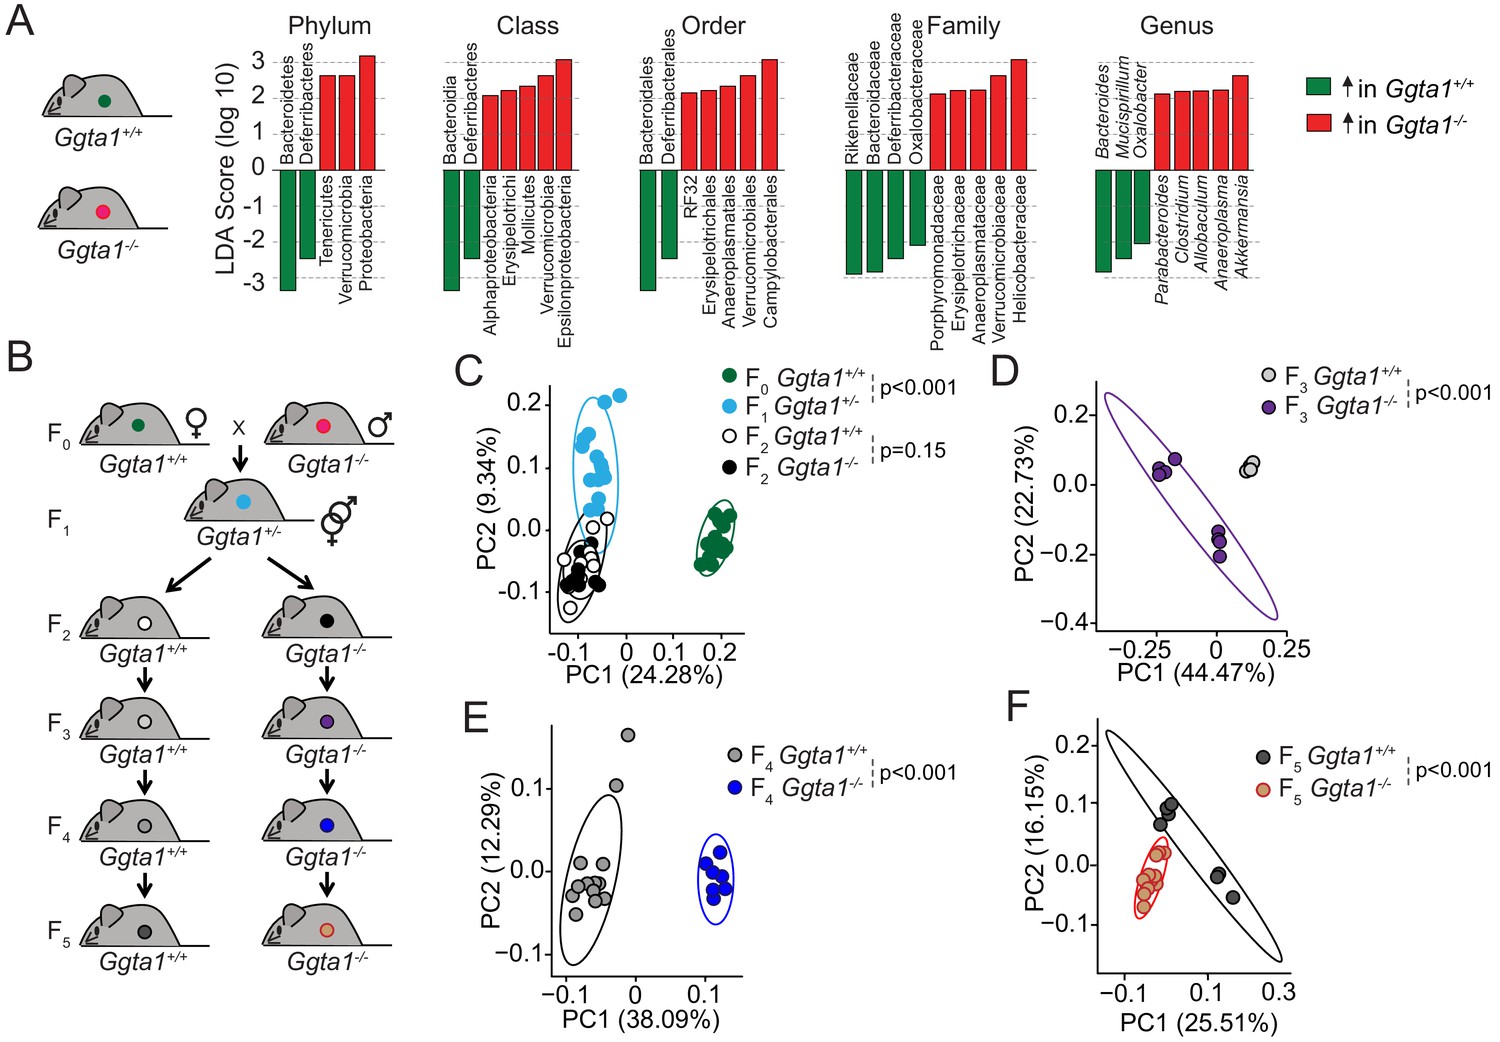
Ggta1 deletion alters the gut microbiota.
(A) Linear discriminant analysis (LDA) scores generated from LEfSe analysis, representing taxa enriched in the fecal microbiota of Ggta1+/+ (green) (n = 15) and Ggta1-/- (red) (n = 14) mice. (B) Breeding strategy where F0 Ggta1-/- males were crossed with Ggta1+/+ females to generate F1 Ggta1+/- mice, which were bred to generate F2 Ggta1+/+ vs. Ggta1-/- littermates. These were subsequently bred to generate F3 to F5 Ggta1+/+ vs. Ggta1-/- mice. Microbiota Principal Coordinate Analysis of Unweighted Unifrac distance in fecal samples from (C) F0 Ggta1+/+ (n = 15), F1 Ggta1+/- (n = 15), F2 Ggta1+/+ (n = 11) and F2 Ggta1-/- (n = 10) mice, (D) F3 Ggta1+/+ (n = 9) and Ggta1-/- (n = 8) mice, (E) F4 Ggta1+/+ (n = 13) and Ggta1-/- (n = 7) mice and (F) F5 Ggta1+/+ (n = 7) and Ggta1-/- (n = 12) mice generated as in (B). Data from one experiment with two to three independent breedings/cages per genotype. Symbols (C–F) are individual mice. p Values (C–F) calculated using PERMANOVA test.
Figure 1—figure supplement 1

Analyses of gut microbiota composition of Ggta1+/+ and Ggta1-/- mice.
Relative abundance of bacteria at all levels of taxonomy, present at >2% frequency, in the same mice as in Figure 1A. Symbols represent individual mice. Red bars correspond to mean values. Error bars correspond to SD. Adjusted p values calculated using Benjamini-Hochberg correction. *p<0.05, **p<0.01, ***p<0.005, ****p<0.001.
Figure 1—figure supplement 2
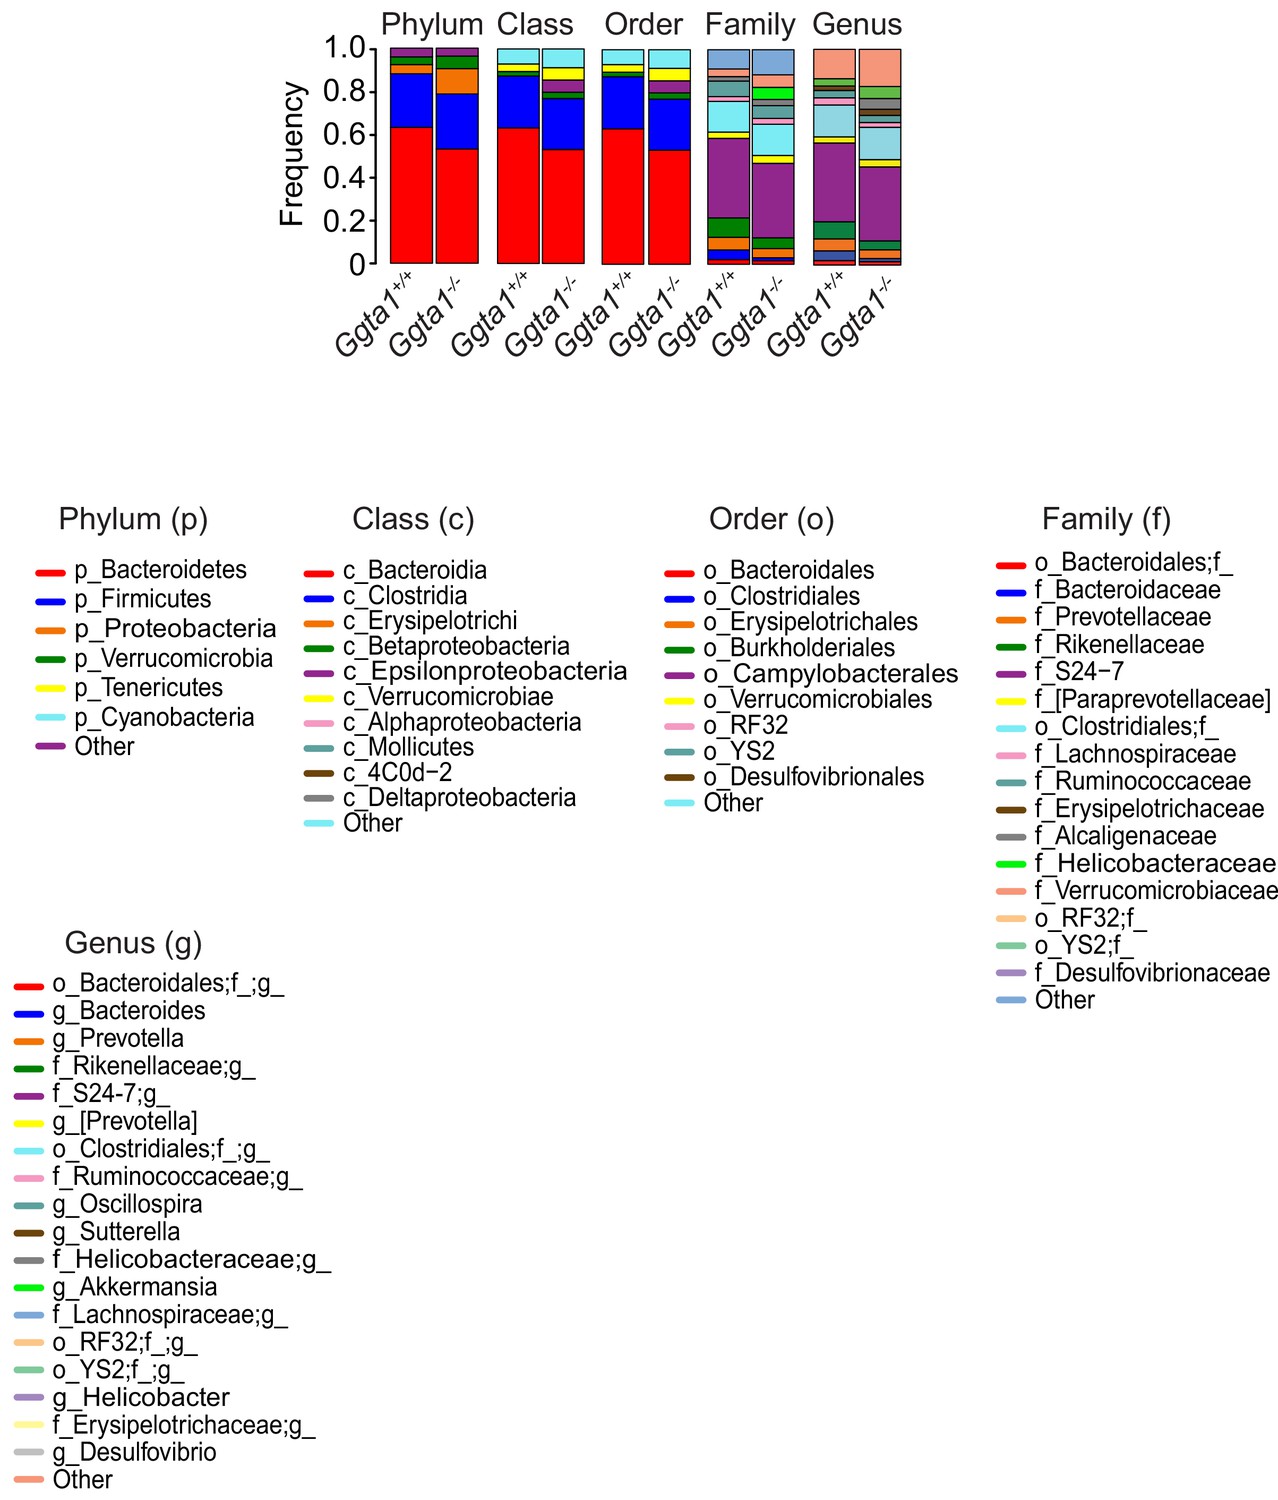
Analyses of gut microbiota composition of Ggta1+/+ vs. Ggta1-/- mice.
Relative abundance of bacteria at all levels of taxonomy, present at >2% frequency in the same mice as in Figure 1A. Stacked bars represent the mean of the bacterial taxa. Colors represent the relative fraction of each taxon. Data from one experiment.
Figure 1—figure supplement 3
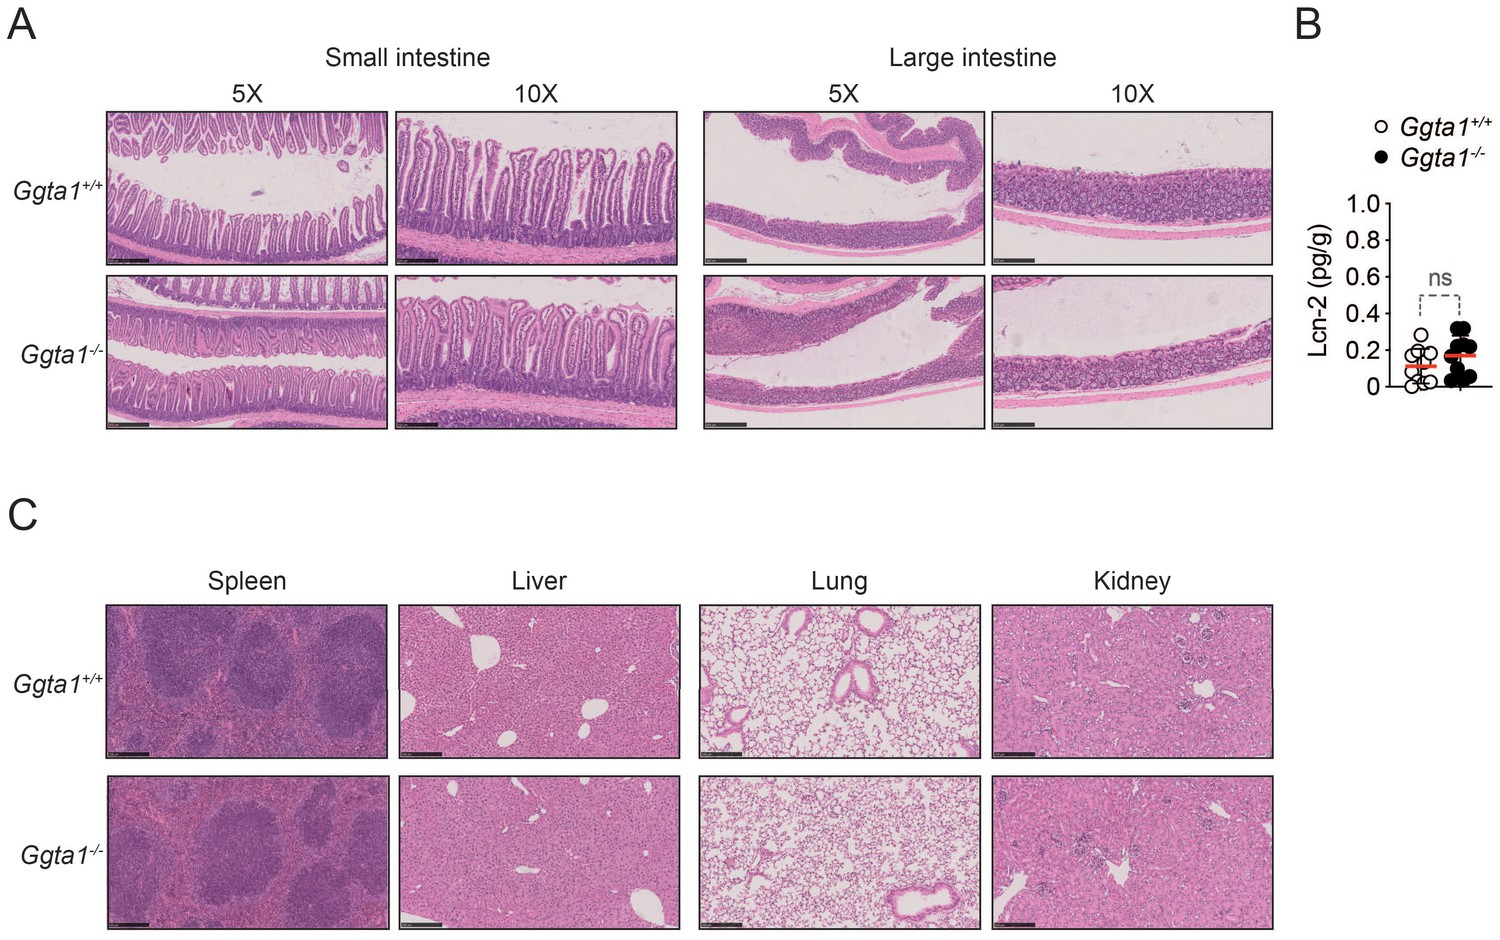
Ggta1 deletion does not cause inflammation at steady state.
(A) Representative H/E sections of the small intestine, large intestine, liver, spleen, lung and kidney of Ggta1+/+ (n = 5) and Ggta1-/- (n = 5) mice at steady state. (B) Fecal Lcn-2 concentrations in Ggta1+/+ (n = 10) and Ggta1-/- (n = 10) mice at steady state. Symbols represent individual mice. Red bars correspond to mean values. Error bars correspond to SD, ns: not significant.
Figure 1—figure supplement 4

Ggta1 deletion shapes the gut microbiota composition.
Relative abundance of bacteria at all levels of taxonomy, present at >2% frequency in the same mice as in Figure 1C–F. Stacked bars represent the mean of the bacterial taxa. Colors represent the relative fraction of each taxon. Data from one experiment.
Figure 2 with 2 supplements

Ggta1 deletion enhances IgA responses to the gut microbiota.
(A) Relative binding of IgA in the serum of Ggta1+/+ (n = 10) and GF Ggta1+/+ (n = 5) mice to fecal extract from Ggta1+/+ mice, and Ggta1-/- (n = 6) and GF Ggta1-/- (n = 6) mice to fecal extract from Ggta1-/- mice; one experiment. (B) Relative binding of IgA in the serum of GF Ggta1+/+ (n = 7) and GF Ggta1-/- (n = 10) mice to cecal extract from Ggta1-/- mice at indicated time-points after colonization with cecal extract from Ggta1-/- mice; two experiments. (C) Median Fluorescence Intensity (MFI) of αGal+ bacterial strains stained with BSI-B4 lectin relative to unstained control; seven experiments. (D) Representative flow cytometry plots showing bacteria stained for IgA and αGal in the small intestinal content of Ggta1+/+ (n = 5) and Ggta1-/- (n = 11) mice; four independent experiments. (E) Quantification of αGal+, IgA+, and IgA+αGal+ bacteria in the same samples as in (D). (F) Concentration of anti-αGal IgM in serum of Ggta1+/+ (n = 2), Ggta1-/- (n = 12), Igha-/-Ggta1+/+ (n = 10), and Igha-/-Ggta1-/- (n = 12) mice before and after streptomycin treatment, two experiments. (G) Concentration of anti-αGal IgG, in the same mice as (F). Symbols (A, B, E, F, G) are individual mice. Red bars (A, B, E, F, G) correspond to mean values. Error bars (A, B, C, E, F, G) correspond to SD. p Values in (A, B, F, G) calculated using Kruskal-Wallis test using Dunn’s multiple comparisons test and in (E) using Mann-Whitney test. *p<0.05, **p<0.01, ***p<0.001, ****p<0.0001, ns: not significant.
Figure 2—figure supplement 1
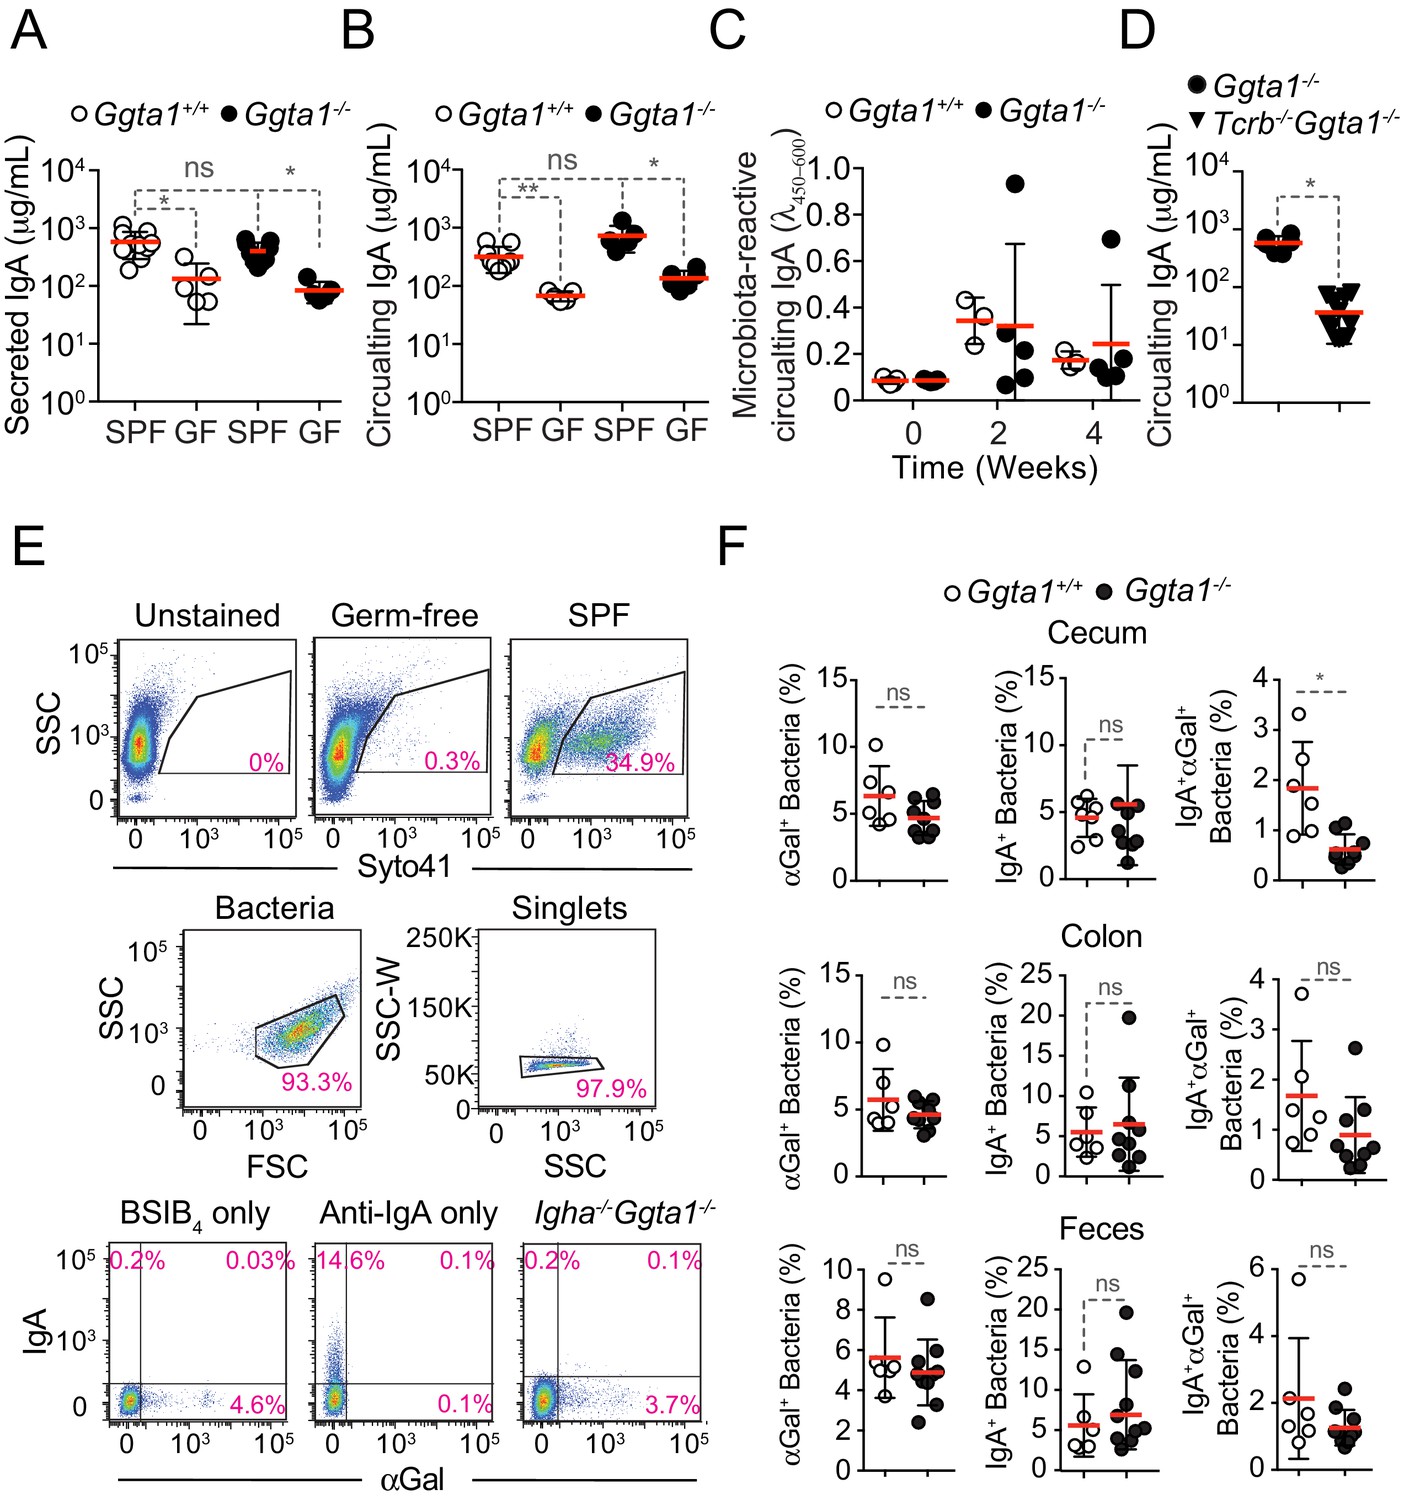
Ggta1 deletion enhances IgA responses to the gut microbiota.
(A) Concentration of total IgA in serum of Ggta1+/+ (n = 9), GF Ggta1+/+ (n = 5), Ggta1-/- (n = 5) and GF Ggta1-/- (n = 6) mice. (B) Concentration of total IgA in the small intestinal content of Ggta1+/+ (n = 10), GF Ggta1+/+ (n = 5), Ggta1-/- (n = 10) and GF Ggta1-/- (n = 5) mice. (C) Relative binding of IgA in the serum of GF Ggta1+/+ (n = 5) and GF Ggta1-/- (n = 5) mice to fecal extract from Ggta1+/+ mice at indicated time-points after colonization with cecal extract from Ggta1+/+ mice; two experiments. (D) Concentration of total IgA in serum of Ggta1-/- (n = 7), Tcrb-/-Ggta1-/- (n = 12) mice. (E) Representative plots showing the gating strategy for staining of intestinal content with Syto41, BSI-B4, and Anti-IgA. (F) Quantification of αGal+, IgA+, and IgA+αGal+ bacteria in the cecum, colon, and feces of the same mice as in Figure 2D–E. Symbols (A, B, C, D, F) are individual mice. Red bars (A, B, C, D, F) correspond to mean values. Error bars (A, B, C, D, F) correspond to SD. P values in (A, B, C) calculated using Kruskal-Wallis test using Dunn’s multiple comparisons test and in (D, F) using Mann-Whitney test. *p<0.05, **p<0.01, ns: not significant.
Figure 2—figure supplement 2
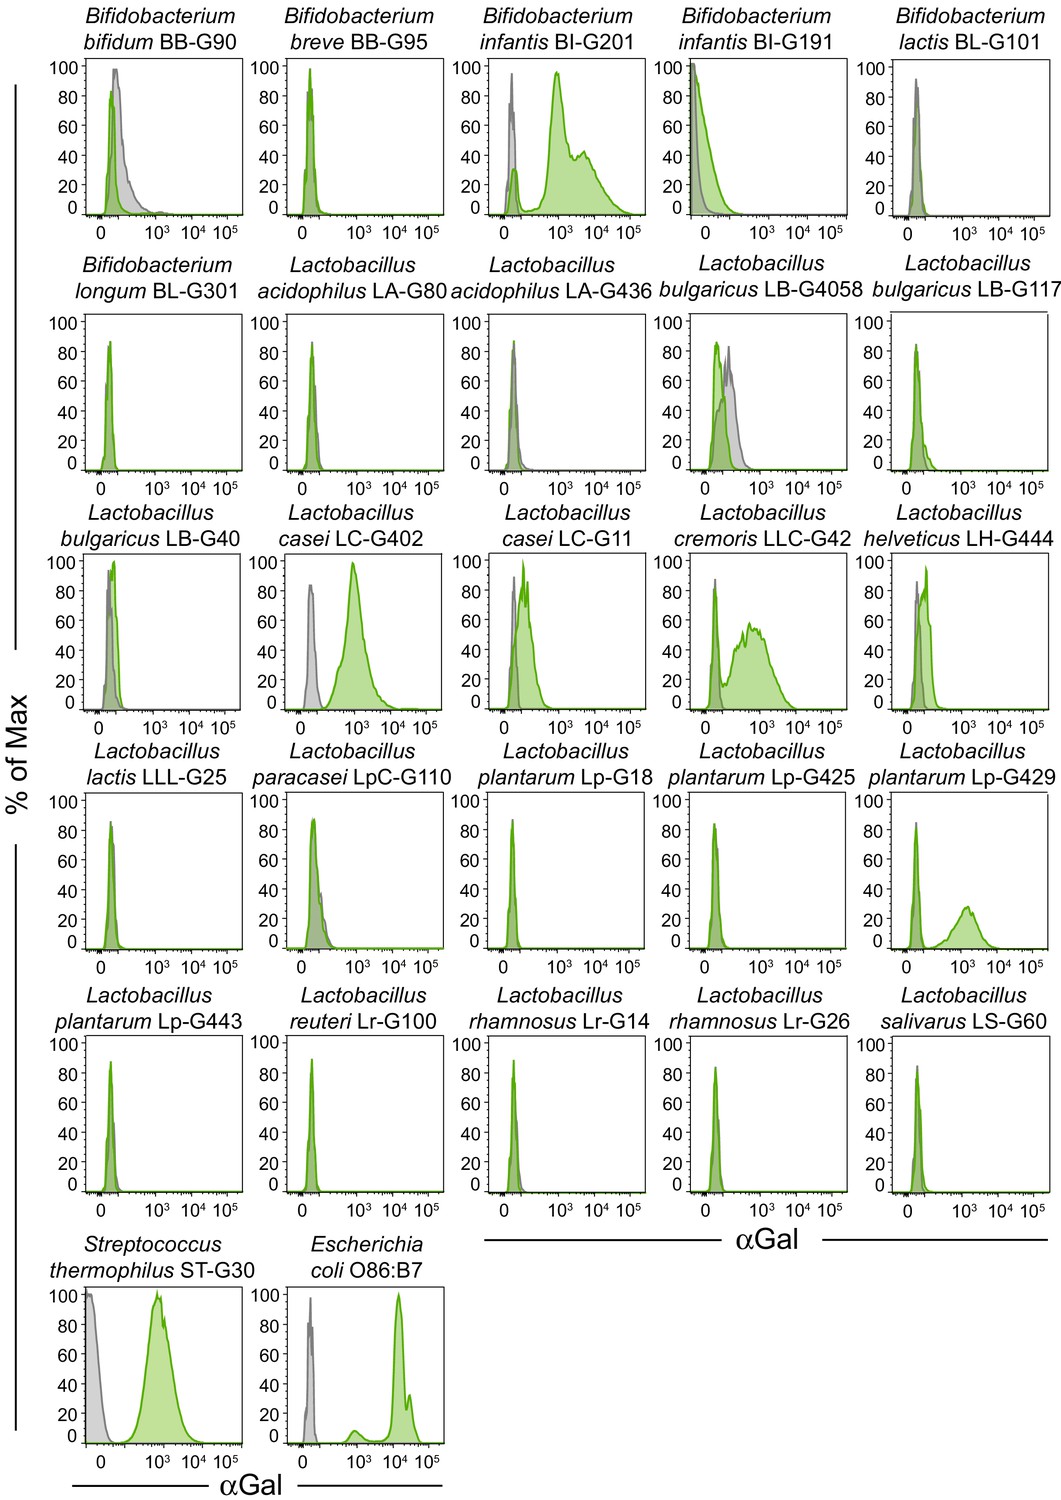
αGal expression by probiotic bacteria.
Representative flow cytometry plots of the data in Figure 2C showing probiotic bacterial strains unstained or stained with BSI-B4 lectin.
Figure 3 with 1 supplement
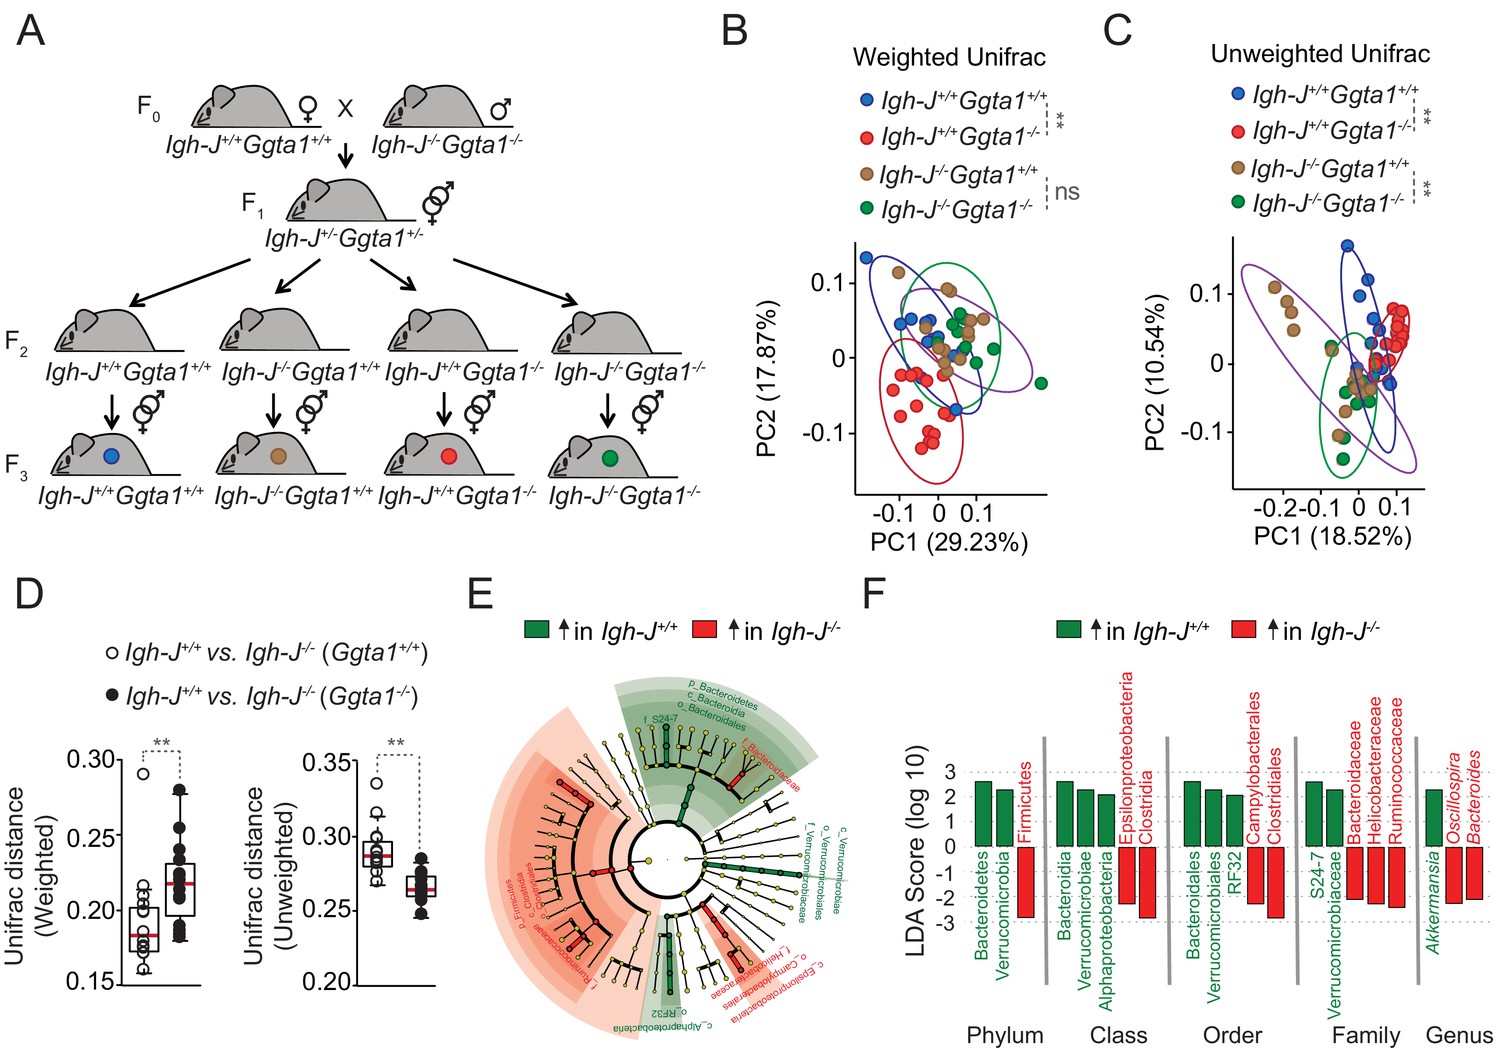
Ggta1 deletion shapes the gut microbiota via an Ig-dependent mechanism.
(A) Breeding strategy where F0 Igh-J-/-Ggta1-/- males were crossed with Igh-J+/+Ggta1+/+ females to generate F1 Igh-J+/-Ggta1+/-mice, which were bred to generate F2 and F3 Igh-J+/+Ggta1+/+, Igh-J-/-Ggta1+/+, Igh-J+/+Ggta1-/-, and Igh-J-/-Ggta1-/- mice. Microbiota Principal Coordinate Analysis of (B) Weighted and (C) Unweighted Unifrac and (D) Distance of Weighted and Unweighted Unifrac of 16S rRNA amplicons, in fecal samples from F3 Igh-J+/+Ggta1+/+ (n = 13) vs. Igh-J-/-Ggta1+/+ (n = 16) mice and F3 Igh-J+/+Ggta1-/- (n = 13) vs. Igh-J-/-Ggta1-/- (n = 11) mice generated as in (A). (E) Cladogram and (F) Linear discriminant analysis (LDA) scores generated from LEfSe analysis, representing taxa enriched in the fecal microbiota of the same mice as in (B–D). Data from one experiment with two to three independent breedings/cages per genotype. Symbols (B, C, D) are individual mice. Red bars (D) correspond to mean values. Error bars (D) correspond to SD. p Values in (B, C) calculated using PERMANOVA and in (D) using Mann-Whitney test. **p<0.01, ns: not significant.
Figure 3—figure supplement 1
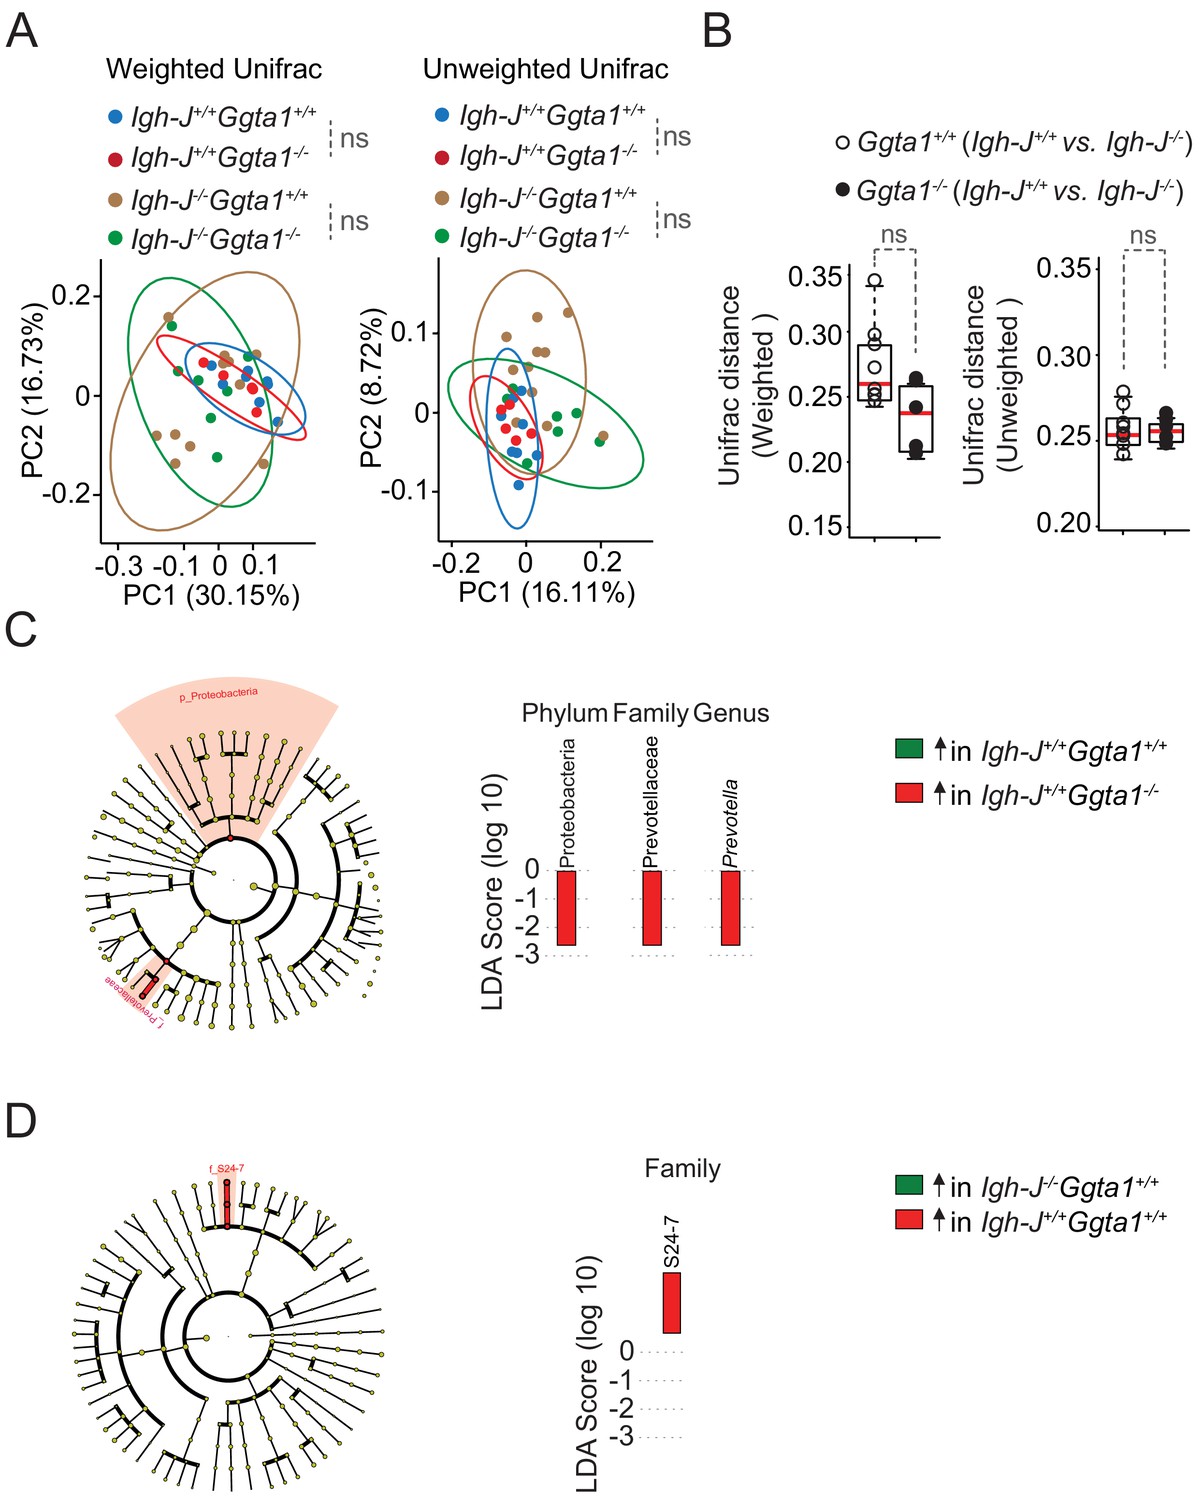
Ggta1 deletion shapes the gut microbiota via an Ig-dependent mechanism.
Microbiota Principal Coordinate Analysis of (A) Weighted and Unweighted Unifrac and (B) Distance of Weighted and Unweighted Unifrac of 16S rRNA amplicons, in fecal samples from F2 Igh-J+/+Ggta1+/+ (n = 8) vs. Igh-J-/-Ggta1+/+ (n = 11) mice and F2 Igh-J+/+Ggta1-/- (n = 5) vs. Igh-J-/-Ggta1-/- (n = 8) mice generated as described in Figure 3A. (C–D) Cladogram and linear discriminant analysis (LDA) scores generated from LEfSe analysis, representing taxa enriched in the fecal microbiota of the same (C) F3 Igh-J+/+Ggta1+/+ vs. Igh-J+/+Ggta1-/- mice and (D) F3 Igh-J-/-Ggta1+/+ vs. Igh-J+/+Ggta1+/+ mice as in Figure 3B–D. Symbols (A, B) are individual mice. Red bars (B) correspond to mean values. Error bars (B) correspond to SD. p Values in (A) calculated using PERMANOVA and in (B) using Mann-Whitney test. ns: not significant.
Figure 4 with 1 supplement
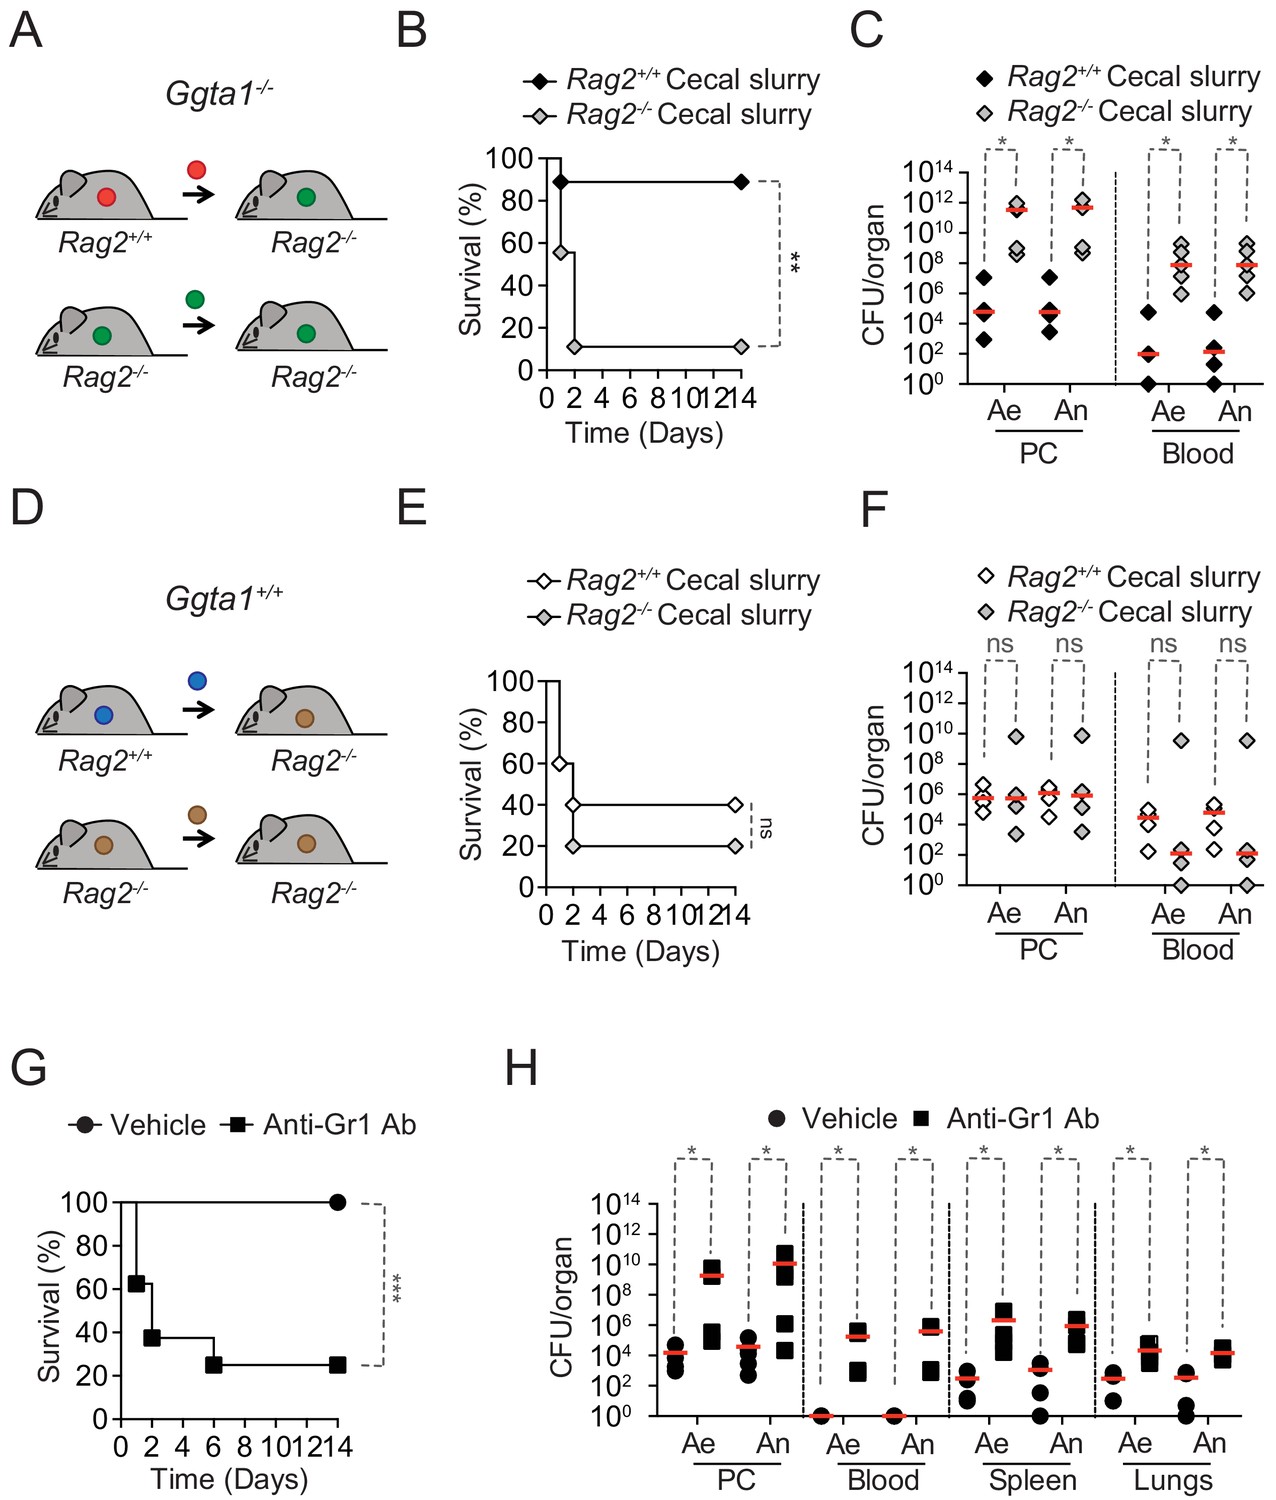
Ggta1 deletion reduces microbiota pathogenicity.
(A) Schematic showing infection of Rag2-/-Ggta1-/- mice with a cecal inoculum from either Ggta1-/- or Rag2-/-Ggta1-/- mice. (B) Survival of Rag2-/-Ggta1-/- (n = 9) mice after infection with a cecal inoculum from Ggta1-/- mice, and from Rag2-/-Ggta1-/- (n = 9) mice after infection with a cecal inoculum from Rag2-/-Ggta1-/- mice; two experiments. (C) Colony-forming units (CFU) of aerobic (Ae) and anaerobic (An) bacteria in Rag2-/-Ggta1-/- mice (n = 5 per group), 24 hr after infection as in (B); two experiments. (D) Schematic showing infection of Rag2-/-Ggta1+/+ mice with a cecal inoculum from either Ggta1+/+ or Rag2-/-Ggta1+/+ mice. (E) Survival of Rag2-/-Ggta1+/+ (n = 5) mice after infection with a cecal inoculum from Ggta1+/+ mice, and Rag2-/- Ggta1+/+ (n = 5) mice after infection with a cecal inoculum from Rag2-/-Ggta1+/+ mice; one experiment. (F) CFU of Ae and An bacteria in Rag2-/-Ggta1-/- mice (n = 4 per group), 24 hr after infection as in (E); one experiment. (G) Survival of Ggta1-/- mice receiving vehicle (PBS) (n = 9) or Anti-Gr1 Ab (n = 8), 24 hr before infection with cecal inoculum from Ggta1-/- mice; two experiments. (H) CFU of Ae and An bacteria in Ggta1-/- mice receiving vehicle (PBS) (n = 4–5) or Anti-Gr1 Ab (n = 4–5), 24 hr after infection as in (G); five experiments. Symbols (C, F, H) represent individual mice. Red lines (C, F, H) correspond to median values. p Values in (B, E, G) calculated with log-rank test and in (C, F, H) with Mann-Whitney test. Peritoneal cavity (PC). *p<0.05, **p<0.01, ***p<0.001, ns: not significant.
Figure 4—figure supplement 1

Ggta1 deletion reduces microbiota pathogenicity.
(A) Schematic showing infection of Ggta1-/- mice with a cecal inoculum from either Ggta1-/- mice or Rag2-/-Ggta1-/- mice. (B) Survival of Ggta1-/- (n = 14) mice after infection with a cecal inoculum from Ggta1-/- mice and of Ggta1-/- (n = 13) mice after infection with a cecal inoculum from Rag2-/-Ggta1-/- mice; two experiments. (C) Survival of Igh-J+/+Ggta1-/- (n = 9) and Igh-J-/-Ggta1-/- (n = 8) mice after infection with a cecal inoculum from Ggta1-/- mice; two experiments. (D) Survival of Tcrb+/+Ggta1-/- (n = 8) and Tcrb-/-Ggta1-/- (n = 12) mice infected as in (C); two experiments. (E) Survival of Rag2+/+Ggta1-/- (n = 9) and Rag2-/-Ggta1-/- (n = 23) mice infected as in (C); five experiments. (F) Representative plots showing depletion of CD11b+Ly6G+ cells in the blood 24 hr after Anti-Gr1 Ab injection (i.p.) in the same mice as in Figure 4G. (G) Representative plots showing depletion of CD11b+F4/80+ and CD11b+Ly6C+ cells in the peritoneal lavage 72 hr after injection (i.p.) with Clodronate liposomes. (H) Survival of Ggta1-/- mice receiving PBS liposomes (n = 7) or Clodronate liposomes (n = 8), 72 hr before infection (i.p.) with cecal inoculum from Ggta1-/- mice; two experiments. p Values in (B, C, D, E, H) calculated with log-rank test. Peritoneal cavity (PC). ns: not significant.
Tables
Appendix 1—key resources table
| Reagent type (species) or resource | Designation | Source or reference | Identifiers | Additional information |
|---|---|---|---|---|
| Strain, strain background (Mus musculus) | B6.C57BL/6/J: Ggta1+/+ | Obtained originally from Jackson Laboratory and maintained at IGC | N/A | |
| Strain, strain background (Mus musculus) | B6. Ggta1-/- | Obtained originally from Tearle et al., 1996 and maintained at IGC | N/A | |
| Strain, strain background (Mus musculus) | B6. Igha-/-Ggta1-/- | Singh et al., 2021 | N/A | |
| Strain, strain background (Mus musculus) | B6. Igh-J-/-Ggta1-/- | Yilmaz et al., 2014 | N/A | |
| Strain, strain background (Mus musculus) | B6. Rag2-/-Ggta1-/- | Singh et al., 2021 | N/A | |
| Strain, strain background (Mus musculus) | B6. Tcrb-/-Ggta1-/- | Yilmaz et al., 2014 | N/A | |
| Strain, strain background (Bifidobacterium bifidum) | Bifidobacterium bifidum BB-G90 | BioGrowing Probiotics | N/A | See Materials and methods, Section Detection of αGal expression by probiotic bacteria |
| Strain, strain background (Bifidobacterium breve) | Bifidobacterium breve BB-G95 | BioGrowing Probiotics | N/A | See Materials and methods, Section Detection of αGal expression by probiotic bacteria |
| Strain, strain background (Bifidobacterium infantis) | Bifidobacterium infantis BI-G191 | BioGrowing Probiotics | N/A | See Materials and methods, Section Detection of αGal expression by probiotic bacteria |
| Strain, strain background (Bifidobacterium infantis) | Bifidobacterium infantis BI-G201 | BioGrowing Probiotics | N/A | See Materials and methods, Section Detection of αGal expression by probiotic bacteria |
| Strain, strain background (Bifidobacterium lactis) | Bifidobacterium lactis BL-G101 | BioGrowing Probiotics | N/A | See Materials and methods, Section Detection of αGal expression by probiotic bacteria |
| Strain, strain background (Bifidobacterium longum) | Bifidobacterium longum BL-G301 | BioGrowing Probiotics | N/A | See Materials and methods, Section Detection of αGal expression by probiotic bacteria |
| Strain, strain background (Escherichia coli) | Escherichia coli K12 | ATCC | ATCC10798 | See Materials and methods, Section Detection of αGal expression by probiotic bacteria |
| Strain, strain background (Escherichia coli) | Escherichia coli O86:B7 | ATCC | ATCC12701 | See Materials and methods, Section Detection of αGal expression by probiotic bacteria |
| Strain, strain background (Lactobacillus acidophilus) | Lactobacillus acidophilus LA-G80 | BioGrowing Probiotics | N/A | See Materials and methods, Section Detection of αGal expression by probiotic bacteria |
| Strain, strain background (Lactobacillus acidophilus) | Lactobacillus acidophilus LA-G436 | BioGrowing Probiotics | N/A | See Materials and methods, Section Detection of αGal expression by probiotic bacteria |
| Strain, strain background (Lactobacillus bulgaricus) | Lactobacillus bulgaricus LB-G4058 | BioGrowing Probiotics | N/A | See Materials and methods, Section Detection of αGal expression by probiotic bacteria |
| Strain, strain background (Lactobacillus bulgaricus) | Lactobacillus bulgaricus LB-G117 | BioGrowing Probiotics | N/A | See Materials and methods, Section Detection of αGal expression by probiotic bacteria |
| Strain, strain background (Lactobacillus bulgaricus) | Lactobacillus bulgaricus LB-G40 | BioGrowing Probiotics | N/A | See Materials and methods, Section Detection of αGal expression by probiotic bacteria |
| Strain, strain background (Lactobacillus casei) | Lactobacillus casei LC-G11 | BioGrowing Probiotics | N/A | See Materials and methods, Section Detection of αGal expression by probiotic bacteria |
| Strain, strain background (Lactobacillus cremoris) | Lactobacillus cremoris LLC-G42 | BioGrowing Probiotics | N/A | See Materials and methods, Section Detection of αGal expression by probiotic bacteria |
| Strain, strain background (Lactobacillus helveticus) | Lactobacillus helveticus LH-G444 | BioGrowing Probiotics | N/A | See Materials and methods, Section Detection of αGal expression by probiotic bacteria |
| Strain, strain background (Lactobacillus casei) | Lactobacillus casei LC-G402 | BioGrowing Probiotics | N/A | See Materials and methods, Section Detection of αGal expression by probiotic bacteria |
| Strain, strain background (Lactobacillus lactis) | Lactobacillus lactis LLL-G25 | BioGrowing Probiotics | N/A | See Materials and methods, Section Detection of αGal expression by probiotic bacteria |
| Strain, strain background (Lactobacillus plantarum) | Lactobacillus plantarum Lp-G18 | BioGrowing Probiotics | N/A | See Materials and methods, Section Detection of αGal expression by probiotic bacteria |
| Strain, strain background (Lactobacillus paracasei) | Lactobacillus paracasei LpC-G110 | BioGrowing Probiotics | N/A | See Materials and methods, Section Detection of αGal expression by probiotic bacteria |
| Strain, strain background (Lactobacillus plantarum) | Lactobacillus plantarum Lp-G425 | BioGrowing Probiotics | N/A | See Materials and methods, Section Detection of αGal expression by probiotic bacteria |
| Strain, strain background (Lactobacillus plantarum) | Lactobacillus plantarum Lp-G429 | BioGrowing Probiotics | N/A | See Materials and methods, Section Detection of αGal expression by probiotic bacteria |
| Strain, strain background (Lactobacillus plantarum) | Lactobacillus plantarum Lp-G443 | BioGrowing Probiotics | N/A | See Materials and methods, Section Detection of αGal expression by probiotic bacteria |
| Strain, strain background (Lactobacillus reuteri) | Lactobacillus reuteri Lr-G100 | BioGrowing Probiotics | N/A | See Materials and methods, Section Detection of αGal expression by probiotic bacteria |
| Strain, strain background (Lactobacillus rhamnosus) | Lactobacillus rhamnosus Lr-G14 | BioGrowing Probiotics | N/A | See Materials and methods, Section Detection of αGal expression by probiotic bacteria |
| Strain, strain background (Lactobacillus rhamnosus) | Lactobacillus rhamnosus Lr-G26 | BioGrowing Probiotics | N/A | See Materials and methods, Section Detection of αGal expression by probiotic bacteria |
| Strain, strain background (Lactobacillus salivarus) | Lactobacillus salivarus LS-G60 | BioGrowing Probiotics | N/A | See Materials and methods, Section Detection of αGal expression by probiotic bacteria |
| Strain, strain background (Streptococcus thermophilus) | Streptococcus thermophilus ST-G30 | BioGrowing Probiotics | N/A | See Materials and methods, Section Detection of αGal expression by probiotic bacteria |
| Antibody | Anti-Mouse Monoclonal Gr1 (Clone: RB6-8C5) | Bio-Rad | N/A | 300 µg in 200 µL PBS per mouse |
| Antibody | Anti-Mouse Monoclonal IgA (mA-6E1) | eBioscience, Thermo Fisher Scientific | Cat# 12-4204-82, RRID:AB_465917 | 1:100 (Flow cytometry) |
| Antibody | Goat Anti-Mouse Polyclonal IgA-HRP | Southern Biotech | Cat# 1040–05; RRID:AB_2714213 | 1:4000 (ELISA) |
| Antibody | Goat Anti-Mouse Polyclonal IgA-Unlabelled | Southern Biotech | Cat# 1040–01, RRID:AB_2314669 | 2 µg/mL (ELISA) |
| Antibody | Goat Anti-Mouse Polyclonal IgG, Human ads-HRP | Southern Biotech | Cat# 1030–05, RRID:AB_2619742 | 1:4000 (ELISA) |
| Antibody | Goat Anti-Mouse Polyclonal IgM, Human ads-HRP | Southern Biotech | Cat# 1020–05, RRID:AB_2794201 | 1:4000 (ELISA) |
| Antibody | Anti-α-gal Mouse Monoclonal IgG1 | Ding et al., 2008; Yilmaz et al., 2014 | N/A | Standard (ELISA). 0,5 μg/mL, 1:2 serial dilutions, 50 μL |
| Antibody | Anti-α-gal Mouse Monoclonal IgG2a | Yilmaz et al., 2014 | N/A | Standard (ELISA). 0,5 Originally o/mL, 1:3 serial dilutions, 50 μL |
| Antibody | Anti-α-gal Mouse Monoclonal IgG2b | Ding et al., 2008; Yilmaz et al., 2014 | N/A | Standard (ELISA). 0,5 μg/mL, 1:3 serial dilutions, 50 μL |
| Antibody | Anti-α-gal Mouse Monoclonal IgG3 | Ding et al., 2008; Yilmaz et al., 2014 | N/A | Standard (ELISA). 0,5 μg/mL, 1:2 serial dilution |
| Antibody | Anti-α-gal Mouse Monoclonal IgM | Yilmaz et al., 2014 | N/A | Standard (ELISA). 2 μg/mL, 1:2 serial dilutions, 50 μL |
| Antibody | Mouse IgA-Unlabelled | Southern Biotech | Cat# 0106–01, RRID:AB_2714214 | Standard 0.5 µg/mL(ELISA) |
| Commercial assay or kit | KAPA Mouse Genotyping Kit | KAPA Biosystems | Cat# KK7352 | |
| Commercial assay or kit | LEGEND MAX Mouse NGAL (Lipocalin-2) ELISA Kit | Biolegend | Cat# 443707 | |
| Commercial assay or kit | QIAamp Fast DNA Stool Mini Kit | Qiagen | Cat# 50951604 | |
| Chemical compound, drμg | Clodronate liposomes and control liposomes (PBS) | https://clodronateliposomes.com/ | SKU: CP-005–005 | 10 µL/g (in vivo depletion) |
| Chemical compound, drμg | Galα1-3Galβ1-4GlcNAc-BSA (14 atom spacer) | Dextra | Cat# NGP1334 | 5 µg/mL (ELISA) |
| Chemical compound, drμg | Lectin from Bandeiraea simplicifolia (Griffonia simplicifolia) Isolectin B4 (BSI-B4), FITC conjμgate, lyophilized powder | Sigma-Aldrich | #L2895-1MG | 40 µg/mL (Flow cytometry) |
| Chemical compound, drμg | SYTO41 Blue Fluorescent Nucleic Acid Stain | Thermofisher Scientific | Cat# S11352 | 1:200 (Flow cytometry) |
| Software, algorithm | Greengenes | DeSantis et al., 2006 | http://greengenes.secondgenome.com/v0.13.8 | |
| Software, algorithm | QIIME | Caporaso et al., 2010 | http://qiime.org/v0.1.9.1 |
Additional files
Download links
A two-part list of links to download the article, or parts of the article, in various formats.
Downloads (link to download the article as PDF)
Open citations (links to open the citations from this article in various online reference manager services)
Cite this article (links to download the citations from this article in formats compatible with various reference manager tools)
Glycan-based shaping of the microbiota during primate evolution
eLife 10:e67450.
https://doi.org/10.7554/eLife.67450


