Combination of inflammatory and vascular markers in the febrile phase of dengue is associated with more severe outcomes
- Oxford University Clinical Research Unit (OUCRU), Viet Nam
- University of Medicine and Pharmacy at Ho Chi Minh City, Viet Nam
- Department of Infectious Disease, Imperial College London, United Kingdom
- Hospital for Tropical Diseases, Viet Nam
- Angkor Hospital for Children, Cambodia
- University of Malaya Medical Centre, Malaysia
- Hospital Nacional de Niños Benjamin Bloom, El Salvador
- Centre for Tropical Medicine and Global health, Nuffield Department of Clinical Medicine, University of Oxford, United Kingdom
- Institute for Vector-Borne Disease, Monash University, Australia
- Section Clinical Tropical Medicine, Department for Infectious Diseases, Heidelberg University Hospital, Germany
- Heidelberg Institute of Global Health (HIGH), Heidelberg University Hospital, Germany
- Independent consultant, United States
- Consultant, Intellectual Ventures, Global Good Fund, United States
- UNICEF/UNDP/World Bank/WHO Special Programme for Research and Training in Tropical Diseases, World Health Organization, Switzerland
Figures
Figure 1
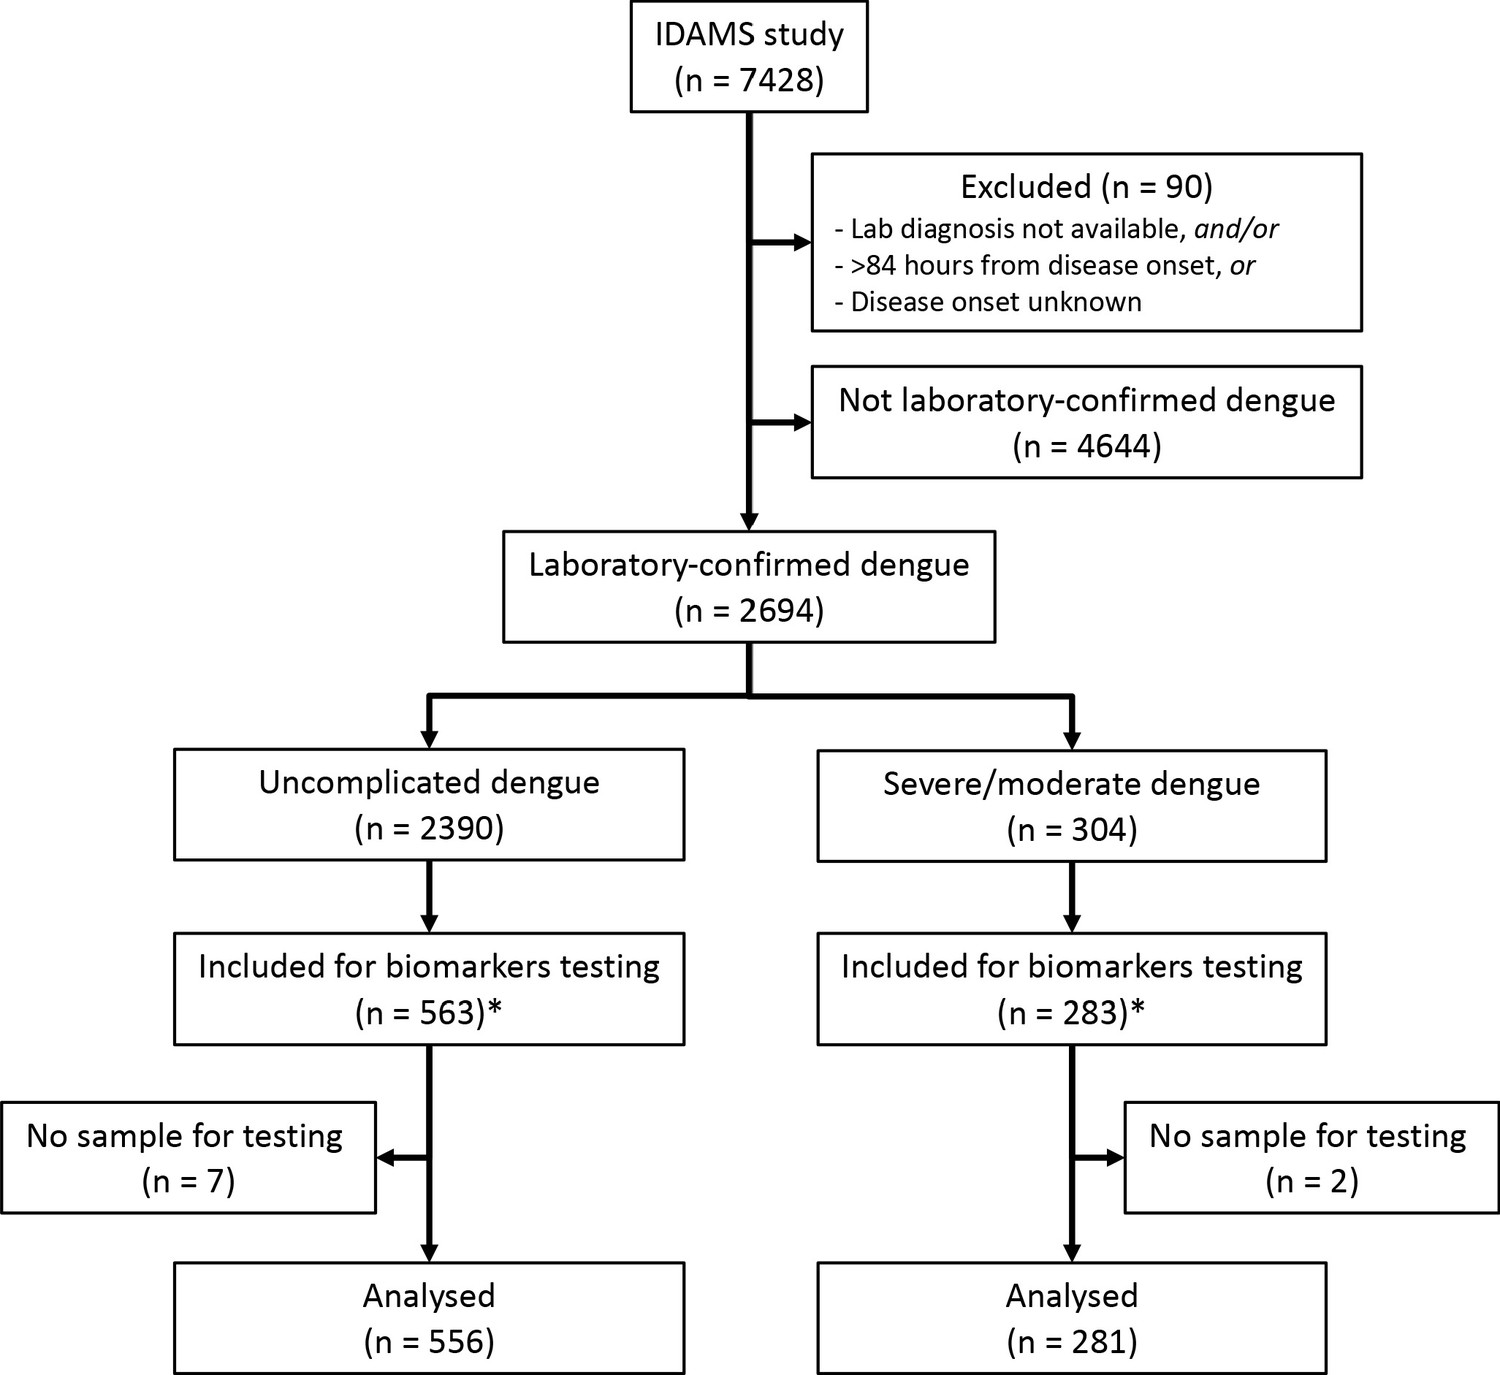
Study flowchart.
*The IDAMS study was performed in eight countries across Asia and Latin America. For this study, we selected cases in four countries (Vietnam, Cambodia, Malaysia, and El Salvador) as the blood samples were stored at the laboratory of the Oxford University Clinical Research Unit in Ho Chi Minh City, Vietnam.
Figure 2
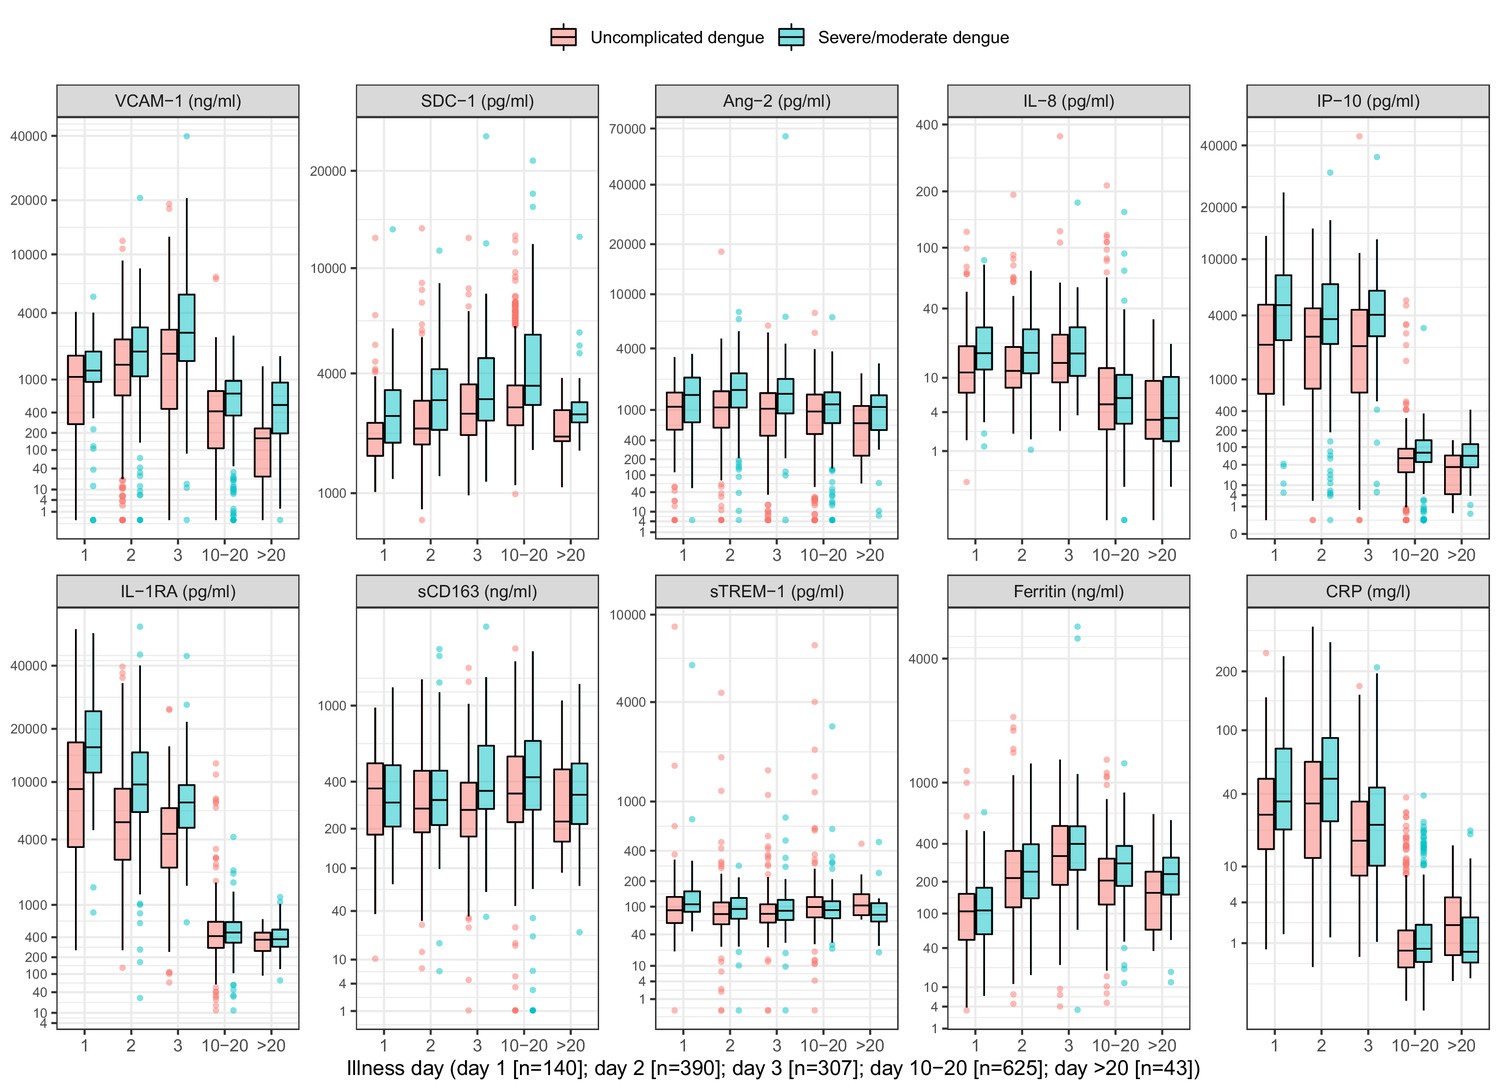
Biomarker levels by groups.
VCAM-1: vascular cell adhesion molecule-1; SDC-1: syndecan-1; Ang-2: angiopoietin-2; IL-8: interleukin-8; IP-10: interferon gamma-induced protein-10; IL-1RA: interleukin-1 receptor antagonist; sCD163: soluble cluster of differentiation 163; sTREM-1: soluble triggering receptor expressed on myeloid cells-1; CRP: C-reactive protein. Y-axes are transformed using the fourth root transformation.
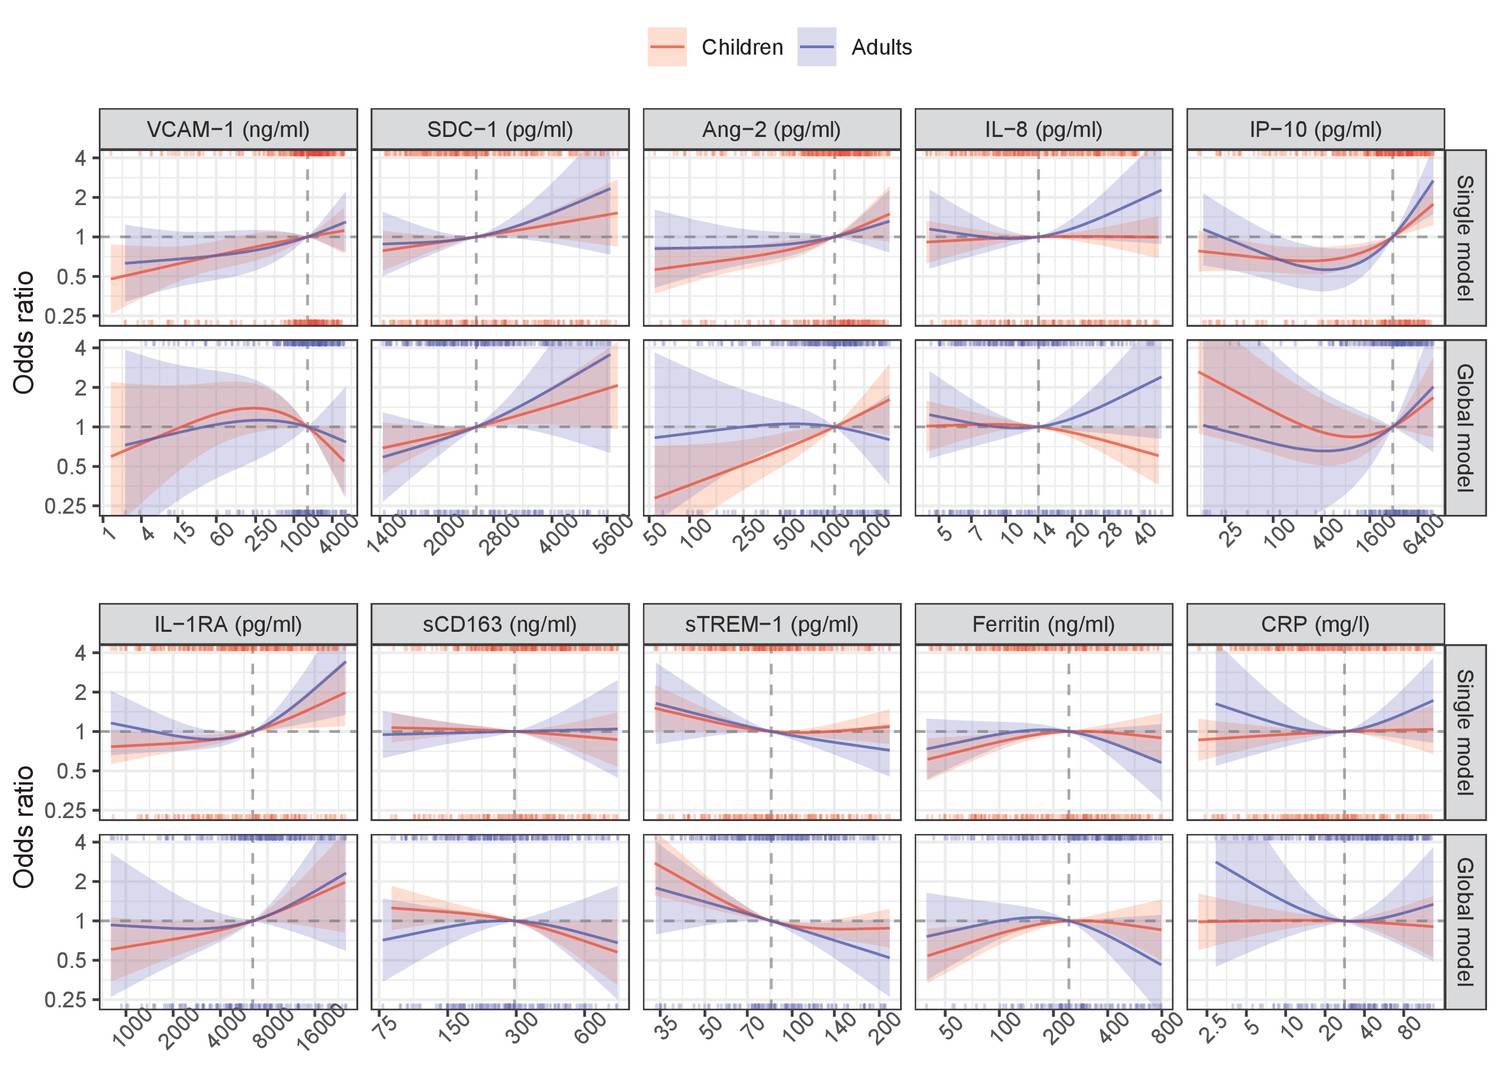
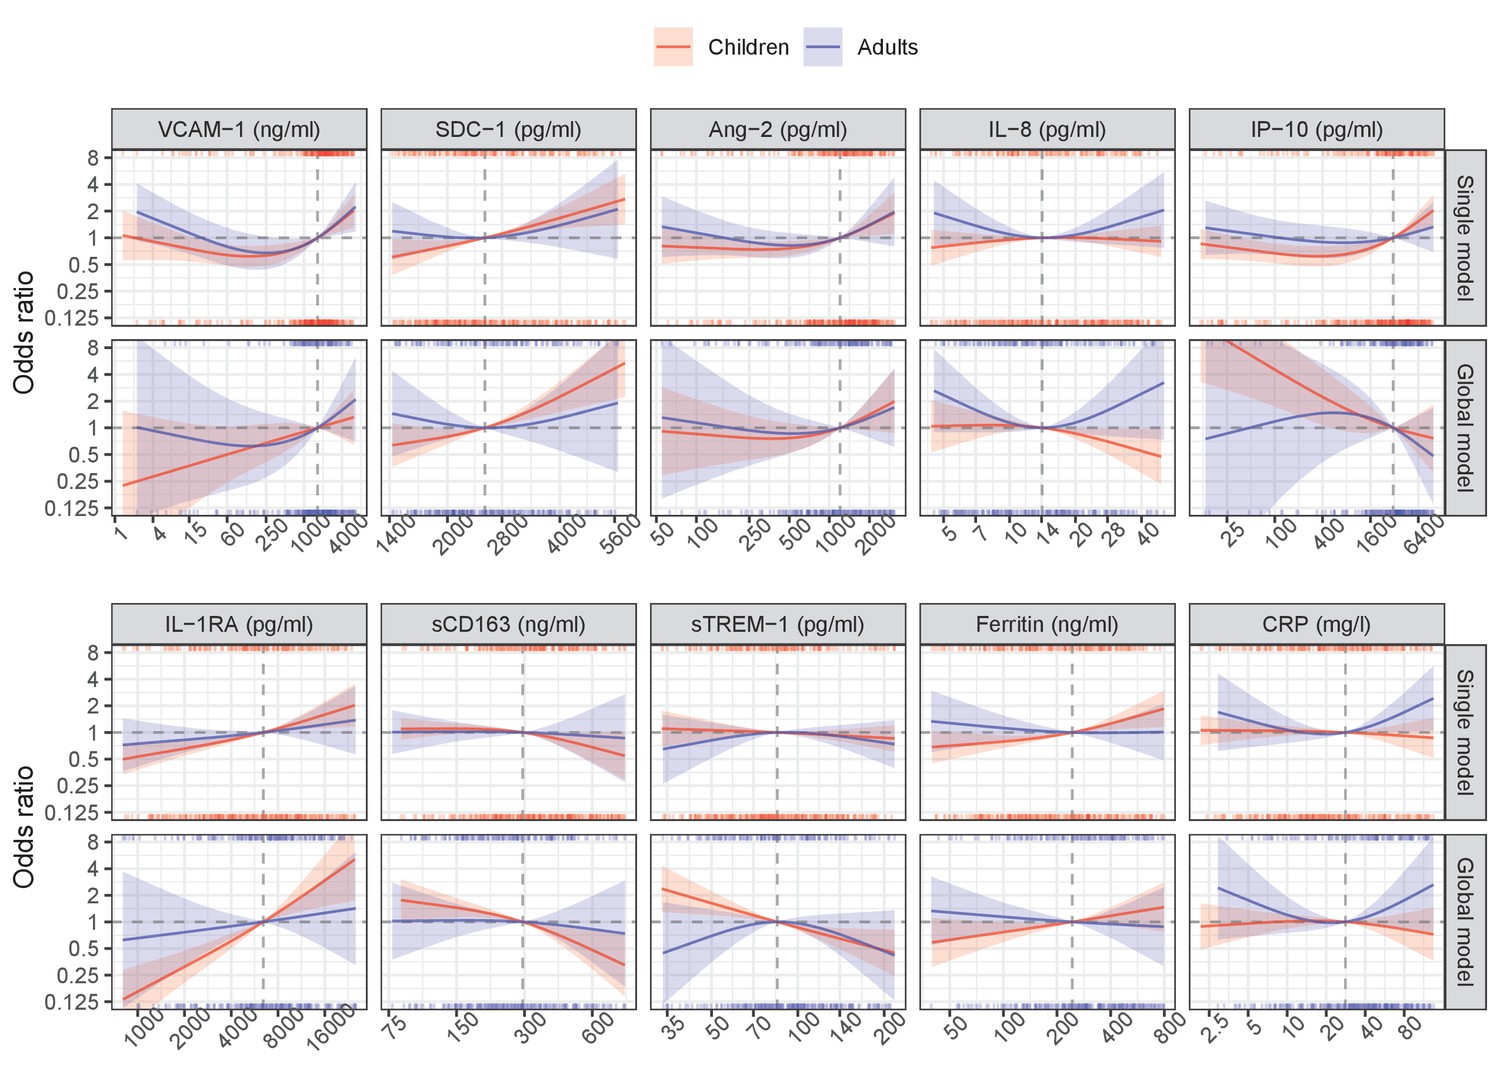
Figure 3
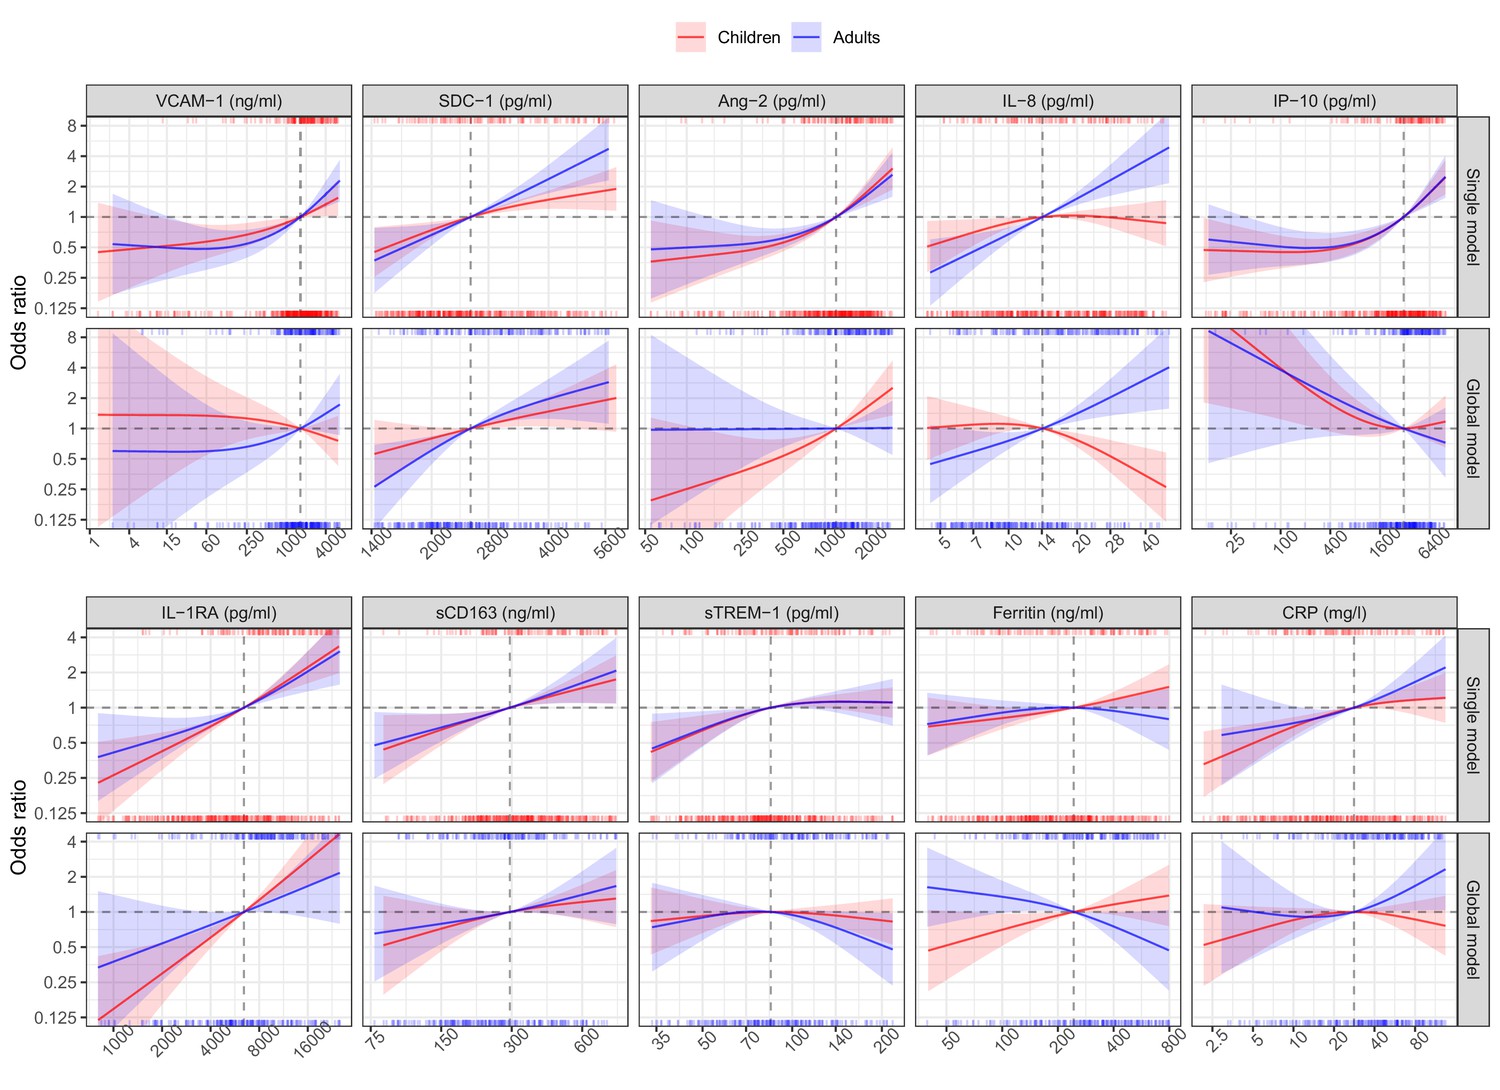
Results from models for the primary endpoint (severe or moderate dengue).
The odds ratio of severe/moderate dengue (the red and blue lines) and 95% confidence interval (the red and blue regions) are estimated from multivariable logistic regression models allowing for a non-linear relation of log-2 of the biomarker level with severe/moderate dengue using restricted cubic splines. Each single model contains the corresponding biomarker, age and their interaction, while the global model contains all biomarkers and their interaction with age. The reference values for the odds ratios (where the odds ratio is equal to 1) are represented by the vertical gray dashed lines. They are chosen as the median of the biomarker levels of the whole study population (VCAM-1: 1636 ng/ml; SDC-1: 2519 pg/ml; Ang-2: 1204 pg/ml; IL-8: 14 pg/ml; IP-10: 3093 pg/ml; IL-1RA: 6434 pg/ml; sCD163: 295 ng/ml; sTREM-1: 85 ng/ml; ferritin: 243 ng/ml; and CRP: 28 mg/l). The x-axis represents biomarker levels; it is transformed using log-2 and its range truncated by the 5th and 95th percentiles of the biomarker levels of the whole study population. The rug plot on the x-axis represents the distribution of individual cases; the bottom rug plot represents the uncomplicated dengue cases and the top rug plot represents the severe/moderate dengue cases (children [<15 years of age] are in red and adults [≥15 years of age] are in blue). The red line and region represent children; results are shown for children at age of 10 years. The blue line and region represents adults; results are shown for adults at age of 25 years. VCAM-1: vascular cell adhesion molecule-1; SDC-1: syndecan-1; Ang-2: angiopoietin-2; IL-8: interleukin-8; IP-10: interferon gamma-induced protein-10; IL-1RA: interleukin-1 receptor antagonist; sCD163: soluble cluster of differentiation 163; sTREM-1: soluble triggering receptor expressed on myeloid cells-1; CRP: C-reactive protein.
Appendix 4—figure 1
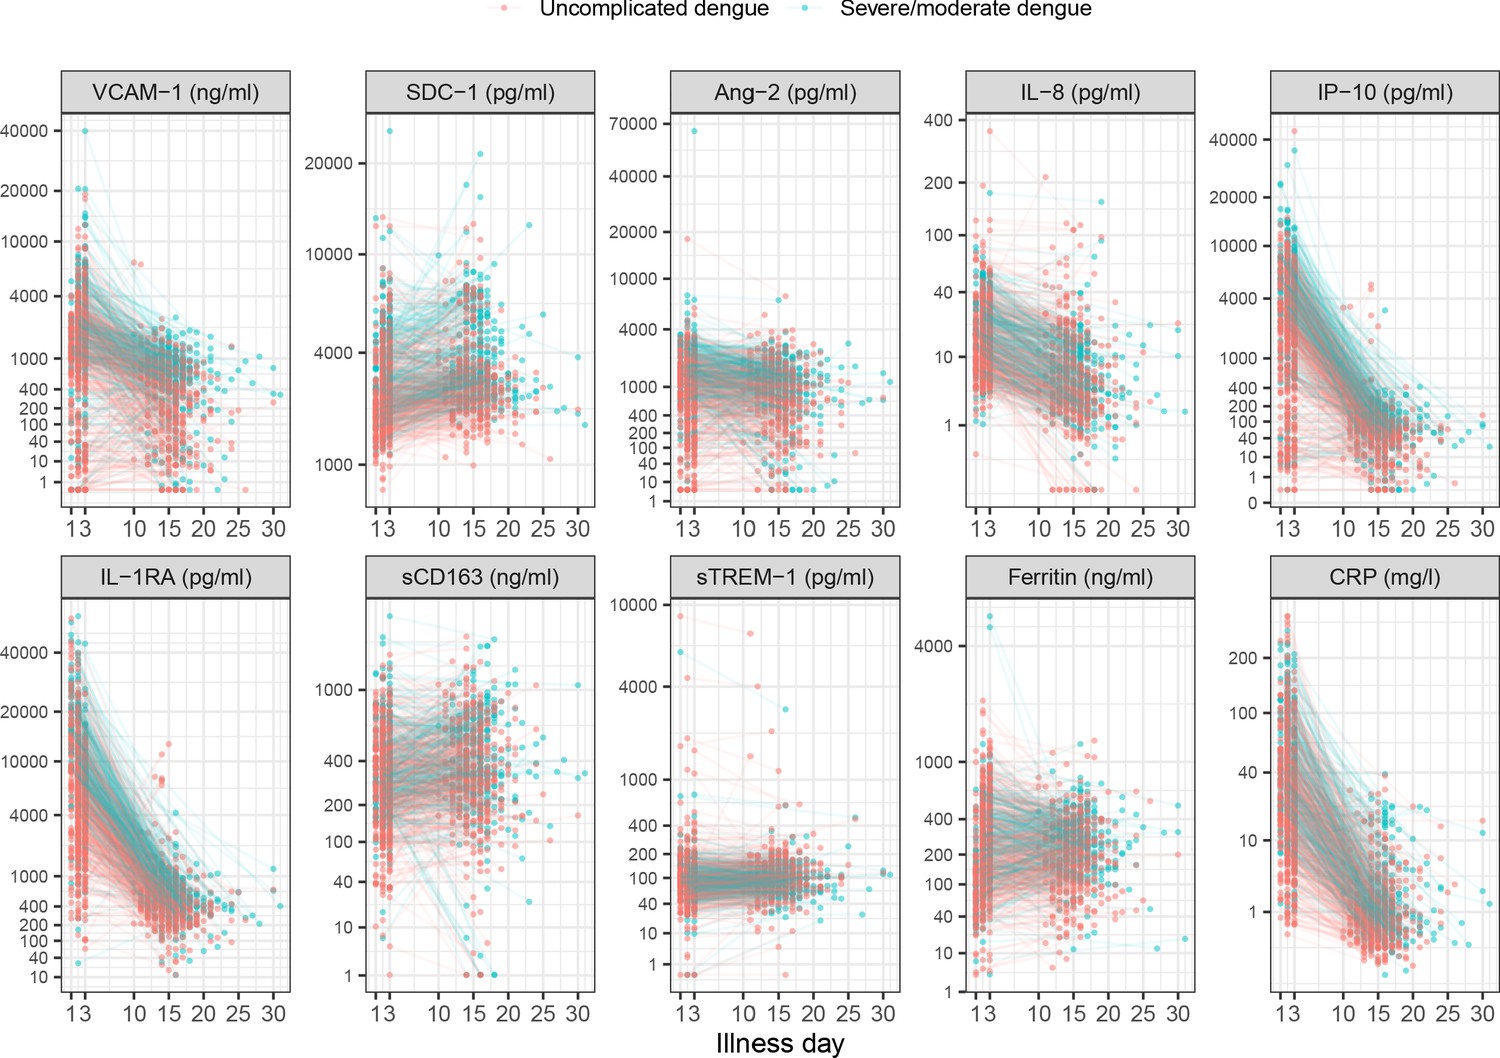
Biomarker levels by individual.
Y-axes are transformed using the fourth root transformation.
Appendix 4—figure 2
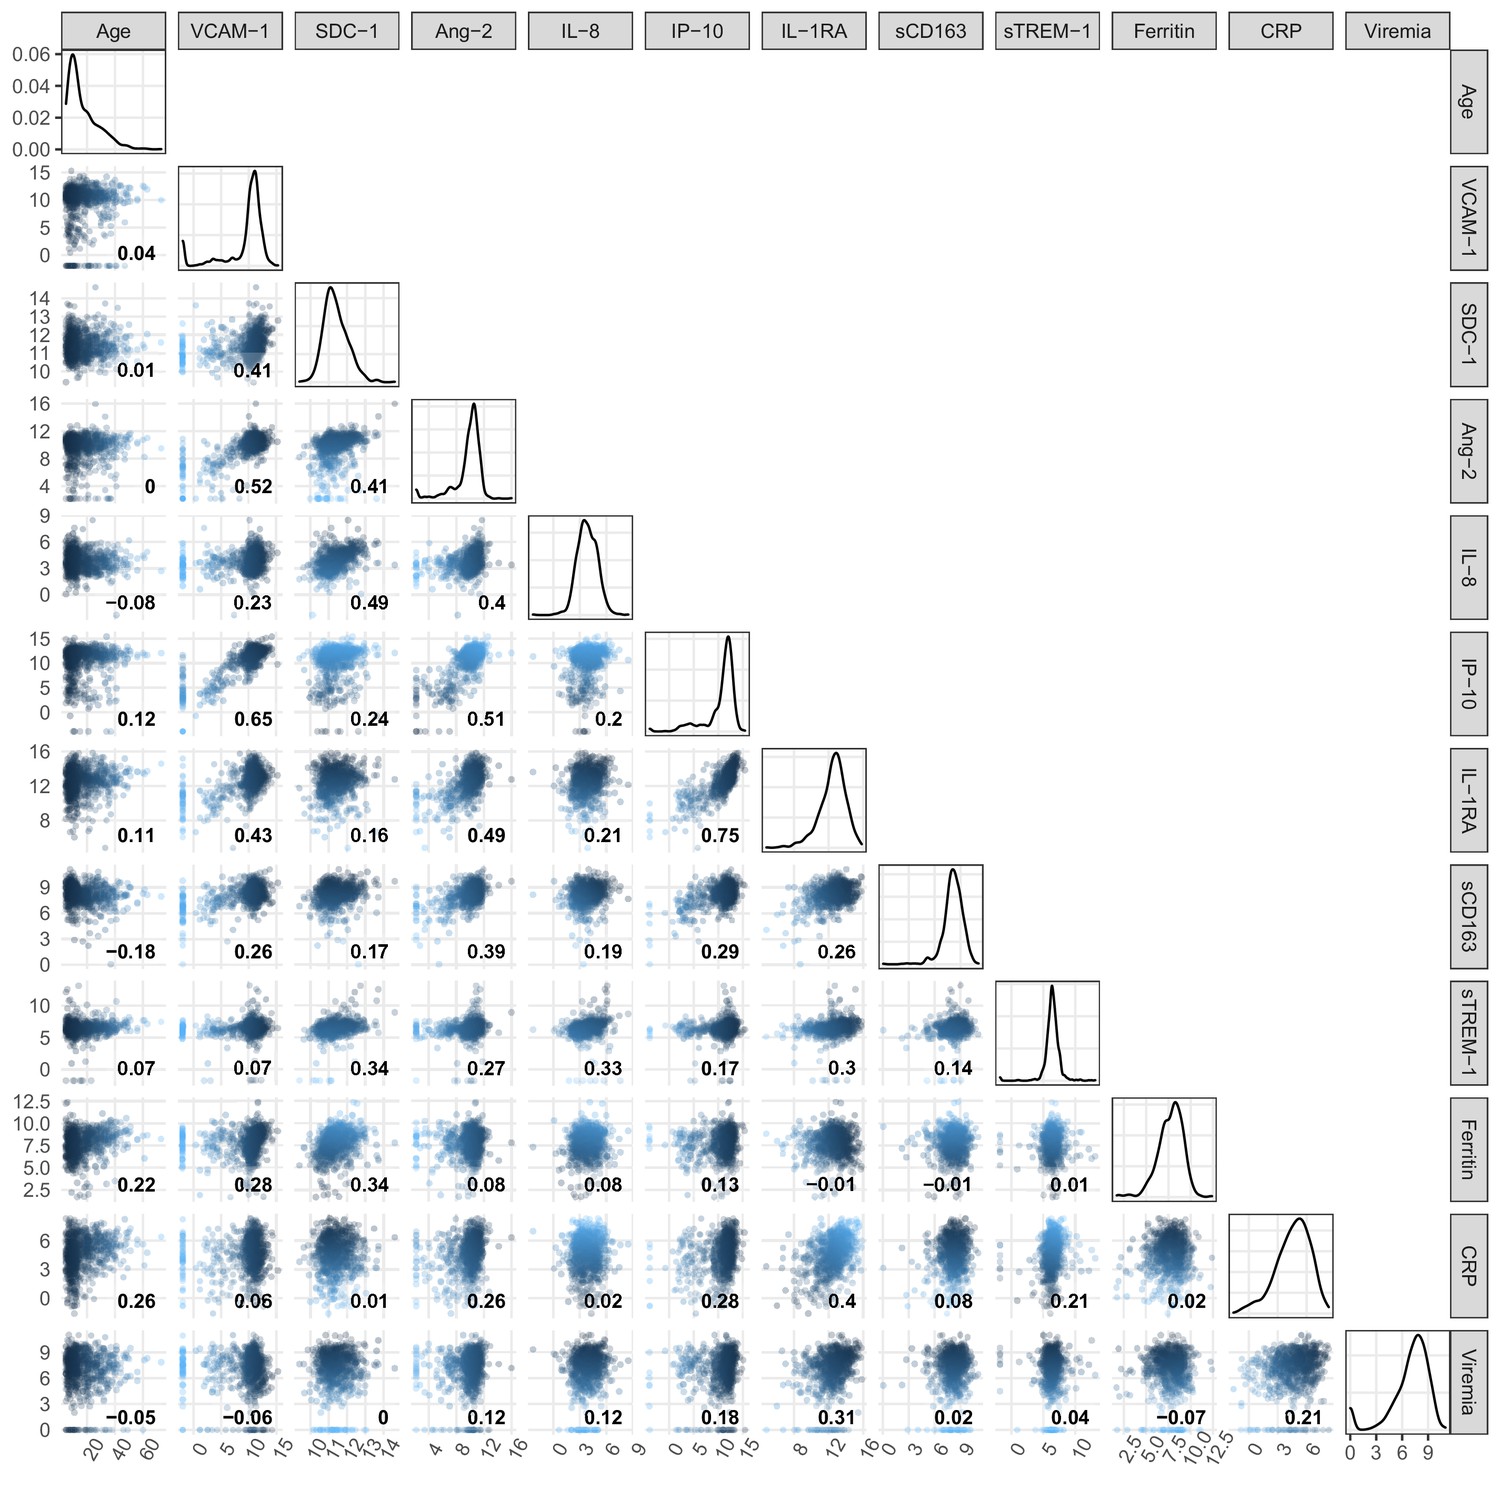
Pairwise correlation of biomarker levels at enrollment and age.
Viremia levels are transformed using log-10. All other biomarker levels are transformed using log-2. The number inside each scatter plot represents the Spearman’s rank correlation coefficient of the two variables at the corresponding column and row. When the column and row refer to the same variable, the corresponding scatter plot is replaced by a density plot to reflect the distribution of that biomarker. VCAM-1: vascular cell adhesion molecule-1; SDC-1: syndecan-1; Ang-2: angiopoietin-2; IL-8: interleukin-8; IP-10: interferon gamma-induced protein-10; IL-1RA: interleukin-1 receptor antagonist; sCD163: soluble cluster of differentiation 163; sTREM-1: soluble triggering receptor expressed on myeloid cells-1; CRP: C-reactive protein.
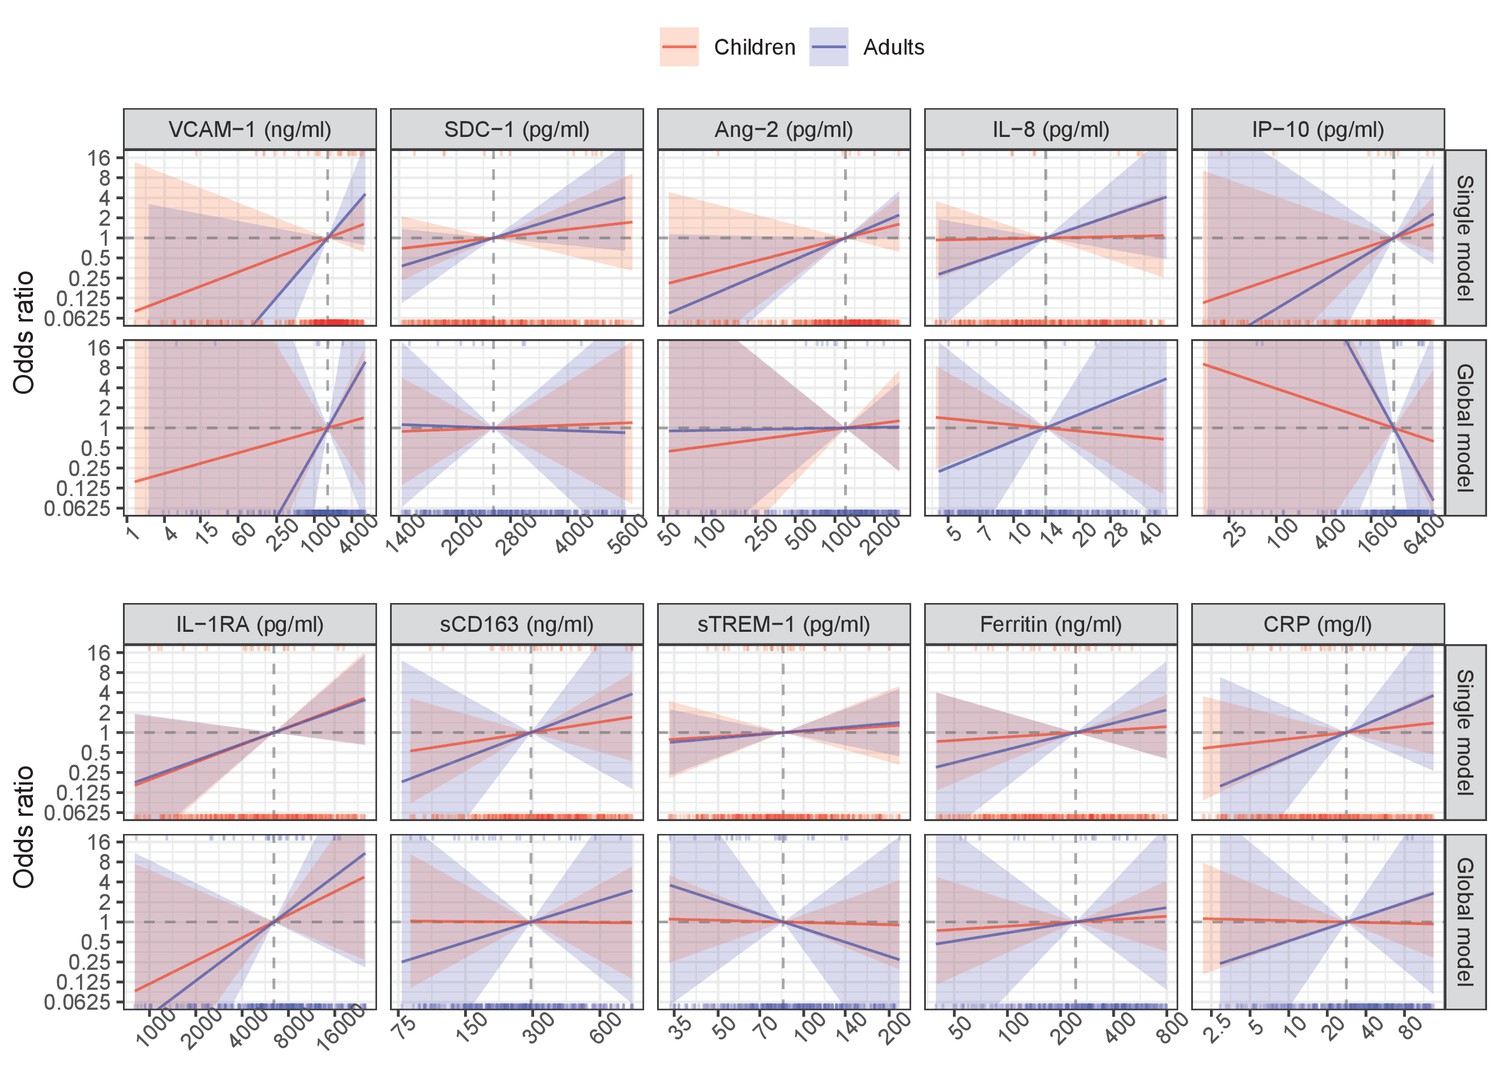
Appendix 5—figure 1
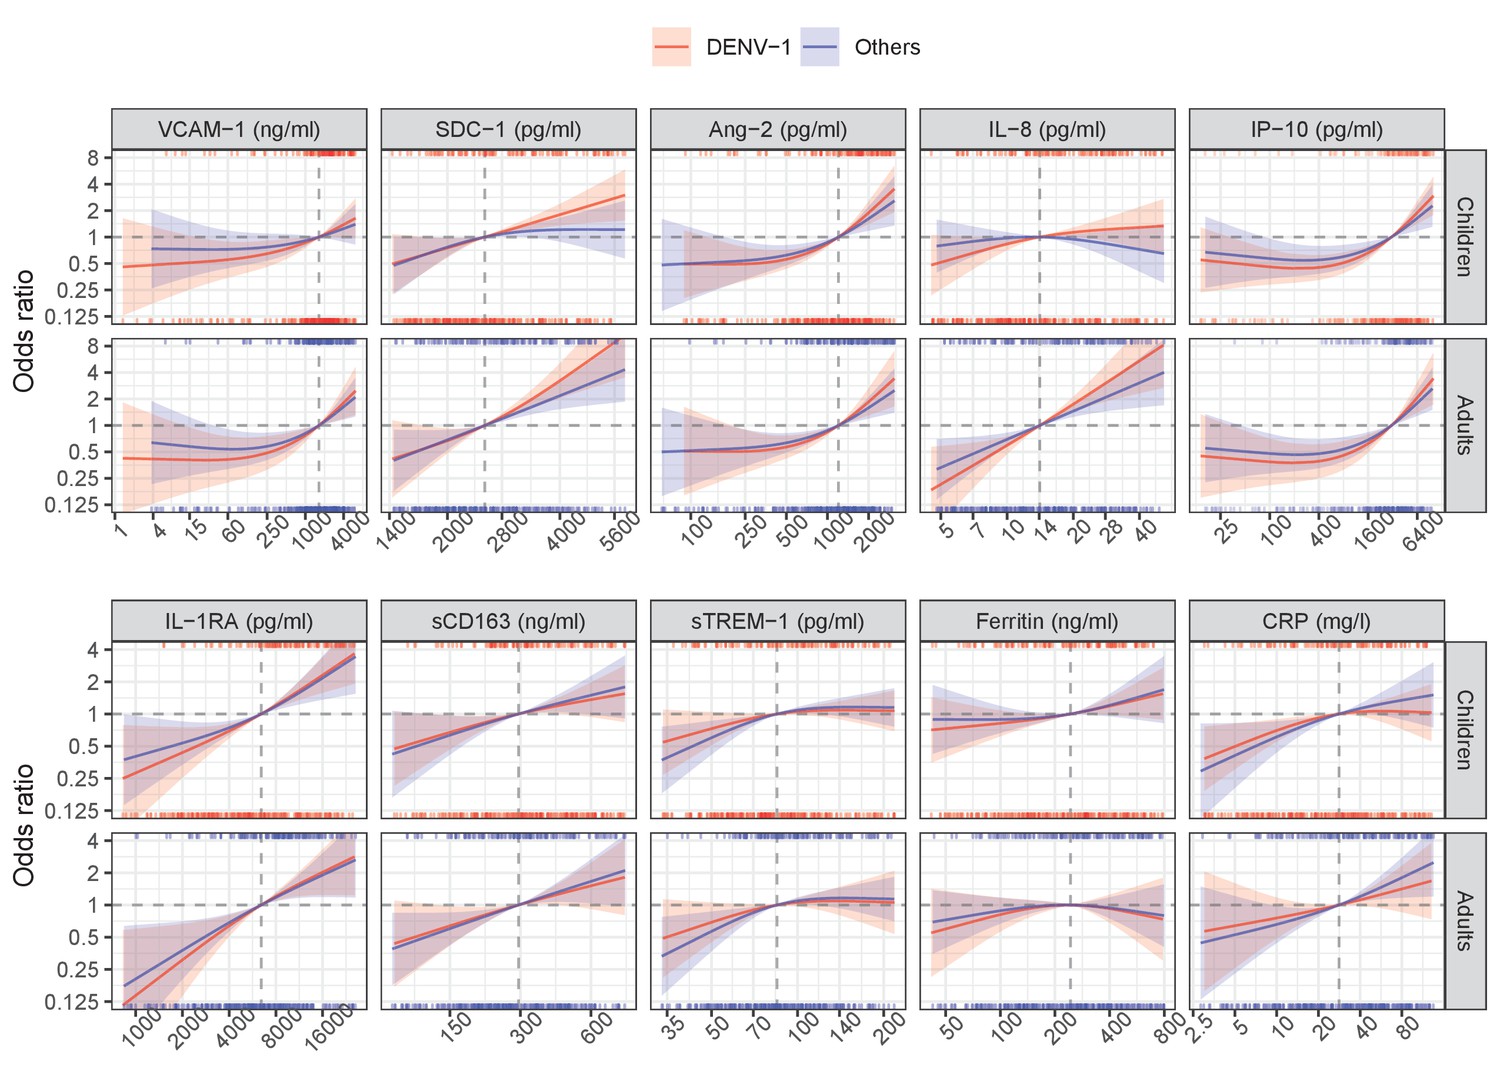
Results from single models for severe/moderate dengue with the interaction with serotype.
Appendix 5—figure 2

Results from global model for severe/moderate dengue with the interaction with serotype.
Appendix 6—figure 1
Results from models for severe dengue endpoint.
Appendix 6—figure 2
Results from models for severe dengue or dengue with warning signs endpoint.
Appendix 6—figure 3
Results from models for hospitalization endpoint.
Appendix 8—figure 1

Results from models for severe/moderate dengue including viremia as a potential biomarker.
Tables
Table 1
Summary of clinical data by primary outcome.
| All patients | Children | Adults | ||||
|---|---|---|---|---|---|---|
| Uncomplicated dengue (N = 556) | Severe/moderate dengue (N = 281) | Uncomplicated dengue (N = 337) | Severe/moderate dengue (N = 127) | Uncomplicated dengue (N = 219) | Severe/moderate dengue (N = 154) | |
| Country, n (%) | ||||||
| - Cambodia | 39 (7) | 30 (11) | 37 (11) | 29 (23) | 2 (1) | 1 (1) |
| - El Salvador | 23 (4) | 18 (6) | 23 (7) | 18 (14) | 0 (0) | 0 (0) |
| - Malaysia | 58 (10) | 29 (10) | 3 (1) | 1 (1) | 55 (25) | 28 (18) |
| - Vietnam | 436 (78) | 204 (73) | 274 (81) | 79 (62) | 162 (74) | 125 (81) |
| Age (years), median (1st, 3rd quartiles) | 12 (9, 22) | 16 (10, 24) | 10 (8, 12) | 10 (7, 12) | 26 (20, 34) | 22 (18, 30) |
| Gender male, n (%) | 299 (54) | 170 (60) | 173 (51) | 80 (63) | 126 (58) | 90 (58) |
| Illness day at enrolment, n (%) | ||||||
| - 1 | 91 (16) | 49 (17) | 57 (17) | 25 (20) | 34 (16) | 24 (16) |
| - 2 | 260 (47) | 130 (46) | 156 (46) | 52 (41) | 104 (47) | 78 (51) |
| - 3 | 205 (37) | 102 (36) | 124 (37) | 50 (39) | 81 (37) | 52 (34) |
| Serotype, n (%) | ||||||
| - DENV-1 | 228 (41) | 121 (43) | 161 (48) | 61 (48) | 67 (31) | 60 (39) |
| - DENV-2 | 74 (13) | 47 (17) | 22 (7) | 16 (13) | 52 (24) | 31 (20) |
| - DENV-3 | 59 (11) | 29 (10) | 43 (13) | 18 (14) | 16 (7) | 11 (7) |
| - DENV-4 | 161 (29) | 70 (25) | 91 (27) | 26 (20) | 70 (32) | 44 (29) |
| - Unknown | 34 (6) | 14 (5) | 20 (6) | 6 (5) | 14 (6) | 8 (5) |
| Immune status, n (%) | ||||||
| - Probable primary | 124 (22) | 41 (15) | 86 (26) | 15 (12) | 38 (17) | 26 (17) |
| - Probable secondary | 355 (64) | 218 (78) | 202 (60) | 100 (79) | 153 (70) | 118 (77) |
| - Inconclusive | 77 (14) | 22 (8) | 49 (15) | 12 (9) | 28 (13) | 10 (6) |
| Obesity*, n (%) | 78 (14) | 29 (10) | 62 (18) | 19 (15) | 16 (7) | 10 (6) |
| Diabetes, n (%) | 4 (1) | 1 (0) | 0 (0) | 0 (0) | 4 (2) | 1 (1) |
| WHO 2009 classification, n (%) | ||||||
| - Mild dengue | 266 (48) | 49 (17) | 168 (50) | 17 (13) | 98 (45) | 32 (21) |
| - Dengue with warning signs | 288 (52) | 186 (66) | 169 (50) | 81 (64) | 119 (54) | 105 (68) |
| - Severe dengue | 0 (0) | 43 (15) | 0 (0) | 27 (21) | 0 (0) | 16 (10) |
| - Unknown | 2 (0) | 3 (1) | 0 (0) | 2 (2) | 2 (1) | 1 (1) |
| Hospitalization, n (%) | 175 (31) | 161 (57) | 127 (38) | 83 (65) | 48 (22) | 78 (51) |
-
*Obesity is defined as body mass index of higher than 30 kg/m2 (for patients of older than 18 years) or two standard deviations of the median of body mass index for age (for patients of 18 years or below). WHO: World Health Organization.
Table 2
Results from models for the primary endpoint (severe or moderate dengue).
| Single models | Global model | ||||||||
|---|---|---|---|---|---|---|---|---|---|
| Children OR (95% CI) | Adults OR (95% CI) | Poverall | Pinteraction | Children OR (95% CI) | Adults OR (95% CI) | Poverall | Pinteraction | ||
| VCAM-1 (ng/ml) | <0.001 | 0.715 | 0.441 | 0.213 | |||||
| - 1636 vs 818 | 1.20 (1.04–1.38) | 1.35 (1.15–1.58) | 0.90 (0.73–1.10) | 1.22 (0.96–1.57) | |||||
| - 3272 vs 1636 | 1.25 (1.02–1.53) | 1.48 (1.19–1.85) | 0.87 (0.66–1.15) | 1.30 (0.93–1.80) | |||||
| SDC-1 (pg/ml) | <0.001 | 0.088 | 0.002 | 0.588 | |||||
| - 2519 vs 1260 | 2.67 (1.31–5.43) | 3.33 (1.32–8.42) | 2.03 (0.77–5.34) | 5.11 (1.56–16.78) | |||||
| - 5039 vs 2519 | 1.71 (1.18–2.47) | 3.71 (2.09–6.58) | 1.76 (0.98–3.14) | 2.52 (1.17–5.42) | |||||
| Ang-2 (pg/ml) | <0.001 | 0.524 | 0.039 | 0.068 | |||||
| - 1204 vs 602 | 1.64 (1.39–1.94) | 1.51 (1.26–1.82) | 1.67 (1.23–2.25) | 1.01 (0.74–1.38) | |||||
| - 2409 vs 1204 | 2.21 (1.58–3.10) | 2.00 (1.40–2.85) | 1.95 (1.25–3.05) | 1.01 (0.65–1.57) | |||||
| IL-8 (pg/ml) | <0.001 | <0.001 | <0.001 | <0.001 | |||||
| - 14 vs 7 | 1.42 (1.05–1.91) | 2.18 (1.47–3.24) | 0.91 (0.63–1.34) | 1.69 (1.05–2.71) | |||||
| - 28 vs 14 | 0.99 (0.78–1.25) | 2.33 (1.63–3.33) | 0.53 (0.36–0.77) | 2.05 (1.34–3.13) | |||||
| IP-10 (pg/ml) | <0.001 | 0.984 | 0.206 | 0.630 | |||||
| - 3093 vs 1546 | 1.46 (1.26–1.68) | 1.45 (1.21–1.73) | 0.94 (0.73–1.19) | 0.80 (0.57–1.12) | |||||
| - 6186 vs 3093 | 1.68 (1.35–2.09) | 1.69 (1.29–2.22) | 1.08 (0.77–1.51) | 0.82 (0.52–1.29) | |||||
| IL-1RA (pg/ml) | <0.001 | 0.082 | <0.001 | 0.032 | |||||
| - 6434 vs 3217 | 1.69 (1.42–2.03) | 1.48 (1.21–1.81) | 2.07 (1.52–2.84) | 1.45 (0.98–2.15) | |||||
| - 12868 vs 6434 | 1.82 (1.46–2.27) | 1.70 (1.29–2.24) | 2.16 (1.53–3.05) | 1.47 (0.94–2.30) | |||||
| sCD163 (ng/ml) | <0.001 | 0.551 | 0.217 | 0.341 | |||||
| - 295 vs 147 | 1.57 (1.14–2.15) | 1.49 (1.13–1.98) | 1.40 (0.89–2.22) | 1.27 (0.84–1.91) | |||||
| - 589 vs 295 | 1.46 (1.10–1.93) | 1.61 (1.09–2.37) | 1.21 (0.87–1.69) | 1.39 (0.89–2.18) | |||||
| sTREM-1 (pg/ml) | 0.059 | 0.997 | 0.555 | 0.393 | |||||
| - 85 vs 42 | 1.87 (1.23–2.84) | 1.79 (1.10–2.93) | 1.13 (0.70–1.81) | 1.21 (0.65–2.26) | |||||
| - 169 vs 85 | 1.12 (0.91–1.38) | 1.12 (0.82–1.53) | 0.89 (0.65–1.21) | 0.61 (0.38–0.99) | |||||
| Ferritin (ng/ml) | 0.042 | 0.054 | 0.008 | 0.002 | |||||
| - 243 vs 122 | 1.18 (1.01–1.38) | 1.06 (0.89–1.27) | 1.30 (1.04–1.64) | 0.78 (0.61–0.99) | |||||
| - 487 vs 243 | 1.26 (1.00–1.58) | 0.90 (0.66–1.23) | 1.22 (0.89–1.67) | 0.66 (0.44–1.00) | |||||
| CRP (mg/l) | <0.001 | 0.031 | 0.184 | 0.138 | |||||
| - 28 vs 14 | 1.26 (1.12–1.41) | 1.25 (1.03–1.52) | 1.08 (0.93–1.25) | 1.10 (0.85–1.44) | |||||
| - 56 vs 28 | 1.13 (0.95–1.34) | 1.38 (1.11–1.71) | 0.93 (0.75–1.15) | 1.36 (1.02–1.81) |
-
Poverall is derived from Wald test for the overall association of the biomarker with the endpoint; Pinteraction is from the test for the interaction between the biomarker and age. The odds ratios are estimated at age of 10 and 25 years, represented as children and adults respectively.
Table 3
Best combinations of biomarkers associated with severe or moderate dengue for children.
| Best of all combinations | Best combination of 2 variables | Best combination of 3 variables | Best combination of 4 variables | Best combination of 5 variables | |
|---|---|---|---|---|---|
| Variables | |||||
| - VCAM-1 | |||||
| - SDC-1 | + | ||||
| - Ang-2 | + | + | + | + | |
| - IL-8 | + | + | |||
| - IP-10 | + | + | + | ||
| - IL-1RA | + | + | + | + | + |
| - sCD163 | |||||
| - sTREM-1 | |||||
| - Ferritin | + | + | + | + | + |
| - CRP | |||||
| AIC of the selected model | 465.9 | 484.7 | 480.0 | 473.7 | 467.6 |
| Bootstrap results | |||||
| - Model selection frequency, n (%) | 134 (13.4) | 437 (43.7) | 239 (23.9) | 317 (31.7) | 440 (44.0) |
| - Rank by selection frequency of the selected model | 1 | 1 | 2 | 1 | 1 |
-
VCAM-1: vascular cell adhesion molecule-1; SDC-1: syndecan-1; Ang-2: angiopoietin-2; IL-8: interleukin-8; IP-10: interferon gamma-induced protein-10; IL-1RA: interleukin-1 receptor antagonist; sCD163: soluble cluster of differentiation 163; sTREM-1: soluble triggering receptor expressed on myeloid cells-1; CRP: C-reactive protein; AIC: Akaike information criterion.
Table 4
Best combinations of biomarkers associated with severe or moderate dengue for adults.
| Best of all combinations | Best combination of 2 variables | Best combination of 3 variables | Best combination of 4 variables | Best combination of 5 variables | |
|---|---|---|---|---|---|
| Variables | |||||
| - VCAM-1 | |||||
| - SDC-1 | + | + | + | + | + |
| - Ang-2 | |||||
| - IL-8 | + | + | + | + | + |
| - IP-10* | + | ||||
| - IL-1RA | + | + | + | ||
| - sCD163 | + | ||||
| - sTREM-1 | + | + | |||
| - Ferritin | + | + | + | + | |
| - CRP | |||||
| AIC of the selected model | 430.5 | 441.1 | 434.2 | 431.6 | 430.7 |
| Bootstrap results | |||||
| - Model selection frequency, n (%) | 79 (7.9) | 567 (56.7) | 432 (43.2) | 202 (20.2) | 161 (16.1) |
| - Rank by selection frequency of the selected model | 1 | 1 | 1 | 1 | 1 |
-
VCAM-1: vascular cell adhesion molecule-1; SDC-1: syndecan-1; Ang-2: angiopoietin-2; IL-8: interleukin-8; IP-10: interferon gamma-induced protein-10; IL-1RA: interleukin-1 receptor antagonist; sCD163: soluble cluster of differentiation 163; sTREM-1: soluble triggering receptor expressed on myeloid cells-1; CRP: C-reactive protein; AIC: Akaike information criterion.
*Variable is kept as non-linear effect using natural cubic splines with three knots.
Appendix 2—table 1
Definition of severe and moderate dengue components.
| Endpoint | Definition |
|---|---|
| Severe plasma leakage | Dengue shock syndrome or respiratory distress due to plasma leakage |
| Moderate plasma leakage | Did not fulfill criteria for severe plasma leakage and had at least one of the following criteria: (1) maximum haematocrit change was 20% or more, and (2) having evidence of fluid accumulation |
| Severe bleeding | Any bleeding into a critical organ or required any blood transfusion of packed red cells or whole blood without pre-anaemia, or bleeding with complication |
| Moderate bleeding | Did not fulfill criteria for severe bleeding and had at least one of the following criteria: (1) severe bleeding by clinical judgement, (2) bleeding required any blood transfusion other than packed red cells or whole blood, (3) bleeding required other intervention (e.g. nasal packing, cross-match, etc.), and (4) receiving packed red cells or whole blood with pre-existing anaemia and with a consistent haemoglobin value |
| Severe neurologic involvement | Abnormal neurologic examination and neurologic involvement that resulted in death or ongoing sequelae that impaired daily function, or required intubation, shunting or intensive care |
| Moderate neurology involvement | Single convulsion without hospitalization or other complication |
| Severe hepatic involvement | Jaundice or coagulopathy or encephalopathy |
| Moderate hepatic involvement | Any alanine aminotransferase (ALT) or aspartate aminotransferase (AST) result of 400 IU/L or more |
| Severe other major organ failure | Creatine kinase or other enzymes (e.g. troponin) abnormalities and functional abnormalities (e.g. reduced cardiac ejection fraction less than 50% or new electrocardiogram [ECG] abnormalities) or required specific intervention (e.g. inotropic support) |
| Moderate other major organ failure | Troponin abnormalities alone or creatine kinase abnormalities without cardiac ejection fraction less than 50% |
Appendix 4—table 1
Summary of clinical phenotype of the primary endpoint.
| All patients (N = 281) | Children (N = 127) | Adults (N = 154) | |
|---|---|---|---|
| Severe dengue, n (%) | 38 (14) | 29 (23) | 9 (6) |
| - Severe plasma leakage | 33 (12) | 24 (19) | 9 (6) |
| +Dengue shock syndrome | 25 (9) | 18 (14) | 7 (5) |
| +Respiratory distress | 12 (4) | 9 (7) | 3 (2) |
| - Severe neurologic involvement | 3 (1) | 3 (2) | 0 (0) |
| - Severe bleeding | 2 (1) | 2 (2) | 0 (0) |
| - Severe other major organ failure | 1 (0) | 0 (0) | 1 (1) |
| - Severe hepatic involvement | 0 (0) | 0 (0) | 0 (0) |
| Moderate dengue, n (%) | 243 (86) | 98 (77) | 145 (94) |
| - Moderate plasma leakage | 159 (57) | 73 (57) | 86 (56) |
| - Moderate hepatic involvement | 102 (36) | 35 (28) | 67 (44) |
| - Moderate bleeding | 9 (3) | 3 (2) | 6 (4) |
| - Moderate other major organ involvement | 1 (0) | 0 (0) | 1 (1) |
| - Moderate neurologic involvement | 0 (0) | 0 (0) | 0 (0) |
Appendix 4—table 2
Summary of biomarkers’ data.
| All patients | Children | Adults | ||||||
|---|---|---|---|---|---|---|---|---|
| Uncomplicated dengue | Severe/moderate dengue | Uncomplicated dengue | Severe/moderate dengue | Uncomplicated dengue | Severe/moderate dengue | |||
| At enrollment | (N = 556) | (N = 281) | (N = 337) | (N = 127) | (N = 219) | (N = 154) | ||
| VCAM-1 (ng/ml) | 1404 (540, 2548) | 2027 (1122, 3577) | 1442 (447, 2546) | 2020 (1232, 3384) | 1356 (568, 2560) | 2092 (1060, 4202) | ||
| SDC-1 (pg/ml) | 2334 (1864, 3131) | 2997 (2230, 4201) | 2369 (1861, 3423) | 2846 (2164, 4173) | 2260 (1879, 2898) | 3122 (2278, 4211) | ||
| Ang-2 (pg/ml) | 1064 (550, 1584) | 1521 (899, 2318) | 1102 (584, 1563) | 1547 (967, 2318) | 944 (516, 1585) | 1516 (885, 2321) | ||
| IL-8 (pg/ml) | 12 (8, 22) | 17 (11, 28) | 15 (9, 26) | 16 (10, 27) | 10 (7, 15) | 19 (12, 29) | ||
| IP-10 (pg/ml) | 2502 (732, 4509) | 4092 (2436, 6441) | 2245 (458, 4531) | 3942 (2046, 6287) | 2793 (1370, 4495) | 4242 (2524, 6469) | ||
| IL-1RA (pg/ml) | 5237 (2603, 9082) | 9105 (5933, 14977) | 4491 (2318, 8977) | 9688 (6109, 16786) | 5721 (3479, 9703) | 8993 (5953, 12935) | ||
| sCD163 (ng/ml) | 278 (185, 447) | 322 (228, 503) | 326 (212, 481) | 386 (256, 603) | 226 (157, 374) | 291 (207, 410) | ||
| sTREM-1 (pg/ml) | 81 (59, 114) | 96 (69, 132) | 80 (58, 115) | 93 (67, 128) | 84 (60, 114) | 98 (73, 134) | ||
| Ferritin (ng/ml) | 233 (116, 406) | 261 (133, 433) | 177 (99, 324) | 224 (110, 402) | 303 (161, 510) | 278 (160, 448) | ||
| CRP (mg/l) | 25 (10, 54) | 34 (17, 72) | 18 (7, 41) | 24 (13, 58) | 38 (17, 65) | 45 (25, 80) | ||
| Viremia (106 copies/ml) | 15.8 (0.7, 148.5) | 79.2 (5.3, 582.7) | 21.8 (1.8, 167.0) | 105.4 (8.4, 646.0) | 9.8 (0.3, 115.5) | 56.2 (3.6, 496.0) | ||
| At follow-up | (N = 437) | (N = 231) | (N = 292) | (N = 112) | (N = 145) | (N = 119) | ||
| VCAM-1 (ng/ml) | 402 (102, 730) | 686 (344, 961) | 579 (182, 858) | 782 (402, 1078) | 173 (26, 388) | 622 (343, 835) | ||
| SDC-1 (pg/ml) | 2769 (2298, 3514) | 3417 (2815, 5495) | 2957 (2319, 4115) | 3122 (2748, 5507) | 2666 (2196, 3058) | 3745 (2971, 5495) | ||
| Ang-2 (pg/ml) | 953 (478, 1479) | 1155 (675, 1567) | 1163 (738, 1646) | 1352 (710, 1856) | 565 (302, 923) | 1044 (626, 1345) | ||
| IL-8 (pg/ml) | 4.9 (2.3, 12.4) | 5.7 (2.7, 10.4) | 6.8 (3.0, 15.1) | 5.9 (2.4, 10.5) | 2.7 (1.6, 4.8) | 5.5 (3.1, 10.4) | ||
| IP-10 (pg/ml) | 57 (24, 91) | 76 (47, 133) | 67 (33, 98) | 86 (38, 143) | 39 (22, 70) | 75 (48, 108) | ||
| IL-1RA (pg/ml) | 412 (279, 635) | 455 (328, 626) | 441 (323, 687) | 501 (352, 664) | 336 (210, 480) | 407 (308, 615) | ||
| sCD163 (ng/ml) | 337 (216, 553) | 412 (257, 661) | 340 (226, 562) | 456 (279, 680) | 328 (199, 523) | 386 (241, 589) | ||
| sTREM-1 (pg/ml) | 99 (73, 132) | 90 (68, 116) | 98 (72, 132) | 91 (67, 115) | 101 (73, 134) | 90 (70, 116) | ||
| Ferritin (ng/ml) | 202 (120, 309) | 273 (181, 382) | 177 (112, 263) | 209 (154, 311) | 267 (160, 404) | 322 (247, 436) | ||
| CRP* (mg/l) | 0.7 (0.3, 1.8) | 0.8 (0.4, 2.0) | 0.6 (0.3, 1.3) | 0.6 (0.3, 1.1) | 1.1 (0.5, 2.7) | 1.1 (0.5, 3.4) |
-
*The number of cases with available data for CRP at follow-up in the uncomplicated and severe/moderate dengue groups are 436 and 228 (all patients); 292 and 111 (children); and 218 and 152 (adults) respectively.
VCAM-1: vascular cell adhesion molecule-1; SDC-1: syndecan-1; Ang-2: angiopoietin-2; IL-8: interleukin-8; IP-10: interferon gamma-induced protein-10; IL-1RA: interleukin-1 receptor antagonist; sCD163: soluble cluster of differentiation 163; sTREM-1: soluble triggering receptor expressed on myeloid cells-1; CRP: C-reactive protein.
-
Summary statistics are median (1st and 3rd quartiles).
Appendix 5—table 1
Results from single models for severe/moderate dengue with the interaction with serotype.
| Children | Adults | ||||||||
|---|---|---|---|---|---|---|---|---|---|
| DENV-1 OR (95% CI) | Other serotypes OR (95% CI) | DENV-1 OR (95% CI) | Other serotypes OR (95% CI) | Poverall | P1 | P2 | P3 | ||
| VCAM-1 (ng/ml) | 0.008 | 0.822 | 0.729 | 0.565 | |||||
| - 1636 vs 818 | 1.22 (1.02–1.46) | 1.14 (0.95–1.37) | 1.42 (1.13–1.77) | 1.32 (1.10–1.58) | |||||
| - 3272 vs 1636 | 1.28 (0.99–1.66) | 1.18 (0.91–1.54) | 1.57 (1.15–2.14) | 1.45 (1.13–1.86) | |||||
| SDC-1 (pg/ml) | <0.001 | 0.087 | 0.326 | 0.352 | |||||
| - 2519 vs 1260 | 2.35 (0.89–6.25) | 2.56 (0.97–6.74) | 2.85 (0.80–10.12) | 3.10 (1.11–8.64) | |||||
| - 5039 vs 2519 | 2.41 (1.47–3.96) | 1.22 (0.69–2.13) | 6.39 (2.81–14.53) | 3.23 (1.73–6.01) | |||||
| Ang-2 (pg/ml) | <0.001 | 0.935 | 0.923 | 0.702 | |||||
| - 1204 vs 602 | 1.67 (1.35–2.05) | 1.51 (1.21–1.88) | 1.64 (1.28–2.10) | 1.48 (1.20–1.83) | |||||
| - 2409 vs 1204 | 2.46 (1.60–3.79) | 1.97 (1.25–3.11) | 2.40 (1.44–4.02) | 1.92 (1.28–2.89) | |||||
| IL-8 (pg/ml) | <0.001 | <0.001 | <0.001 | 0.104 | |||||
| - 14 vs 7 | 1.52 (1.00–2.31) | 1.12 (0.76–1.65) | 2.83 (1.57–5.12) | 2.09 (1.34–3.26) | |||||
| - 28 vs 14 | 1.22 (0.90–1.65) | 0.84 (0.60–1.17) | 3.04 (1.88–4.94) | 2.10 (1.45–3.04) | |||||
| IP-10 (pg/ml) | <0.001 | 0.975 | 0.950 | 0.681 | |||||
| - 3093 vs 1546 | 1.54 (1.28–1.84) | 1.39 (1.13–1.70) | 1.64 (1.28–2.10) | 1.48 (1.20–1.83) | |||||
| - 6186 vs 3093 | 1.84 (1.39–2.43) | 1.60 (1.17–2.20) | 2.00 (1.37–2.92) | 1.75 (1.27–2.40) | |||||
| IL-1RA (pg/ml) | <0.001 | 0.577 | 0.280 | 0.805 | |||||
| - 6434 vs 3217 | 1.68 (1.29–2.18) | 1.51 (1.20–1.90) | 1.96 (1.34–2.86) | 1.76 (1.29–2.38) | |||||
| - 12868 vs 6434 | 1.87 (1.43–2.44) | 1.77 (1.28–2.46) | 1.73 (1.23–2.44) | 1.64 (1.18–2.29) | |||||
| sCD163 (ng/ml) | 0.002 | 0.983 | 0.831 | 0.932 | |||||
| - 295 vs 147 | 1.50 (1.03–2.20) | 1.60 (1.03–2.48) | 1.59 (1.02–2.47) | 1.69 (1.18–2.42) | |||||
| - 589 vs 295 | 1.35 (0.94–1.94) | 1.48 (0.99–2.21) | 1.50 (0.92–2.43) | 1.64 (1.04–2.59) | |||||
| sTREM-1 (pg/ml) | 0.146 | 0.979 | 0.998 | 0.597 | |||||
| - 85 vs 42 | 1.55 (0.94–2.57) | 2.03 (1.22–3.39) | 1.68 (0.92–3.07) | 2.20 (1.21–4.02) | |||||
| - 169 vs 85 | 1.08 (0.80–1.45) | 1.16 (0.87–1.54) | 1.08 (0.68–1.71) | 1.16 (0.83–1.60) | |||||
| Ferritin (ng/ml) | 0.112 | 0.139 | 0.177 | 0.711 | |||||
| - 243 vs 122 | 1.18 (0.97–1.44) | 1.12 (0.91–1.38) | 1.14 (0.88–1.49) | 1.08 (0.88–1.32) | |||||
| - 487 vs 243 | 1.28 (0.96–1.71) | 1.32 (0.91–1.92) | 0.87 (0.55–1.38) | 0.90 (0.64–1.27) | |||||
| CRP (mg/l) | <0.001 | 0.080 | 0.029 | 0.755 | |||||
| - 28 vs 14 | 1.23 (1.06–1.43) | 1.36 (1.12–1.66) | 1.21 (0.94–1.57) | 1.34 (1.07–1.69) | |||||
| - 56 vs 28 | 1.06 (0.85–1.33) | 1.24 (0.97–1.58) | 1.25 (0.93–1.68) | 1.46 (1.13–1.87) |
-
Odds ratios are estimated at age of 10 and 25 years, represented as children and adults respectively; Poverall is derived from Wald test for the overall association of the biomarker with the endpoint; P1 is from the test for the overall interaction of the biomarker; P2 is from the test for the interaction between the biomarker and age; P3 is from the test for the interaction between the biomarker and serotype.
Appendix 5—table 2
Results from global model for severe/moderate dengue with the interaction with serotype.
| Children | Adults | ||||||||
|---|---|---|---|---|---|---|---|---|---|
| DENV-1 OR (95% CI) | Other serotypes OR (95% CI) | DENV-1 OR (95% CI) | Other serotypes OR (95% CI) | Poverall | P1 | P2 | P3 | ||
| VCAM-1 (ng/ml) | 0.449 | 0.258 | 0.248 | 0.327 | |||||
| - 1636 vs 818 | 0.84 (0.62–1.13) | 0.88 (0.66–1.17) | 1.18 (0.81–1.72) | 1.24 (0.93–1.65) | |||||
| - 3272 vs 1636 | 0.75 (0.50–1.12) | 0.85 (0.58–1.25) | 1.14 (0.70–1.85) | 1.29 (0.88–1.90) | |||||
| SDC-1 (pg/ml) | 0.027 | 0.788 | 0.821 | 0.316 | |||||
| - 2519 vs 1260 | 3.21 (0.79–12.94) | 1.38 (0.38–4.94) | 5.98 (1.00–35.72) | 2.57 (0.66–10.01) | |||||
| - 5039 vs 2519 | 2.82 (1.21–6.57) | 1.45 (0.62–3.40) | 3.70 (1.08–12.72) | 1.90 (0.80–4.52) | |||||
| Ang-2 (pg/ml) | 0.067 | 0.102 | 0.043 | 0.472 | |||||
| - 1204 vs 602 | 1.65 (1.10–2.47) | 1.79 (1.18–2.72) | 0.89 (0.55–1.44) | 0.97 (0.67–1.40) | |||||
| - 2409 vs 1204 | 2.22 (1.21–4.05) | 1.73 (0.94–3.17) | 1.25 (0.63–2.48) | 0.97 (0.58–1.62) | |||||
| IL-8 (pg/ml) | <0.001 | <0.001 | <0.001 | 0.591 | |||||
| - 14 vs 7 | 0.86 (0.48–1.51) | 0.73 (0.44–1.24) | 2.14 (1.01–4.53) | 1.84 (1.05–3.20) | |||||
| - 28 vs 14 | 0.68 (0.41–1.13) | 0.49 (0.29–0.82) | 2.60 (1.27–5.32) | 1.88 (1.20–2.96) | |||||
| IP-10 (pg/ml) | 0.068 | 0.875 | 0.715 | 0.888 | |||||
| - 3093 vs 1546 | 0.98 (0.69–1.40) | 0.91 (0.65–1.26) | 0.86 (0.53–1.40) | 0.80 (0.53–1.19) | |||||
| - 6186 vs 3093 | 1.27 (0.77–2.10) | 1.10 (0.70–1.74) | 1.04 (0.54–2.00) | 0.90 (0.53–1.53) | |||||
| IL-1RA (pg/ml) | <0.001 | 0.333 | 0.230 | 0.711 | |||||
| - 6434 vs 3217 | 2.63 (1.65–4.20) | 2.11 (1.32–3.39) | 2.50 (1.28–4.88) | 2.01 (1.15–3.51) | |||||
| - 12868 vs 6434 | 2.38 (1.45–3.91) | 1.90 (1.19–3.04) | 1.65 (0.88–3.09) | 1.32 (0.78–2.23) | |||||
| sCD163 (ng/ml) | 0.340 | 0.661 | 0.455 | 0.769 | |||||
| - 295 vs 147 | 1.20 (0.65–2.20) | 1.54 (0.83–2.87) | 1.24 (0.68–2.27) | 1.61 (0.92–2.80) | |||||
| - 589 vs 295 | 1.20 (0.77–1.87) | 1.20 (0.75–1.94) | 1.49 (0.84–2.67) | 1.50 (0.85–2.61) | |||||
| sTREM-1 (pg/ml) | 0.441 | 0.289 | 0.306 | 0.071 | |||||
| - 85 vs 42 | 0.90 (0.48–1.67) | 1.23 (0.66–2.28) | 0.84 (0.36–1.94) | 1.15 (0.54–2.42) | |||||
| - 169 vs 85 | 0.56 (0.33–0.96) | 1.18 (0.79–1.77) | 0.34 (0.15–0.76) | 0.71 (0.43–1.19) | |||||
| Ferritin (ng/ml) | 0.067 | 0.033 | 0.013 | 0.331 | |||||
| - 243 vs 122 | 1.36 (1.00–1.85) | 1.25 (0.92–1.69) | 0.92 (0.62–1.36) | 0.84 (0.63–1.13) | |||||
| - 487 vs 243 | 1.08 (0.72–1.63) | 1.59 (0.97–2.61) | 0.55 (0.29–1.05) | 0.81 (0.51–1.29) | |||||
| CRP (mg/l) | 0.156 | 0.103 | 0.241 | 0.136 | |||||
| - 28 vs 14 | 0.95 (0.78–1.16) | 1.25 (0.98–1.60) | 0.94 (0.67–1.32) | 1.24 (0.90–1.70) | |||||
| - 56 vs 28 | 0.80 (0.60–1.07) | 1.07 (0.80–1.44) | 1.13 (0.75–1.70) | 1.51 (1.09–2.09) |
-
Odds ratios are estimated at age of 10 and 25 years, represented as children and adults respectively; Poverall is derived from Wald test for the overall association of the biomarker with the endpoint; P1 is from the test for the overall interaction of the biomarker; P2 is from the test for the interaction between the biomarker and age; P3 is from the test for the interaction between the biomarker and serotype.
Appendix 6—table 1
Results from models for severe dengue endpoint.
| Single models | Global model | ||||||||
|---|---|---|---|---|---|---|---|---|---|
| Children OR (95% CI) | Adults OR (95% CI) | Poverall | Pinteraction | Children OR (95% CI) | Adults OR (95% CI) | Poverall | Pinteraction | ||
| VCAM-1 (ng/ml) | 1.28 (0.77–2.12) | 2.13 (0.88–5.15) | 0.236 | 0.202 | 1.20 (0.35–4.12) | 3.13 (0.19–50.77) | 0.723 | 0.491 | |
| SDC-1 (pg/ml) | 1.55 (0.41–5.96) | 3.26 (0.69–15.52) | 0.307 | 0.438 | 1.16 (0.12–11.07) | 0.87 (0.03–27.93) | 0.987 | 0.884 | |
| Ang-2 (pg/ml) | 1.42 (0.70–2.88) | 1.79 (0.97–3.31) | 0.148 | 0.580 | 1.20 (0.33–4.31) | 1.02 (0.33–3.19) | 0.961 | 0.830 | |
| IL-8 (pg/ml) | 1.04 (0.47–2.33) | 2.15 (0.67–6.88) | 0.420 | 0.338 | 0.81 (0.28–2.31) | 2.51 (0.16–38.43) | 0.741 | 0.446 | |
| IP-10 (pg/ml) | 1.32 (0.75–2.33) | 1.64 (0.58–4.62) | 0.443 | 0.708 | 0.76 (0.17–3.30) | 0.22 (0.01–7.12) | 0.693 | 0.473 | |
| IL-1RA (pg/ml) | 1.84 (0.81–4.16) | 1.78 (0.80–3.94) | 0.098 | 0.956 | 2.22 (0.51–9.64) | 3.35 (0.45–24.87) | 0.386 | 0.696 | |
| sCD163 (ng/ml) | 1.43 (0.52–3.94) | 2.43 (0.27–21.70) | 0.617 | 0.645 | 0.98 (0.27–3.59) | 2.06 (0.15–27.47) | 0.855 | 0.590 | |
| sTREM-1 (pg/ml) | 1.20 (0.44–3.28) | 1.29 (0.55–3.05) | 0.793 | 0.914 | 0.93 (0.30–2.88) | 0.38 (0.02–8.76) | 0.827 | 0.541 | |
| Ferritin (ng/ml) | 1.13 (0.59–2.16) | 1.58 (0.59–4.23) | 0.659 | 0.501 | 1.12 (0.55–2.29) | 1.34 (0.25–7.02) | 0.926 | 0.819 | |
| CRP (mg/l) | 1.16 (0.71–1.88) | 1.77 (0.56–5.62) | 0.620 | 0.418 | 0.97 (0.58–1.63) | 1.55 (0.33–7.32) | 0.773 | 0.500 |
-
Odds ratios (95% confidence intervals) are calculated for each 2-fold increase of the biomarkers and are estimated at age of 10 and 25 years, represented as children and adults respectively; Poverall is derived from Wald test for the overall association of the biomarker with the endpoint; Pinteraction is from the test for the interaction between the biomarker and age.
Appendix 6—table 2
Results from models for severe dengue or dengue with warning signs endpoint.
| Single models | Global model | ||||||||
|---|---|---|---|---|---|---|---|---|---|
| Children OR (95% CI) | Adults OR (95% CI) | Poverall | Pinteraction | Children OR (95% CI) | Adults OR (95% CI) | Poverall | Pinteraction | ||
| VCAM-1 (ng/ml) | 0.025 | 0.374 | 0.469 | 0.763 | |||||
| - 1636 vs 818 | 1.06 (0.93–1.22) | 1.11 (0.92–1.33) | 0.82 (0.66–1.02) | 0.92 (0.66–1.30) | |||||
| - 3272 vs 1636 | 1.06 (0.87–1.29) | 1.13 (0.88–1.46) | 0.74 (0.55–1.01) | 0.88 (0.56–1.40) | |||||
| SDC-1 (pg/ml) | 0.032 | 0.363 | 0.116 | 0.773 | |||||
| - 2519 vs 1260 | 1.34 (0.86–2.09) | 1.15 (0.56–2.33) | 1.57 (0.89–2.75) | 1.89 (0.71–5.03) | |||||
| - 5039 vs 2519 | 1.40 (0.90–2.17) | 2.00 (0.79–5.08) | 1.78 (1.00–3.18) | 2.88 (0.71–11.69) | |||||
| Ang-2 (pg/ml) | 0.008 | 0.637 | 0.009 | 0.011 | |||||
| - 1204 vs 602 | 1.23 (1.05–1.44) | 1.12 (0.93–1.36) | 1.37 (1.07–1.75) | 0.95 (0.69–1.30) | |||||
| - 2409 vs 1204 | 1.34 (0.95–1.88) | 1.22 (0.82–1.80) | 1.42 (0.91–2.21) | 0.85 (0.48–1.51) | |||||
| IL-8 (pg/ml) | 0.040 | 0.020 | 0.053 | 0.030 | |||||
| - 14 vs 7 | 1.05 (0.87–1.27) | 0.97 (0.67–1.41) | 0.96 (0.77–1.21) | 0.94 (0.62–1.42) | |||||
| - 28 vs 14 | 1.01 (0.85–1.19) | 1.45 (0.94–2.22) | 0.78 (0.62–0.99) | 1.48 (0.89–2.44) | |||||
| IP-10 (pg/ml) | <0.001 | 0.176 | 0.059 | 0.537 | |||||
| - 3093 vs 1546 | 1.26 (1.09–1.44) | 1.44 (1.16–1.80) | 1.16 (0.87–1.55) | 1.30 (0.81–2.09) | |||||
| - 6186 vs 3093 | 1.39 (1.13–1.71) | 1.75 (1.26–2.44) | 1.33 (0.89–1.99) | 1.49 (0.78–2.87) | |||||
| IL-1RA (pg/ml) | 0.005 | 0.381 | 0.425 | 0.955 | |||||
| - 6434 vs 3217 | 1.17 (1.06–1.30) | 1.15 (0.97–1.36) | 1.24 (1.01–1.52) | 1.14 (0.80–1.63) | |||||
| - 12868 vs 6434 | 1.37 (1.06–1.77) | 1.70 (1.13–2.55) | 1.38 (0.93–2.05) | 1.45 (0.80–2.64) | |||||
| sCD163 (ng/ml) | 0.854 | 0.719 | 0.193 | 0.419 | |||||
| - 295 vs 147 | 0.96 (0.84–1.08) | 1.03 (0.85–1.25) | 0.85 (0.71–1.03) | 1.12 (0.81–1.55) | |||||
| - 589 vs 295 | 0.91 (0.69–1.22) | 1.03 (0.61–1.73) | 0.71 (0.50–1.00) | 0.80 (0.44–1.47) | |||||
| sTREM-1 (pg/ml) | 0.221 | 0.472 | 0.002 | 0.132 | |||||
| - 85 vs 42 | 0.75 (0.56–1.00) | 0.69 (0.41–1.16) | 0.48 (0.32–0.73) | 0.64 (0.36–1.16) | |||||
| - 169 vs 85 | 1.04 (0.84–1.28) | 0.78 (0.57–1.07) | 0.87 (0.69–1.10) | 0.62 (0.39–1.00) | |||||
| Ferritin (ng/ml) | 0.034 | 0.258 | 0.024 | 0.075 | |||||
| - 243 vs 122 | 1.13 (1.02–1.26) | 1.01 (0.85–1.19) | 1.17 (1.01–1.35) | 0.96 (0.76–1.23) | |||||
| - 487 vs 243 | 0.96 (0.77–1.20) | 0.76 (0.53–1.08) | 0.94 (0.71–1.25) | 0.67 (0.42–1.07) | |||||
| CRP (mg/l) | 0.747 | 0.622 | 0.662 | 0.448 | |||||
| - 28 vs 14 | 1.03 (0.96–1.12) | 0.97 (0.79–1.20) | 0.99 (0.89–1.10) | 0.84 (0.59–1.20) | |||||
| - 56 vs 28 | 1.02 (0.87–1.19) | 1.19 (0.92–1.54) | 0.96 (0.79–1.17) | 1.06 (0.75–1.49) |
-
Odds ratios are estimated at age of 10 and 25 years, represented as children and adults respectively; Poverall is derived from Wald test for the overall association of the biomarker with the endpoint; Pinteraction is from the test for the interaction between the biomarker and age.
Appendix 6—table 3
Results from models for hospitalization endpoint.
| Single models | Global model | ||||||||
|---|---|---|---|---|---|---|---|---|---|
| Children OR (95% CI) | Adults OR (95% CI) | Poverall | Pinteraction | Children OR (95% CI) | Adults OR (95% CI) | Poverall | Pinteraction | ||
| VCAM-1 (ng/ml) | <0.001 | 0.009 | 0.092 | 0.137 | |||||
| - 1636 vs 818 | 1.28 (1.11–1.49) | 1.28 (1.03–1.60) | 1.16 (0.90–1.48) | 1.28 (0.87–1.90) | |||||
| - 3272 vs 1636 | 1.42 (1.14–1.76) | 1.46 (1.08–1.97) | 1.16 (0.81–1.64) | 1.41 (0.84–2.37) | |||||
| SDC-1 (pg/ml) | <0.001 | 0.187 | 0.006 | 0.406 | |||||
| - 2519 vs 1260 | 1.82 (1.01–3.28) | 0.79 (0.31–2.05) | 1.70 (0.84–3.41) | 0.62 (0.16–2.49) | |||||
| - 5039 vs 2519 | 2.22 (1.36–3.63) | 1.81 (0.65–5.07) | 3.70 (1.90–7.22) | 1.66 (0.39–7.07) | |||||
| Ang-2 (pg/ml) | 0.012 | 0.337 | 0.497 | 0.789 | |||||
| - 1204 vs 602 | 1.27 (1.07–1.52) | 1.21 (0.91–1.62) | 1.27 (0.92–1.77) | 1.16 (0.76–1.77) | |||||
| - 2409 vs 1204 | 1.58 (1.08–2.32) | 1.61 (0.86–3.04) | 1.63 (0.90–2.93) | 1.45 (0.70–3.01) | |||||
| IL-8 (pg/ml) | 0.007 | 0.002 | 0.024 | 0.021 | |||||
| - 14 vs 7 | 1.14 (0.90–1.44) | 0.73 (0.47–1.15) | 0.94 (0.66–1.33) | 0.63 (0.36–1.13) | |||||
| - 28 vs 14 | 0.98 (0.81–1.18) | 1.32 (0.85–2.05) | 0.70 (0.50–0.97) | 1.59 (0.81–3.12) | |||||
| IP-10 (pg/ml) | 0.002 | 0.242 | 0.005 | 0.212 | |||||
| - 3093 vs 1546 | 1.32 (1.13–1.54) | 1.10 (0.86–1.40) | 0.80 (0.56–1.14) | 0.77 (0.45–1.30) | |||||
| - 6186 vs 3093 | 1.50 (1.18–1.90) | 1.17 (0.81–1.70) | 0.84 (0.51–1.40) | 0.66 (0.32–1.35) | |||||
| IL-1RA (pg/ml) | <0.001 | 0.685 | <0.001 | 0.389 | |||||
| - 6434 vs 3217 | 1.31 (1.17–1.46) | 1.13 (0.94–1.36) | 2.05 (1.57–2.66) | 1.18 (0.73–1.89) | |||||
| - 12868 vs 6434 | 1.41 (1.11–1.80) | 1.17 (0.79–1.72) | 2.25 (1.39–3.64) | 1.19 (0.62–2.28) | |||||
| sCD163 (ng/ml) | 0.208 | 0.722 | 0.007 | 0.419 | |||||
| - 295 vs 147 | 0.90 (0.79–1.04) | 0.98 (0.76–1.27) | 0.69 (0.53–0.89) | 0.96 (0.62–1.50) | |||||
| - 589 vs 295 | 0.69 (0.47–1.00) | 0.91 (0.46–1.82) | 0.49 (0.30–0.80) | 0.83 (0.36–1.91) | |||||
| sTREM-1 (pg/ml) | 0.635 | 0.371 | 0.011 | 0.053 | |||||
| - 85 vs 42 | 0.93 (0.67–1.29) | 1.35 (0.71–2.58) | 0.53 (0.34–0.81) | 1.74 (0.67–4.52) | |||||
| - 169 vs 85 | 0.89 (0.71–1.13) | 0.83 (0.54–1.28) | 0.55 (0.36–0.83) | 0.57 (0.26–1.29) | |||||
| Ferritin (ng/ml) | <0.001 | 0.011 | 0.129 | 0.117 | |||||
| - 243 vs 122 | 1.22 (1.08–1.38) | 0.92 (0.72–1.18) | 1.23 (1.02–1.49) | 0.91 (0.68–1.21) | |||||
| - 487 vs 243 | 1.40 (1.10–1.79) | 0.99 (0.68–1.46) | 1.25 (0.89–1.75) | 0.93 (0.54–1.59) | |||||
| CRP (mg/l) | 0.379 | 0.190 | 0.139 | 0.053 | |||||
| - 28 vs 14 | 0.97 (0.89–1.06) | 1.01 (0.83–1.24) | 0.97 (0.86–1.11) | 0.95 (0.71–1.27) | |||||
| - 56 vs 28 | 0.95 (0.78–1.15) | 1.35 (1.01–1.81) | 0.89 (0.69–1.15) | 1.37 (0.88–2.13) |
-
Odds ratios are estimated at age of 10 and 25 years, represented as children and adults respectively; Poverall is derived from Wald test for the overall association of the biomarker with the endpoint; Pinteraction is from the test for the interaction between the biomarker and age.
Appendix 7—table 1
Model selection frequencies for children.
| Model | Included variables | Count | Percent | |||||||||
|---|---|---|---|---|---|---|---|---|---|---|---|---|
| VCAM-1 | SDC-1 | Ang-2 | IL-8 | IP-10 | IL-1RA | sCD163 | sTREM-1 | Ferritin | CRP | |||
| 1 | + | + | + | + | + | | + | 134 | 13.4 | |||
| 2 | + | + | + | + | + | + | + | 100 | 10.0 | |||
| 3 | + | + | + | + | + | + | 55 | 5.5 | ||||
| 4 | + | + | + | + | + | 54 | 5.4 | |||||
| 5 | + | + | + | + | + | + | + | 48 | 4.8 | |||
| 6 | + | + | + | + | + | + | + | 47 | 4.7 | |||
| 7 | + | + | + | + | + | + | + | + | 46 | 4.6 | ||
| 8 | + | + | + | + | + | + | 40 | 4.0 | ||||
| 9 | + | + | + | + | + | + | + | 39 | 3.9 | |||
| 10 | + | + | + | + | + | + | + | + | 36 | 3.6 | ||
| 11 | + | + | + | + | + | + | + | + | 28 | 2.8 | ||
| 12 | + | + | + | + | + | + | + | 23 | 2.3 | |||
| 13 | + | + | + | + | + | + | 23 | 2.3 | ||||
| 14 | + | + | + | + | + | 17 | 1.7 | |||||
| 15 | + | + | + | + | + | + | + | + | 15 | 1.5 | ||
| 16 | + | + | + | + | + | + | + | 14 | 1.4 | |||
| 17 | + | + | + | + | + | + | 13 | 1.3 | ||||
| 18 | + | + | + | + | + | + | + | 12 | 1.2 | |||
| 19 | + | + | + | + | + | + | + | + | 12 | 1.2 | ||
| 20 | + | + | + | + | + | + | + | 11 | 1.1 | |||
-
Selected model is ranked first (bold face).
Appendix 7—table 2
Model stability for children.
| Initial model | Selected model | |||||||||
|---|---|---|---|---|---|---|---|---|---|---|
| Predictors | Estimate | Standard error | Estimate | Standard error | Bootstrap inclusion frequency (%) | RMSD ratio | Relative conditional bias (%) | Bootstrap median | Bootstrap 2.5th percentile | Bootstrap 97.5th percentile |
| (Intercept) | −20.6801 | 3.0499 | −19.1331 | 2.8649 | 100.0 | 1.1330 | −1.4929 | −20.3233 | −26.6990 | −14.0696 |
| IL-1RA | 0.7604 | 0.1443 | 0.7885 | 0.1386 | 100.0 | 1.2352 | 1.6338 | 0.7651 | 0.4408 | 1.1236 |
| Ang-2 | 0.5203 | 0.1542 | 0.5371 | 0.1457 | 98.2 | 1.1710 | 7.6528 | 0.5416 | 0.2268 | 0.8804 |
| IL-8 | −0.4250 | 0.1338 | −0.4290 | 0.1307 | 97.2 | 1.0597 | 4.5484 | −0.4341 | −0.6995 | 0 |
| Ferritin | 0.2951 | 0.1044 | 0.2923 | 0.1003 | 93.5 | 1.2233 | 11.1579 | 0.3118 | 0 | 0.5358 |
| IP-10 | −0.2145 | 0.1079 | −0.2598 | 0.0925 | 75.9 | 1.3272 | 32.1767 | −0.2398 | −0.4676 | 0 |
| SDC-1 | 0.5079 | 0.2487 | 0.4398 | 0.2302 | 73.5 | 1.2692 | 18.5555 | 0.4923 | 0 | 1.0035 |
| sCD163 | 0.1778 | 0.1433 | 45.8 | 1.1935 | 69.8797 | 0 | 0 | 0.4926 | ||
| VCAM-1 | −0.0500 | 0.0541 | 35.2 | 1.1525 | 125.6348 | 0 | −0.1763 | 0 | ||
| sTREM-1 | −0.0689 | 0.1375 | 20.0 | 0.9176 | 159.0696 | 0 | −0.3584 | 0.2162 | ||
| CRP | 0.0438 | 0.0712 | 19.2 | 0.8804 | 173.2343 | 0 | 0 | 0.1754 | ||
-
RMSD: root mean squared difference.
Appendix 7—table 3
Model selection frequencies for adults.
| Model | Included variables | Count | Percent | |||||||||
|---|---|---|---|---|---|---|---|---|---|---|---|---|
| VCAM-1 | SDC-1 | Ang-2 | IL-8 | IP-10* | IL-1RA | sCD163 | sTREM-1 | Ferritin | CRP | |||
| 1 | + | + | + | + | + | + | + | 79 | 7.9 | |||
| 2 | + | + | + | + | + | + | + | + | 55 | 5.5 | ||
| 3 | + | + | + | + | + | + | + | 36 | 3.6 | |||
| 4 | + | + | + | + | + | 33 | 3.3 | |||||
| 5 | + | + | + | + | + | 30 | 3.0 | |||||
| 6 | + | + | + | + | + | + | + | + | 29 | 2.9 | ||
| 7 | + | + | + | + | + | + | 26 | 2.6 | ||||
| 8 | + | + | + | + | 25 | 2.5 | ||||||
| 9 | + | + | + | + | + | + | 24 | 2.4 | ||||
| 10 | + | + | + | + | + | + | + | 20 | 2.0 | |||
| 11 | + | + | + | + | + | + | + | 20 | 2.0 | |||
| 12 | + | + | + | + | + | + | + | + | + | 20 | 2.0 | |
| 13 | + | + | + | + | + | + | + | 19 | 1.9 | |||
| 14 | + | + | + | + | + | + | 17 | 1.7 | ||||
| 15 | + | + | + | + | 16 | 1.6 | ||||||
| 16 | + | + | + | + | 16 | 1.6 | ||||||
| 17 | + | + | + | + | + | 16 | 1.6 | |||||
| 18 | + | + | + | + | + | 16 | 1.6 | |||||
| 19 | + | + | + | + | + | + | 16 | 1.6 | ||||
| 20 | + | + | + | + | + | + | 15 | 1.5 | ||||
-
*Variable is kept as non-linear effect using natural cubic splines with three knots.
Selected model is ranked first (bold face).
Appendix 7—table 4
Model stability for adults.
| Initial model | Selected model | |||||||||
|---|---|---|---|---|---|---|---|---|---|---|
| Predictors | Estimate | Standard error | Estimate | Standard error | Bootstrap inclusion frequency (%) | RMSD ratio | Relative conditional bias (%) | Bootstrap median | Bootstrap 2.5th percentile | Bootstrap 97.5th percentile |
| (Intercept) | −16.6085 | 3.2632 | −16.6780 | 3.2475 | 100.0 | 1.3263 | 2.0586 | −16.7262 | −26.4755 | −9.8095 |
| SDC-1 | 1.1524 | 0.2708 | 1.1740 | 0.2607 | 99.2 | 1.2745 | 3.0018 | 1.1767 | 0.5450 | 1.8615 |
| IL-8 | 0.5473 | 0.1427 | 0.5544 | 0.1411 | 98.9 | 1.2973 | 5.8880 | 0.5739 | 0.2490 | 0.9520 |
| Ferritin | −0.2785 | 0.0916 | −0.2682 | 0.0883 | 94.6 | 1.2479 | 7.9330 | −0.2845 | −0.5012 | 0 |
| sTREM-1 | −0.2961 | 0.1499 | −0.2864 | 0.1492 | 66.5 | 1.4191 | 28.1687 | −0.2807 | −0.6448 | 0 |
| IL-1RA | 0.2582 | 0.1583 | 0.2557 | 0.1427 | 62.3 | 1.4788 | 54.9829 | 0.2494 | 0 | 0.7255 |
| IP-10 (ns1)* | −1.4427 | 1.0592 | −0.8269 | 0.6118 | 59.8 | 1.6064 | 36.8995 | −0.2108 | −5.2628 | 0.7003 |
| IP-10 (ns2)* | −0.1027 | 0.5763 | 0.1139 | 0.4976 | 59.8 | 1.2060 | 43.1473 | 0 | −1.7021 | 1.2589 |
| sCD163 | 0.2056 | 0.1287 | 0.2351 | 0.1253 | 59.1 | 1.3333 | 51.3932 | 0.2148 | 0 | 0.4989 |
| CRP | 0.0863 | 0.0990 | 36.3 | 1.1203 | 129.8186 | 0 | 0 | 0.3048 | ||
| VCAM-1 | 0.0660 | 0.0685 | 35.4 | 1.3808 | 98.3111 | 0 | −0.0923 | 0.2714 | ||
| Ang-2 | −0.0246 | 0.1193 | 21.8 | 1.0047 | 62.8642 | 0 | −0.2792 | 0.3008 | ||
-
*As IP-10 is kept as non-linear effect using natural cubic splines with three knots, there are two terms of this variable in the model.
RMSD: root mean squared difference.
Appendix 8—table 1
Results from models for severe/moderate dengue including viremia as a potential biomarker.
| Single models | Global model | ||||||||
|---|---|---|---|---|---|---|---|---|---|
| Children OR (95% CI) | Adults OR (95% CI) | Poverall | Pinteraction | Children OR (95% CI) | Adults OR (95% CI) | Poverall | Pinteraction | ||
| VCAM-1 (ng/ml) | <0.001 | 0.715 | 0.286 | 0.136 | |||||
| - 1636 vs 818 | 1.20 (1.04–1.38) | 1.35 (1.15–1.58) | 0.94 (0.76–1.17) | 1.34 (1.03–1.74) | |||||
| - 3272 vs 1636 | 1.25 (1.02–1.53) | 1.48 (1.19–1.85) | 0.93 (0.69–1.24) | 1.45 (1.02–2.04) | |||||
| SDC-1 (pg/ml) | <0.001 | 0.088 | 0.005 | 0.645 | |||||
| - 2519 vs 1260 | 2.67 (1.31–5.43) | 3.33 (1.32–8.42) | 2.07 (0.78–5.47) | 4.28 (1.27–14.43) | |||||
| - 5039 vs 2519 | 1.71 (1.18–2.47) | 3.71 (2.09–6.58) | 1.71 (0.95–3.09) | 2.55 (1.17–5.57) | |||||
| Ang-2 (pg/ml) | <0.001 | 0.524 | 0.060 | 0.070 | |||||
| - 1204 vs 602 | 1.64 (1.39–1.94) | 1.51 (1.26–1.82) | 1.62 (1.19–2.20) | 0.97 (0.71–1.34) | |||||
| - 2409 vs 1204 | 2.21 (1.58–3.10) | 2.00 (1.40–2.85) | 1.92 (1.22–3.01) | 0.96 (0.61–1.49) | |||||
| IL-8 (pg/ml) | <0.001 | <0.001 | <0.001 | <0.001 | |||||
| - 14 vs 7 | 1.42 (1.05–1.91) | 2.18 (1.47–3.24) | 0.89 (0.61–1.31) | 1.60 (0.99–2.59) | |||||
| - 28 vs 14 | 0.99 (0.78–1.25) | 2.33 (1.63–3.33) | 0.52 (0.36–0.77) | 1.96 (1.28–3.02) | |||||
| IP-10 (pg/ml) | <0.001 | 0.984 | 0.150 | 0.500 | |||||
| - 3093 vs 1546 | 1.46 (1.26–1.68) | 1.45 (1.21–1.73) | 0.93 (0.73–1.19) | 0.75 (0.53–1.06) | |||||
| - 6186 vs 3093 | 1.68 (1.35–2.09) | 1.69 (1.29–2.22) | 1.07 (0.76–1.50) | 0.75 (0.47–1.20) | |||||
| IL-1RA (pg/ml) | <0.001 | 0.082 | <0.001 | 0.062 | |||||
| - 6434 vs 3217 | 1.69 (1.42–2.03) | 1.48 (1.21–1.81) | 1.97 (1.42–2.73) | 1.40 (0.93–2.09) | |||||
| - 12868 vs 6434 | 1.82 (1.46–2.27) | 1.70 (1.29–2.24) | 2.03 (1.41–2.92) | 1.38 (0.87–2.19) | |||||
| sCD163 (ng/ml) | <0.001 | 0.551 | 0.124 | 0.289 | |||||
| - 295 vs 147 | 1.57 (1.14–2.15) | 1.49 (1.13–1.98) | 1.51 (0.94–2.42) | 1.30 (0.86–1.98) | |||||
| - 589 vs 295 | 1.46 (1.10–1.93) | 1.61 (1.09–2.37) | 1.24 (0.88–1.73) | 1.44 (0.91–2.28) | |||||
| sTREM-1 (pg/ml) | 0.059 | 0.997 | 0.745 | 0.594 | |||||
| - 85 vs 42 | 1.87 (1.23–2.84) | 1.79 (1.10–2.93) | 1.16 (0.71–1.91) | 1.24 (0.65–2.36) | |||||
| - 169 vs 85 | 1.12 (0.91–1.38) | 1.12 (0.82–1.53) | 0.92 (0.67–1.27) | 0.67 (0.41–1.10) | |||||
| Ferritin (ng/ml) | 0.042 | 0.054 | 0.007 | 0.002 | |||||
| - 243 vs 122 | 1.18 (1.01–1.38) | 1.06 (0.89–1.27) | 1.32 (1.04–1.67) | 0.77 (0.60–0.98) | |||||
| - 487 vs 243 | 1.26 (1.00–1.58) | 0.90 (0.66–1.23) | 1.22 (0.89–1.68) | 0.64 (0.42–0.98) | |||||
| CRP (mg/l) | <0.001 | 0.031 | 0.185 | 0.113 | |||||
| - 28 vs 14 | 1.26 (1.12–1.41) | 1.25 (1.03–1.52) | 1.06 (0.91–1.23) | 1.09 (0.84–1.43) | |||||
| - 56 vs 28 | 1.13 (0.95–1.34) | 1.38 (1.11–1.71) | 0.89 (0.72–1.11) | 1.35 (1.01–1.81) | |||||
| Log-10 viremia (copies/ml) | <0.001 | 0.747 | 0.040 | 0.886 | |||||
| - 7.5 vs 6.5 | 1.34 (1.18–1.53) | 1.33 (1.16–1.53) | 1.21 (1.03–1.42) | 1.25 (1.04–1.51) | |||||
| - 8.5 vs 7.5 | 1.53 (1.25–1.87) | 1.48 (1.16–1.88) | 1.35 (1.05–1.74) | 1.43 (1.05–1.95) |
-
Odds ratios are estimated at age of 10 and 25 years, represented as children and adults respectively; Poverall is derived from Wald test for the overall association of the biomarker with the endpoint; Pinteraction is from the test for the interaction between the biomarker and age.
Appendix 8—table 2
Best combinations of biomarkers associated with severe or moderate dengue for children.
| Best of all combinations | Best combination of 2 variables | Best combination of 3 variables | Best combination of 4 variables | Best combination of 5 variables | |
|---|---|---|---|---|---|
| Variables | |||||
| - VCAM-1 | |||||
| - SDC-1 | + | ||||
| - Ang-2 | + | + | + | + | |
| - IL-8 | + | + | |||
| - IP-10 | + | + | + | ||
| - IL-1RA | + | + | + | + | + |
| - sCD163 | |||||
| - sTREM-1 | |||||
| - Ferritin | + | + | + | + | + |
| - CRP | |||||
| - Viremia | |||||
| AIC of the selected model | 465.9 | 484.7 | 480.0 | 473.7 | 467.6 |
-
VCAM-1: vascular cell adhesion molecule-1; SDC-1: syndecan-1; Ang-2: angiopoietin-2; IL-8: interleukin-8; IP-10: interferon gamma-induced protein-10; IL-1RA: interleukin-1 receptor antagonist; sCD163: soluble cluster of differentiation 163; sTREM-1: soluble triggering receptor expressed on myeloid cells-1; CRP: C-reactive protein; AIC: Akaike information criterion.
Appendix 8—table 3
Best combinations of biomarkers associated with severe or moderate dengue for adults.
| Best of all combinations | Best combination of 2 variables | Best combination of 3 variables | Best combination of 4 variables | Best combination of 5 variables | |
|---|---|---|---|---|---|
| Variables | |||||
| - VCAM-1 | |||||
| - SDC-1 | + | + | + | + | + |
| - Ang-2 | |||||
| - IL-8 | + | + | + | + | + |
| - IP-10* | |||||
| - IL-1RA | |||||
| - sCD163 | + | + | |||
| - sTREM-1 | |||||
| - Ferritin | + | + | + | + | |
| - CRP | |||||
| - Viremia | + | + | + | ||
| AIC of the selected model | 426.4 | 441.1 | 434.2 | 428.5 | 426.4 |
-
VCAM-1: vascular cell adhesion molecule-1; SDC-1: syndecan-1; Ang-2: angiopoietin-2; IL-8: interleukin-8; IP-10: interferon gamma-induced protein-10; IL-1RA: interleukin-1 receptor antagonist; sCD163: soluble cluster of differentiation 163; sTREM-1: soluble triggering receptor expressed on myeloid cells-1; CRP: C-reactive protein; AIC: Akaike information criterion.
*Variable is kept as non-linear effect using natural cubic splines with three knots.
Appendix 9—table 1
Results of variable selection for children.
| VCAM-1 | SDC-1 | Ang-2 | IL-8 | IP-10 | IL-1RA | sCD163 | sTREM-1 | Ferritin | CRP | |
|---|---|---|---|---|---|---|---|---|---|---|
| Best subset | + | + | + | + | + | + | ||||
| Backward elimination | + | + | + | + | + | + | ||||
| Forward selection | + | + | + | + | + | + | ||||
| Stepwise forward | + | + | + | + | + | + | ||||
| Stepwise backward | + | + | + | + | + | + | ||||
| Augmented backward elimination | + | + | + | + | + | + | + | |||
| Bayesian projection | + | + | + | + | + |
Appendix 9—table 2
Results of variable selection for adults.
| VCAM-1 | SDC-1 | Ang-2 | IL-8 | IP-10* | IL-1RA | sCD163 | sTREM-1 | Ferritin | CRP | |
|---|---|---|---|---|---|---|---|---|---|---|
| Best subset | + | + | + | + | + | + | + | |||
| Backward elimination | + | + | + | + | + | + | + | |||
| Forward selection | + | + | + | + | + | |||||
| Stepwise forward | + | + | + | + | + | |||||
| Stepwise backward | + | + | + | + | + | + | + | |||
| Augmented backward elimination | + | + | + | + | + | + | + | + | ||
| Bayesian projection | + | + |
-
*Variable is kept as non-linear effect using natural cubic splines with three knots.
Additional files
Download links
A two-part list of links to download the article, or parts of the article, in various formats.
Downloads (link to download the article as PDF and Executable version)
Open citations (links to open the citations from this article in various online reference manager services)
Cite this article (links to download the citations from this article in formats compatible with various reference manager tools)
Combination of inflammatory and vascular markers in the febrile phase of dengue is associated with more severe outcomes
eLife 10:e67460.
https://doi.org/10.7554/eLife.67460


