SORBS2 is a genetic factor contributing to cardiac malformation of 4q deletion syndrome patients
- Neonatal Intensive Care Unit, Shanghai Pediatric Congenital Heart Disease Institute and Pediatric Translational Medicine Institute, Shanghai Children’s Medical Center, Shanghai Jiao Tong University School of Medicine, China
- Shanghai Pediatric Congenital Heart Disease Institute and Pediatric Translational Medicine Institute, Shanghai Children’s Medical Center, Shanghai Jiao Tong University School of Medicine, China
- Shanghai Key Laboratory of Clinical Molecular Diagnostics for Pediatrics, Pediatric Translational Medicine Institute, Shanghai Children’s Medical Center, Shanghai Jiao Tong University School of Medicine, China
- Key Laboratory of Pediatric Hematology and Oncology Ministry of Health and Pediatric Translational Medicine Institute, Shanghai Children’s Medical Center, Shanghai Jiao Tong University School of Medicine, China
- Department of thoracic and cardiac surgery, Shanghai Children’s Medical Center, Shanghai Jiao Tong University School of Medicine, China
Figures
Figure 1 with 4 supplements

SORBS2 has a dual role in cardiogenesis.
(A) Flow cytometry analysis of cardiomyocytes at differentiation day 15 (D15). P3 indicates cTnT+ population. (B) Quantification of cTnT+ cells (n = 3). **p<0.01; two-tailed Student’s t test. (C) Immunostaining of D30 cells with anti-cardiac troponin I (cTnI, red) and anti-α-actinin (green) antibodies. Boxed areas are magnified in the lower panels. (D) Quantification of cardiomyocytes with well-organized sarcomeres (control: n = 211, SORBS2-knockdown: n = 197). **p<0.01; two-tailed Student’s t test. (E) qPCR quantification of SORBS2 expression dynamics (n = 3 for each time point). **p<0.01; two-tailed Student’s t test. (F–H) qPCR quantification of second heart field (SHF) progenitor marker expression at different time points (n = 3 for each time point). *p<0.05, **p<0.01; two-tailed Student’s t test. (I) Volcano plot illustrates the differential gene expression from D5 RNA-seq data. Pink, down-regulated genes. Blue, up-regulated genes. (|log2(fold change)|>1 and padj <0.05). FC, fold change. (J, K) Gene ontology (GO) analysis of differentially expressed genes. Up-regulated pathways (J). Down-regulated pathways (K). DEGs, differentially expressed genes. (L) Heatmap illustrating gene expression changes of critical signaling pathways. Color tints correspond to expression levels. *padj <0.05. **padj <0.01. ***padj <0.001. (M) Western blot quantification of c-ABL expression on D5 cell lyses (n = 3). *p<0.05; two-tailed Student’s t test. (N) Western blot quantification of NOTCH1 expression on D5 cell lyses (n = 3). **p<0.01; two-tailed Student’s t test. (O) qPCR quantification analyses of SHH signaling target genes and SHF marker expression at D5 (n = 3 for each group). *p<0.05, **p<0.01; two-tailed Student’s t test. (P) Representative images of immunofluorescent staining of D15 cells with anti-cardiac troponin T(cTnT, green) antibody. (Q) Quantification of cTnT+ cells (n = 6). **p<0.01; two-tailed Student’s t test.
Figure 1—figure supplement 1
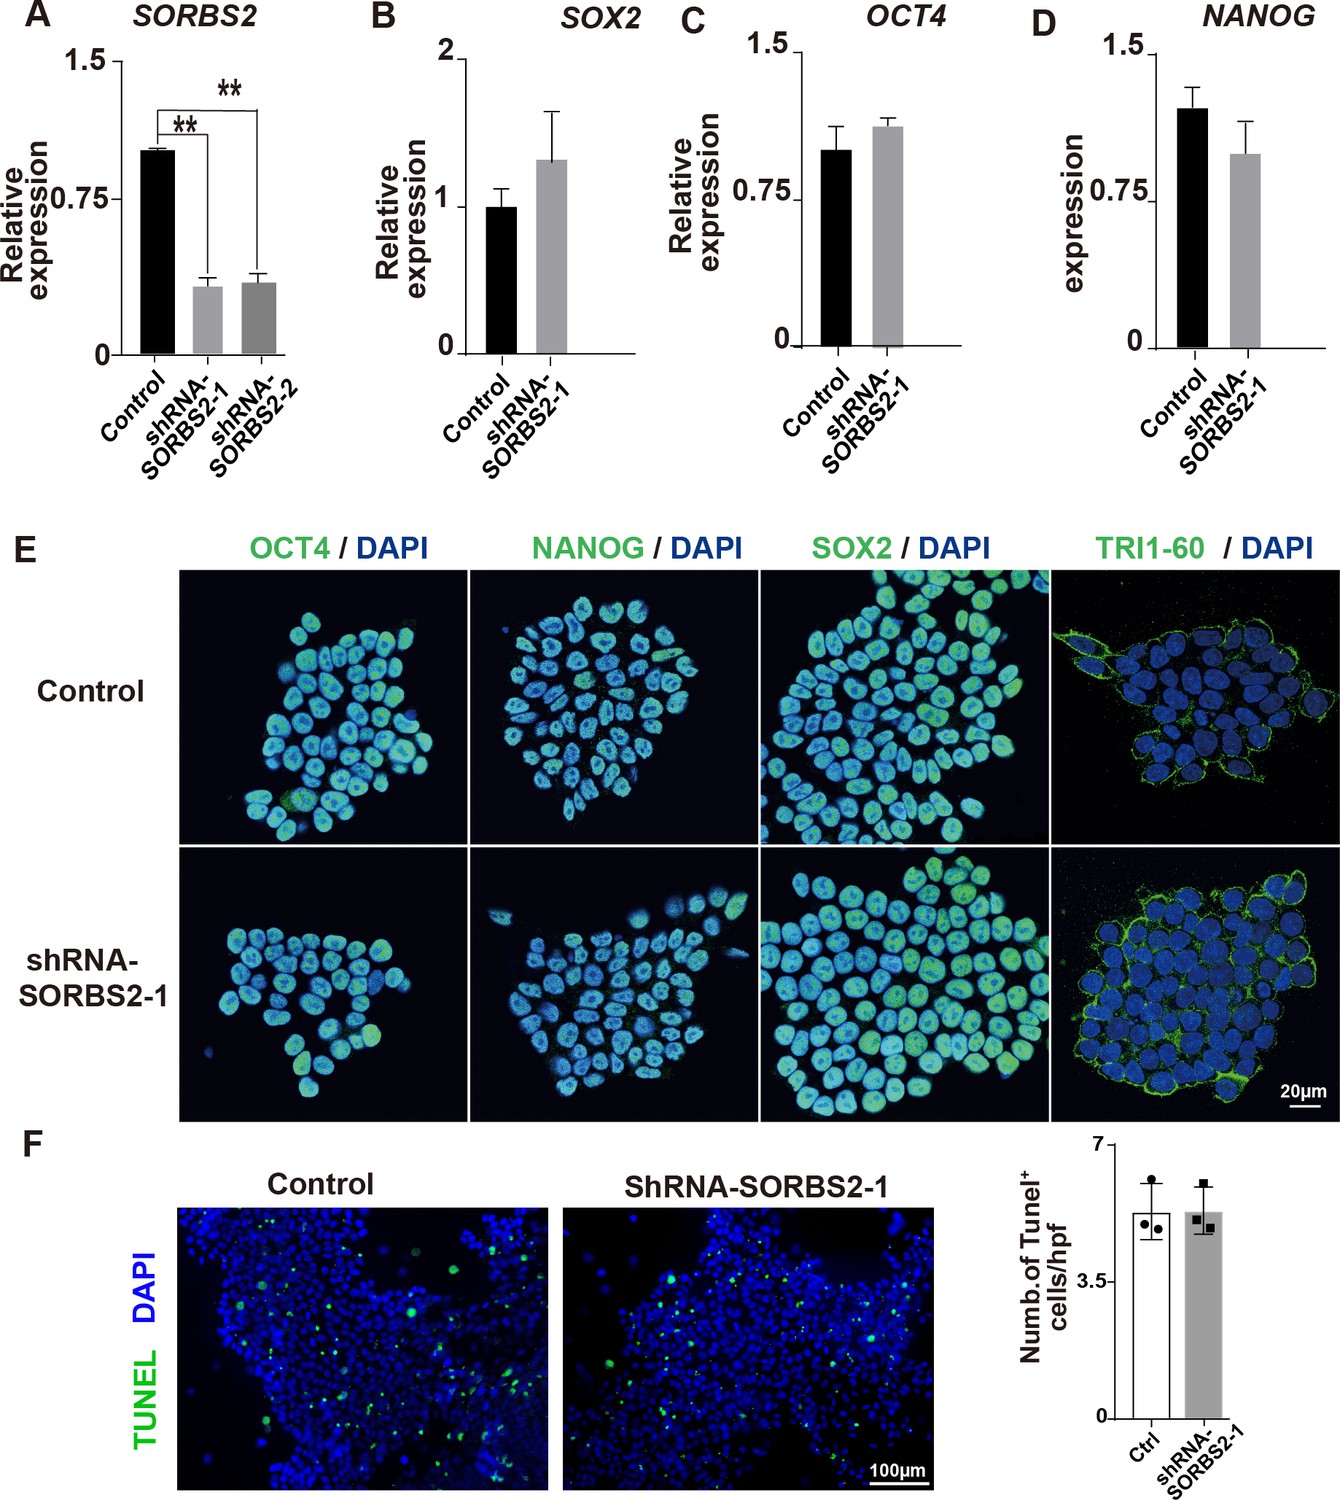
Characterization of shRNA-SORBS2 hESCs.
(A) Quantification of SORBS2 expression level in shRNA-SORBS2 human embryonic stem cells (hESCs) (n = 3). **p<0.01; two-tailed Student’s t test. (B–D) Quantification of pluripotential marker expression (n = 3). Two-tailed Student’s t test. (E) Immunostaining of hESCs with anti-NANOG, anti-OCT4, anti-SOX2, and anti-TRI1-60 antibodies (green). (F) Representative image of terminal deoxynucleotidyl transferase dUTP nick end labeling (TUNEL) staining of hESCs and quantification. Hpf, high-power field.
Figure 1—figure supplement 2
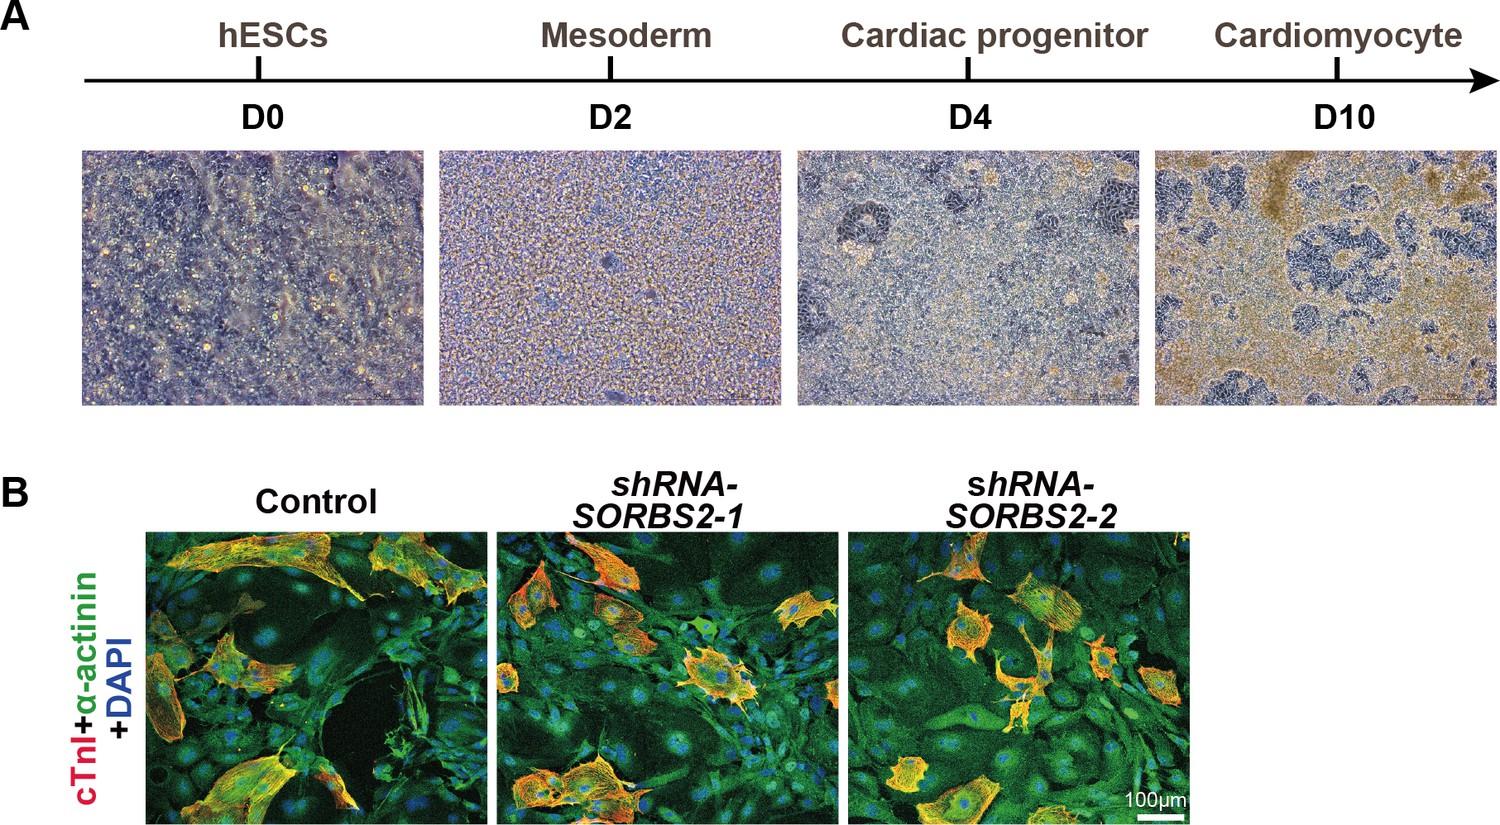
In vitro cardiogenesis from hESCs.
(A) Cell morphological transition during cardiomyocyte differentiation. (B) Immunostaining of D30 cells with anti-cardiac troponin I (cTnI, red) and anti-α-actinin (green) antibodies.
Figure 1—figure supplement 3
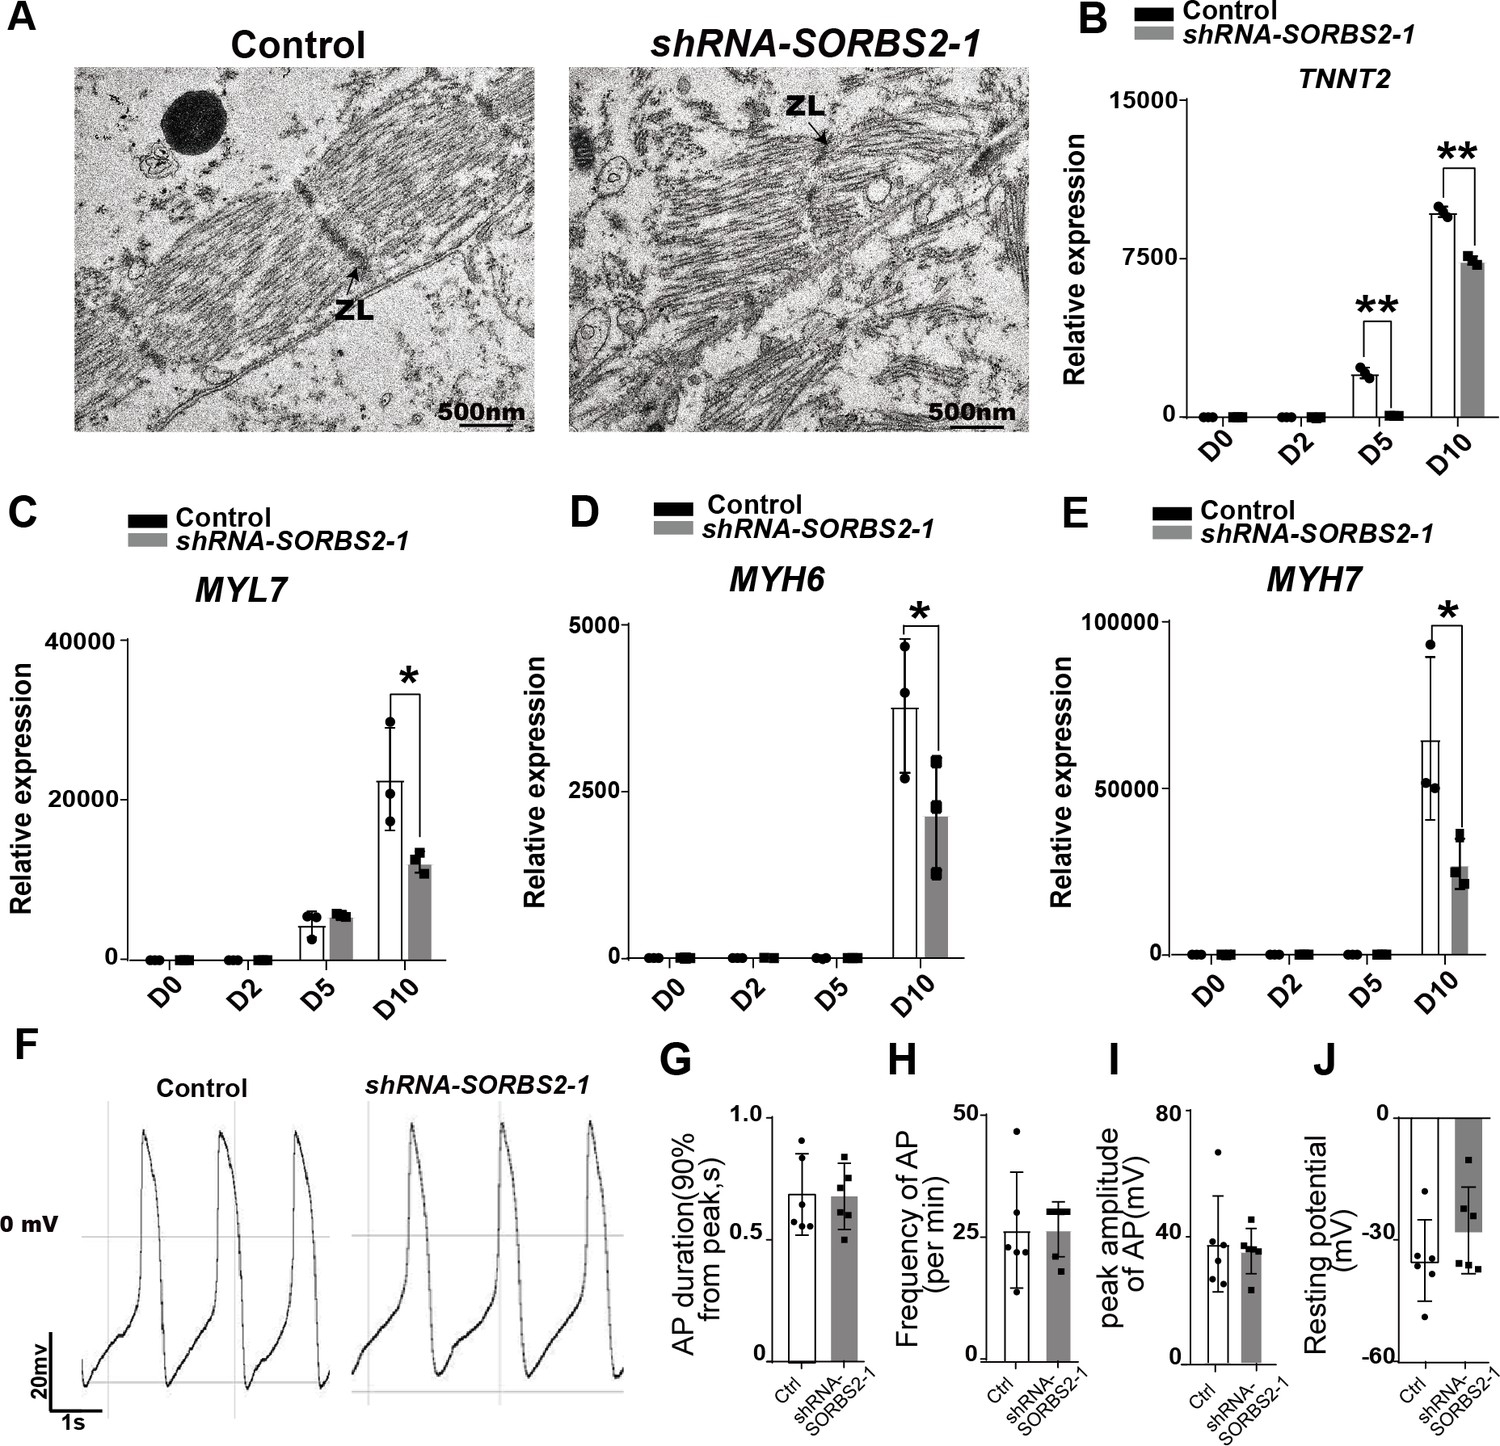
Cardiomyocyte defects in SORBS2-knockdown cells.
(A) Transmission electron microscopy images of D30 cardiomyocytes. ZL, Z line. (B–E) qPCR quantificaiton of cardiomyocyte marker expression at different differentiation time points (n = 3 for each time point). *p<0.05, **p<0.01; two-tailed Student’s t test. (F) Representative action potentials of human embryonic stem cell (hESC)-derived ventricular-like cardiomyocytes. (G–J) Quantification of action potential parameters of ventricular-like cardiomyocytes (control, n = 6; SORBS2-knockdown, n = 6). Frequency (G), action potential duration (H), the peak amplitude (I), and the resting membrane potential (J).
Figure 1—figure supplement 4

Molecular profiling of SORBS2-knockdown hESC-derived mesoderm and cardiac progenitors.
(A–B) qPCR quantification of mesoderm marker expression at different differentiation time points (n = 3). Two-tailed Student’s t test. (C–E) qPCR quantification of cardiac progenitor marker expression at different differentiation time points (n = 3). *p<0.05, **p<0.01; two-tailed Student’s t test. (F–G) qPCR verification of differentially expressed genes in RNA-seq (n = 3). *p<0.05, **p<0.01; two-tailed Student’s t test.
Figure 2
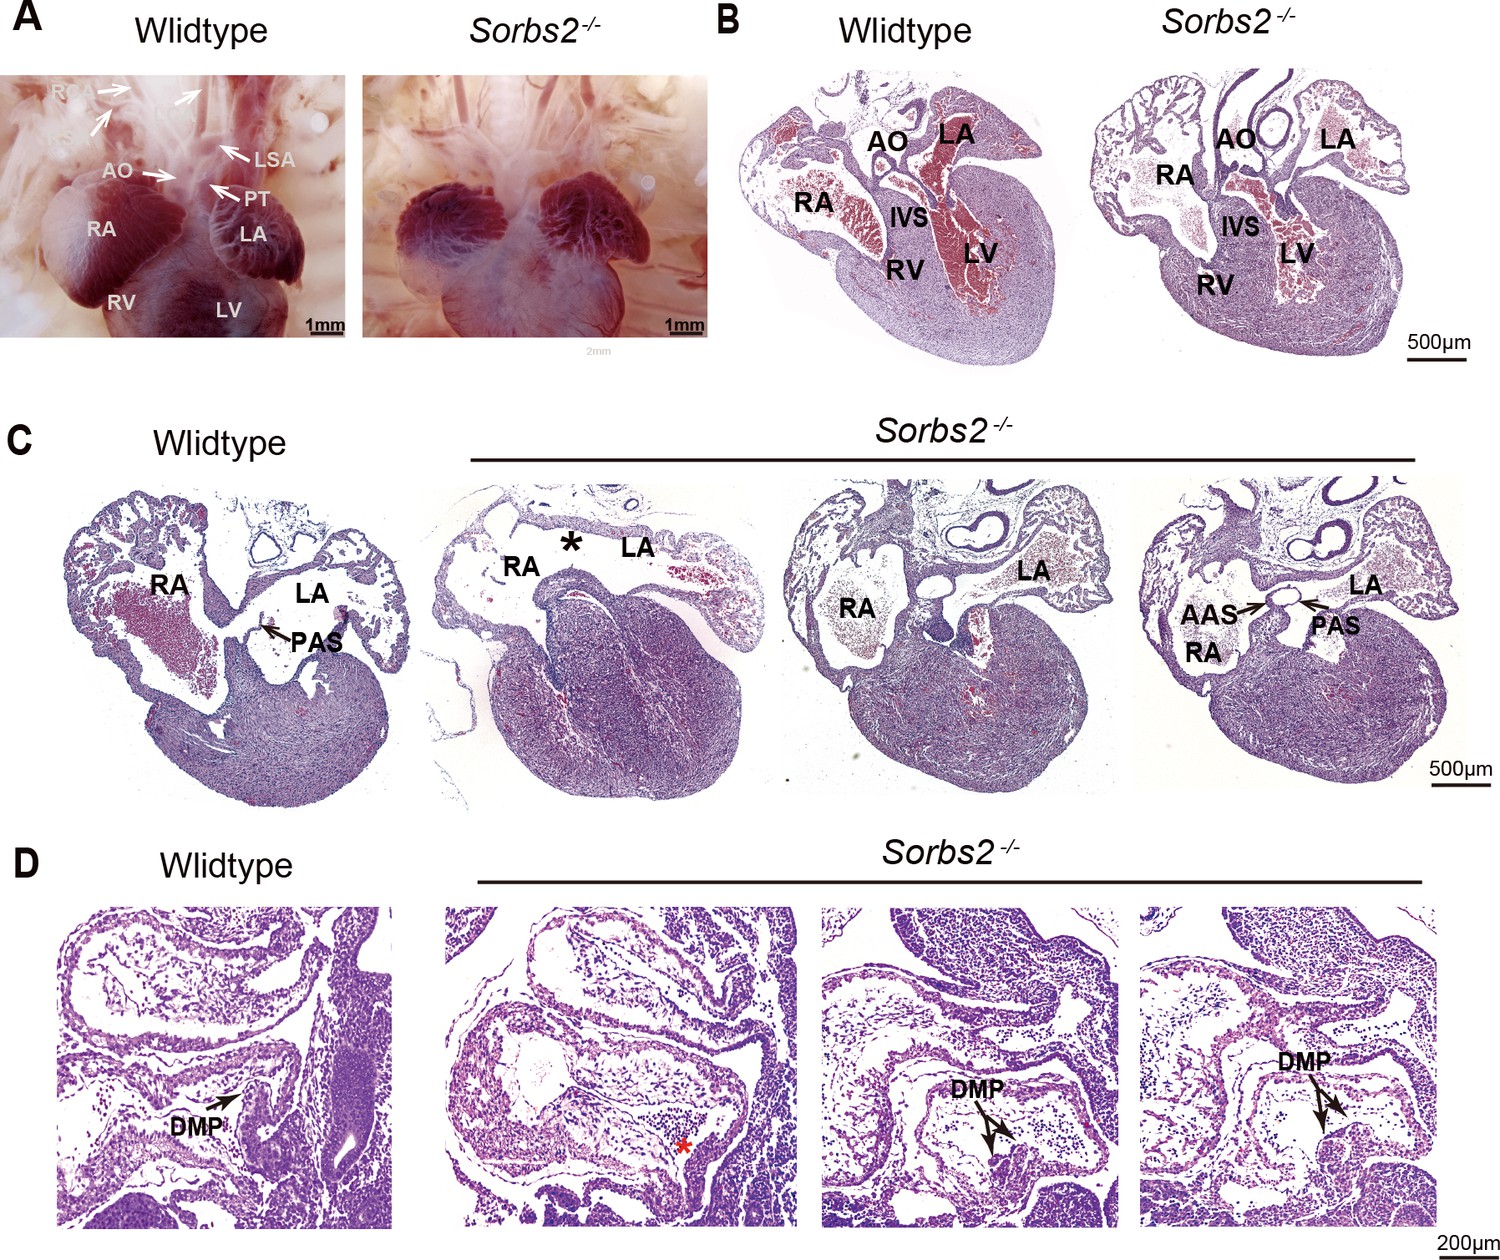
Cardiac phenotype of Sorbs2-/- mice.
(A) Gross view of embryos at E18.5. (B) Hematoxylin and eosin (HE)-stained paraffin sections of E18.5 hearts in conotruncal area. (C) HE-stained paraffin sections of E18.5 heart in atrial septum area. Asterisk indicates the absence of PAS. Two sections in the right are from the same heart with double atrial septum. The rightmost section is dorsal to the other. (D) HE-stained paraffin sections of E10.5 embryos. Arrow indicates DMP in the atria. Red asterisk indicates hypoplastic DMP in Sorbs2-/- embryos. Double-headed arrow indicates a duplicated DMP in an Sorbs2-/- embryo. Two sections in the right are from the same embryo with duplicated DMP. The rightmost section is lateral to the other. AO, aorta. PT, pulmonary trunk. LSA, left subclavian artery. RSA, right subclavian artery. LCA, left common carotid artery. RCA, right common carotid artery. LA, left atrium. RA, right atrium. LV, left ventricle. RV, right ventricle. PAS, primary atrial septum. AAS, accessory atrial septum. IVS, interventricular septum. DMP, dorsal mesenchymal protrusion.
Figure 3 with 1 supplement
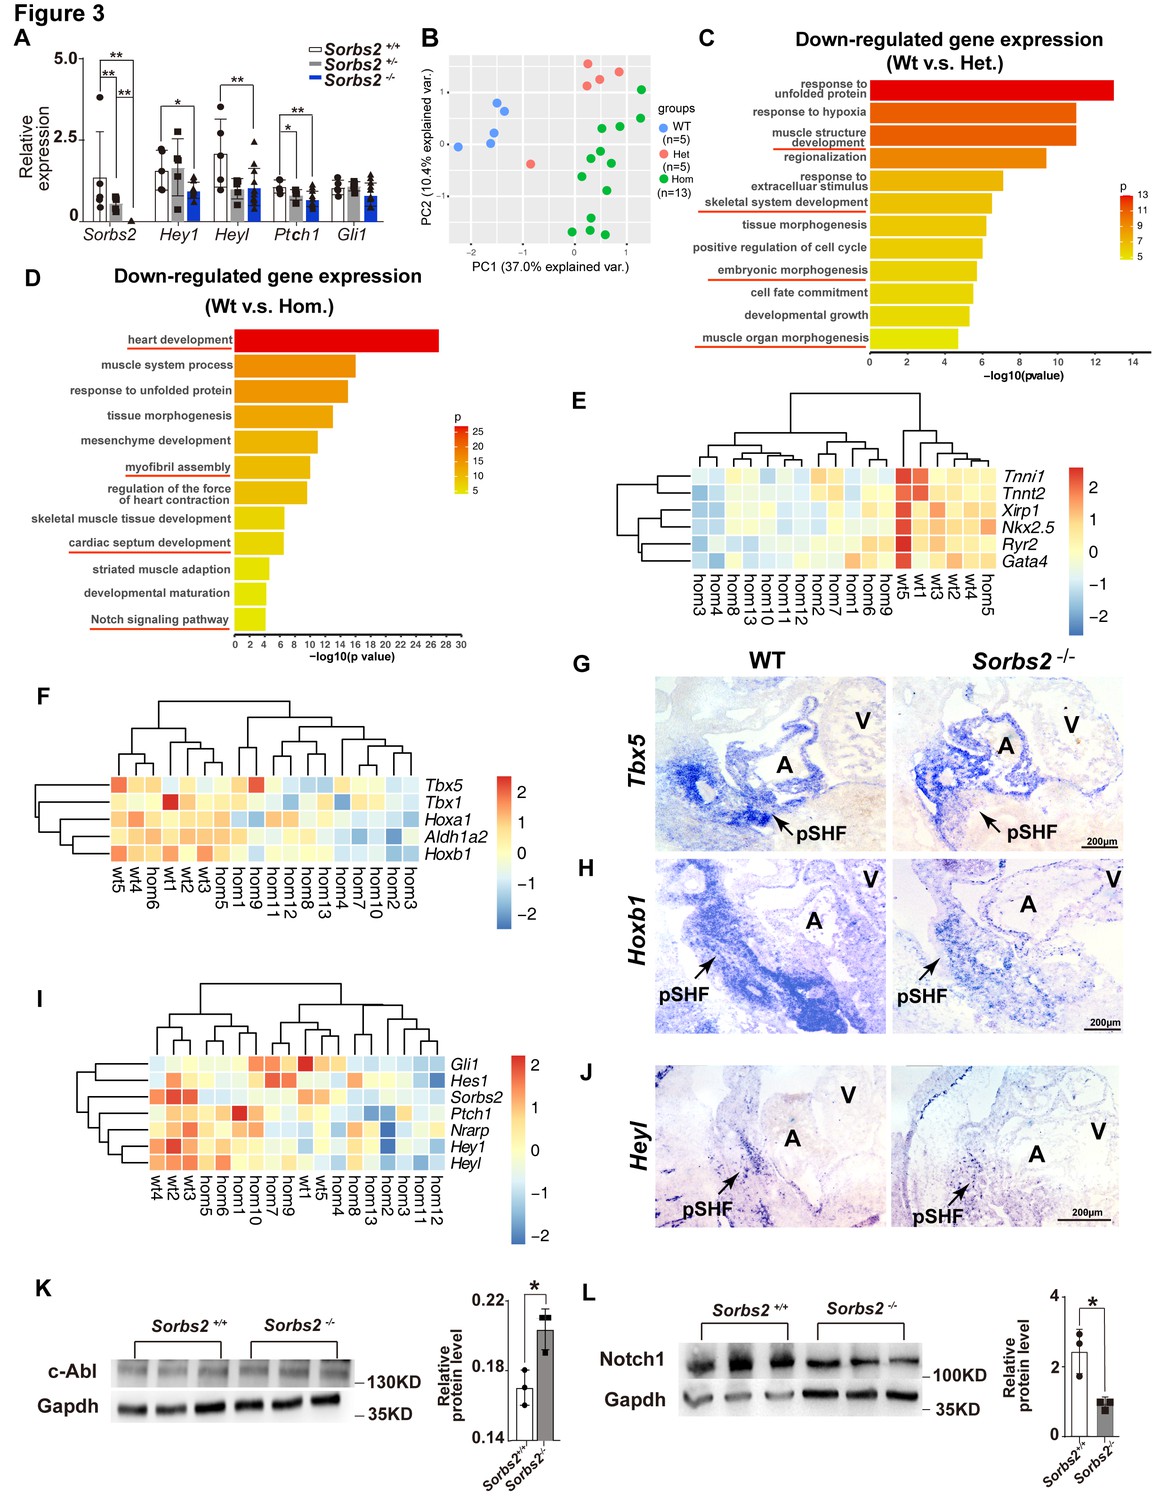
Molecular changes in Sorbs2 mutants.
(A) qPCR quantification of Sorbs2, Hey1, Heyl, Ptch1, and Gli1 expression (n = 5 for wild-type and heterozygous groups, n = 13 for homozygous group). **p<0.01, *p<0.05; two-tailed Student’s t test. (B) Principal component analysis (PCA) plot of RNA-seq data shows sample clustering according to genotypes. (C) Gene ontology (GO) analysis of genes down-regulated in heterozygous mutants (Het). (D) GO analysis of genes down-regulated in homozygous mutants (Hom). (E) Hierarchical heatmap of cardiac genes. (F) Hierarchical heatmap of posterior second heart field (SHF) markers. (G) RNA in situ hybridization of Tbx5 on E10.5 embryos. (H) RNA in situ hybridization of Hoxb1 on E10.5 embryos. (I) Hierarchical heatmap of Notch and Shh signaling genes. (J) RNA in situ hybridization of Heyl probe on E10.5 embryos. (K) Western blot quantification of c-Abl expression in E10 embryos. *p<0.05; two-tailed Student’s t test. (L) Western blot quantification of Notch1 expression in E10.5 embryos. *p<0.05; two-tailed Student’s t test. pSHF, posterior second heart field.
Figure 3—figure supplement 1
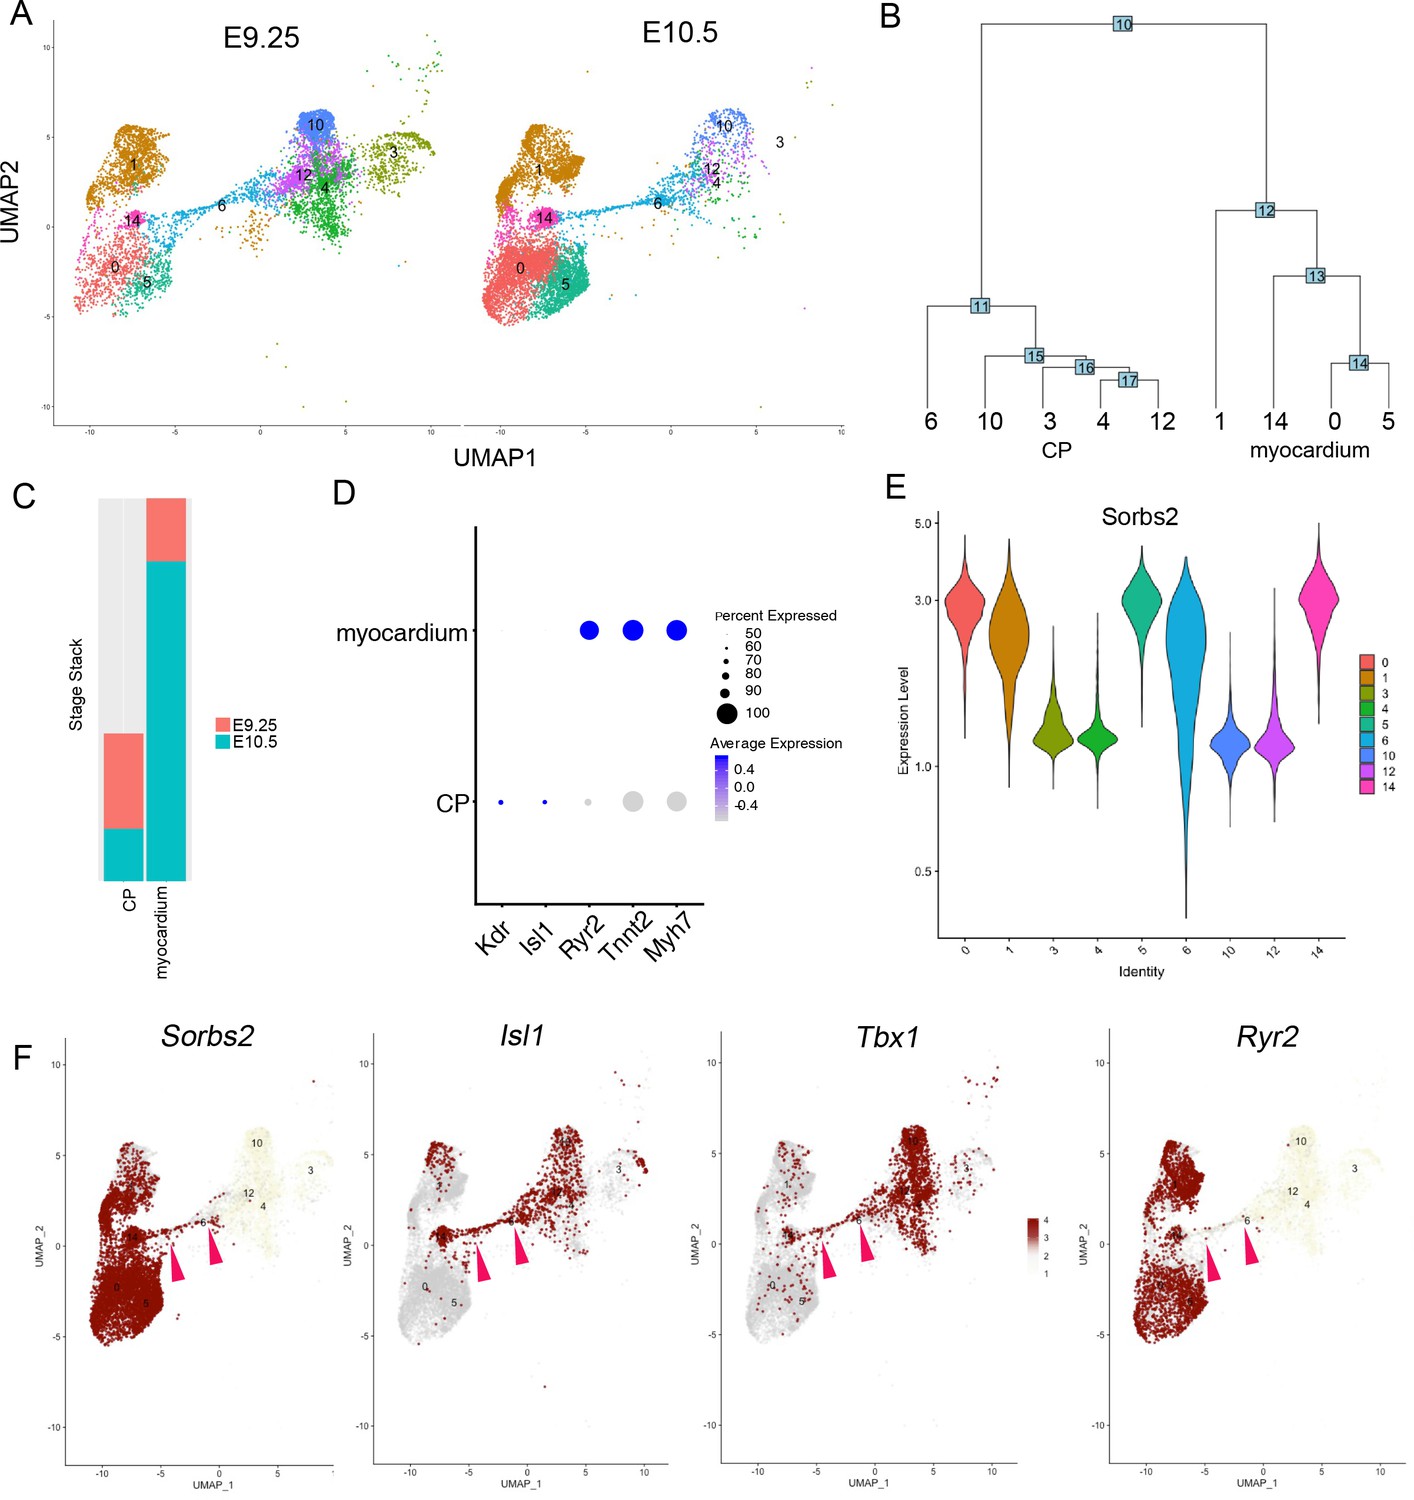
scRNA-seq analysis of Sorbs expression pattern in embryonic hearts.
(A) Clustering analysis of single-cell transcriptomic profiles from E9.25 to E10.5 mouse embryonic hearts. Myocardium and cardiac progenitor (CP) cells were plotted in uniform manifold approximation and projection (UMAP). (B) Subgroups ordered in a phylogenetic tree. Subgroups were grouped into two populations, myocardium and cardiac progenitors. (C) Stack plot showing relative cell number grouped by developmental stages. (D) Dot plot showing marker gene expressions in myocardium and CP. (E) Sorbs2-expressing cells during heart development. A subgroup of Sorbs2-expressing cells is CP (subgroup 6). (F) Sorbs2 expression level in each subgroup. Sorbs2-expressing cells are located within CP subgroup 6, which also expresses Isl1 and Tbx1. Pink arrowheads indicate CP subgroup 6. Ryr2-expressing cells are cardiomyocytes.
Figure 4 with 1 supplement
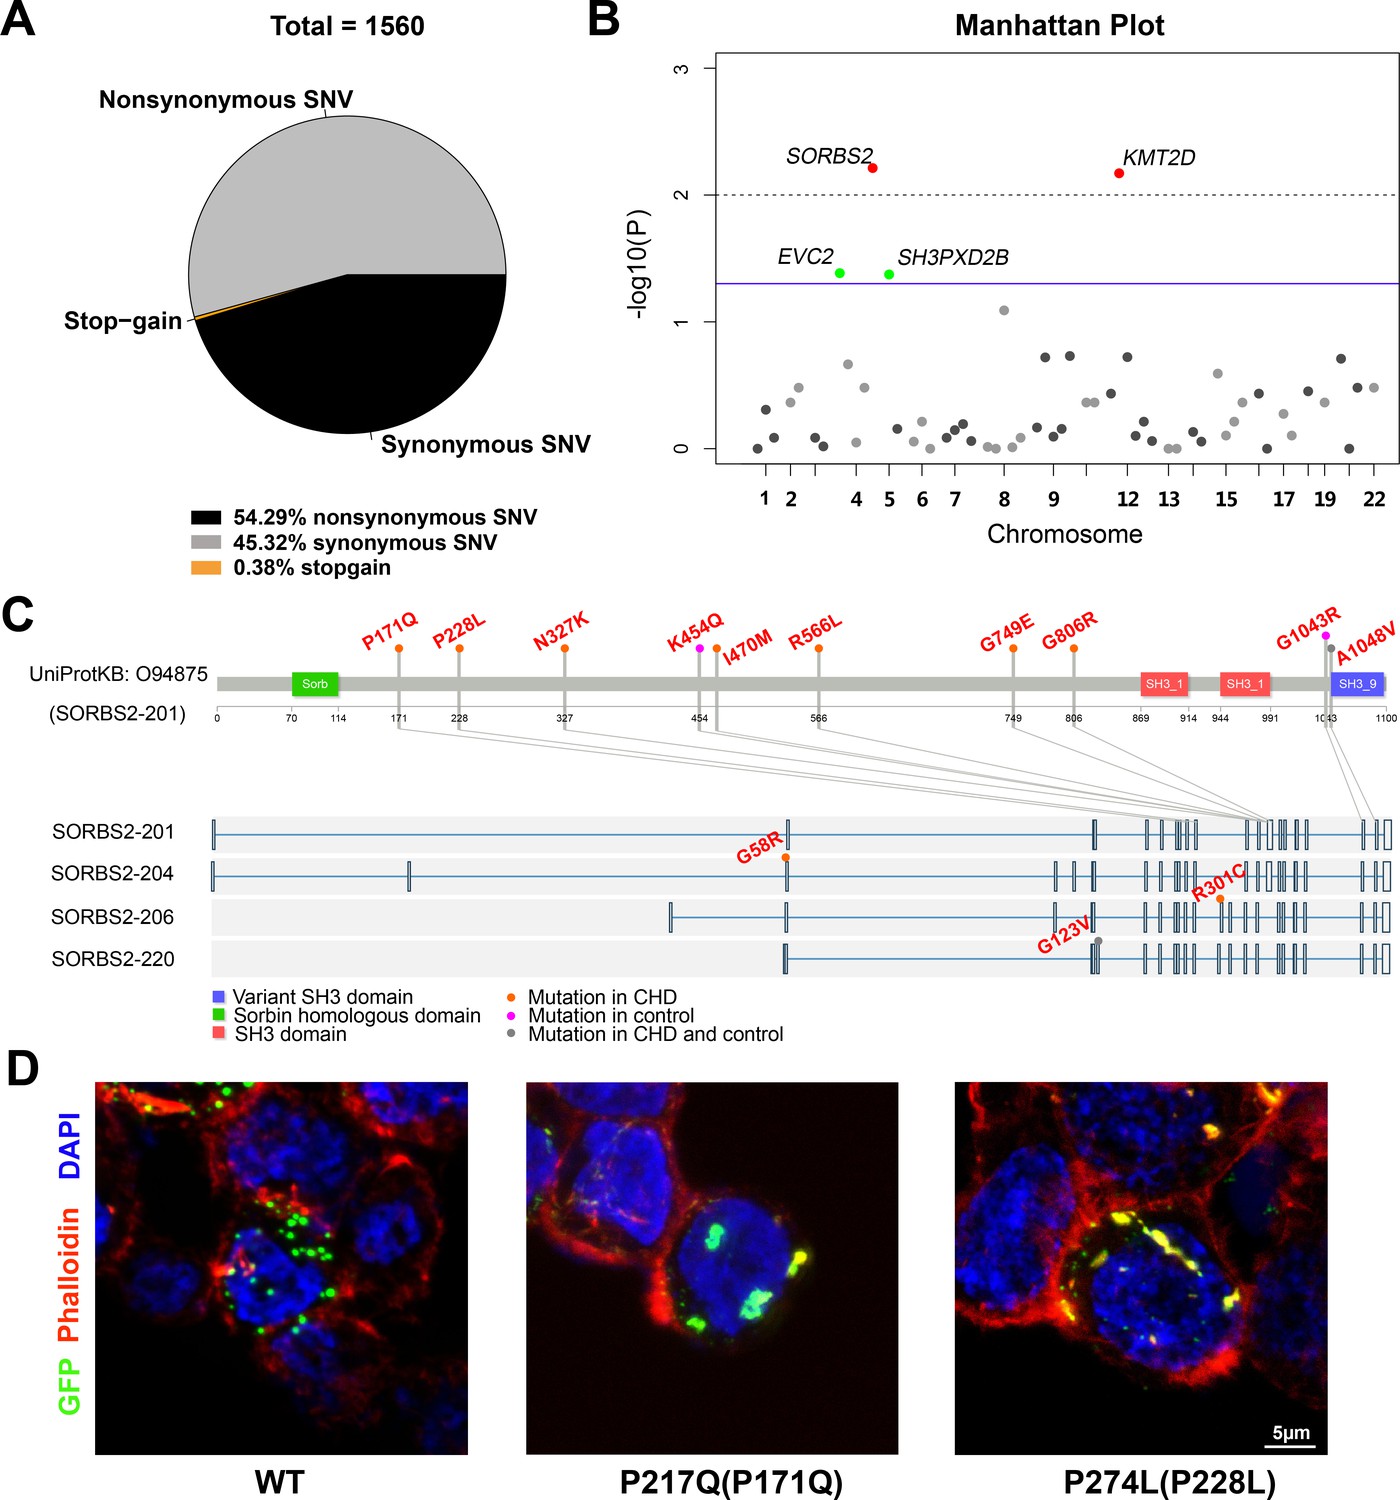
Rare SORBS2 variants are enriched in CHD patients.
(A) Descriptive statistics of the identified exonic variants. (B) Manhattan plot of gene-level Fisher’s exact test of rare damaging variant counts between congenital heart disease (CHD) and control groups. Raw p-values of 0.05 and 0.01 are indicated by a blue line and a grey dash line, respectively. Genes (SORBS2, KMT2D) with a q-value lower than 0.2 are highlighted in red. Genes (EVC2, SH3PXD2B) with p<0.05 but q>0.2 are highlighted in green. (C) Illustration of rare damaging variants in SORBS2. Most variants are indicated in the longest SORBS2 isoform (SORBS2-201). Three isoform-specific variants are shown in the corresponding exons. Variants in CHD and control groups are indicated by orange and pink dots, respectively. Variants appearing in both groups are indicated by grey dots. (D) Representative images of immunofluorescent staining of HEK293 cells transfected with EGFP-tagged SORBS2 (isoform 206) or variants. Amino acid coding in the bracket is the sequence numbering of isoform 201. Red, phalloidin staining.
Figure 4—figure supplement 1
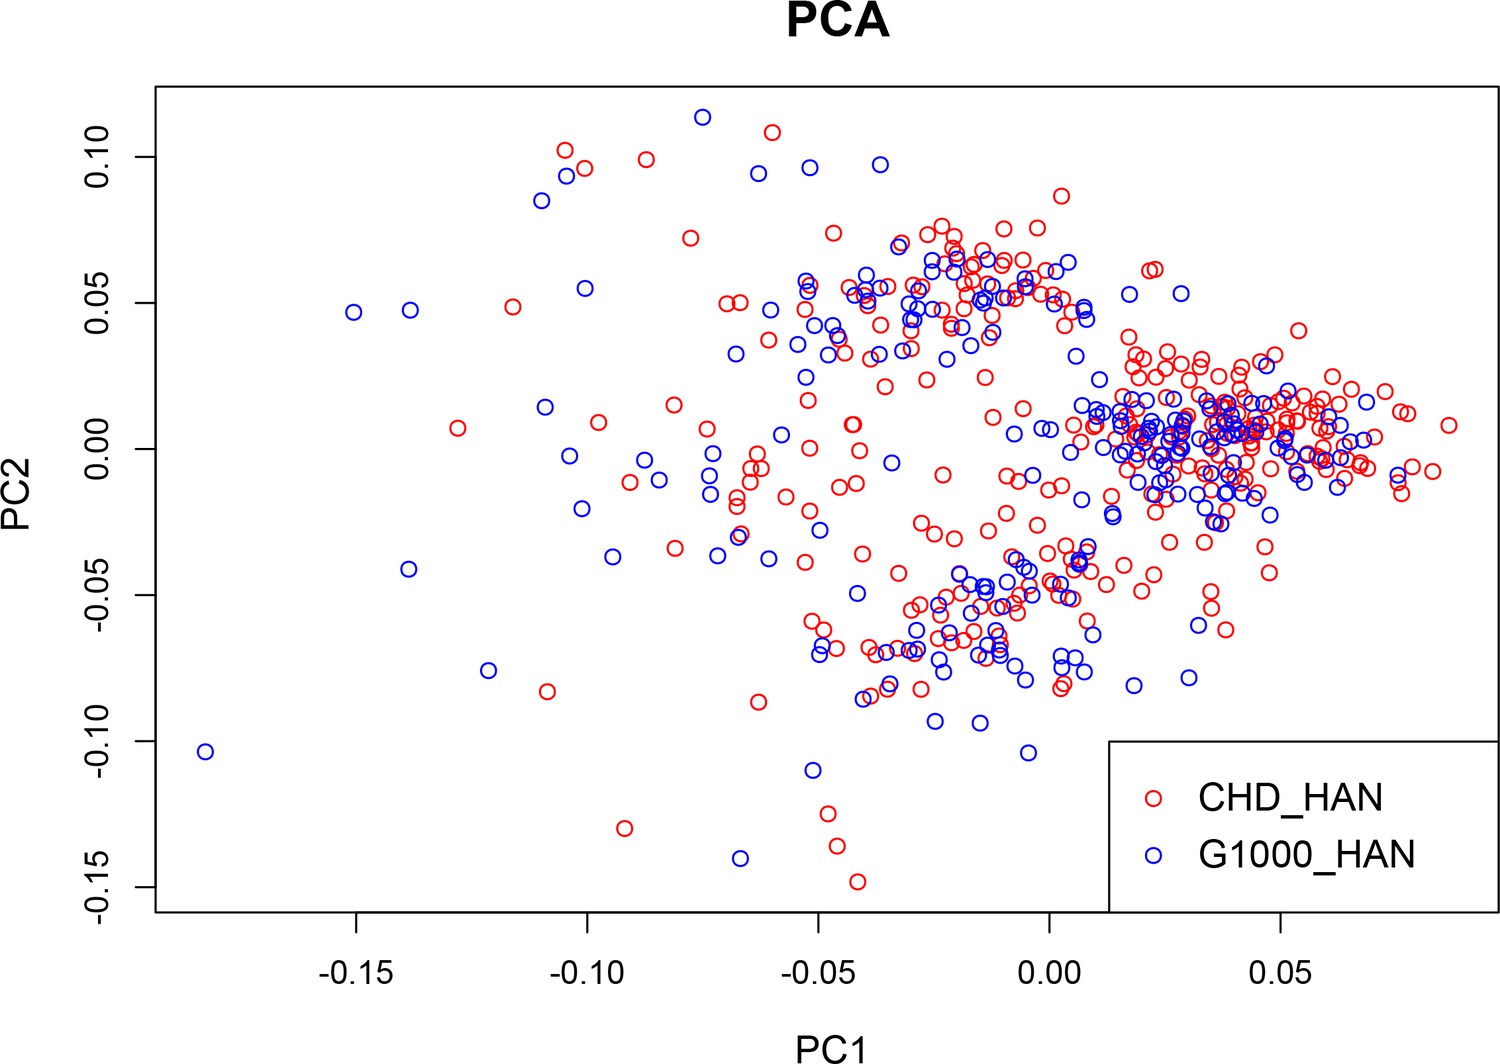
Ethnic background comparison of CHD and control groups.
Principal component analysis (PCA) plot of population structure with the top two principle components (PC1: principle component 1; PC2: principle component 2). Congenital heart disease (CHD) and control samples are clustered together in PCA of single nucleotide polymorphism (SNP) genotype.
Videos
Video 1
Beating D20 control cardiomyocytes.
Video 2
Beating D20 shRNA-SORBS2-1 cardiomyocytes.
Video 3
Beating D20 shRNA-SORBS2-2 cardiomyocytes.
Tables
Key resources table
| Reagent type (species) or resource | Designation | Source or reference | Identifiers | Additional information |
|---|---|---|---|---|
| Antibody | Anti-c-ABL (rabbit polyclonal) | Abclonal | A0282 | (1:1000) RRID:AB_2757094 |
| Antibody | Anti-Notch1 (rabbit monoclonal) | Cell Signaling Technology | 3608 s | (1:1000) RRID:AB_2153354 |
| Antibody | Anti-GAPDH (mouse monoclonal) | Abcam | ab8245 | (1:1000) RRID:AB_2107448 |
| Antibody | Anti-Rabbit IgG (HRP) (goat polyclonal) | Abcam | ab6721 | (1:5000) RRID:AB_955447 |
| Antibody | Anti-Mouse IgG (HRP)(goat polyclonal) | Abcam | ab205719 | (1:5000) RRID:AB_2755049 |
| Antibody | Anti-TRA-1–60 (mouse monoclonal) | Abcam | ab16288 | (1:200) RRID:AB_778563 |
| Antibody | Anti-Oct4 (rabbit polyclonal) | Abcam | ab18976 | (1:200) RRID:AB_444714 |
| Antibody | Anti-SOX2 (rabbit monoclonal) | Abcam | ab92494 | (1:200) RRID:AB_10585428 |
| Antibody | Anti-Cardiac Troponin I (mouse monoclonal) | Abcam | aab92408 | (1:200) RRID:AB_10562928 |
| Antibody | Anti-α-Actinin (mouse monoclonal) | Sigma | A5044 | (1:200) RRID:AB_476737 |
| Antibody | Anti-mouse IgG, Alexa Fluor 488 (goat polyclonal) | Invitrogen | A11029 | (1:1000) RRID:AB_138404 |
| Antibody | Anti-rabbit IgG, AlexaFluor 633 (goat polyclonal) | Invitrogen | A21071 | (1:1000) RRID:AB_2535732 |
| Antibody | Anti-Cardiac Troponin T (mouse monoclonal) | Abcam | ab8295 | (1:200) RRID:AB_306445 |
| Antibody | FITC Anti-Cardiac Troponin T (mouse monoclonal) | Abcam | ab105439 | (1:100) RRID:AB_10866306 |
| Transfected construct (human) | Lentivirus: SORBS2-shRNA-psPAX2- pMD2.G | Addgene | psPAX2 (12260, Addgene) pMD2.G (12259, Addgene) | Lentiviral construct to transfect and express the shRNA |
| Cell line (Homo sapiens) | H1 hESC line | This paper | H1 hESC line-P21 | Provided by Chen's lab in Shanghai Institute of Biochemistry and Cell Biology (RRID:CVCL_9771) |
| Cell line (Homo sapiens) | ShRNA-SORBS2-H1-hESC | This paper | Generated in Zhang's lab from Shanghai children's medical center | |
| Software, algorithm | Clampfit 10.5/Origin 8.0 | OriginLab, Northampton, MA, USA | RRID:SCR_014212 | |
| Software, algorithm | Image J | Schneider et al., 2012 | https://imagej.nih.gov/ij/ | RRID:SCR_003070 |
| Software, algorithm | R | R Core Team, 2014 | https://www.r-project.org/ | RRID:SCR_001905 |
| Software, algorithm | Burrows-Wheeler Aligner | Li and Durbin, 2009 | v0.7.17 | RRID:SCR_010910 |
| Software, algorithm | Picard Tools | Broad Institute | v2.21.8 | RRID:SCR_006525 |
| Software, algorithm | GATK | Broad Institute | v3.8 | RRID:SCR_001876 |
| Software, algorithm | Samtools | Li and Durbin, 2009 | v1.9 | RRID:SCR_002105 |
| Software, algorithm | Annovar | Wang et al., 2010 | v2019Oct24 | RRID:SCR_012821 |
| Biological sample (Homo sapiens) | Peripheral blood | This paper | Isolated from of 300 children with complex CHD from Shanghai Children's Medical Center | |
| Sequence-based reagent | Primers for RT-PCR | This paper | Sequences are provided inSupplementary file 13 | |
| Sequence-based reagent | SORBS2-shRNA plasmid vectors (U6-MCS-Ubiquitin-Cherry-IRES-puromycin) | Shanghai Genechem Co | GIEE0117834 | shRNA-1 and shRNA-2 are 5′-TCCTTGTATCAGTCCTCTA-3′ and 5′-TCGATTCCACAGACACATA-3′, respectively |
| Sequence-based reagent | In situ probe for MouseTbx5 | This paper | Provided by Dr. Lo's lab in University of Pittsburgh | |
| Sequence-based reagent | In situ probe for MouseHeyl | This paper | Generated in house. Primers: F-5’ GCCAGGAGCATAGTCCCAAT, R-5’ GGCCCTCAACCCACTCCATGAC | |
| Sequence-based reagent | In situ probe for MouseHoxb1 | This paper | Generated in house. Primers: F−5’ TTCCTTTTTAGAGTACCCACTTTG, R-5’ GTTTCTCTTGACCTTCATCCAGTC | |
| Commercial assay or kit | Illumina Genome Analyzer IIx platform | Illumina | ||
| Commercial assay or kit | Agilent SureSelect Capture panel | Agilent | ||
| Commercial assay or kit | Reverse Transcription Kit | Takara | RR037A | |
| Commercial assay or kit | SYBR Fast qPCR Mix | Takara | RR430A | |
| Commercial assay or kit | TUNEL staining | Yeasen Biotech | T18120 | |
| Commercial assay or kit | Accutase | Stem cell Technologies | 7920 | |
| Commercial assay or kit | TRizol reagent | Thermo Fisher Scientific | 15596018 | |
| Commercial assay or kit | OCT | Thermo Fisher Scientific | 6502 | |
| Commercial assay or kit | Matrigel | BD Biosciences | 354277 | |
| Commercial assay or kit | TeSR-E8 medium | Stem cell Technologies | 05840 | |
| Commercial assay or kit | RPMI 1640 | Gibco | C14065500 | |
| Commercial assay or kit | L-ascorbic acid 2-phosphate | Sigma | 113170-55-1 | 213 µg/ml |
| Commercial assay or kit | Oryza sativa-derived recombinant human albumin | Healthgen Biotechnology Corp | HY100M1 | 500 µg/ml |
| Commercial assay or kit | CHIR99021 | Stem cell Technologies | 72052 | 6 μM |
| Commercial assay or kit | Wnt-C59 | Peprotech Biogems | 1248913 | 2 μM |
| Commercial assay or kit | Recombinant SHH protein | Sinobiological | 10372-H08H1 | |
| Commercial assay or kit | RIPA buffer | Beyotime | P0013B | |
| Other | B6.C-Tg(CMV-cre)1Cgn/Jmice/C57 | This paper | Jackson lab (RRID:IMSR_JAX:006054) | |
| Other | Sorbs2 flox/flox mice/C57 | This paper | Gifts from Dr. Guoping Feng’s lab (RRID:IMSR_JAX:028600) |
Author response table 1
| Gene name | Base Mean | Log2FoldChange | LfcSE | Stat | pvalue | padj |
|---|---|---|---|---|---|---|
| GATA4 | 7197.309 | 0.330043 | 0.078422 | 4.208528 | 2.57E-05 | 0.000904 |
| TBX2 | 1295.333 | 0.58354 | 0.122726 | 4.754828 | 1.99E-06 | 0.000111 |
Author response table 2
| Gene name | Base Mean | Log2FoldChange | LfcSE | Stat | pvalue | padj |
|---|---|---|---|---|---|---|
| TBX1 | 721.4109 | -0.99858 | 0.116671 | -8.55897 | 1.14E-17 | 1.15E-14 |
| ISL1 | 2401.652 | -0.38996 | 0.091506 | -4.26157 | 2.03E-05 | 0.000749 |
| CXCR4 | 145.2801 | -0.91179 | 0.213437 | -4.27194 | 1.94E-05 | 0.000723 |
| MEF2C | 1242.792 | -0.22804 | 0.107697 | -2.11741 | 0.034225 | 0.216401 |
Additional files
-
Supplementary file 1
Down-regulated genes in SORBS2-knockdown D5 cells for GO analysis.
- https://cdn.elifesciences.org/articles/67481/elife-67481-supp1-v1.xlsx
-
Supplementary file 2
Up-regulated genes in SORBS2-knockdown D5 cells for GO analysis.
- https://cdn.elifesciences.org/articles/67481/elife-67481-supp2-v1.xlsx
-
Supplementary file 3
Genotyping distribution in embryos from Sorbs2+/- mouse intercross.
- https://cdn.elifesciences.org/articles/67481/elife-67481-supp3-v1.docx
-
Supplementary file 4
Down-regulated genes in E10.5 Sorbs2+/- embryos for GO analysis.
- https://cdn.elifesciences.org/articles/67481/elife-67481-supp4-v1.csv
-
Supplementary file 5
Down-regulated genes in E10.5 Sorbs2-/- embryos for GO analysis.
- https://cdn.elifesciences.org/articles/67481/elife-67481-supp5-v1.csv
-
Supplementary file 6
Number of exonic variants detected in CHD and normal controls.
- https://cdn.elifesciences.org/articles/67481/elife-67481-supp6-v1.docx
-
Supplementary file 7
Carriers of rare damaging variants in CHD and normal controls.
- https://cdn.elifesciences.org/articles/67481/elife-67481-supp7-v1.docx
-
Supplementary file 8
CHD patients with rare SORBS2 variants.
- https://cdn.elifesciences.org/articles/67481/elife-67481-supp8-v1.xlsx
-
Supplementary file 9
Cardiac phenotype in patients carrying SORBS2 variants.
- https://cdn.elifesciences.org/articles/67481/elife-67481-supp9-v1.docx
-
Supplementary file 10
Primers for qPCR.
- https://cdn.elifesciences.org/articles/67481/elife-67481-supp10-v1.docx
-
Supplementary file 11
Subphenotypes of CHD cohort.
- https://cdn.elifesciences.org/articles/67481/elife-67481-supp11-v1.docx
-
Supplementary file 12
Known CHD genes included in targeted sequencing panel.
- https://cdn.elifesciences.org/articles/67481/elife-67481-supp12-v1.docx
-
Supplementary file 13
Candidate CHD genes included in targeted sequencing panel.
- https://cdn.elifesciences.org/articles/67481/elife-67481-supp13-v1.docx
-
Transparent reporting form
- https://cdn.elifesciences.org/articles/67481/elife-67481-transrepform-v1.docx
Download links
A two-part list of links to download the article, or parts of the article, in various formats.
Downloads (link to download the article as PDF)
Open citations (links to open the citations from this article in various online reference manager services)
Cite this article (links to download the citations from this article in formats compatible with various reference manager tools)
SORBS2 is a genetic factor contributing to cardiac malformation of 4q deletion syndrome patients
eLife 10:e67481.
https://doi.org/10.7554/eLife.67481


