A developmental framework linking neurogenesis and circuit formation in the Drosophila CNS
- Institute of Neuroscience, Howard Hughes Medical Institute, University of Oregon, United States
- Mortimer B Zuckerman Mind Brain Behavior Institute, Department of Neuroscience, Columbia University, United States
- Janelia Research Campus, Howard Hughes Medical Institute, MRC Laboratory of Molecular Biology, Department of Physiology, Development & Neuroscience, University of Cambridge, United Kingdom
- Janelia Research Campus, Howard Hughes Medical Institute, Friday Harbor Laboratories, University of Washington, United States
Figures
Figure 1
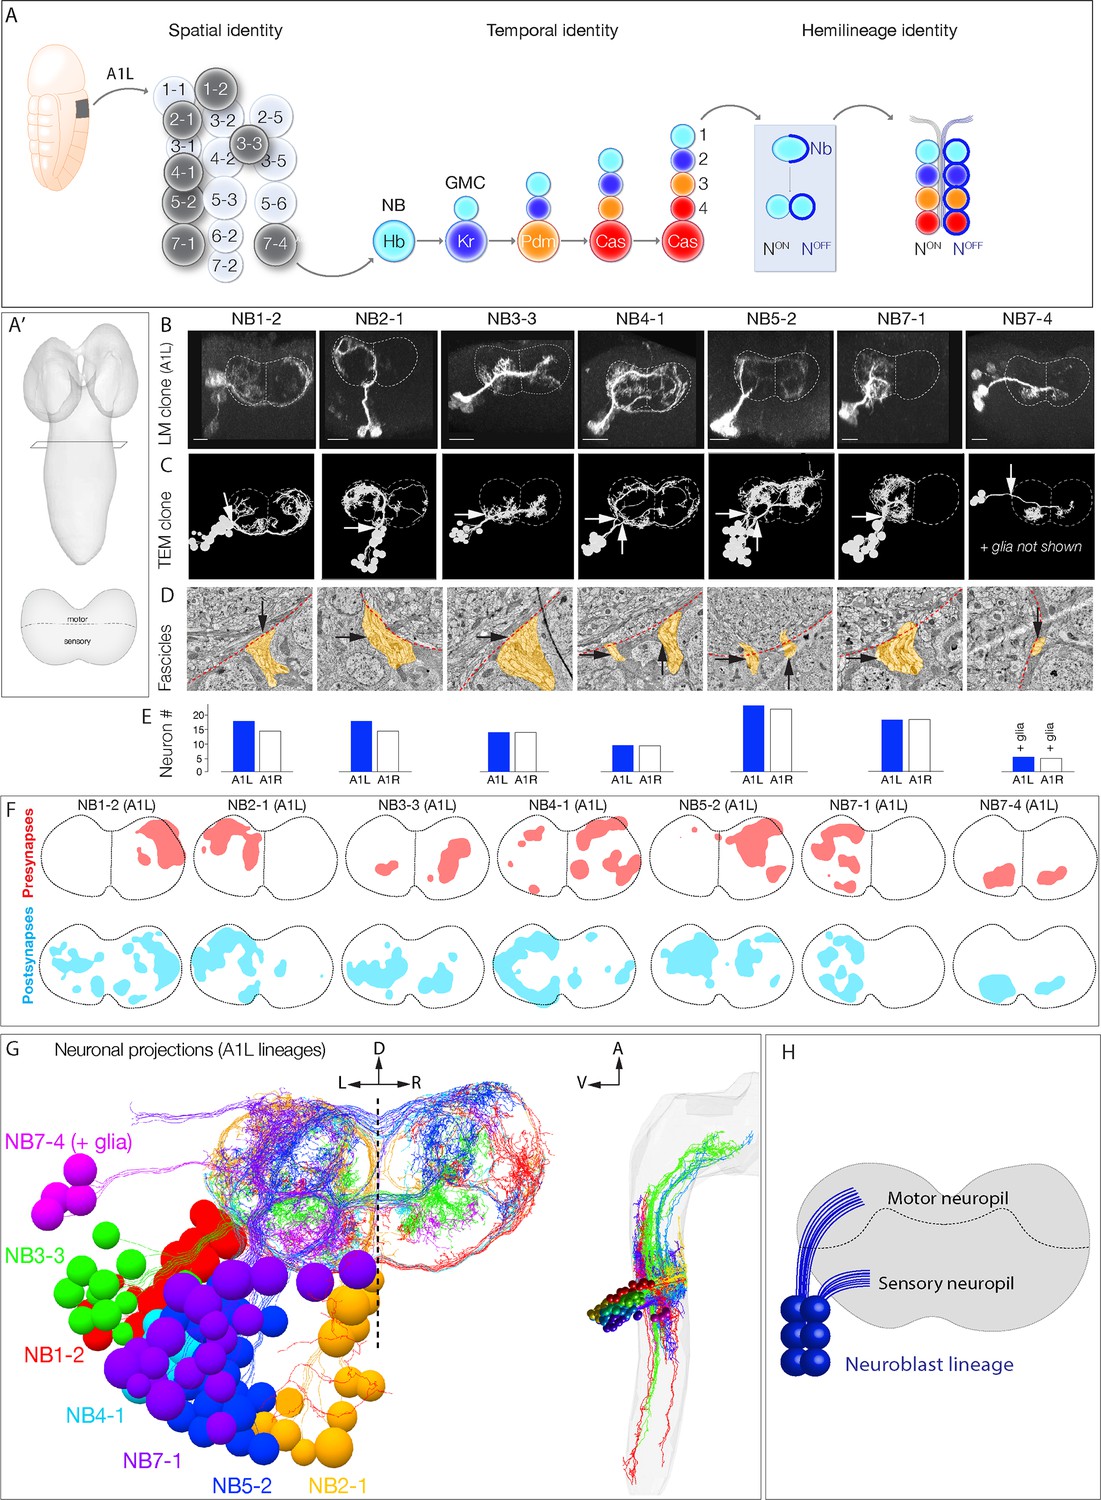
Mapping neurons with shared developmental origin in a transmission electron microscopy (TEM) reconstruction: clonally related neurons project widely and localize synapses to both sensory and motor neuropil.
(A) Three mechanisms specifying neuronal diversity. Neuroblasts characterized here are shown in dark gray and arise from all anteroposterior and mediolateral positions of the neuroectoderm (dorsal view: anterior up, ventral midline at left of panel). They undergo temporal patterning as shown in the middle panel (posterior view: dorsal up). Nb: Numb; N: Notch; A1L: abdominal segment A1 left side. (A') Schematic of newly hatched larval central nervous system (CNS) in a dorsal view, anterior up (top), or in a posterior view, dorsal up (bottom). All images in the figures are shown in posterior view, dorsal up unless noted otherwise. (B) Single neuroblast clones for the indicated neuroblasts (larval neuroblast names given in Supplementary file 1) each generated in A1L with dpn(FRT.stop)LexA.p65 and assayed in newly hatched larvae. We recovered n > 2 clones for each newly characterized lineage; NB4-1 was previously characterized (Lacin and Truman, 2016). Dashed lines: neuropil border; vertical dash: midline. Scale bar, 10 μm. (C) The corresponding neurons traced in the TEM reconstruction. Dashed lines: neuropil border; vertical dash: midline. Arrows denote fascicles entering the neuropil; also shown in (D). (D) Each clone characteristically has either one or two fascicles entering the neuropil (black arrows, yellow highlight). (E) There are a similar number of neurons per neuroblast clone in A1L (left) and A1R (right). (F) Presynaptic and postsynaptic density maps (75% threshold) for each neuroblast lineage. Dashed lines: neuropil border; vertical dash: midline. All density maps are from neurons in A1L (cell bodies not shown). (G) Seven bilateral neuroblast lineages in segment A1 left traced in the TEM reconstruction. Inset: same projections, lateral view, anterior up. L: left; R: right; D: dorsal; V: ventral; A: anterior. (H) Summary.
Figure 2 with 2 supplements
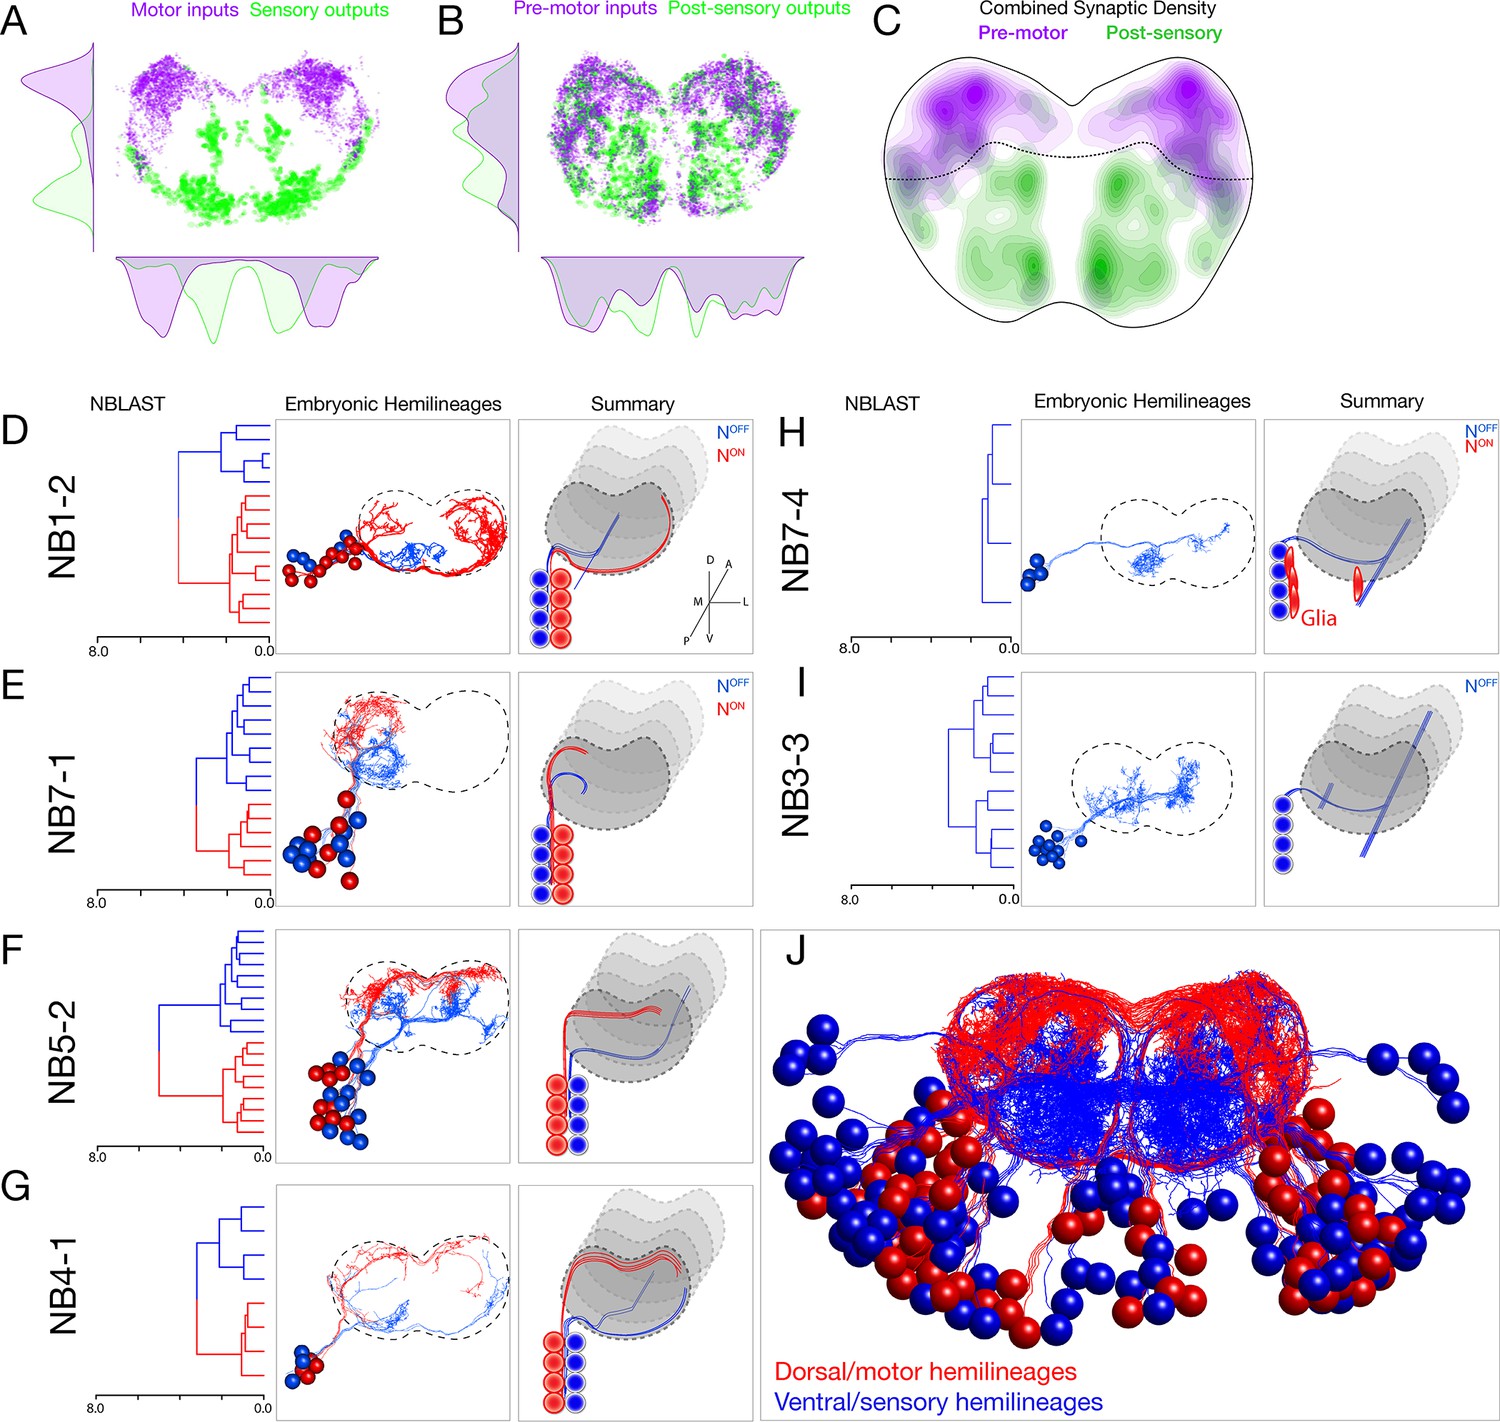
Each neuroblast lineage generates neurons projecting to dorsal/motor or ventral/sensory neuropil.
(A–C) Organization of motor and sensory domains within the ventral nerve cord neuropil. (A) Motor neuron postsynapses (purple) and sensory neuron presynapses (green) showing dorsoventral segregation. Plots are 1D kernel density estimates for dorsoventral or mediolateral axes. Purple dots represent a single postsynaptic site. Green dots represent a single presynaptic site scaled by the number of outputs from that presynaptic site. (B) Premotor neuron postsynaptic sites (>3 synapses onto a motor neuron in segment A1) or postsensory neuron presynaptic sites (pre >3 synapses with an A1 sensory neuron) show that connecting neurons are still restricted to dorsal or ventral neuropil domains. (C) 2D kernel density estimates of all presynaptic and postsynaptic sites for premotor and postsensory neurons outline the regions of sensory (green) and motor (purple) processing in the ventral nerve cord. (D–I) NBLAST clustering for the indicated neuroblast progeny typically reveals two morphological groups of neurons or glia (red/blue) that project to dorsal or ventral neuropil; these are candidate hemilineages. Cluster cutoffs were set at 3.0 for all lineages. (J) Superimposition of all dorsal candidate hemilineages (red) and all ventral candidate hemilineages (blue). Data from NBs 1-2, 3-3, 4-1, 5-2, 7-1, and 7-4 (this figure) and NB2-1 (Figure 2—figure supplement 1).
Figure 2—figure supplement 1

NB2-1 has NotchON and NotchOFF neurons, but all project to a similar neuropil domain.
(A) NBLAST clustering for the NB2-1 progeny reveals two morphological groups (red/blue). The magenta and green neurons are outliers and may be from another lineage because we never identified a NB2-1 clone containing these two neurons; the two outlier neurons were removed prior to hemilineage analysis below. Cluster cutoffs were set at 3.0. (B, B') Reconstruction of NB2-1 progeny; presumptive NotchON neurons (red) are slightly more dorsal and lateral than the presumptive NotchOFF neurons (blue). (C, C') The Notch target gene Hey is expressed in approximately half of the neurons in the NB2-1 lineage, confirming that there are NotchON and NotchOFF hemilineages. Stage 16 embryo; scale bar, 5 μm. Posterior view, dorsal up, midline at center of panel. These hemilineages are likely to be the red/cyan neurons identified by NBLAST.
Figure 2—figure supplement 2
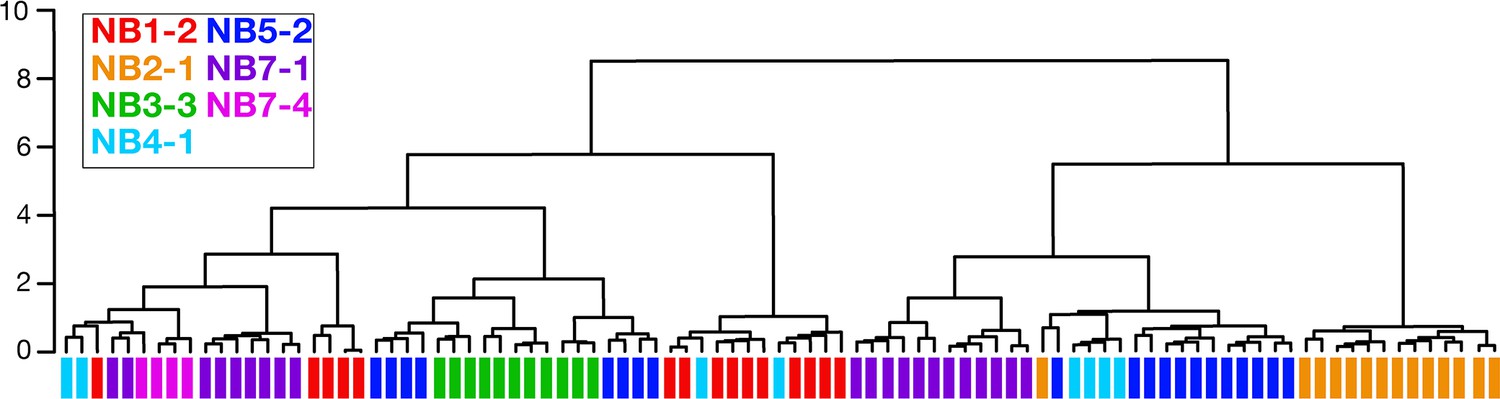
Clonally related neurons can have different morphology.
Dendrogram showing NBLAST results clustering neurons based on similar morphology. Clustered neurons were all from hemisegment A1L. Colored bars denote lineage identity. Note that some lineages contain neurons with highly divergent morphology as indicated by their lack of clustering together in the dendrogram (e.g., NB4-1 and NB5-2 lineages).
Figure 3 with 1 supplement
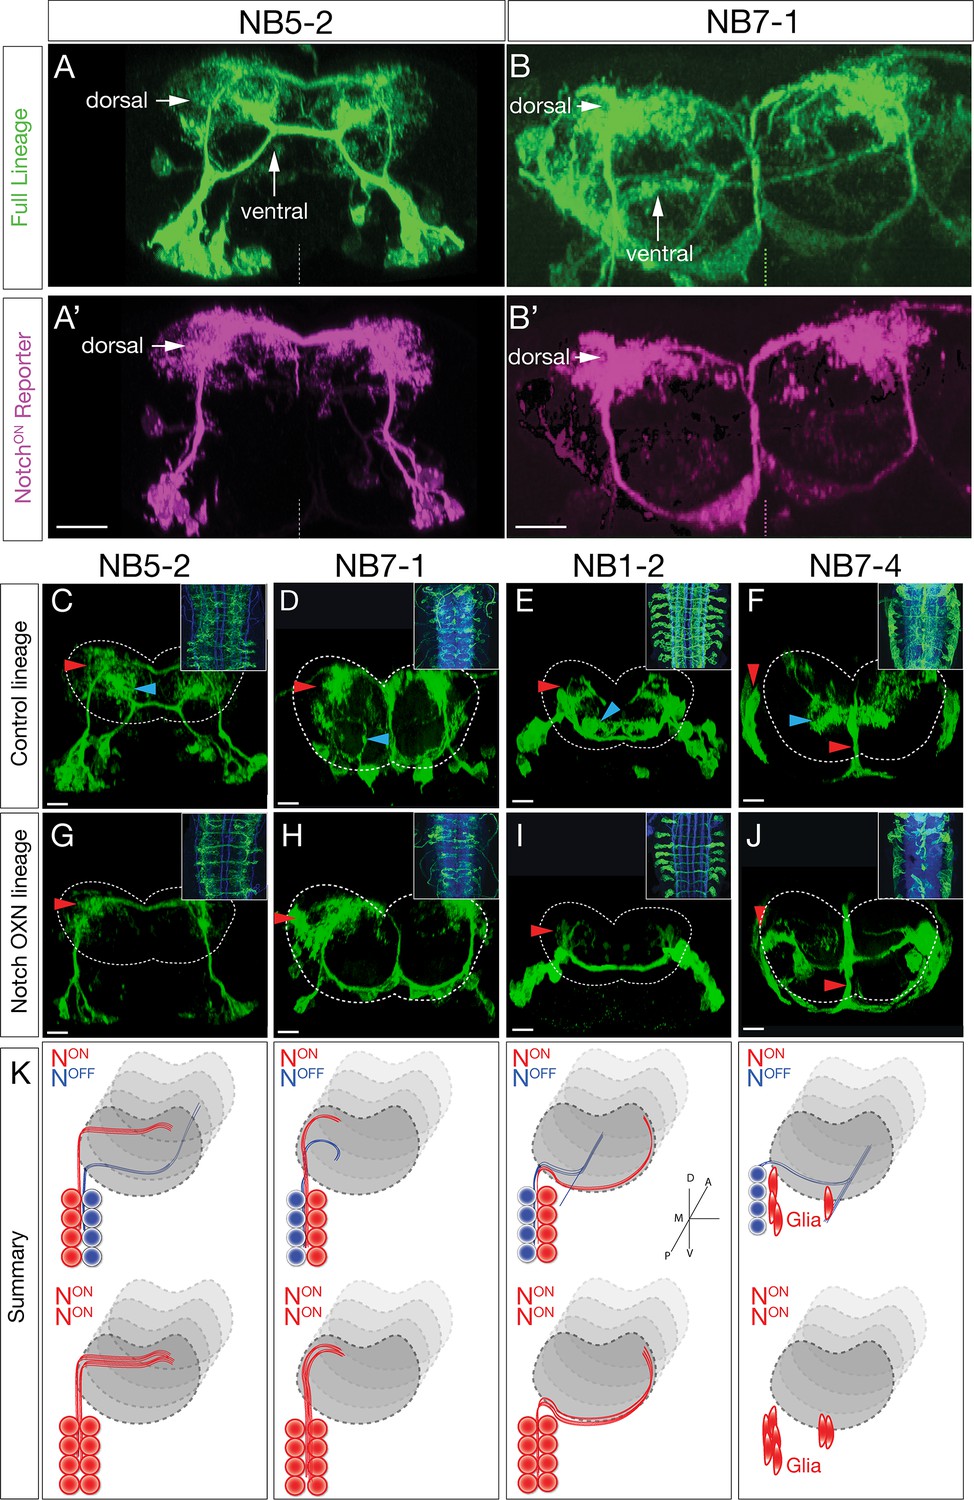
Hemilineage identity drives neuronal projections to motor or sensory neuropil.
(A, B) A Notch reporter (hey:T2A:FLP, UAS-myr:GFP, UAS-FRT-stop-FRT-myr:sfGdP:HA) specifically labels dorsal projections within the indicated neuroblast lineages. Myr:GFP labels the whole lineage (green), myr:sfGdP:HA is a myristoylated (myr) superfolder green dead protein (sfGdP) fused to hemoagglutinin (HA), which labels the NotchON hemilineage (magenta). (A', B') Staining for HA reveals the NotchON neuron projections. Vertical dashes: midline; dorsal: up. (C–F) Control neuroblast lineages project to both dorsal neuropil (red arrowheads) and ventral neuropil (cyan arrowheads). Scale bars, 10 μm. (G–J) Lineage-specific Notchintra expression transforms ventral projections to dorsal projections or glia (red arrowheads). Cell numbers in control and Notch misexpression are similar (see text). n > 3 for all experiments. Dashed lines: neuropil border; dorsal: up. Scale bars, 5 μm. (K) Summary.
Figure 3—figure supplement 1
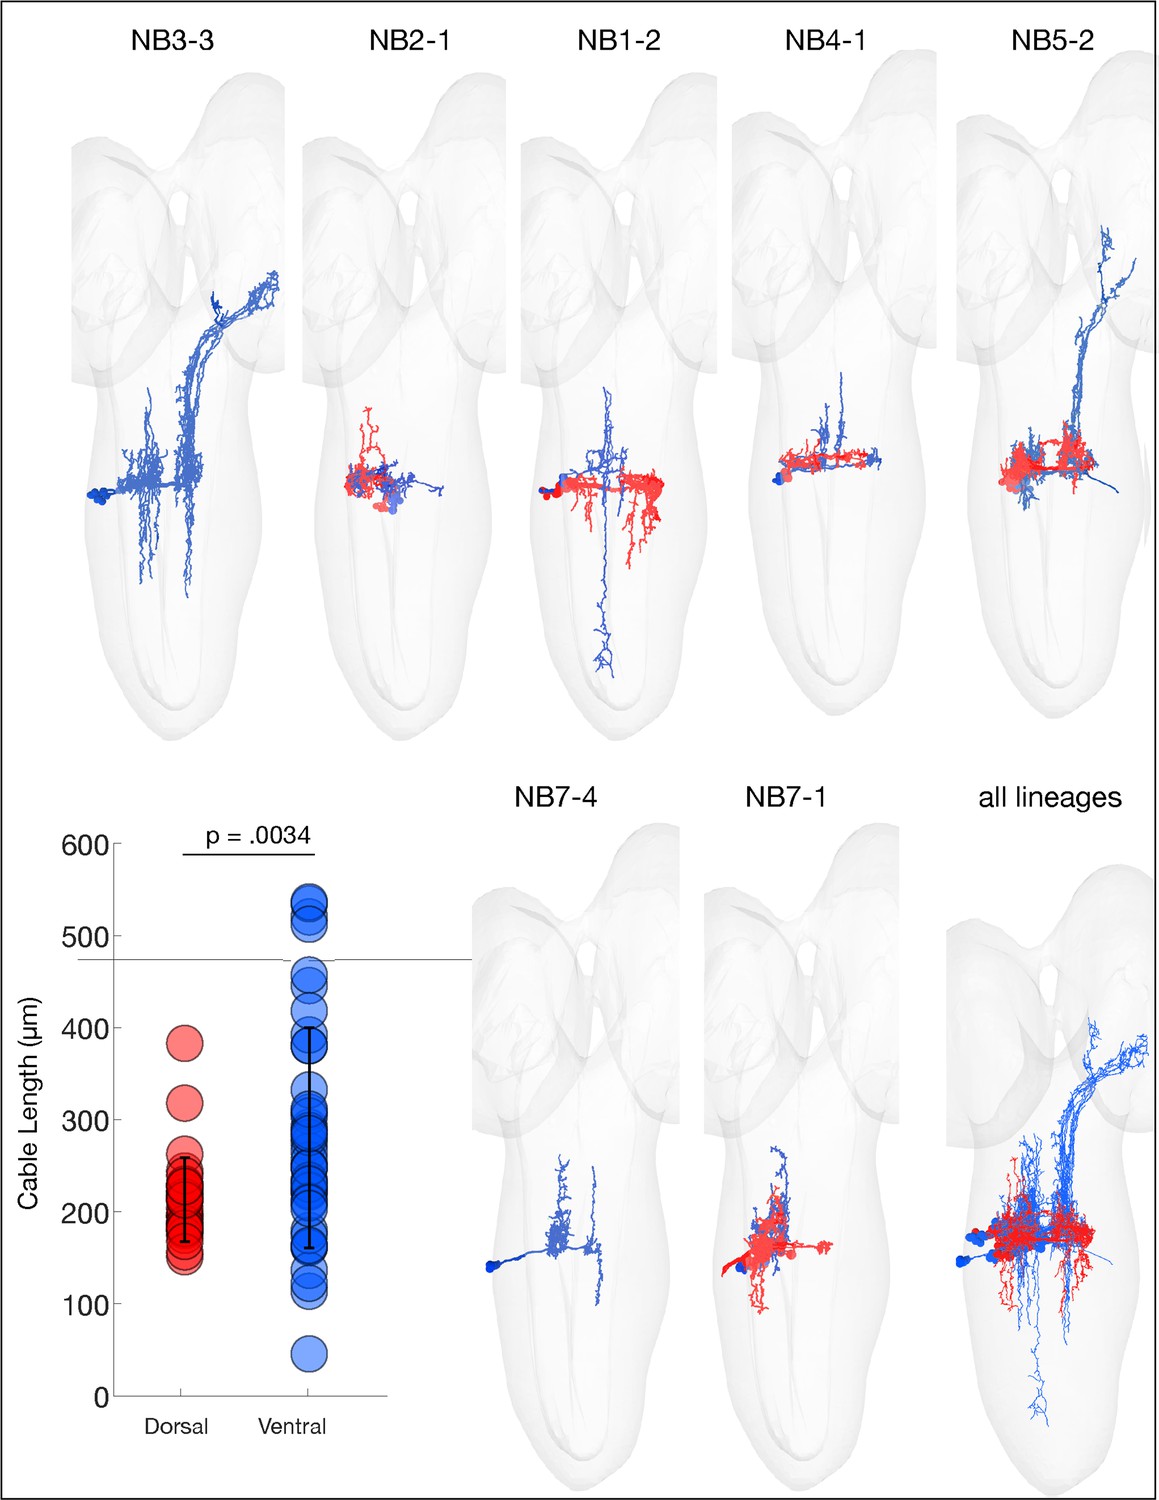
Ventral hemilineages have projection neurons.
The indicated neuroblast lineages traced in CATMAID showing the dorsal (red) and ventral (cyan) predicted hemilineages. Note that the ventral (cyan) hemilineages contain significantly longer axons (ascending and descending projection neurons) compared to dorsal (red) hemilineage neurons, consistent with what has been observed in larva (Truman et al., 2010). p=0.0034, via two-sided Wilcoxon rank-sum test.
Figure 4 with 2 supplements

Hemilineages target pre- and postsynapses to subdomains of dorsal or ventral neuropil.
(A) Density maps for dorsal synapses (red) or ventral synapses (blue) within each lineage. Dorsal hemilineages localize both presynapses and postsynapses to dorsal neuropil, whereas ventral hemilineages localize both presynapses and postsynapses to ventral neuropil. Vertical dashes: midline. Synapses from both A1L and A1R are shown to highlight left/right stereotypy. Synapses outside of segment A1 were from this analysis given the change in shape and orientation of the neuropil in more posterior segments and the central brain. See Figure 4—figure supplement 1 for the bounds used. (B) Connectivity diagram showing sensory neurons provide inputs to neurons in ventral hemilineages, while motor neurons preferentially receive inputs from neurons in dorsal hemilineages. Edges represent fractions of outputs for sensory neurons, and fraction of inputs for motor neurons. (C, D) Presynaptic distributions of the indicated dorsal or ventral hemilineages from A1L. Dots represent single presynaptic sites with their size scaled by the number of associated (polyadic) postsynaptic sites. Circles: location of cell bodies. Note that NB1-2 ventral hemilineage presynapses (red dots) are located ventrally, but are not shown in the A1 cross-sectional view due to their position in posterior segments of the ventral nerve cord (VNC). (E, F) Postsynaptic distributions of the indicated dorsal or ventral hemilineages from A1L. Dots represent single postsynaptic sites. Circles: location of cell bodies. (G) Mean inter- versus intra-hemilineage synapse similarity scores for dorsal and ventral hemilineages show intra-hemilineage presynapse (blue) and postsynapse (orange) similarity is greater than inter-hemilineage (black) similarity. In this case, intra-hemilineage similarity represents comparisons only to neurons targeting the same region of the neuropil (dorsal-dorsal/ventral ventral). Error bars represent SEM. p<0.05 in all cases (Wilcoxon rank-sum test). (H) Summary.
Figure 4—figure supplement 1
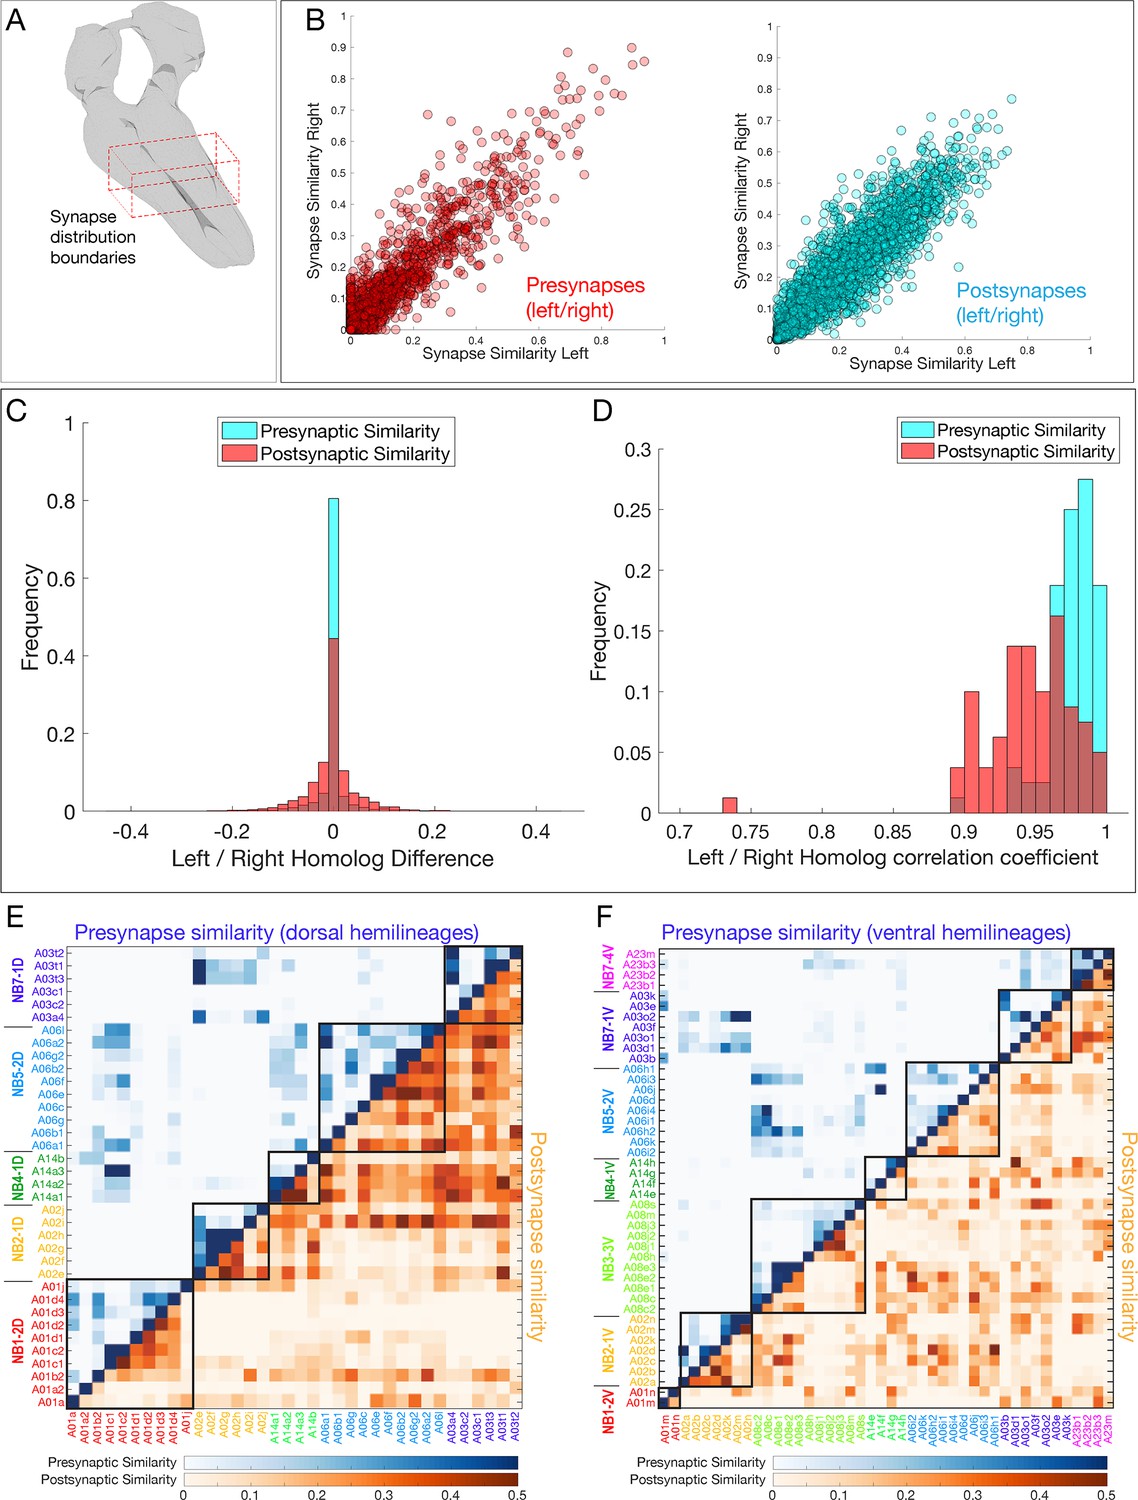
Neurons in a hemilineage cluster their synapses to specific regions of the neuropil.
(A) Diagram of neuropil volume analyzed for synapse spatial positions. (B) Pre- and postsynapse positions are highly reproducible for the same neuron in A1L and A1R. (C, D) Presynapse positions are more stereotyped than postsynaptic positions. (C) Left/right variation between pairwise synapse similarity scores. (D) Distribution of per-neuron correlation coefficients for similarity scores shows presynaptic sites are more stereotyped. p<0.05, two-sample Kolmogorov–Smirnov test. (E, F) Synapse similarity shows greater presynapse clustering (blue) than postsynapse clustering (orange) in both dorsal and ventral hemilineages. Postsynaptic clustering is greater in ventral hemilineages than dorsal hemilineages.
Figure 4—figure supplement 2
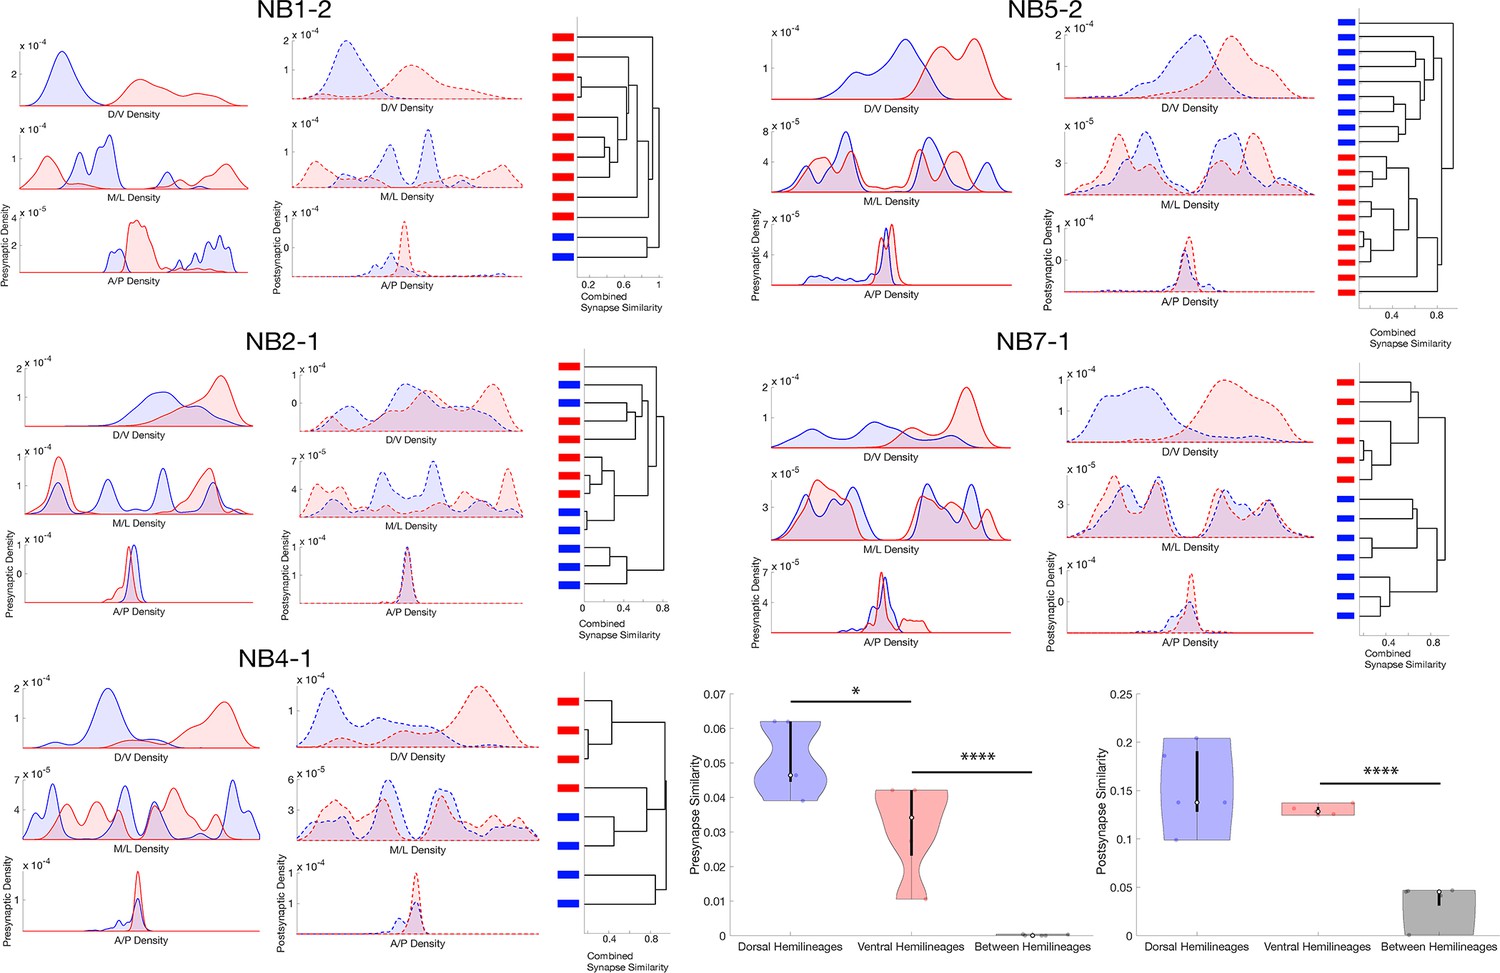
Lineage-related neurons segregate their synapses on the basis of hemilineage.
(A) Synapse distributions and synaptic clustering for each lineage that contains a hemilineage. Bars on dendrogram leaves represent hemilineage relationship (red: dorsal; blue: ventral). (B) Synapse similarity within and between hemilineages for neurons related by lineage. *p<0.05, ****p<0.0001. One-way ANNOVA followed by multiple comparison test with a Tukey–Kramer critical value.
Figure 5 with 3 supplements
Mapping temporal identity in the TEM reconstruction: radial position is a proxy for neuronal birth-order.
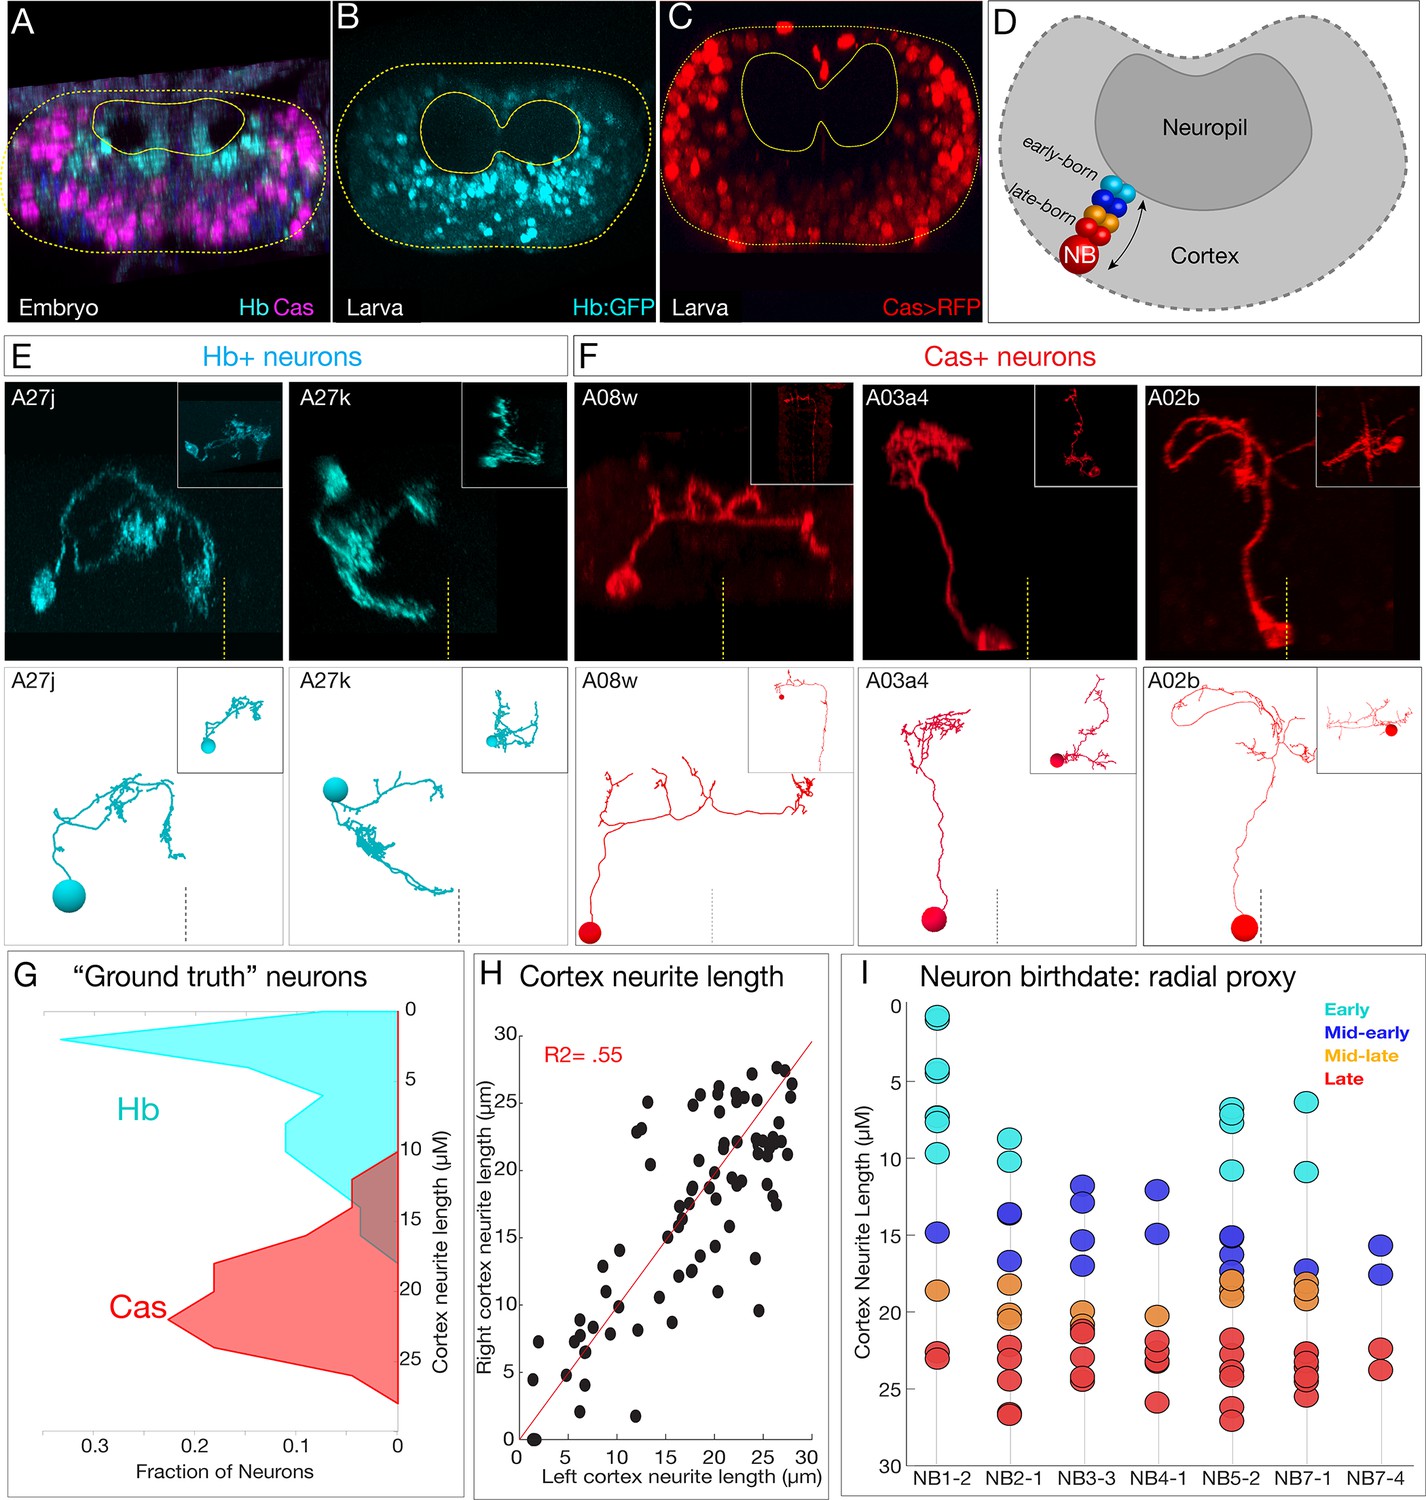
(A–C) Early-born Hb+ neurons are near the neuropil and late-born Cas+ neurons are far from the neuropil in the late embryo (A) and newly hatched larvae (B, C); larval reporters are recombineered Hb:GFP and cas-gal4 UAS-RFP. (D) Schematic showing correlation between radial position and early- or late-born temporal identity. (E, F) Examples of experimentally verified 'ground truth' early-born Hb+ neurons and late-born Cas+ neurons, identified using multicolor flip out with cas-gal4 or using a CRISPR engineered hb locus where LexA:T2A is in frame with start of the hb coding sequence (see Materials and methods); additional examples in Figure 5—figure supplement 1. (G) Fraction of experimentally validated Hb+ or Cas+ 'ground truth' neurons at the indicated distance from the neuropil (cortex neurite length). n = 47 Cas+ neurons and 55 Hb+ neurons from segments T3-A2. (H) Cortex neurite lengths between the same neuron in the left and right hemisegment, showing that radial position is highly stereotyped. (I) Assignment of temporal identity based on radial position for neurons within the TEM reconstruction, calculated as the mean left/right distance for the same neuron in A1L and A1R. Note that not all lineages have all temporal cohorts, mirroring experimental observation that some neuroblast lineages do not express all temporal transcription factors (Benito-Sipos et al., 2010; Cui and Doe, 1992; Isshiki et al., 2001; Tsuji et al., 2008).
Figure 5—figure supplement 1
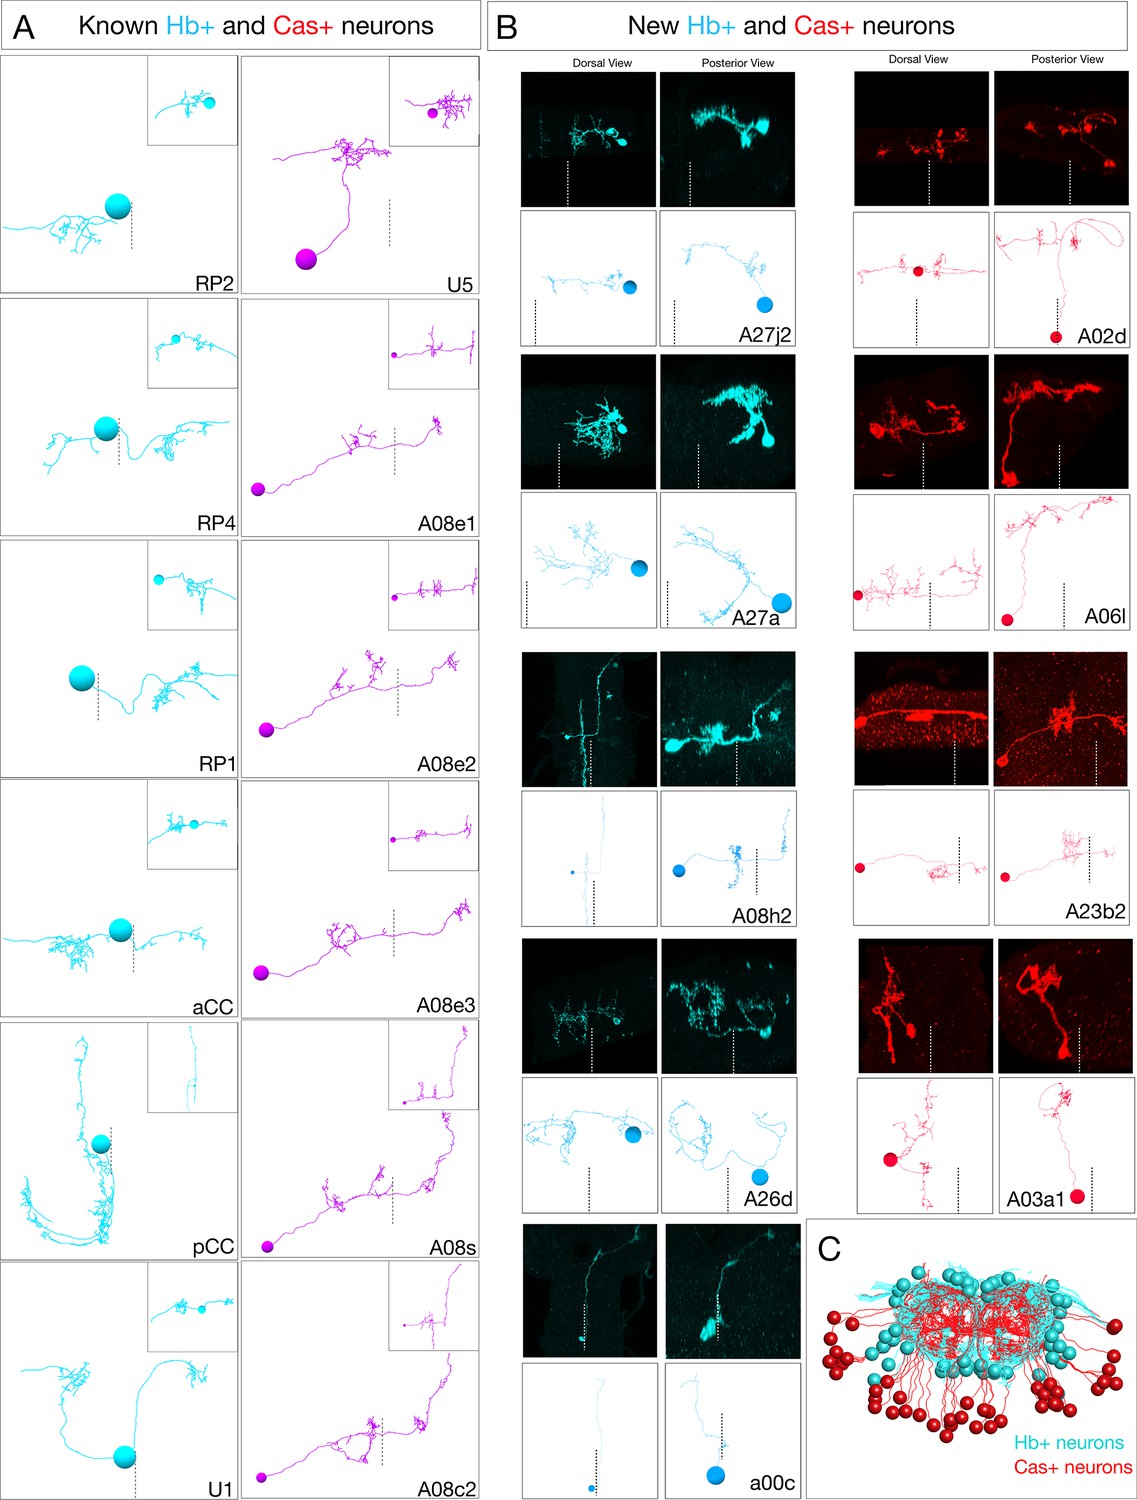
Ground truth Hb+ and Cas+ neurons used to define radial position as a proxy for temporal identity.
(A) Previously identified Hb+ or Cas+ neurons from the A1L TEM reconstruction. Hb neurons: cyan; Cas neurons: magenta. Dorsal view: anterior up; midline: dashes. Inset: posterior view. (B) Newly discovered Hb+ or Cas+ neurons identified by multicolor flip out (MCFO) using hb-lexA or cas-gal4. MCFO neurons: black panels; matching TEM reconstructed neurons: white panels. Midline: dashes. (C) All reconstructed Hb+ and Cas+ neurons from A1L and A1R shown in posterior view, dorsal up.
Figure 5—figure supplement 2
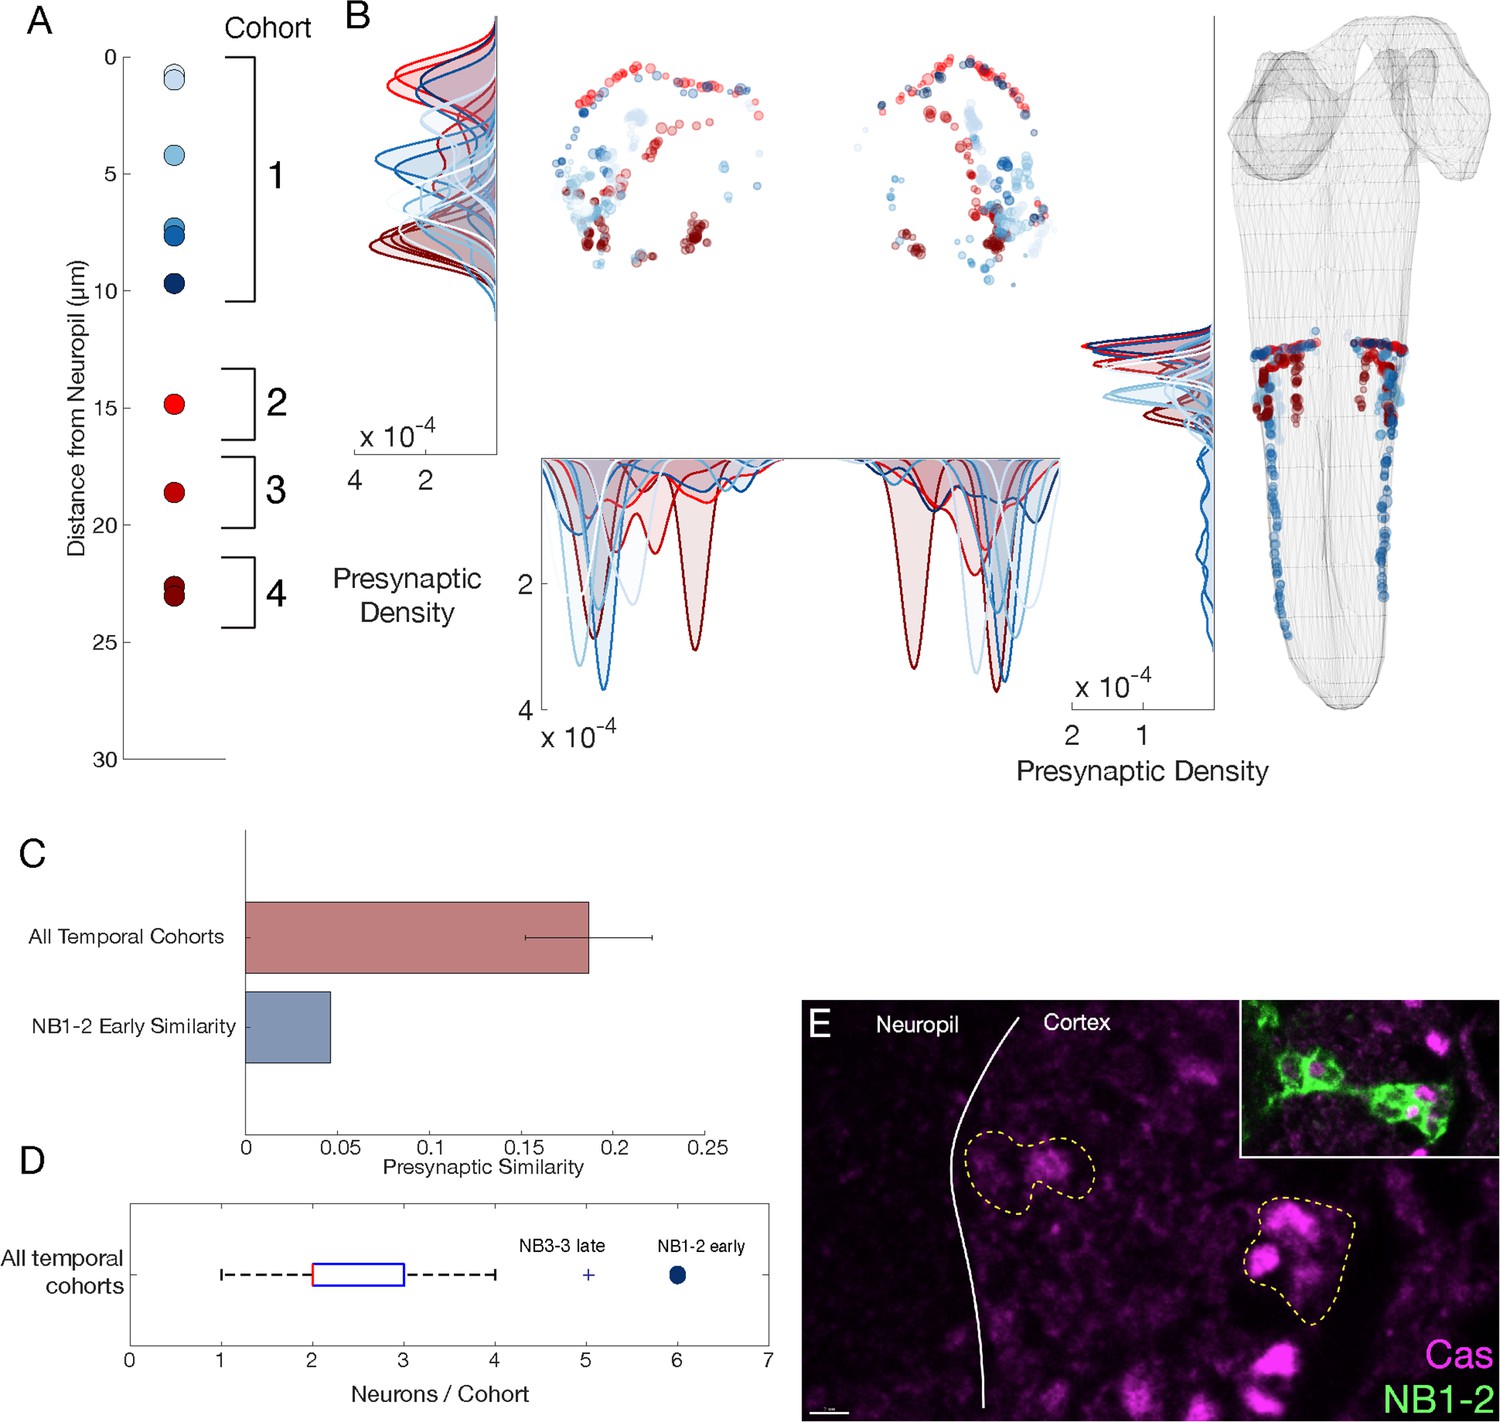
NB1-2 dorsal hemilineage: radial proxy is unreliable for determining the temporal identity.
(A) Presumptive temporal cohorts for NB1-2 dorsal (NB1-2D) hemilineage show an early cohort with six neurons, while mid and late cohorts have only one or two neurons, respectively. (B) Synaptic positions of presumptive temporal cohorts for NB1-2D show no tiling, unlike other hemilineage-temporal (HL-T) cohorts. (C) Mean presynapse similarity of NB1-2D early is ~70% less than the average synapse similarity observed in other HL-Ts. (D) Radially determined NB1-2D early has more cells than any other temporal cohort. The only other HL-T with a similar number is NB3-3, a late forming neuroblast with a known large Cas window (Baumgardt et al., 2014; Tsuji et al., 2008; Wreden et al., 2017). (E) NB1-2 Cas+ neurons are observed both close and far from the neuropil in suggesting radial proxy is a poor measure of birth-order for this lineage. Scale bar, 2 μm.
Figure 5—figure supplement 3

Neurons with a common temporal identity project widely within the neuropil.
(A) Temporal cohorts determined by radial proxy show broad projections throughout the neuropil. Posterior view: dorsal up; midline: vertical dashed line. (B) Temporal cohorts do not have synapse similarity greater than unrelated neurons. Synapse similarity of temporal cohorts (across hemilineages) does not confer a common axon/dendrite projection pattern, except for a small but significant difference observed among ventral hemilineage presynapses. NS: not significant, * signifies p<0.05, Wilcoxon rank-sum test. In this case, inter-cohort comparisons represent a common (radially determined) birth date, a common dorsal/ventral target, but unrelated by hemilineage.
Figure 6 with 2 supplements
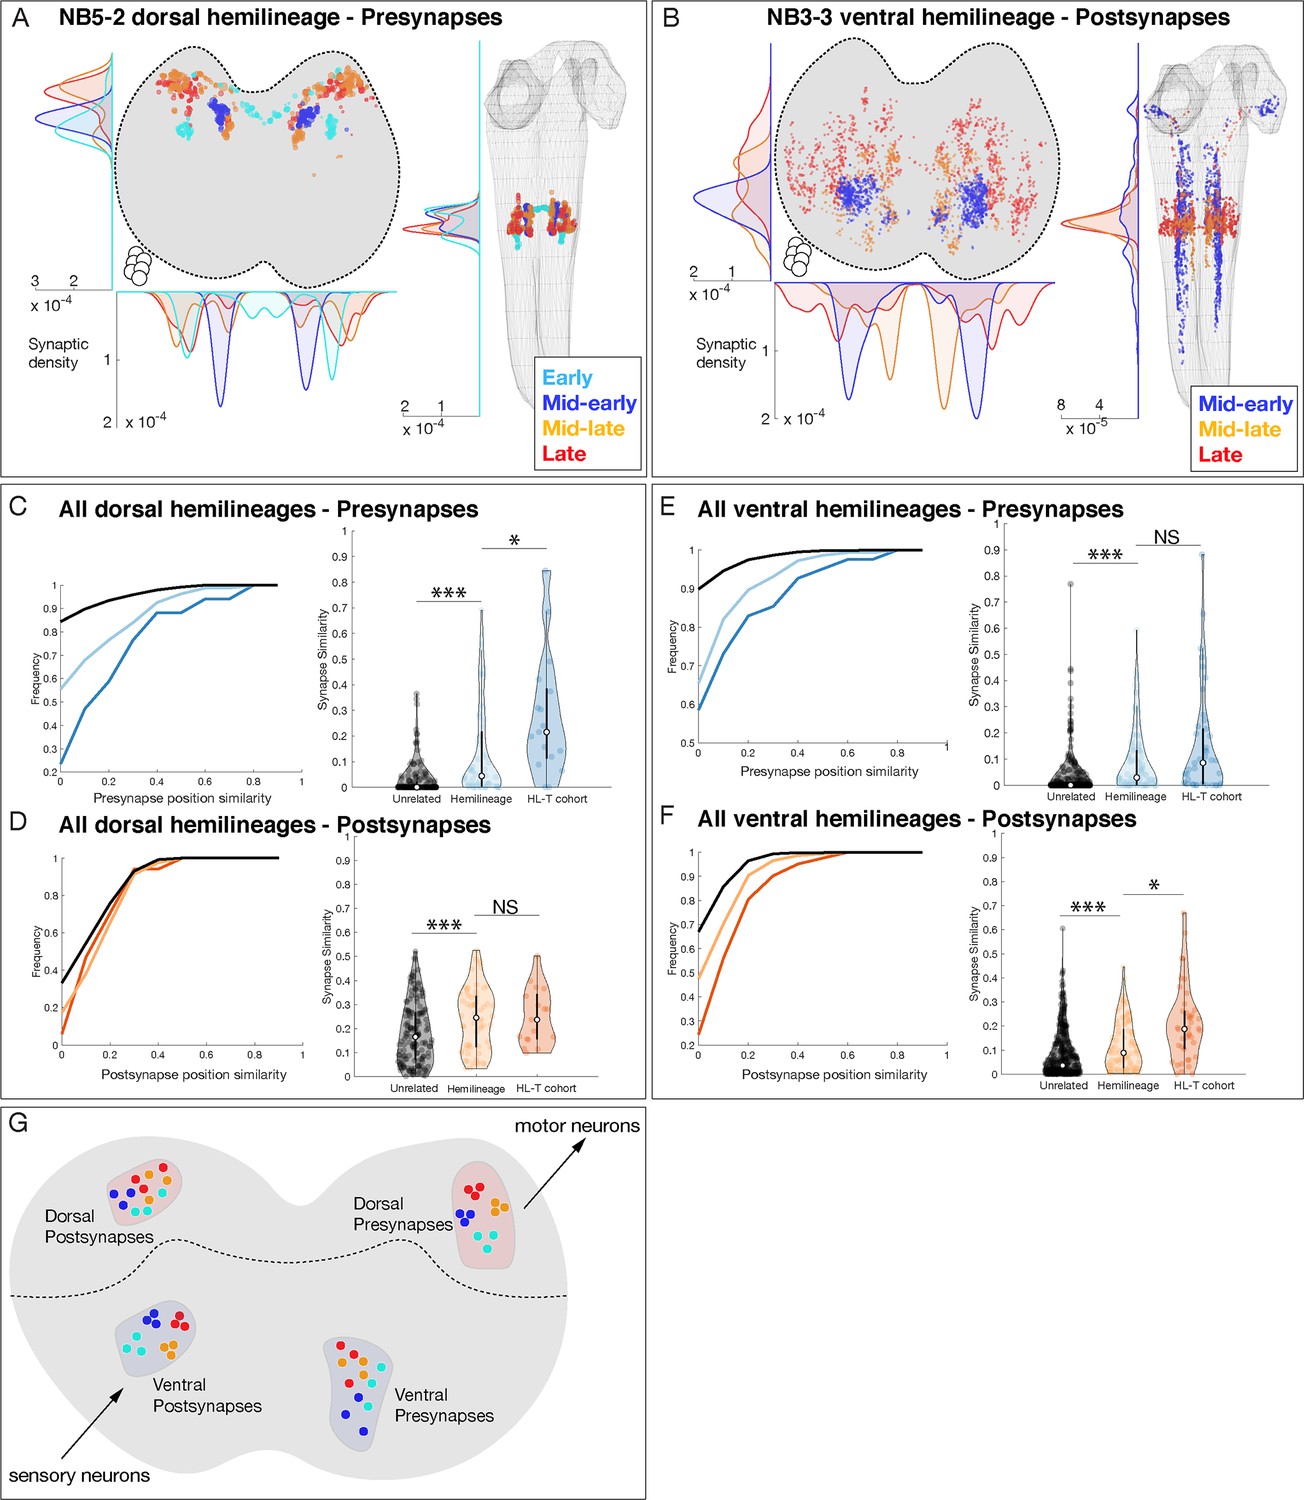
Hemilineage-temporal (HL-T) cohorts show synaptic tiling within motor or sensory neuropil.
(A, B) Hemilineages target their synapses within the neuropil. (A) NB5-2 dorsal hemilineage neurons segregate their presynapses to distinct regions of the neuropil. (B) NB3-3 ventral hemilineage neurons segregate their postsynapses to distinct regions of the neuropil. Circles: location of cell bodies. (C–F) HL-T cohorts target their synapses within each hemilineage domain. (C, D) All dorsal hemilineages in A1L. Left: cumulative plots showing that hemilineages have greater synaptic clustering than unrelated neurons, but that HL-T cohorts have greater presynaptic clustering than hemilineages alone. Right: histograms showing that hemilineages have greater presynaptic clustering than unrelated neurons, but that HL-T cohorts have more presynaptic clustering than hemilineages alone. Circles: location of cell bodies. (E, F) All ventral hemilineages in A1L. Left: cumulative plots showing that hemilineages have greater postsynaptic clustering than unrelated neurons, but that HL-T cohorts have greater postsynaptic clustering than hemilineages alone. Right: histograms showing that hemilineages have greater postsynaptic clustering than unrelated neurons, but that HL-T cohorts have more postsynaptic clustering than hemilineages alone. Hemilineage similarity refers to hemilineage-related neurons from different temporal cohorts. *p<0.05 or ***p<0.001 (Wilcoxon rank-sum test). Error bars, SEM. (G) Summary. Dorsal hemilineages tend to cluster presynapses, which provide input to motor neurons; ventral hemilineages tend to cluster postsynapses, which receive input from sensory neurons.
Figure 6—figure supplement 1
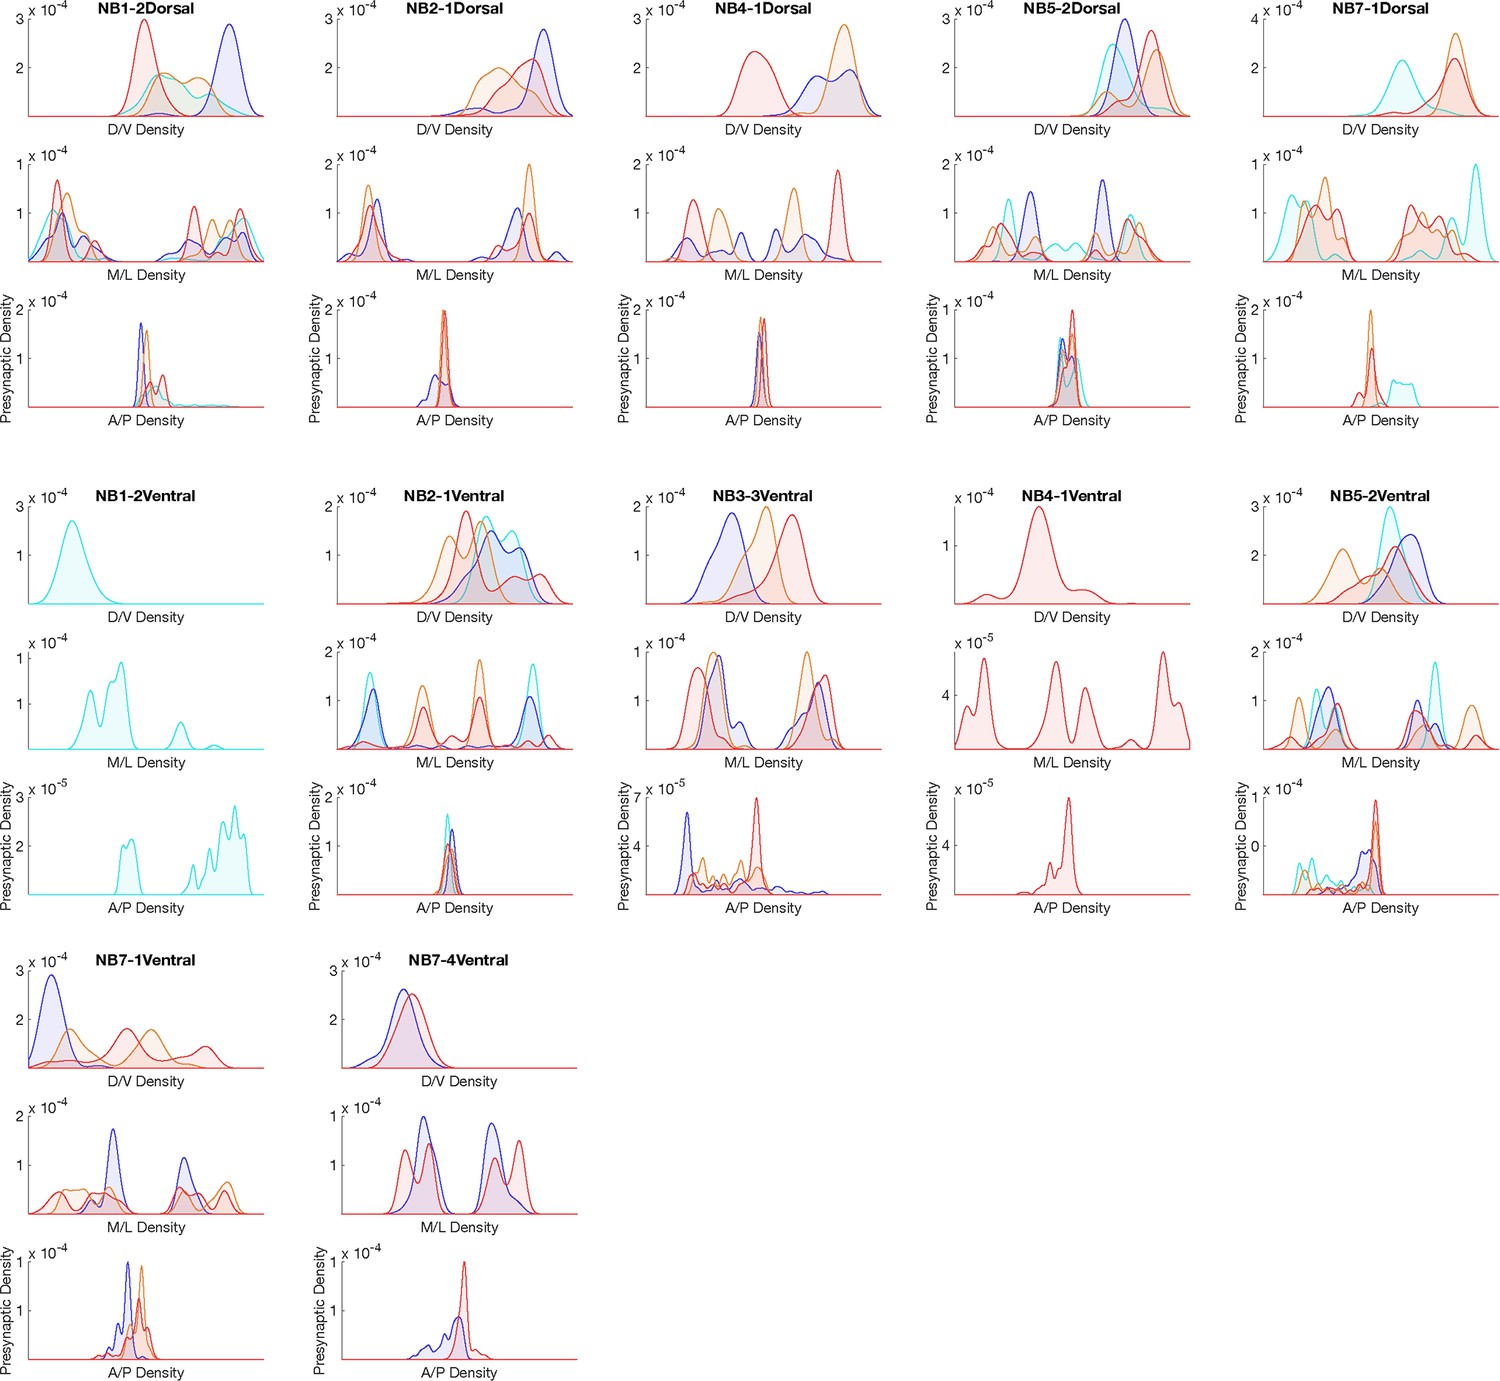
Hemilineage-temporal cohort presynapse distribution in the neuropil.
Presynaptic distributions across medio-lateral (M/L), dorsoventral (D/V), and anterior-posterior (A/P) axes for each hemilineage-temporal cohort.
Figure 6—figure supplement 2
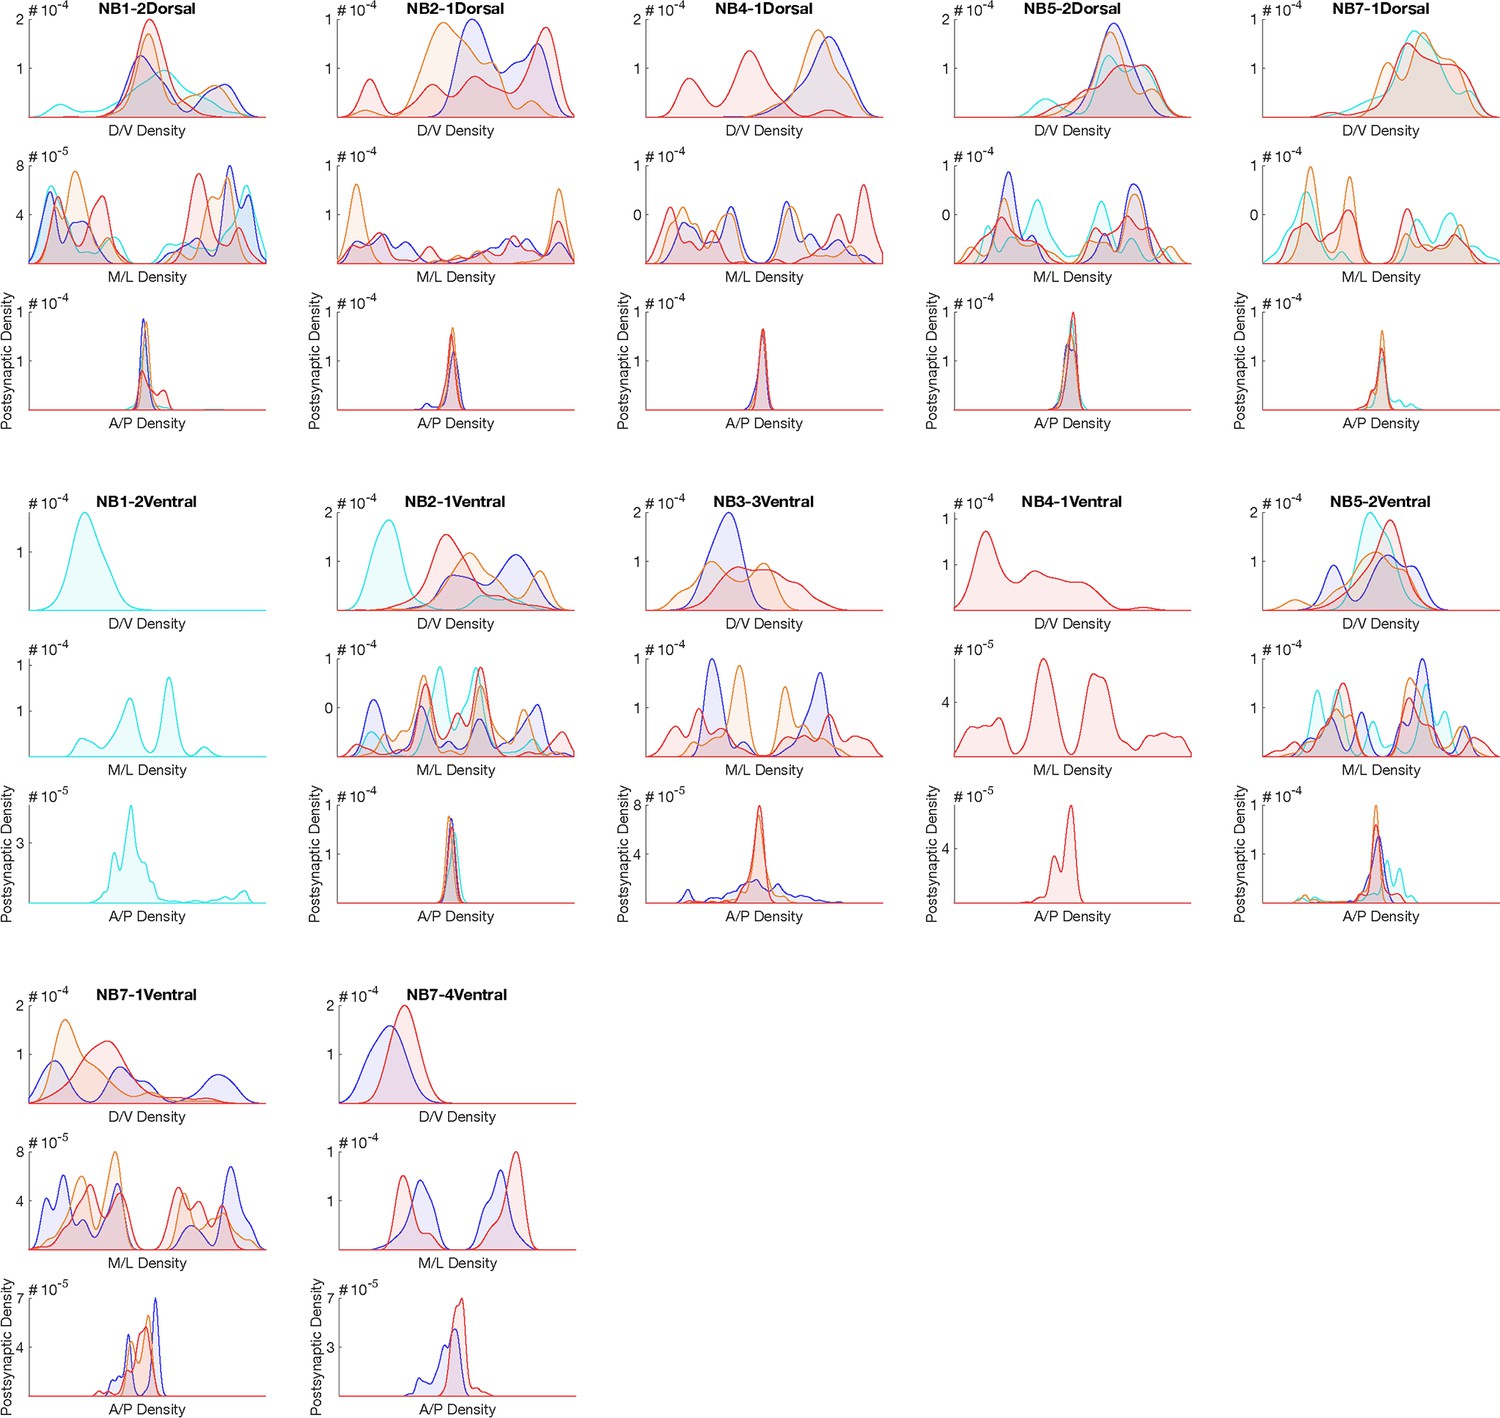
Hemilineage-temporal cohort postsynapse distribution in the neuropil.
Postsynaptic distributions across M/L, D/V, and A/P axes for each hemilineage-temporal cohort.
Figure 7
Hemilineages and hemilineage-temporal cohorts have more shared connectivity than unrelated neurons.
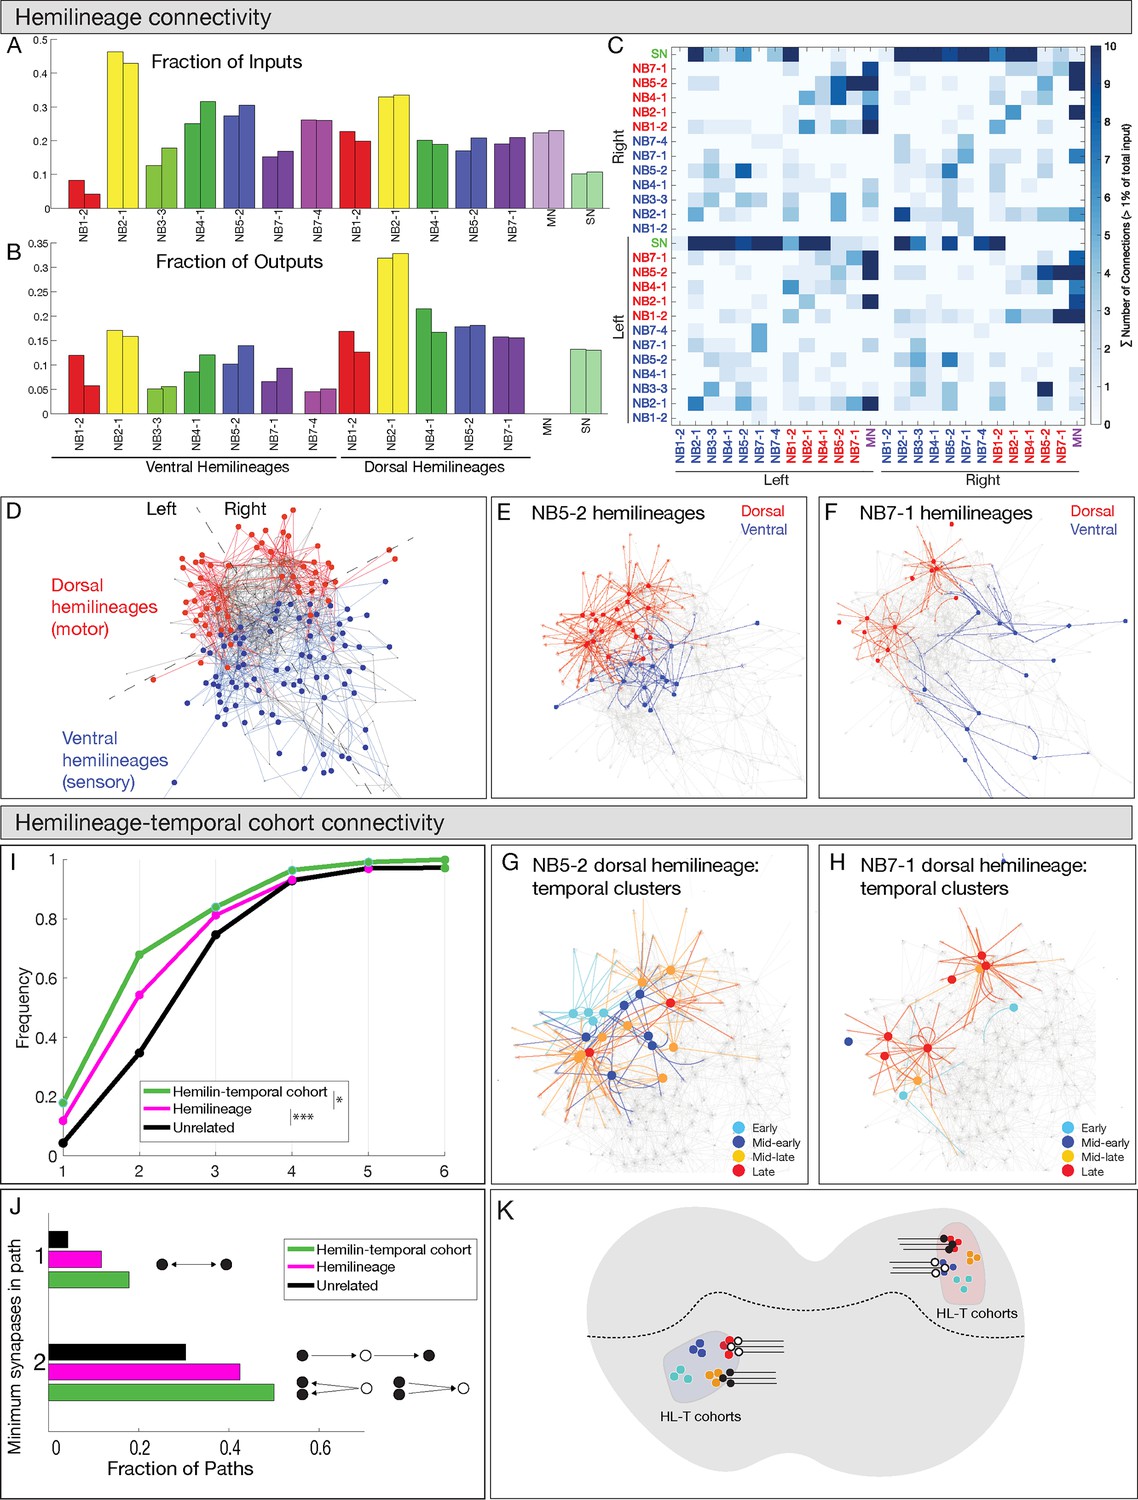
(A–C) Connectivity is similar for hemilineages in A1L and A1R. (A, B) Fraction of inputs/outputs for each hemilineage; (C) heatmap showing connectivity between dorsal hemilineages (red), ventral hemilineages (blue), motor neuron dendrites (MN), and sensory neuron axons (SN). (D–F) Dorsal and ventral hemilineages have distinct connectivity. (D) Force directed network graph of all 160 interneurons, together with sensory afferents and motor dendrites. Neurons with similar connectivity appear closer in network space. Red edges represent dorsal hemilineage connectivity; blue edges represent ventral hemilineage connectivity. (E) Force-directed network graph highlighting the lack of shared connectivity between dorsal and ventral hemilineages in the NB5-2 progeny. (F) Force-directed network graph highlighting the lack of shared connectivity between dorsal and ventral hemilineages in the NB7-1 progeny. (G–J) Hemilineage-temporal cohorts within a hemilineage have shared connectivity. (G, H) Force-directed network graphs highlighting the shared connectivity of hemilineage-temporal cohorts within NB5-2 or NB7-1 progeny. (I) Cumulative distribution of the number of synapses between temporal cohorts of hemilineage-related neurons, hemilineage-related neurons, or random neurons. Neurons that belonged to a temporal cohort with only one neuron were not analyzed (16 neurons). Random neurons were selected from the same hemisegment. (J) Quantification of the number of directly connected pairs of neurons, neurons separated by one or two synapses. Black circles represent pairs of neurons connected by one synapse (top) or two synapses (bottom). (K) Summary.
Figure 8
Hemilineage-temporal (HL-T) cohorts have greater shared synaptic connectivity than unrelated neurons or hemilineages.
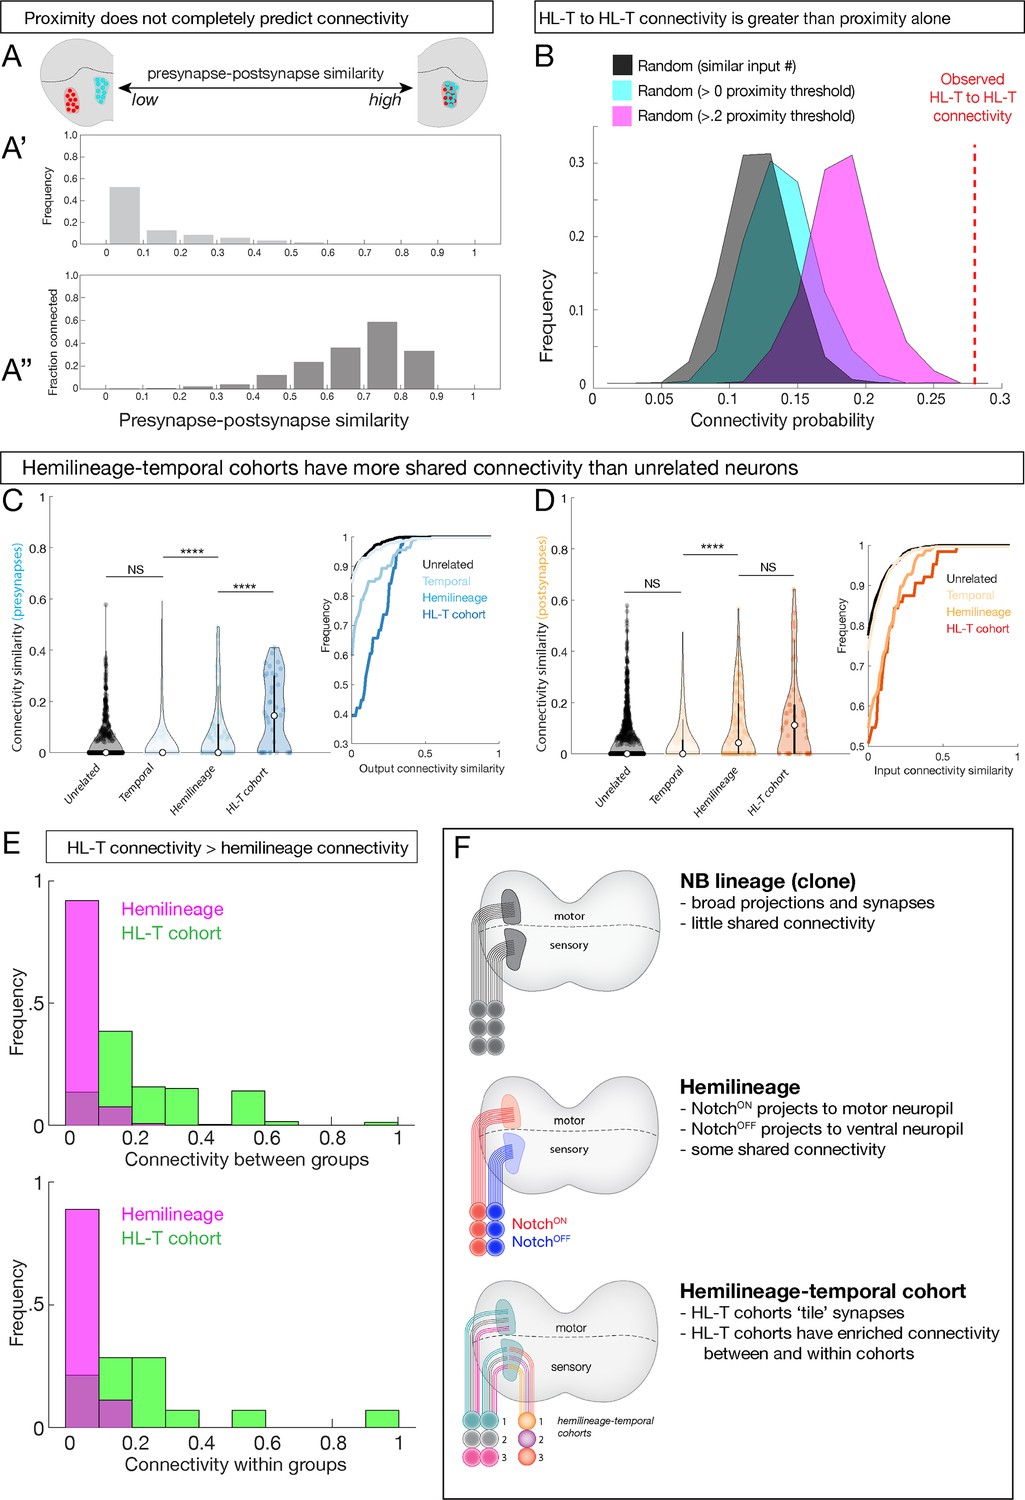
(A-A'') Axon-dendrite proximity alone does not predict connectivity. The distribution of presynaptic/postsynaptic overlap for all neurons analyzed; higher ‘similarity’ = smaller average 3D distance between presynapses and postsynapses. (Top) Most neuronal pairs have little overlap (0–0.1 score) in presynapse/postsynapse position. (Bottom) Presynaptic and postsynaptic neurons have increasing connectivity probability as the distance between presynapses and postsynapses decreases, but even neurons with the most presynapse/postsynapse overlap often fail to be connected (e.g., 0.7–0.9 similarity are <0.6 connectivity). (B) HL-T to HL-T connectivity occurs more frequently than can be explained by proximity alone. Red dashed line indicates observed frequency that a pair of neurons in a HL-T cohort connect to one or more neurons in another HL-T cohort. Two synapse threshold used. Colored distributions represent data shuffled on the basis of proximity, while the black distribution is data shuffled on the basis of input probability (see Materials and methods). (C, D) HL-T cohorts have common synaptic partners. Left: violin plots; median: white circle. Right: cumulative plots. (C) HL-T cohort presynapses have greater shared connectivity than observed for unrelated neurons, temporal cohorts, or hemilineages. (D) In contrast, HL-T cohort postsynapses have greater shared connectivity than observed for unrelated neurons, temporal cohorts, but not for hemilineages. Connectivity similarity is equivalent to one minus the cosine distance between the presynapses (C, blue) or postsynapses (D, orange) vectors of the binarized connectivity matrix. ****p<0.0001 in a Mann–Whitney test. (E) Top: there is greater connectivity between pairs of HL-T cohorts (green) than between pairs of hemilineages (magenta). Bottom: there is greater connectivity within a single HL-T cohort (green) than within a single hemilineage (magenta). (F) Summary.
Figure 9
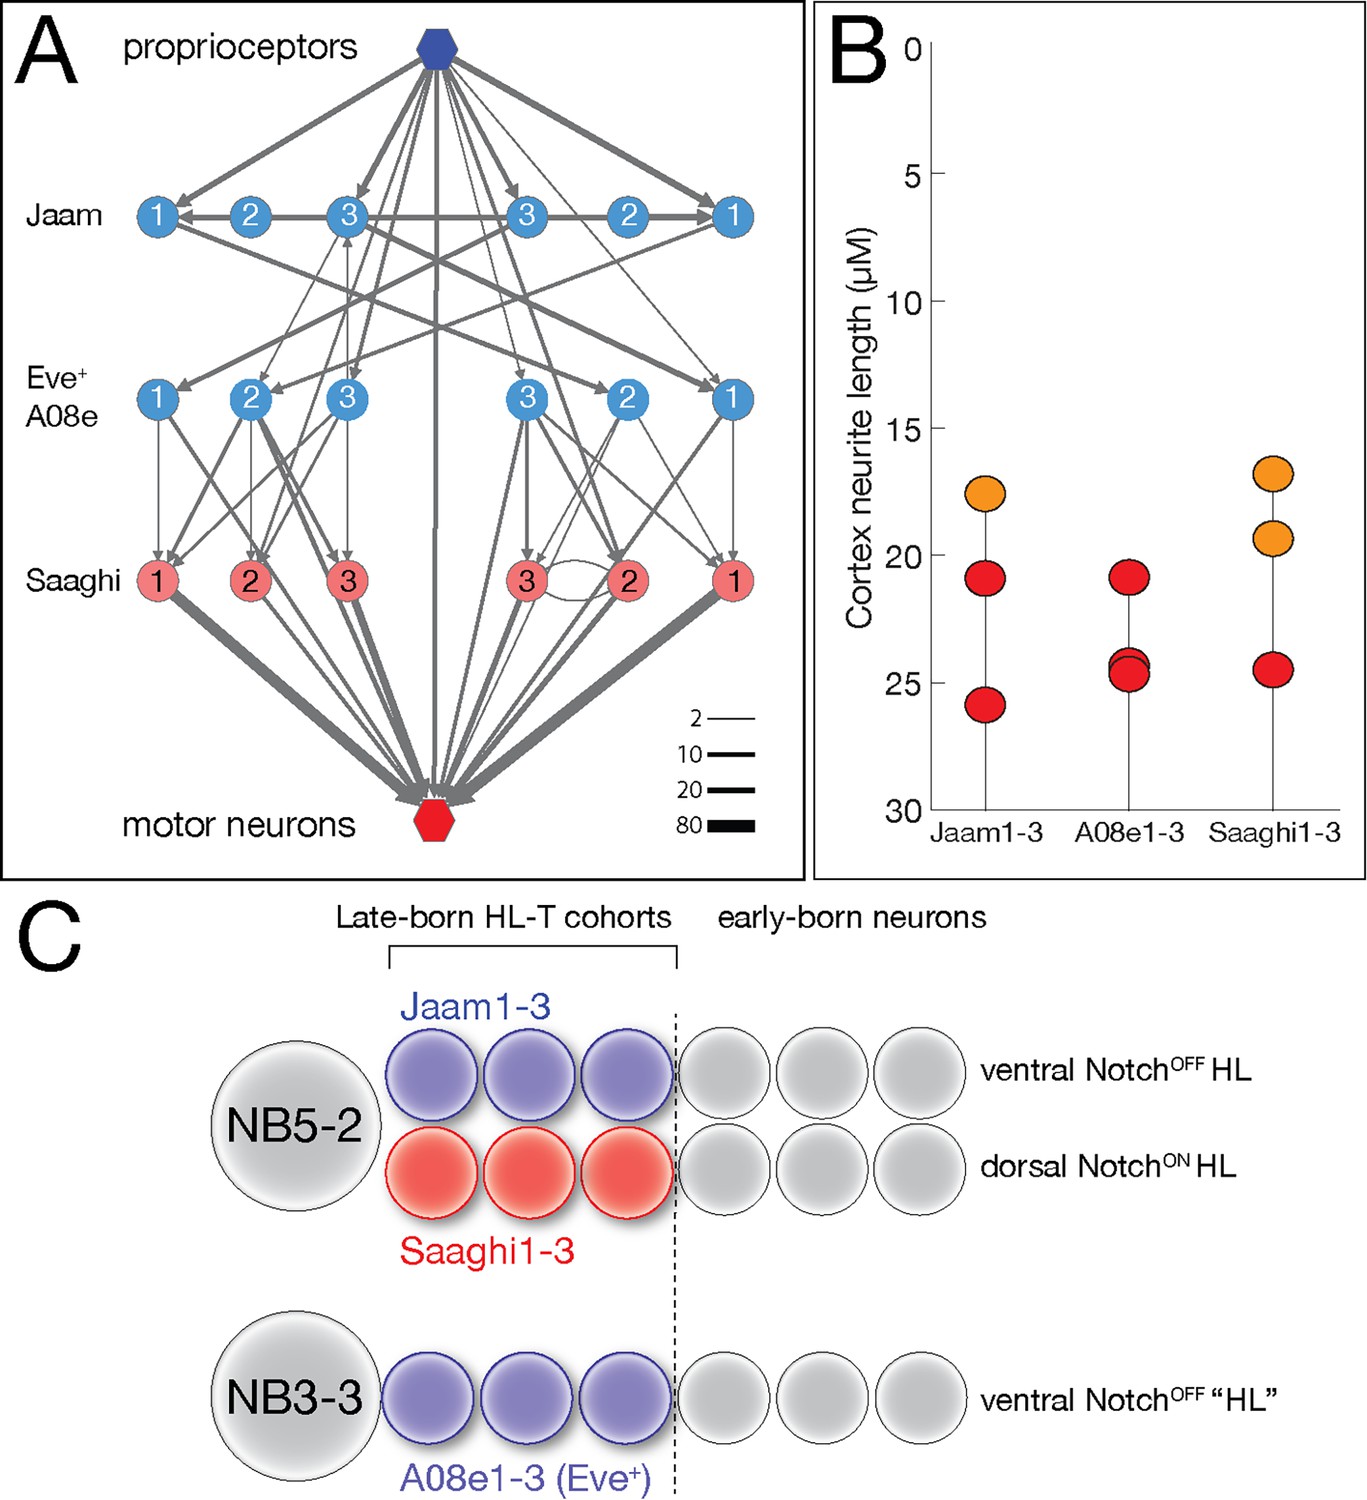
Hemilineage-temporal cohorts assemble a proprioceptive circuit.
(A) The Eve-lateral (EL) proprioceptive circuit (Heckscher et al., 2015), including hemilineage-temporal cohort membership. MNs: motor neurons. (B) Average cortex neuron length for the nine interneurons shown in (A) in the left and right hemisegments; all are in the late-born groups 3 and 4, colored orange and red, respectively (Supplementary file 1). (C) Developmental origin of the Eve+ proprioceptive circuit. NB5-2 generates a NotchOFF hemilineage including late-born Jaam1-3 neurons, and a NotchON hemilineage including the late-born Saaghi1-3 neurons. NB3-3 undergoes a type 0 division pattern where the neuroblast progeny do not divide and remain NotchOFF (Baumgardt et al., 2014; Wreden et al., 2017), effectively creating a NotchOFF‘hemilineage’ that includes the late-born A08e1-3 Eve+ neurons. Thus, the proprioceptive circuit shown in (A) comprises three interconnected hemilineage-temporal cohorts.
Tables
Key resources table
| Reagent type (species) or resource | Designation | Source or reference | Identifiers | Additional information |
|---|---|---|---|---|
| Genetic reagent (Drosophila melanogaster) | R16A05AD R28H10DBD | Lacin et al., 2019 | RRID:BDSC_70900 RRID:BDSC_69496 | NB1-2 split Gal4 |
| Genetic reagent (Drosophila melanogaster) | R70D06AD R28H10DBD | Lacin et al., 2019 | RRID:BDSC_69496 RRID:BDSC_70900 | NB2-1 split Gal4 |
| Genetic reagent (Drosophila melanogaster) | AcAD GsbDBD, 25A05kz | Seroka and Doe, 2019 | RRID:BDSC_70983 | NB7-1 split Gal4 |
| Genetic reagent (Drosophila melanogaster) | R19B03AD R18F07DBD | Lacin et al., 2019 | RRID:BDSC_70579 RRID:BDSC_70047 | NB7-4 split Gal4 |
| Genetic reagent (Drosophila melanogaster) | castor-gal4 | Gift from Technau lab | Late-born neuron marker | |
| Genetic reagent (Drosophila melanogaster) | hsFlp.G5.PEST.Opt | BDSC | RRID:BDSC_77140 | Heat-inducible Flp recombinase |
| Genetic reagent (Drosophila melanogaster) | 26XLexAop2-mCD8::GFP | BDSC | RRID:BDSC_32207 | LexA reporter |
| Genetic reagent (Drosophila melanogaster) | 13XLexAop2-IVS-myr::GFP | BDSC | RRID:BDSC_32210 | LexA reporter |
| Genetic reagent (Drosophila melanogaster) | dpn(FRT.stop)LexA.p65 | BDSC | RRID:BDSC_56162 | Used with hsFlp and lexAop-GFP to visualize clones in single neuroblasts |
| Genetic reagent (Drosophila melanogaster) | 13XLexAop2-IVS-myr::GFP | BDSC | RRID:BDSC_32210 | LexA reporter |
| Genetic reagent (Drosophila melanogaster) | w[1118] P{y[+t7.7] w[+mC]=R57 C10-FLPG5.PEST}attP18; P{y[+t7.7] w[+mC]=10xUAS(FRT.stop)myr::smGdP-OLLAS}attP2 PBac{y[+mDint2] w[+mC]=10xUAS(FRT.stop)myr::smGdP-HA}VK00005 P{10xUAS(FRT.stop)myr::smGdP-V5-THS-10xUAS(FRT.stop)myr::smGdP-FLAG}su(Hw)attP1 | BDSC | RRID:BDSC_64091 | Multicolor Flp Out stock (Nern et al., 2015) |
| Genetic reagent (Drosophila melanogaster) | Sco/CyO; Dr/TM3,Sb | BDSC | RRID:BDSC_34516 | |
| Genetic reagent (Drosophila melanogaster) | LexA-T2A-Hb | This work | Endogenous hb locus CRISPR engineered to place LexAp65-T2A upstream and in frame with the first hb ORF | |
| Genetic reagent (Drosophila melanogaster) | hey:T2A:FLP, UAS-myr:GFP, UAS-FRT-stop-FRT-myr:sfGdP:HA | This work | Labels Hey+ (NotchON) neurons within a Gal4+ neuronal population | |
| Antibody, polyclonal | Rabbit anti-GFP A-11122 | ThermoFisher, Waltham, MA | RRID:AB_221569 | 1:500 |
| Antibody, polyclonal | Chicken anti-GFP | Abcam, Eugene, OR | RRID:BDSC_13970 | 1:1000 |
| Antibody, polyclonal | Camelid sdAB direct labeled with AbberiorStar635P ‘FluoTag-Q anti-GFP’ #N0301 | NanoTab Biotech., Gottingen, Germany | 1:1000 | |
| Antibody, polyclonal | Rabbit anti-mCherry NBP2-25157 | Novus, Littleton, CO | RRID:AB_2753204 | 1:1000 |
| Antibody, polyclonal | Alexa Fluor 488-conjugated rabbit anti-GFP NBP1-69969 | ThermoFisher (Eugene, OR) | RRID:AB_221477 | 1:1000 |
| Antibody, monoclonal | Mouse anti-FasII 1D4 | DSHB (Iowa City, IA) | RRID:AB_528235 | 1:100 |
| Antibody, monoclonal | Mouse anti-HA(6E2) #2350 | Cell Signaling, Danvers, MA | RRID:AB_491023 | 1:200 |
| Antibody, polyclonal | Rabbit anti-V5 Dylite 549 #600-442-378 | Rockland, Atlanta, GA | RRID:AB_1961802 | 1:400 |
| Antibody, polyclonal | Rabbit anti-FLAG Dylite488 # 600-441-383 | Rockland, Atlanta, GA | RRID:AB_1961508 | 1:200 |
| Antibody, monoclonal | Mouse anti-Engrailed 4D9 | DSHB (Iowa City, IA) | RRID:AB_528224 | 1:100 |
| Antibody, polyclonal | Rabbit anti-Hb | Doe lab | 1:400 | |
| Antibody, polyclonal | Alexa Fluor405 Phalloidin | ThermoFisher (Eugene, OR) | 1:40 | |
| Antibody, polyclonal | Secondary antibodies | ThermoFisher (Eugene, OR) | 1:400 | |
| Sequence-based reagent | pHD-DsRed | Addgene | RRID:Addgene_51434 | |
| Sequence-based reagent | pCFD5 | Addgene | RRID:Addgene_73914 |
Additional files
-
Supplementary file 1
All the neurons described in this paper.
Neurons are annotated for names/synonyms, parental neuroblast, hemilineage, and radial position.
- https://cdn.elifesciences.org/articles/67510/elife-67510-supp1-v3.csv
-
Transparent reporting form
- https://cdn.elifesciences.org/articles/67510/elife-67510-transrepform-v3.docx
Download links
A two-part list of links to download the article, or parts of the article, in various formats.
Downloads (link to download the article as PDF)
Open citations (links to open the citations from this article in various online reference manager services)
Cite this article (links to download the citations from this article in formats compatible with various reference manager tools)
A developmental framework linking neurogenesis and circuit formation in the Drosophila CNS
eLife 10:e67510.
https://doi.org/10.7554/eLife.67510


