Stress diminishes outcome but enhances response representations during instrumental learning
- Department of Cognitive Psychology, Universität Hamburg, Germany
- Department of Experimental Psychology, and Oxford Centre for Human Brain Activity, Wellcome Centre for Integrative Neuroimaging, Department of Psychiatry, University of Oxford, United Kingdom
Figures
Figure 1
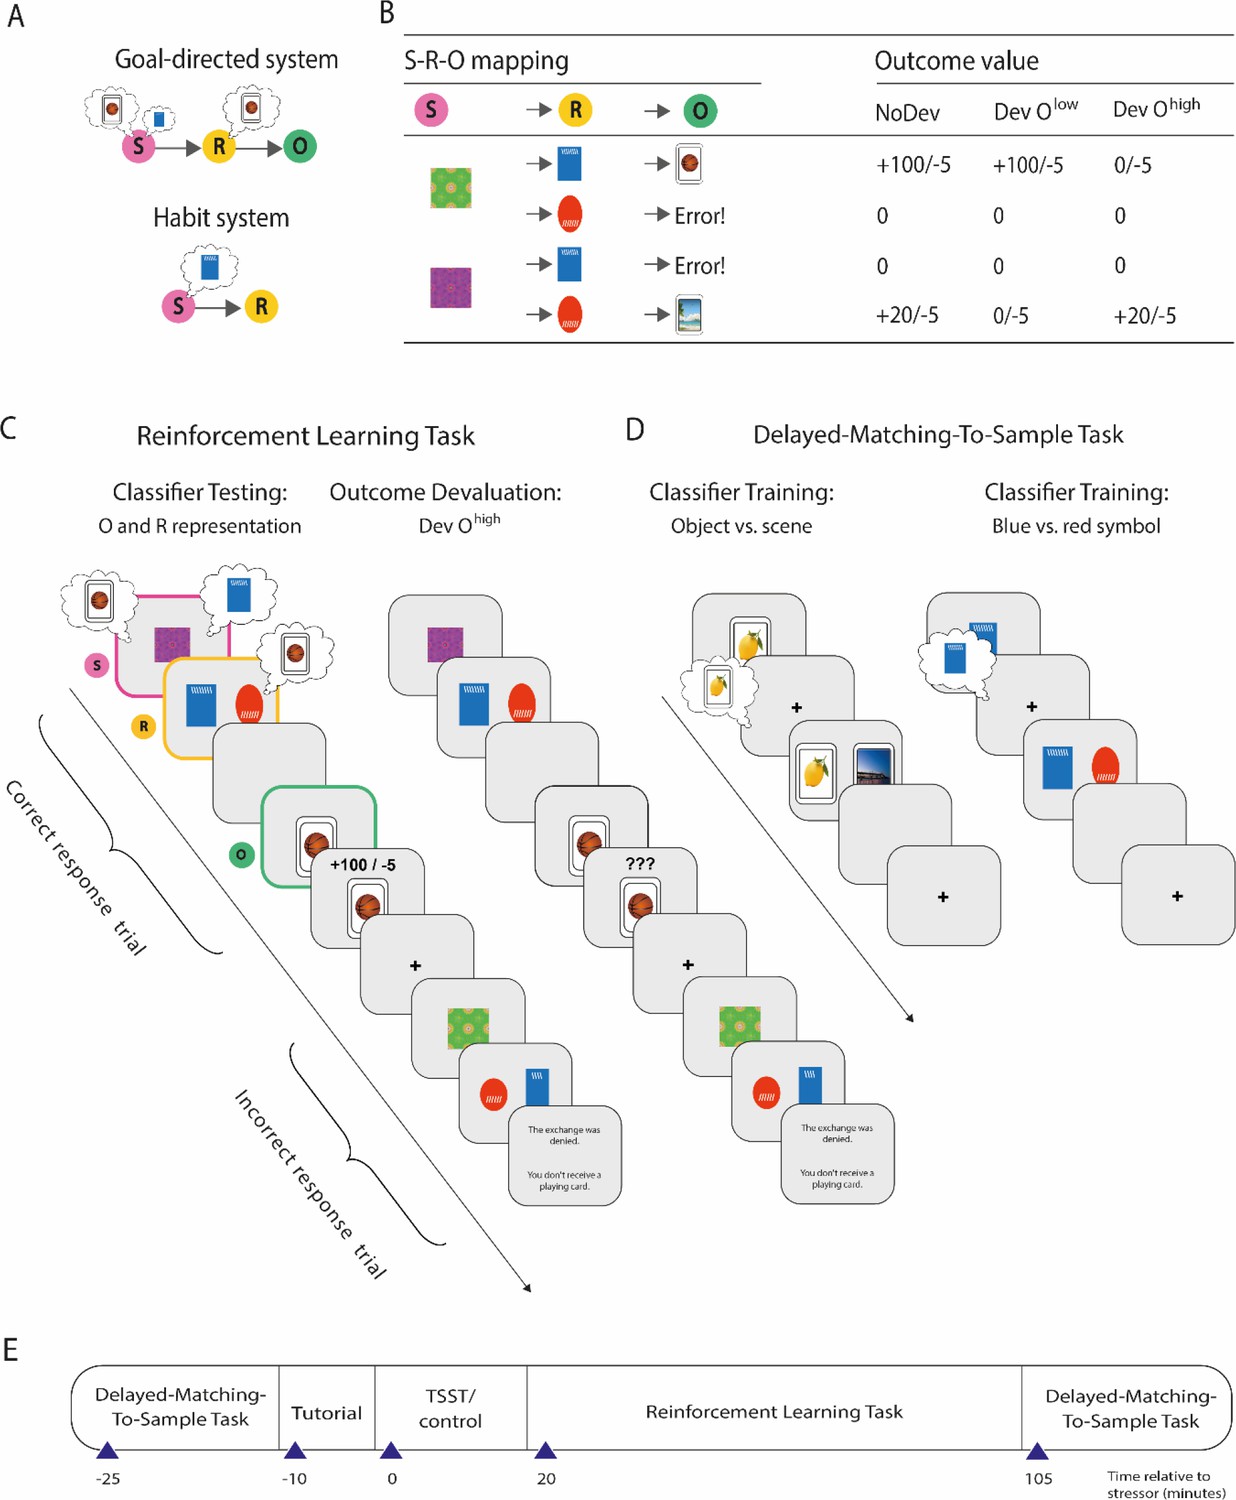
Overview of the paradigm used to decode outcome and response representations.
(A) Illustration of the goal-directed and habit system. While the goal-directed system encodes associations between stimulus (S), response (R), and outcome (O), the habit system acquires S-R associations independent of the outcome engendered by the response. In accordance with this, the goal-directed system relies on outcome representations, whereas the habitual system does not. In contrast, response representations during stimulus presentation may be relevant for both habitual S-R and goal-directed S-R-O processing. (B) S-R-O mappings in the reinforcement learning task and outcomes in trials in which either none of the possible outcomes were devalued (NoDev), the outcome with lower value was devalued (Dev Olow), or the outcome with the higher value was devalued (Dev Ohigh). (C) Schematic representation of the reinforcement learning task in which participants were trained on S-R-O sequences in a trial-by-trial manner. Using an EEG-based support vector machine (SVM), neural representations of the outcome stimuli (object vs. scene) were decoded during stimulus presentation and during response choice. Moreover, neural representations of the response options (blue vs. red alien) were decoded during stimulus presentation. During devaluation blocks, participants saw on the last screen of each trial ‘???’ instead of the outcome value. (D) The SVM was trained in an unrelated delayed-matching-to-sample task (maintenance phase) that required participants to keep stimuli in mind that belonged to categories used as outcomes or response options during the reinforcement learning task. (E) Timeline of the experiment.
Figure 2 with 4 supplements
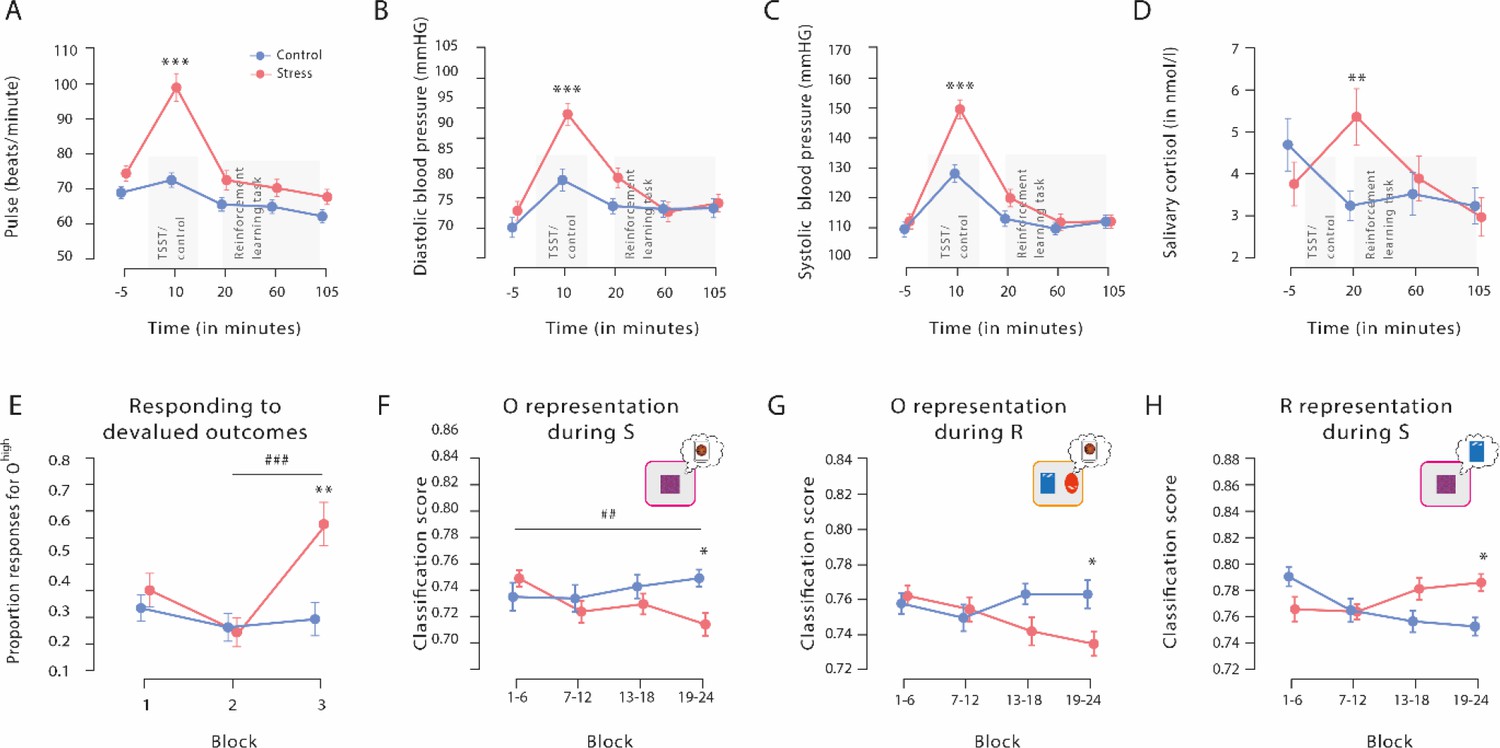
Physiological responses to the Trier Social Stress Test (TSST), proportion of responses for devalued outcomes, and outcome and response representations throughout the reinforcement learning task.
The exposure to the TSST, but not to the control manipulation, resulted in a significant increase in pulse (A), diastolic blood pressure (B), systolic blood pressure (C), and salivary cortisol (D). The grey bars denote the timing and duration of the treatment (TSST vs. control condition) and the respective reinforcement learning task. (E) Proportion of responses for devalued outcomes across the reinforcement learning task during Dev Ohigh blocks. As training proceeded, stressed participants increasingly selected actions that led to a devalued outcome. In addition, stressed participants responded significantly more often to the devalued action than non-stressed controls in the third devaluation block at the end of the task. Individual data points are shown in Figure 3. The data for Dev Olow and NoDev blocks is presented in Figure 3—figure supplement 1 and Figure 3—figure supplement 2, respectively. (F and G) Outcome representation during stimulus presentation and response choice. As training proceeded, the outcome representations decreased in the stress group, while there were no changes in the control group (blocks 1–4 vs. blocks 19–24). At the end of the learning task, outcome representations were significantly lower in stressed participants than in controls. (H) Response representations during stimulus presentation. Stressed participants showed significantly stronger response representations after extended training compared to the control group. Data represents means and error bars represent the SE of the mean. *** p<0.001, ** p<0.01, and * p<0.05, Bonferroni-corrected (group differences, corrected for all time points and blocks, respectively). ### p<0.001, ## p<0.01, Bonferroni-corrected (block differences, corrected for the number of blocks).
Figure 2—figure supplement 1
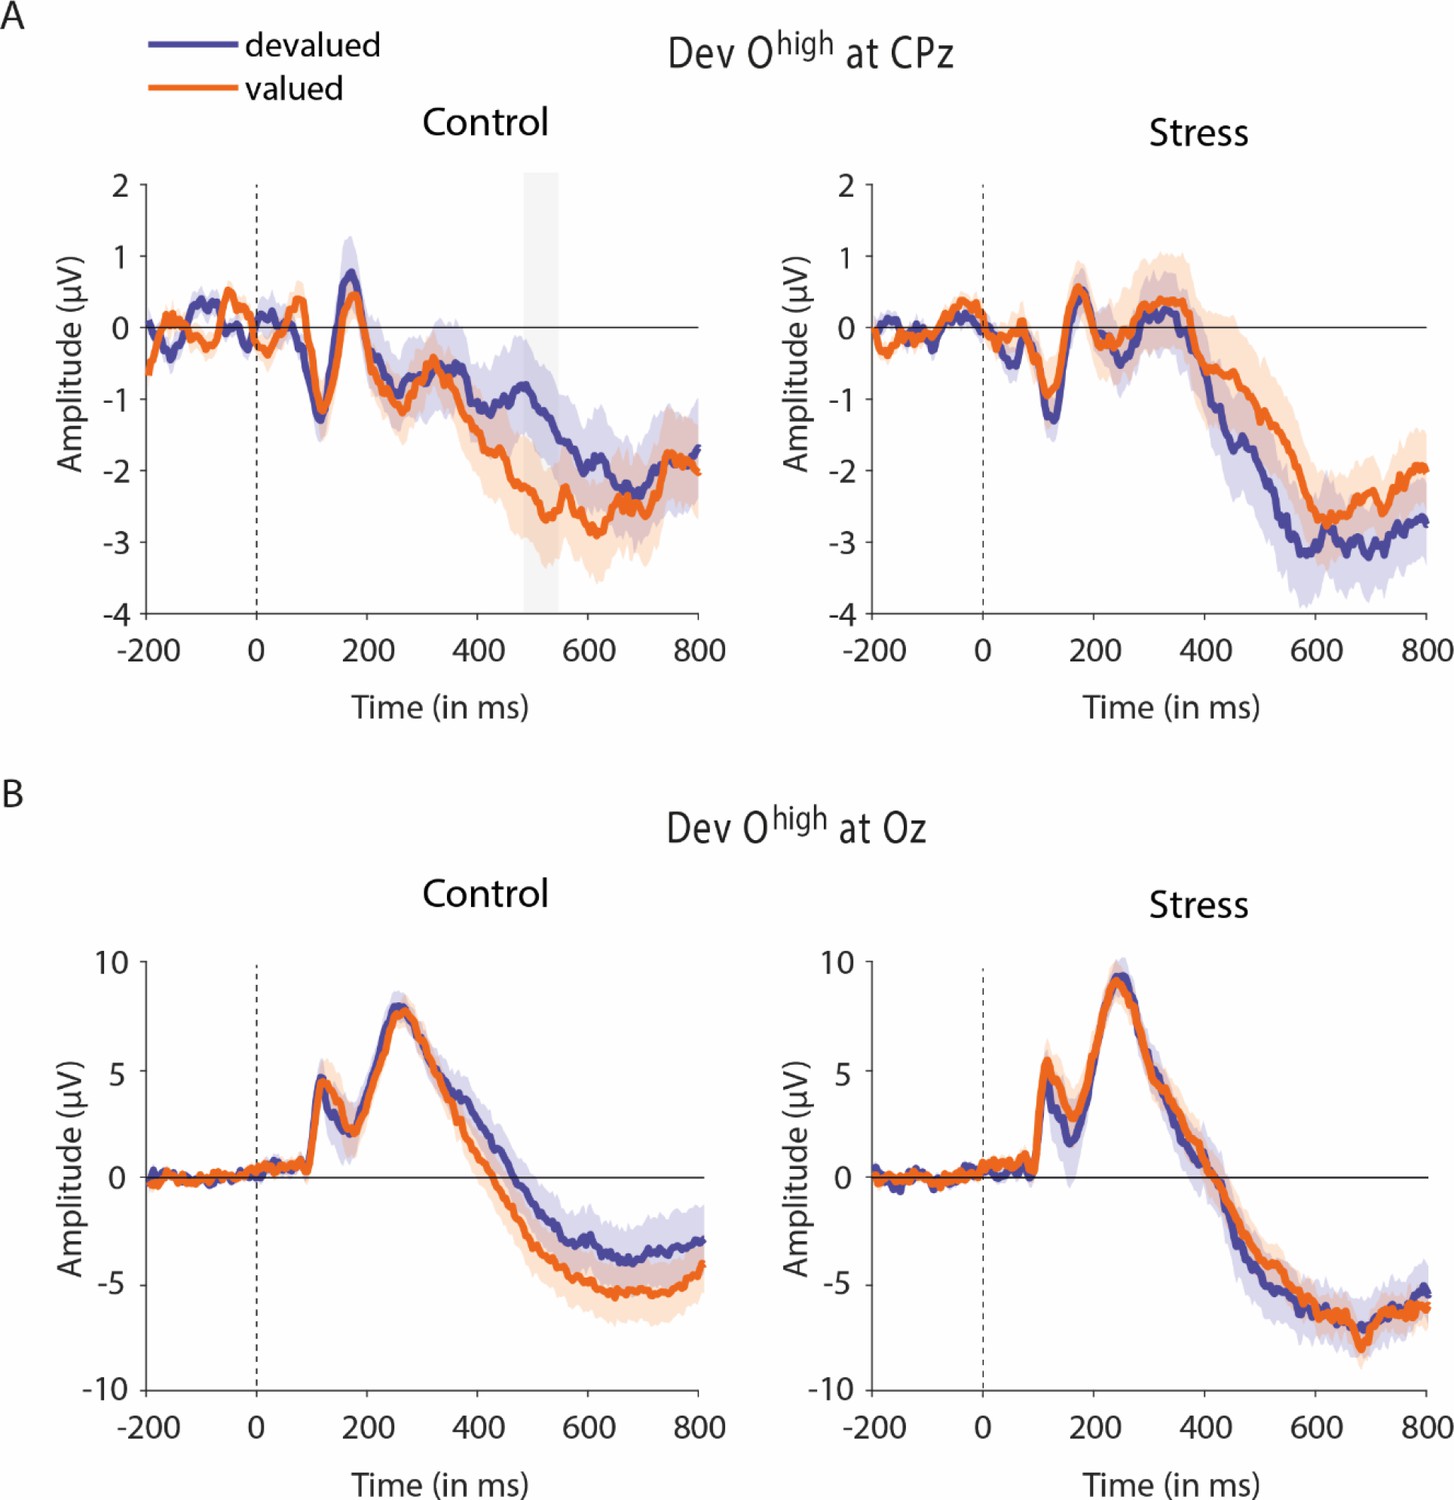
Event-related potentials during Dev Ohigh blocks.
(A) Mean centroparietal activity for devalued and valued stimuli during Dev Ohigh for control and stressed participants (baseline-corrected). The late component tended to be sensitive to the outcome devaluation in the control group but not in the stress group. The light-coloured background bar refers to the time range showing marginally significant group differences. (B) Mean occipital activity for devalued and valued stimuli during Dev Ohigh for control and stressed participants (baseline-corrected). The stimulus-locked P1 component was insensitive to outcome devaluation in both groups. Data represents means ± SEM.
Figure 2—figure supplement 2
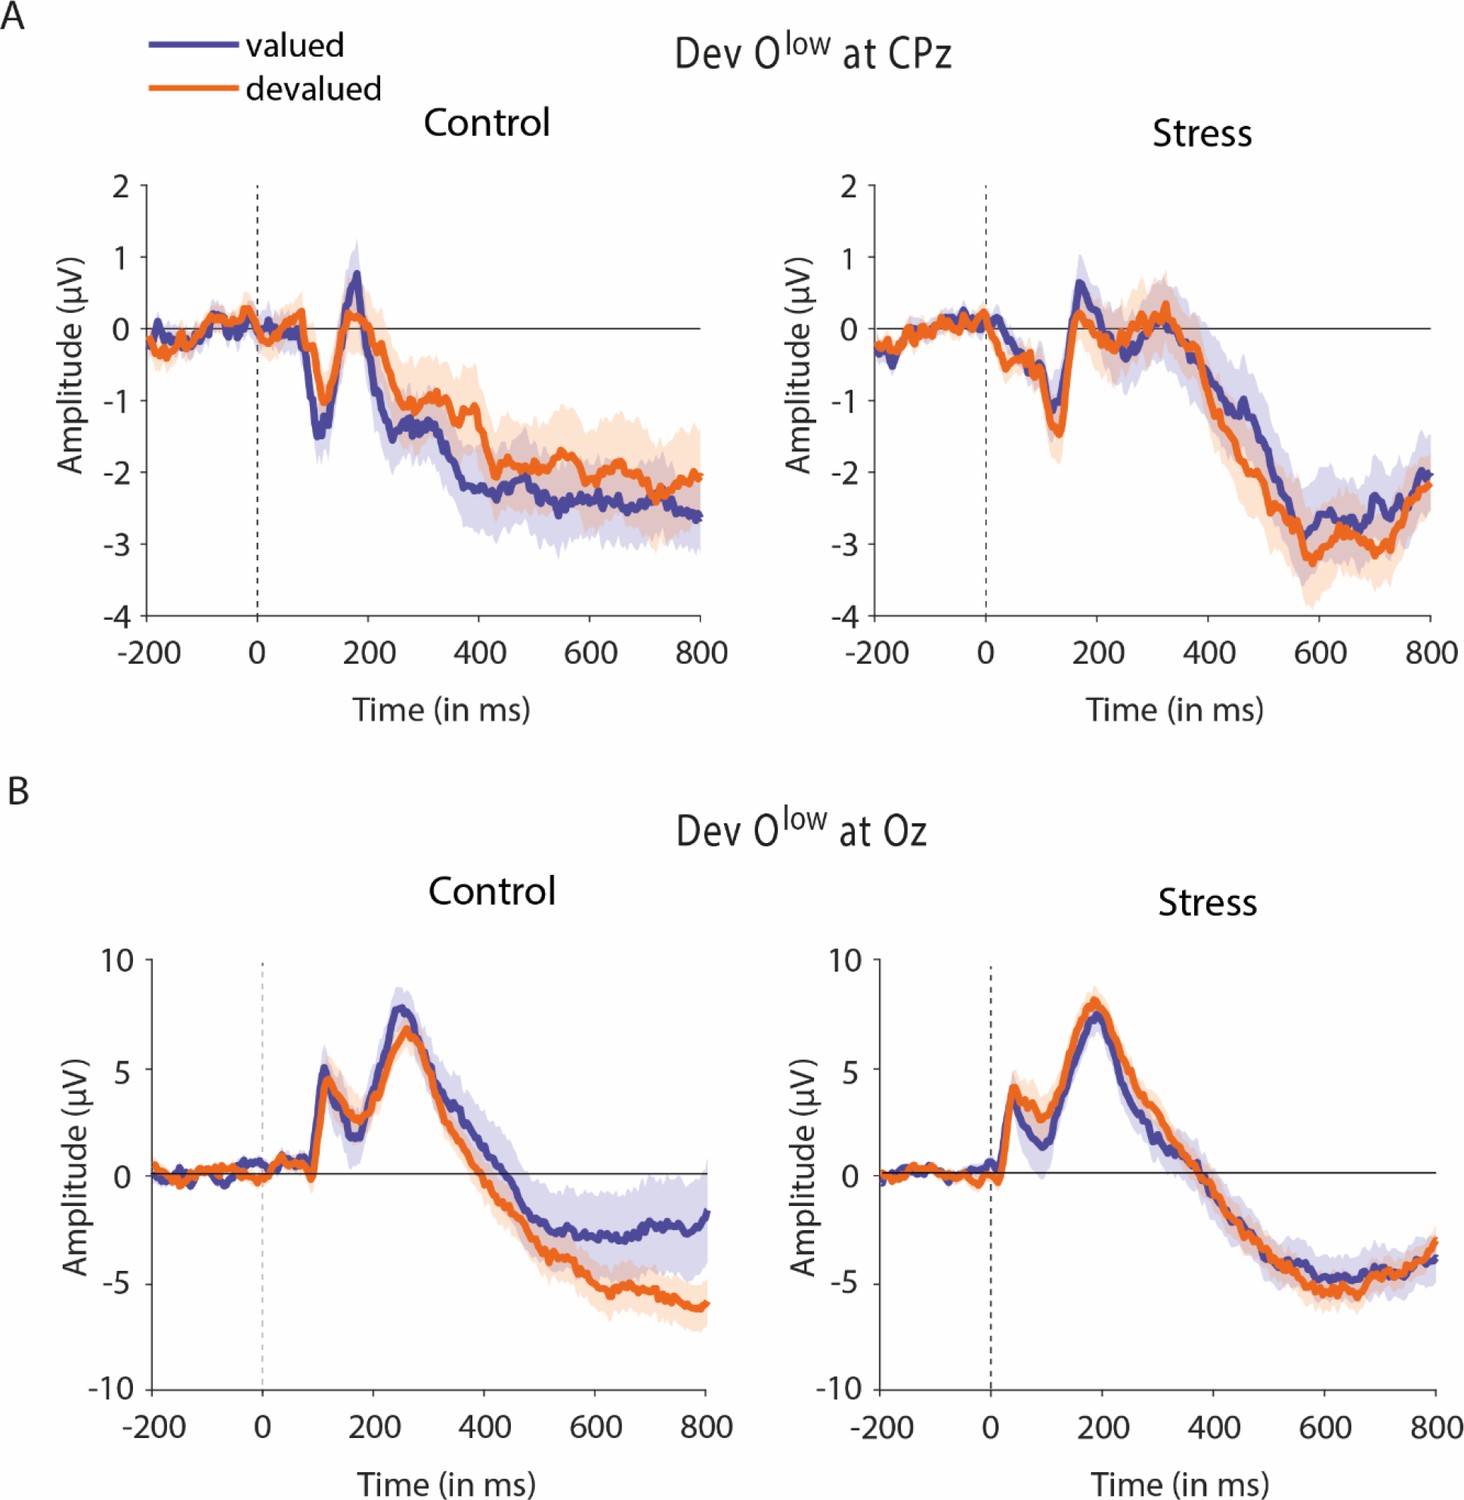
Event-related potentials during Dev Olow blocks.
(A) Mean centroparietal activity for devalued and valued stimuli during Dev Olow for control and stressed participants (baseline-corrected). (B) Mean occipital activity for devalued and valued stimuli during Dev Olow for control and stressed participants (baseline-corrected). Data represents means ± SEM.
Figure 2—figure supplement 3
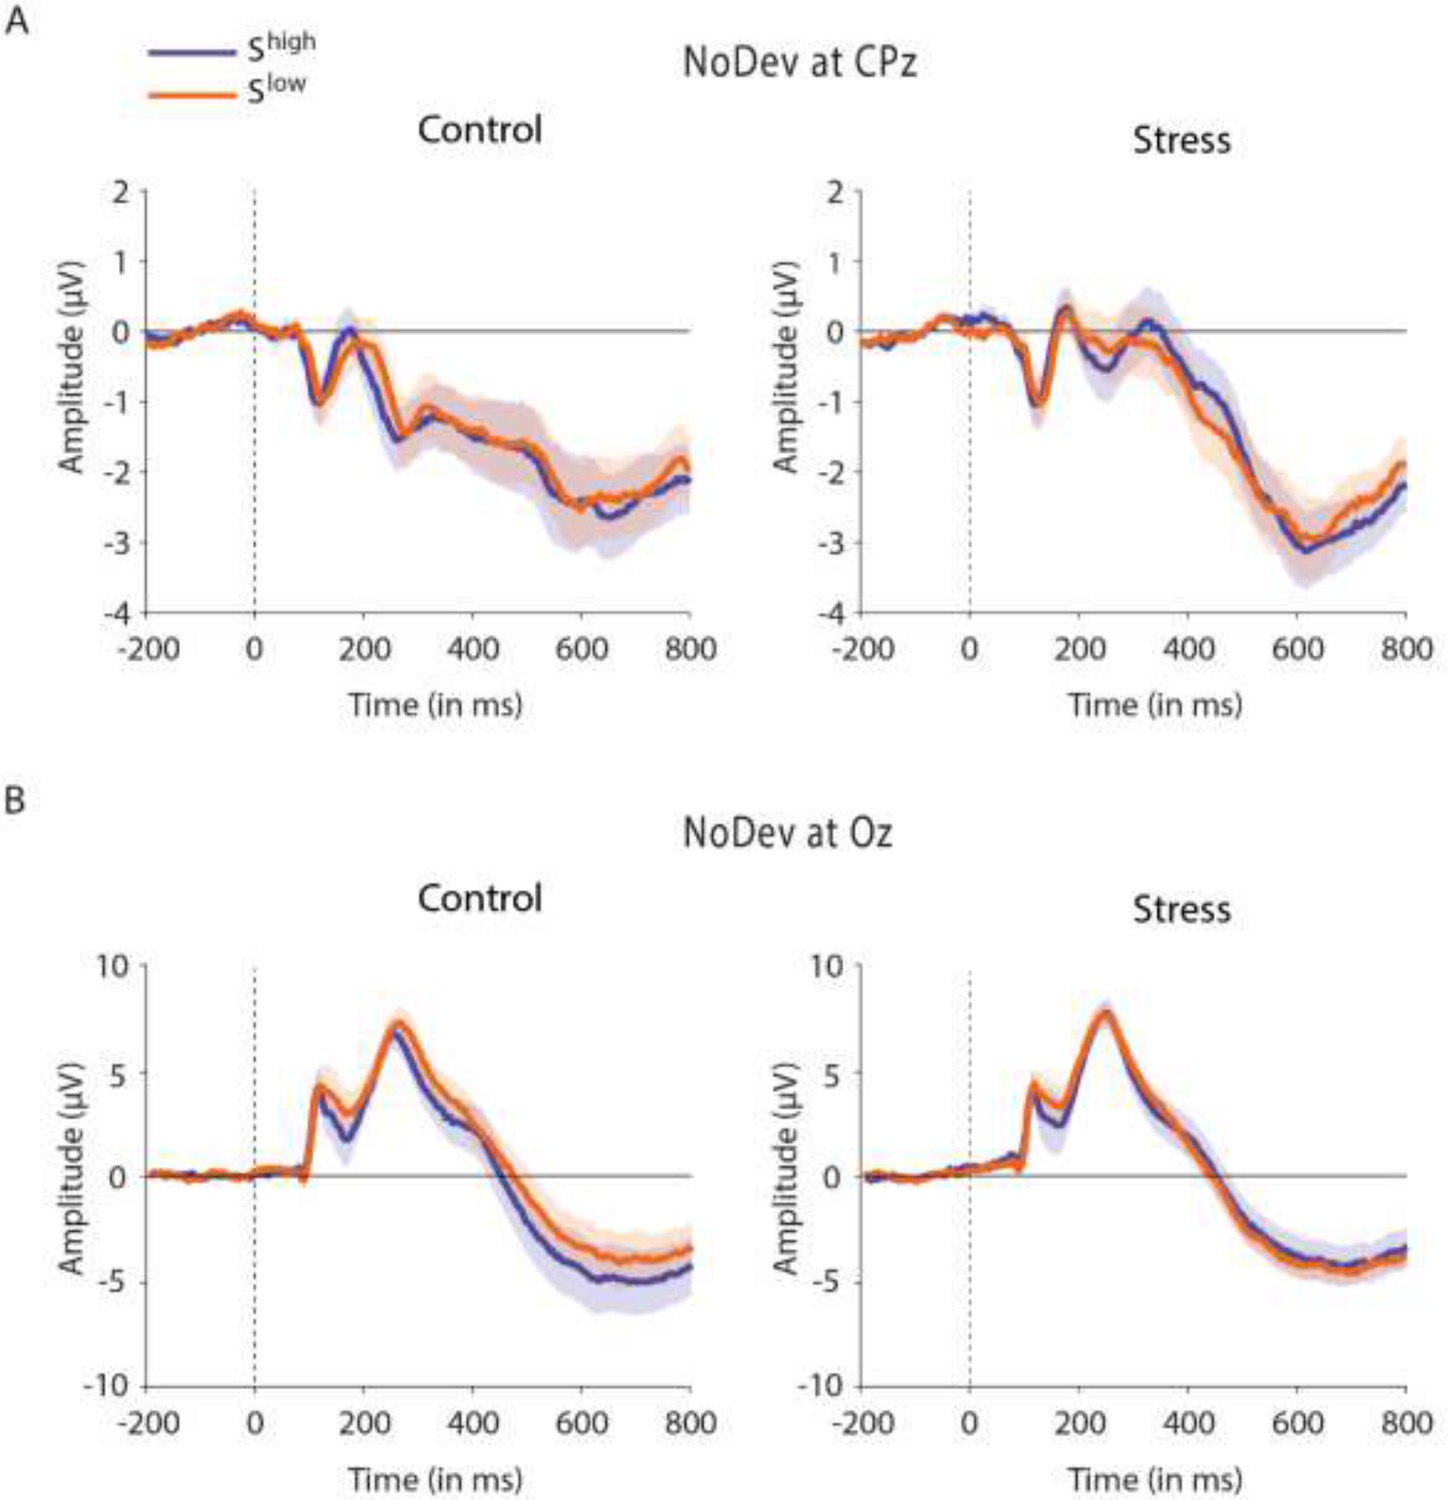
Event-related potentials during NoDev blocks.
(A) Mean centroparietal activity for Shigh and Slow during NoDev for control and stressed participants (baseline-corrected). (B) Mean occipital activity for Shigh and Slow during NoDev for control and stressed participants (baseline-corrected). Data represents means ± SEM.
Figure 2—figure supplement 4
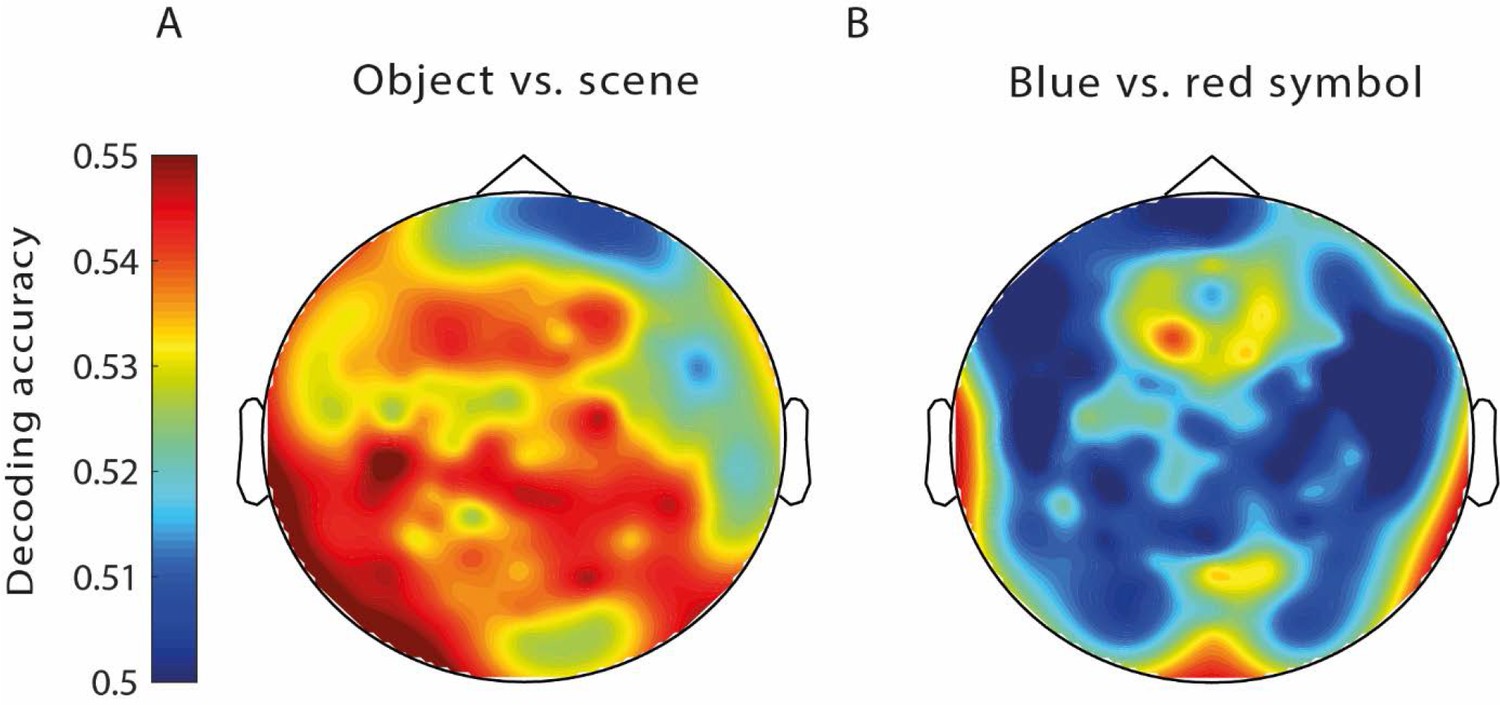
Brain areas contributing the most to outcome and response decoding.
Searchlight analysis of differences in object vs. scene (A) and blue vs. red symbol (B) processing during the delayed-matching-to-sample (DMS) task (chance performance was 52.85 and 53.90%, respectively), calculated using Wald intervals (Agresti and Caffo, 2000).
Figure 3 with 2 supplements
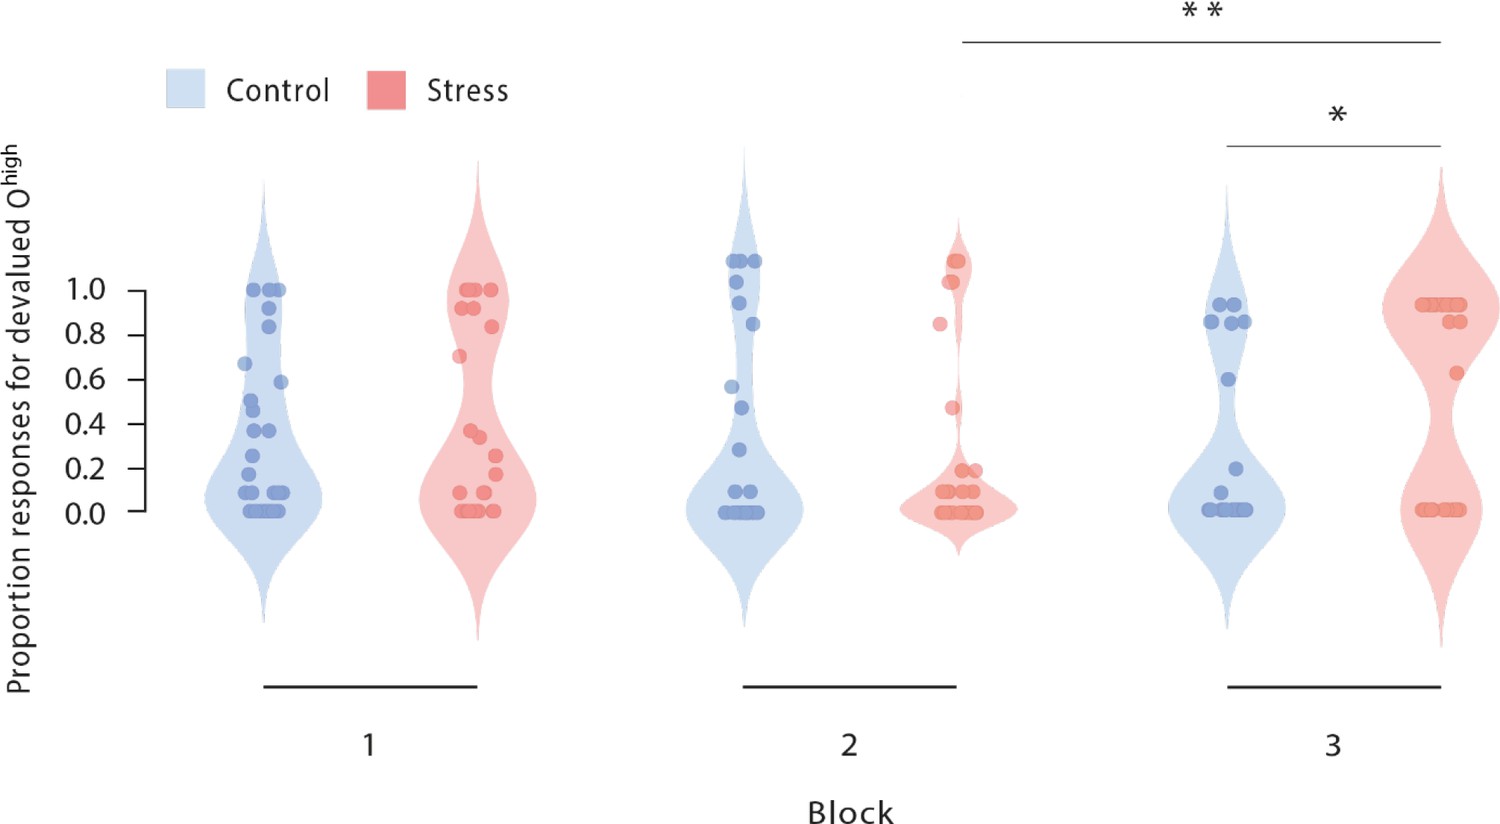
Proportion of responses for devalued outcomes across the reinforcement learning task during Dev Ohigh blocks.
As training proceeded, stressed participants increasingly selected those actions that led to a devalued outcome (block 2 vs. block 3). In addition, stressed participants responded significantly more often to the devalued action than non-stressed controls in the third devaluation block at the end of the task (stress vs. control). Dots represent mean performance of individual participants. The data for Dev Olow and NoDev blocks is presented in Figure 3—figure supplement 1 and Figure 3—figure supplement 2. * p<0.001, Bonferroni-corrected (stress vs. control). # p<0.001, Bonferroni-corrected (vs. the respective other block).
Figure 3—figure supplement 1
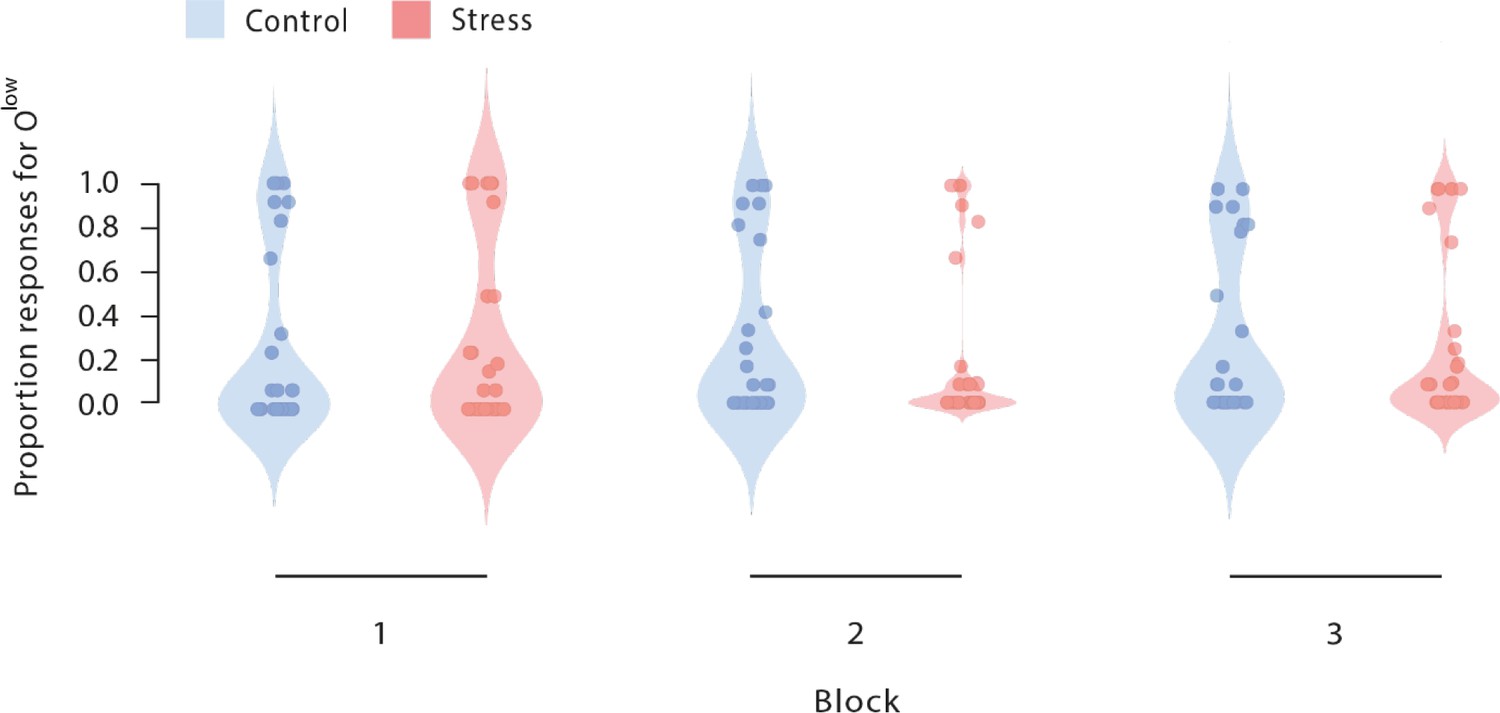
Proportion of responses for devalued outcome across the reinforcement learning task during Dev Olow blocks.
Figure 3—figure supplement 2
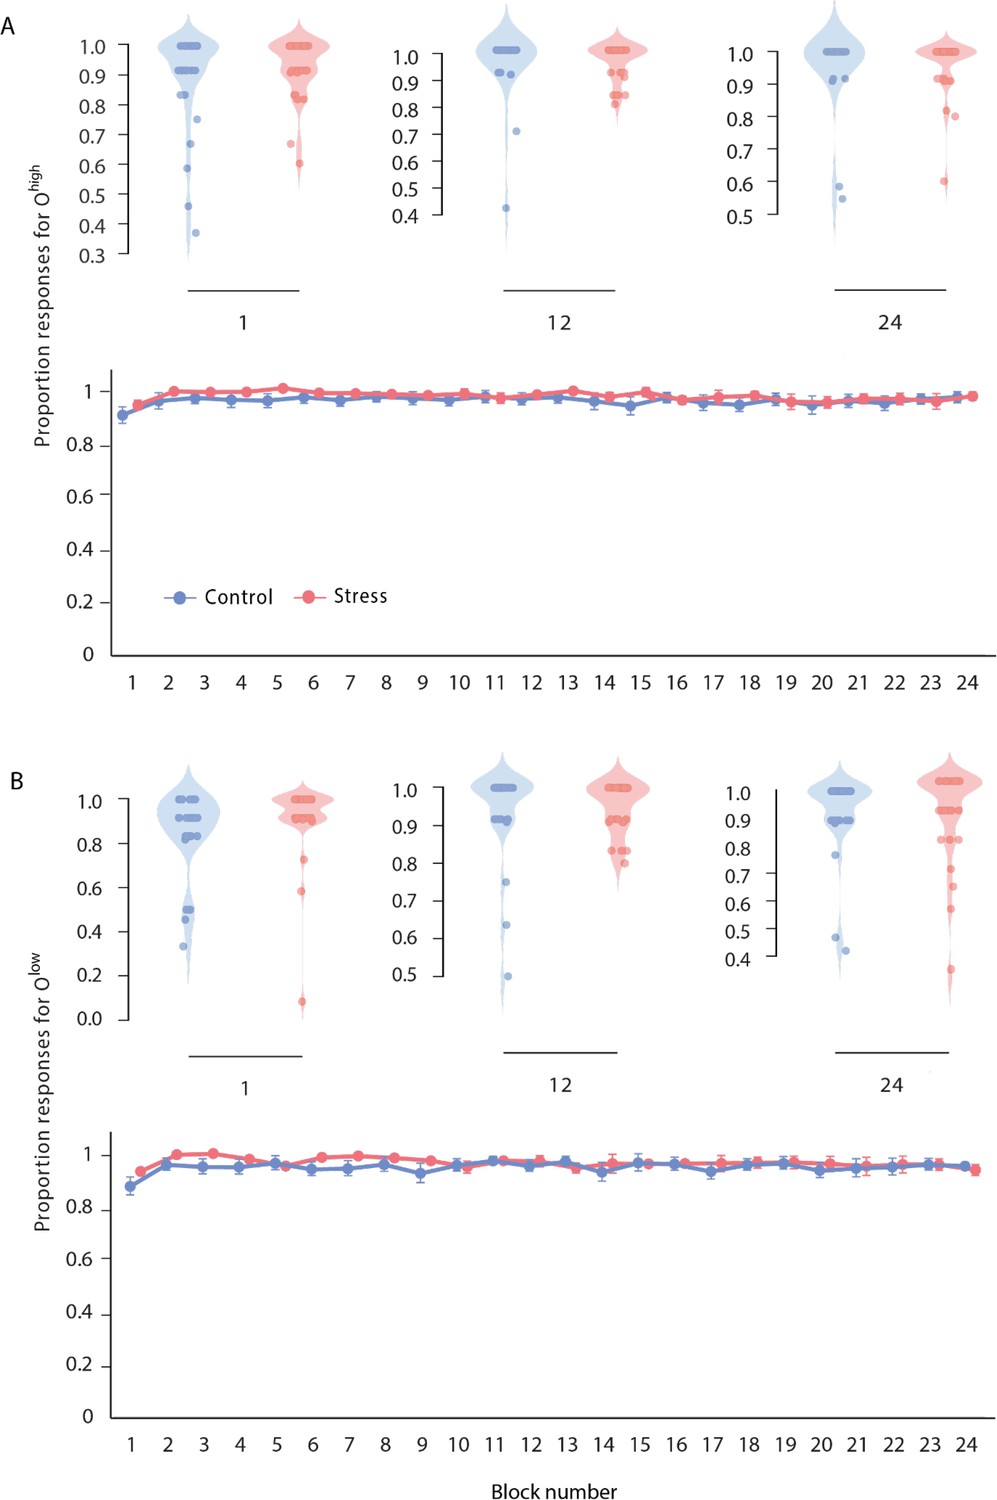
Proportion of correct responses during NoDev blocks after low, moderate, and high training intensity.
(A) Violin plots illustrate the proportion of correct responses in Ohigh trials during NoDev blocks after low (block 1), moderate (block 12), and high (block 24) training intensity (upper part). The line graph illustrates the proportion of correct responses in Ohigh trials during NoDev from block 1 to block 24. (B) Violin plots illustrate the proportion of correct responses in Olow trials during NoDev blocks after low (block1), moderate (block 12), and high (block 24) training intensity. The line graph illustrates the proportion of correct responses in Olow trials during NoDev from block 1 to block 24. In both violin, dots represent mean performance of individual participants. In both line graphs, error bars represent the SEM.
Figure 4
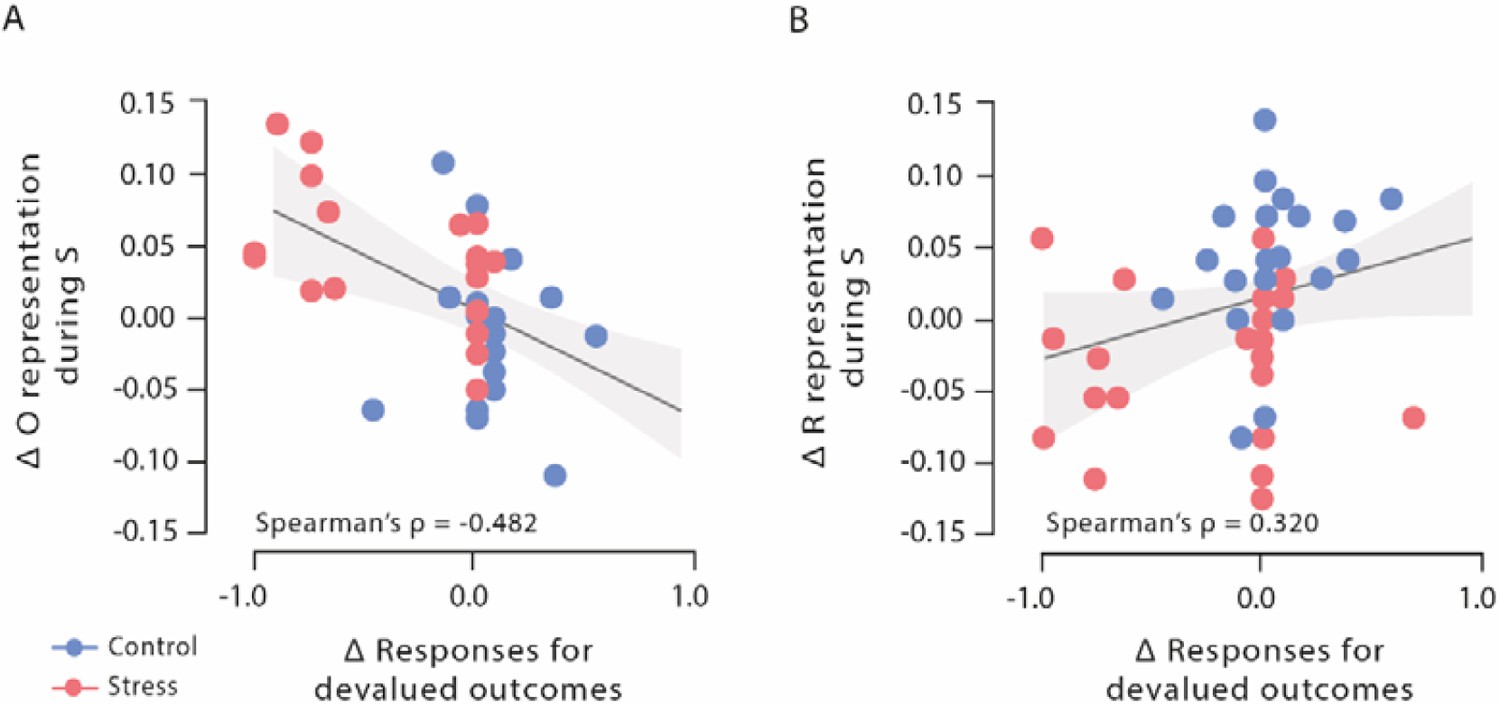
Correlations of outcome and response representation during stimulus presentation with responses for devalued outcomes during Dev Ohigh blocks.
(A) Decrease of outcome representation during stimulus presentation was significantly correlated with the reduced behavioural sensitivity to the outcome devaluation during Dev Ohigh blocks. (B) Increase in response representation was significantly correlated with an increase in response for devalued outcomes during Dev Ohigh blocks. Higher difference scores indicate higher decreases in outcome and response representation over time. Regression lines are added for visualization purpose, and the light-coloured background areas indicate its 95% CI.
Figure 5
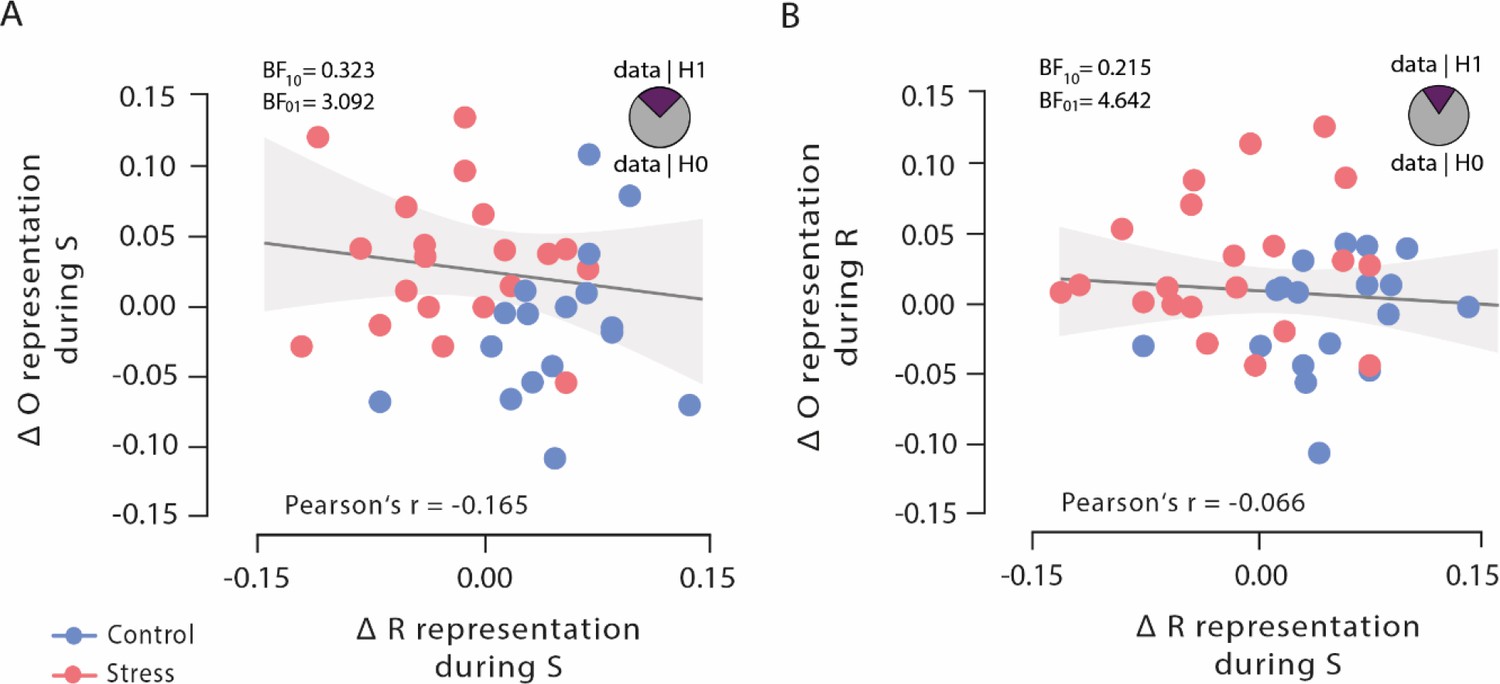
Bayesian correlations of outcome representation during stimulus presentation and response selection with response representation during stimulus presentation.
(A) Outcome representation during stimulus presentation was not correlated with response representation during response selection. As visualized in the pie chart, the corresponding Bayes factor suggests that the observed data are 3.092 times more likely under the null hypothesis (H0) than under the alternative hypothesis (H1). (B) Outcome representation during response selection was not correlated with response representation during stimulus presentation. As visualized in the pie chart, the corresponding Bayes factor suggests that the observed data are 4.642 times more likely under the H0 than under the H1. Higher difference scores indicate larger decreases in outcome and response representation, respectively, over time. Regression lines are added for visualization purpose, and the light-coloured background areas indicate its 95% CI.
Tables
Table 1
Subjective responses to the Trier Social Stress Test (TSST) or control manipulation.
| Control | Stress | |||
|---|---|---|---|---|
| M | SEM | M | SEM | |
| Subjective assessments | ||||
| Stressfulness | 16.79 | 3.45 | 62.33* | 4.44 |
| Unpleasantness | 15.36 | 3.51 | 57.00* | 5.90 |
| Difficulty | 14.29 | 3.35 | 51.33* | 5.29 |
-
Subjective assessments were rated on a scale from 0 (‘not at all’) to 100 (‘very much’). *p<0.001, Bonferroni-corrected, significant group difference.
Additional files
-
Supplementary file 1
Supplementary material.
(a) Classification results (block × group interaction) block for alternatively grouped data. (b) Classification results on outcome representations for N=53. (c) Control variables: subjective mood, depressive mood, anxiety, and chronic stress. (d) Eye-tracking data: mean number of blinks and saccades across time, for Shigh and Slow trials (N=51).
- https://cdn.elifesciences.org/articles/67517/elife-67517-supp1-v2.docx
-
Transparent reporting form
- https://cdn.elifesciences.org/articles/67517/elife-67517-transrepform1-v2.pdf
Download links
A two-part list of links to download the article, or parts of the article, in various formats.
Downloads (link to download the article as PDF)
Open citations (links to open the citations from this article in various online reference manager services)
Cite this article (links to download the citations from this article in formats compatible with various reference manager tools)
Stress diminishes outcome but enhances response representations during instrumental learning
eLife 11:e67517.
https://doi.org/10.7554/eLife.67517


