Coordination between nucleotide excision repair and specialized polymerase DnaE2 action enables DNA damage survival in non-replicating bacteria
- National Centre for Biological Sciences - Tata Institute of Fundamental Research, India
- Max Planck Institute for Terrestrial Microbiology, LOEWE Centre for Synthetic Microbiology (SYNMIKRO), Germany
Figures
Figure 1 with 1 supplement
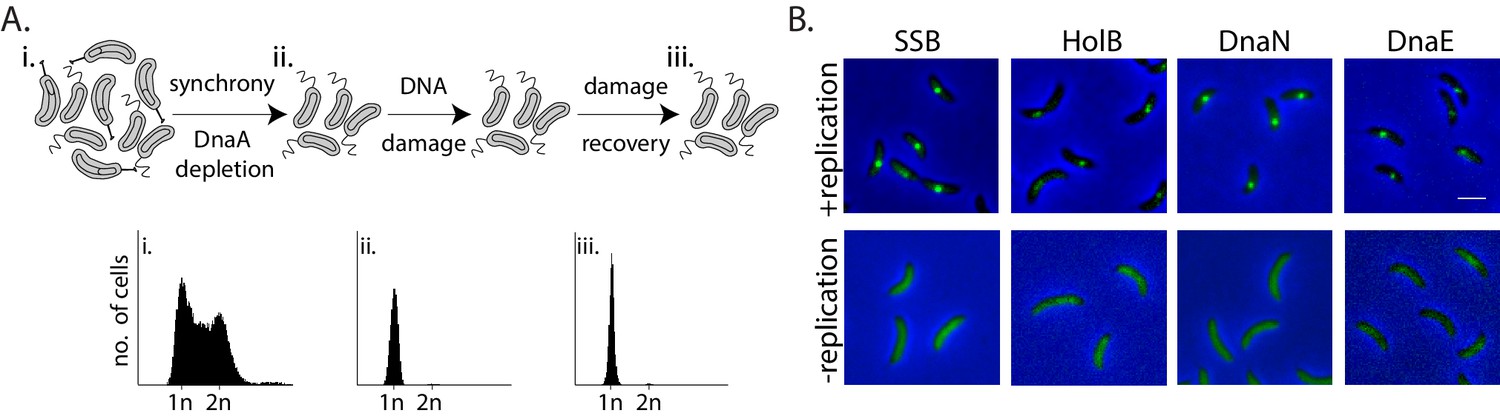
Monitoring mechanisms of DNA lesion repair in non-replicating bacteria.
(A) Above: Schematic of experimental setup used to isolate non-replicating Caulobacter swarmer cells to monitor DNA lesion repair and tolerance independent of ongoing replication. Cells were treated with DNA damage (30 min mitomycin C [MMC] or UV at specified doses), after which damage was removed and cells were allowed to grow in fresh media (damage recovery), without ongoing replication. Below: Flow cytometry profiles show DNA content in an asynchronous population (i), synchronized non-replicating swarmer cells before (ii) and after DNA damage recovery (iii). (B) Representative images of Caulobacter cells with fluorescently-tagged replisome components (SSB-YFP, HolB-YFP, DnaN-YFP, or DnaE-mNG) in replicating or non-replicating conditions, without DNA damage (scale bar is 2 µm here and in all other images).
Figure 1—figure supplement 1

Characterization of strains carrying fluorescently-tagged replisome components.
(A) Growth of fluorescently tagged replisome strains with or without (control) mitomycin C (MMC) damage. For reference, growth of wild type (no tag) and recA deletion strains is also shown (representative image of one experiment from three independent repeats). (B) Growth of fluorescently-tagged replisome strains with or without (control) UV damage. For reference, growth of wild type (no tag) and recA deletion strains is also shown (representative image of one experiment from three independent repeats). (C) Relative position of fluorescently-tagged replisome components in Caulobacter cells during one round of replication (no damage). Localization of SSB-YFP, HolB-YFP, DnaN-YFP, or DnaE-mNG was tracked every 10 min using time-lapse imaging. A focus tended to localize at one cell pole at initiation and proceeded towards the opposite cell pole as replication progressed (n = 25, solid line represents mean and shaded region represents the upper and lower limits at specific time points).
-
Figure 1—figure supplement 1—source data 1
Source data related to panels in Figure 1—figure supplement 1.
- https://cdn.elifesciences.org/articles/67552/elife-67552-fig1-figsupp1-data1-v2.xlsx
Figure 2 with 1 supplement

Replisome components are recruited to damaged DNA in non-replicating Caulobacter swarmer cells.
(A) Representative images of non-replicating swarmer cells with fluorescently tagged replisome components (SSB-YFP, HolB-YFP, DnaN-YFP, or DnaE-mNG) with (+MMC) or without (no damage) 30 min of treatment with MMC. (B) Percentage cells with SSB, HolB, DnaN, or DnaE localization (foci) in non-replicating swarmers with (+) or without (-) MMC treatment (n ≥ 324 cells, three independent repeats). Dashed line represents median here and in all other graphs. (C) Percentage swarmer cells with 0, 1, or ≥2 DnaN foci at 0, 30, 60, and 90 min after damage removal (recovery) (n ≥ 476 cells, three independent repeats). (D) Percentage swarmer cells with 0, 1, or ≥2 foci of SSB, HolB, or DnaE at 0 and 90 min after damage removal (recovery) (n ≥ 324 cells, three independent repeats).
-
Figure 2—source data 1
Source data related to panels in Figure 2.
- https://cdn.elifesciences.org/articles/67552/elife-67552-fig2-data1-v2.xlsx
Figure 2—figure supplement 1
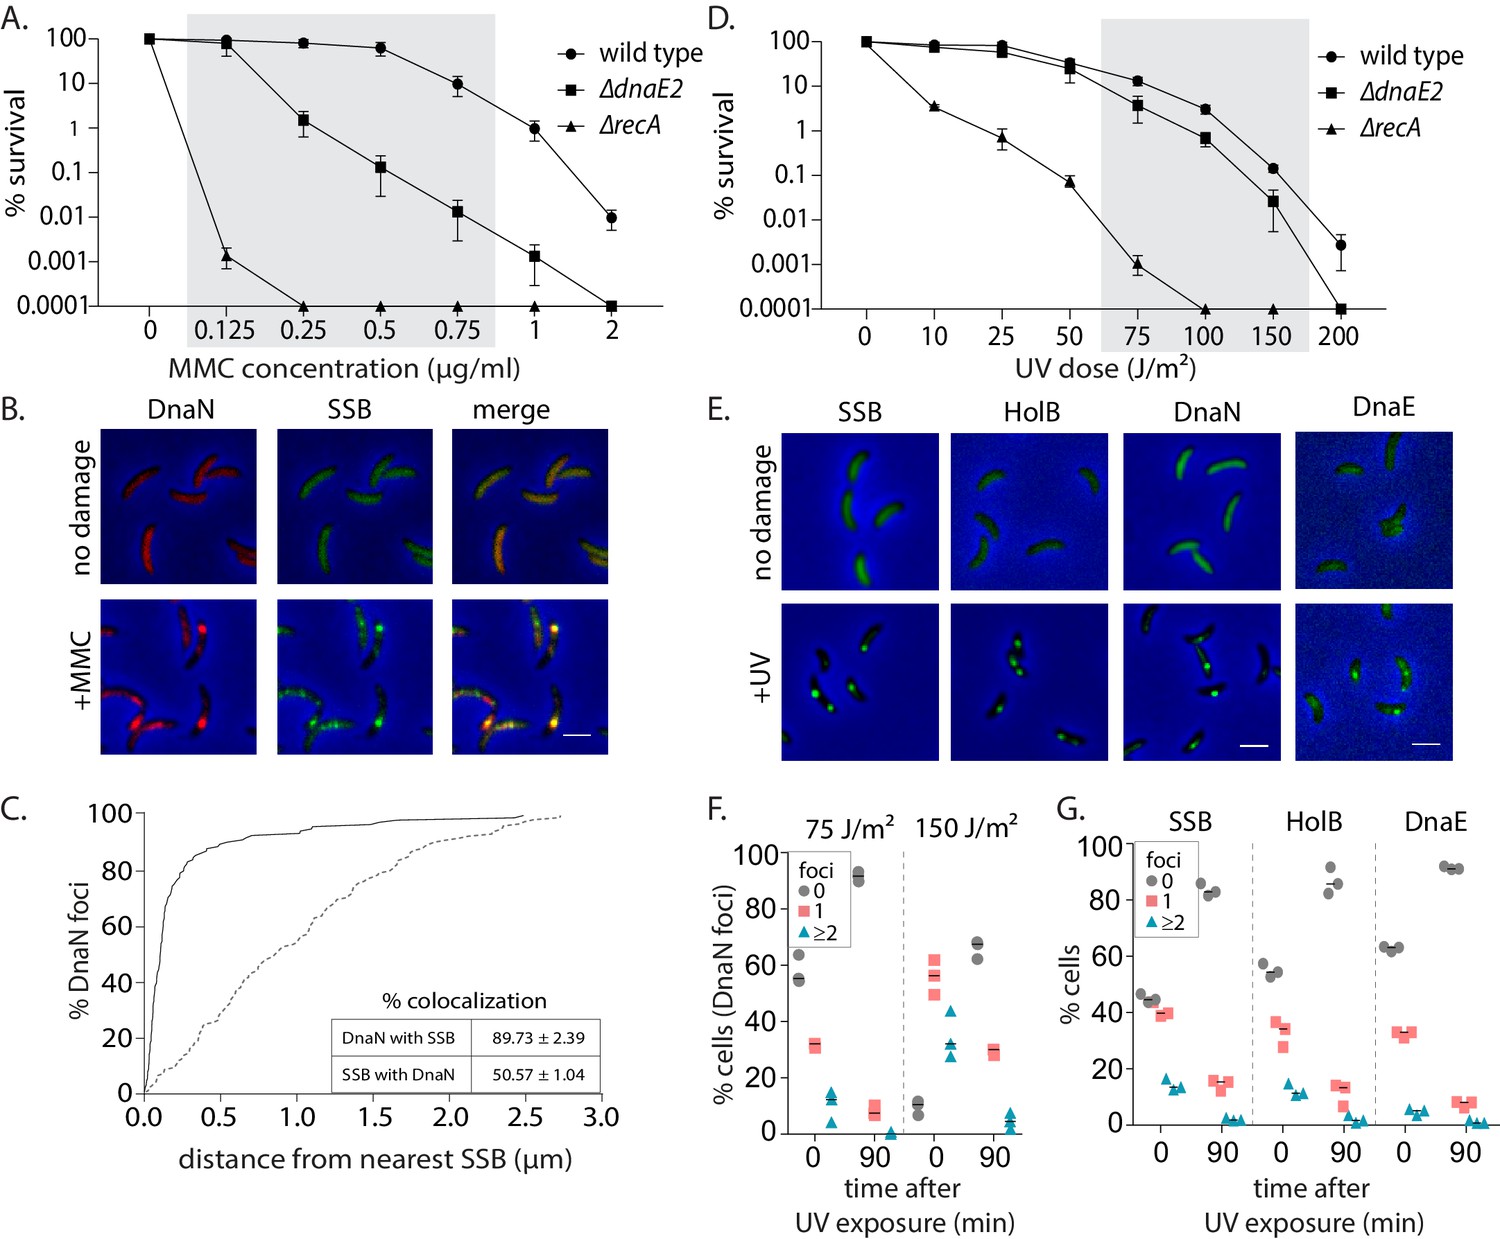
Replisome components are recruited to damaged DNA in non-replicating Caulobacter swarmer cells.
(A) Survival of wild type, ∆dnaE2, and ∆recA strains under different doses of mitomycin C (MMC) (mean and SD from three independent experiments). Shaded region indicates the concentrations used for experiments in this study. (B) Representative images of swarmer cells expressing DnaN-mCherry and SSB-GFP with or without MMC treatment (scale bar is 2 µm here and in all other images). (C) Distance of a DnaN focus from the nearest SSB focus was measured and cumulative frequency distribution is plotted (solid line). Dotted line is the distribution of distance between the DnaN focus and any random position inside the cell. Inset: Percentage colocalization for DnaN with SSB and vice versa is provided (mean and SD from three independent repeats). (D) Survival of wild type, ∆dnaE2, and ∆recA strains under different doses of UV (mean and SD from three independent experiments). Shaded region indicates the concentrations used for experiments in this study. (E) Representative images of swarmer cells expressing SSB-YFP, HolB-YFP, DnaN-YFP, or DnaE-mNG with or without (no damage) UV treatment. (F) Percentage wild type swarmer cells with 0, 1, or ≥2 foci of DnaN at 0 and 90 min after DNA damage recovery from 75 J/m2 or 150 J/m2 of UV (n ≥ 322 cells, three independent repeats). (G) Percentage wild type swarmer cells with 0, 1, or ≥2 foci of SSB, HolB, or DnaE at 0 and 90 min after DNA damage recovery from 75 J/m2 of UV (n ≥ 334 cells, three independent repeats).
-
Figure 2—figure supplement 1—source data 1
Source data related to panels in Figure 2—figure supplement 1.
- https://cdn.elifesciences.org/articles/67552/elife-67552-fig2-figsupp1-data1-v2.xlsx
Figure 3 with 1 supplement

Nucleotide excision repair (NER) generates long ssDNA gaps for localization of replisome components in non-replicating cells.
(A) SOS induction was measured by assessing the expression of yfp from an SOS-inducible promoter (PsidA-yfp). On the left are representative images of cells expressing the reporter at 0 or 90 min after MMC removal and control cells (no damage). On the right, total fluorescence intensity normalized to cell area is plotted for both time points for cells with or without damage treatment. Each dot represents a single cell. Mean and SD are shown in black (n ≥ 219). (B) Percentage wild type, ∆recA, or ∆uvrA swarmer cells with DnaN foci at 0, 30, 60, and 90 min after DNA damage recovery (n ≥ 308 cells, three independent repeats). (C) Representative images of wild type or ∆uvrA swarmer cells with SSB-YFP or DnaN-YFP, treated with MMC or UV. (D) As (A) for cells lacking uvrA (n ≥ 325).
-
Figure 3—source data 1
Source data related to panels in Figure 3.
- https://cdn.elifesciences.org/articles/67552/elife-67552-fig3-data1-v2.xlsx
Figure 3—figure supplement 1

Nucleotide excision repair (NER) generates long ssDNA gaps for localization of replisome components in non-replicating cells.
(A) Schematic of mechanism of long ssDNA gap generation by nucleotide excision repair (NER). (B) Percentage wild type or ∆uvrA swarmer cells with SSB foci with (+MMC) or without (-, control) damage treatment (n ≥ 325 cells, three independent repeats, wild type data from Figure 2B). (C) Percentage wild type or ∆uvrA swarmer cells with DnaN or SSB foci after DNA damage (UV) (n ≥ 340 cells, three independent repeats). (D) Percentage wild type or ∆mutL swarmer cells with DnaN foci with (+MMC) or without (-, control) damage treatment (n ≥ 324 cells, three independent repeats, wild type data from Figure 2B). MMC: mitomycin C.
-
Figure 3—figure supplement 1—source data 1
Source data related to panels in Figure 3—figure supplement 1.
- https://cdn.elifesciences.org/articles/67552/elife-67552-fig3-figsupp1-data1-v2.xlsx
Figure 4 with 1 supplement

SOS-induced low-fidelity polymerase, DnaE2, is essential for subsequent dissociation of replisome components.
(A) Representative images of wild type or ∆dnaE2 swarmer cells with SSB-YFP, DnaN-YFP, or DnaE-YFP after MMC treatment. (B) Percentage wild type or ∆dnaE2 swarmer cells with 0, 1, or ≥2 DnaN foci at 0, 30, 60, and 90 min of DNA damage recovery (n ≥ 467 cells, three independent repeats, wild type data from Figure 2C). (C) Percentage wild type or ∆dnaE2 swarmer cells with SSB or DnaE foci at 0 and 90 min of DNA damage recovery (n ≥ 325 cells, mean and SD from three independent repeats). (D) Percentage wild type, dnaE2 catalytic mutant (dnaE2*) or ∆imuB swarmer cells with DnaN foci at 0, 30, 60, and 90 min of mitomycin C (MMC) damage recovery (n ≥ 342 cells, three independent repeats, wild type data from Figure 3B).
-
Figure 4—source data 1
Source data related to panels in Figure 4.
- https://cdn.elifesciences.org/articles/67552/elife-67552-fig4-data1-v2.xlsx
Figure 4—figure supplement 1
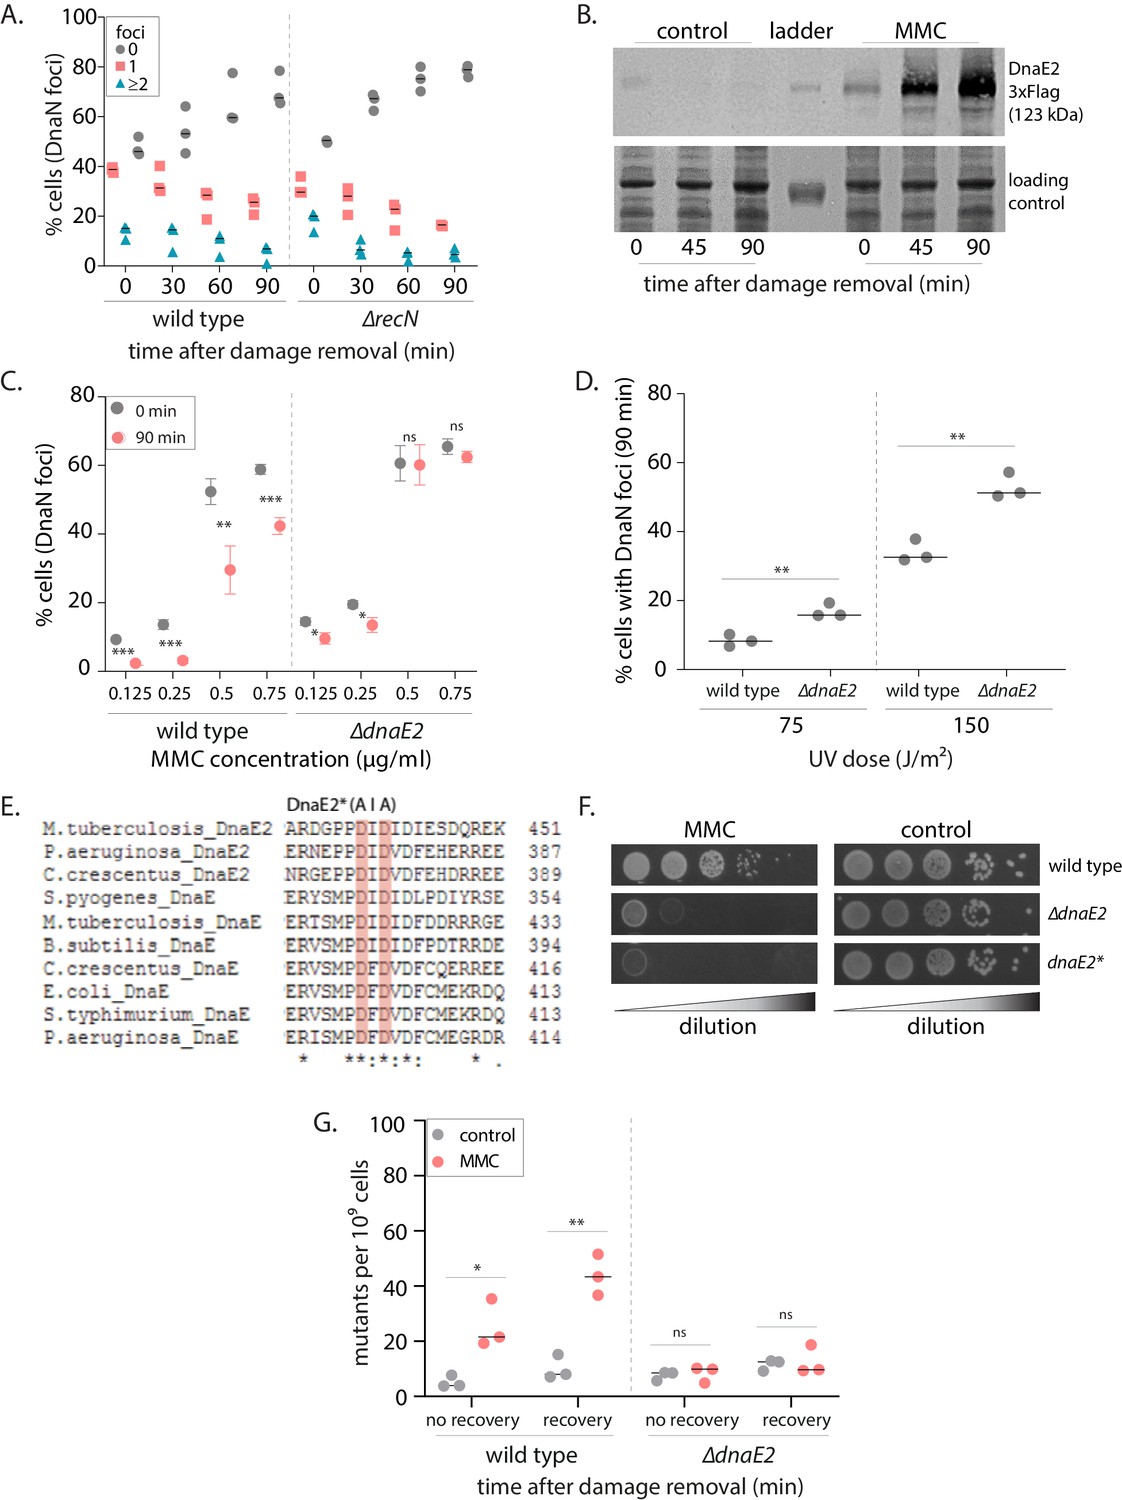
SOS-induced low-fidelity polymerase, DnaE2, is essential for subsequent dissociation of replisome components.
(A) Percentage wild type or ∆recN swarmer cells with 0, 1, or ≥2 DnaN foci at 0, 30, 60, and 90 min of DNA damage recovery (n ≥ 309 cells, three independent repeats, wild type data from Figure 2C). (B) Representative image of a western blot of DnaE2-3X-Flag during mitomycin C (MMC) damage recovery. As a control, cells without damage treatment were also probed for DnaE2 (image of one experiment from three independent repeats). (C) Percentage wild type or ∆dnaE2 swarmer cells with DnaN foci at 0 and 90 min of DNA damage recovery (n ≥ 321 cells, mean and SD from three independent repeats, under indicated doses of DNA damage). Asterisks denote significant differences and ‘ns’ denotes not significant differences in unpaired t-tests here and in all other graphs. Exact p-values are summarized in Supplementary file 4. (D) Percentage wild type or ∆dnaE2 swarmer cells with DnaN foci after 90 min of damage recovery (post-treatment with two doses of UV) (n ≥ 332 cells, three independent repeats). (E) Multiple sequence alignment of the catalytic domain of C-family polymerases from different bacteria. Conserved amino acid residues highlighted in pink were mutated in DnaE2* (catalytic mutant) (Warner et al., 2010). (F) Growth of wild type, ∆dnaE2, and dnaE2* strains with (MMC) or without (control) DNA damage (image of one experiment from three independent repeats). (G) Rifampicin-resistant mutants that arise from wild type and ∆dnaE2 cells treated with (MMC) or without (control) DNA damage. Cells were either immediately released into replication-permissive media after damage removal (no recovery) or allowed to recover from damage for 90 min in non-replicating phase before release into replication-permissive conditions (recovery). Dashed line shows median from three independent experiments.
-
Figure 4—figure supplement 1—source data 1
Source data related to panels in Figure 4—figure supplement 1.
- https://cdn.elifesciences.org/articles/67552/elife-67552-fig4-figsupp1-data1-v2.xlsx
Figure 5 with 1 supplement

DnaE2 activity on nucleotide excision repair (NER)-generated long single-stranded DNA (ssDNA) gaps enhances survival of non-replicating cells under DNA damage.
(A) Schematic of experimental setup used to assess the impact of lesion repair/ tolerance in non-replicating cells. After mitomycin C (MMC) treatment for 30 min, cells were either released into replication-permissive media (i: no recovery) or allowed to grow for 90 min without damage and then released into replication-permissive media (ii: damage recovery). Cells were followed via time-lapse microscopy and time to division was estimated. Control cells were taken through the same growth regimes; however, no damage is added to the culture. (B) Representative time-lapse montage of wild type or ∆dnaE2 cells in replication-permissive media after DNA damage recovery. Cell divisions are marked with white asterisk. In the panel shown here, three divisions were scored in wild type, while none were observed in ∆dnaE2 cells. (C) Percentage cell division over time after replication reinitiation for wild type and ∆dnaE2 cells either without (i: no recovery) or with (ii: recovery) damage recovery time in replication-blocked conditions (n ≥ 368 cells). Inset: Percentage cells divided at 240 min in each of these conditions is summarized. (D) Survival of wild type and ∆dnaE2 cells either without (i: no recovery) or with (ii: recovery) damage recovery time in replication-blocked conditions was measured via estimation of viable cell count (three independent repeats). Fraction survival was calculated by normalizing viable cell count under DNA damage to that without DNA damage (mean with SD from three independent experiments).
-
Figure 5—source data 1
Source data related to panels in Figure 5.
- https://cdn.elifesciences.org/articles/67552/elife-67552-fig5-data1-v2.xlsx
Figure 5—figure supplement 1
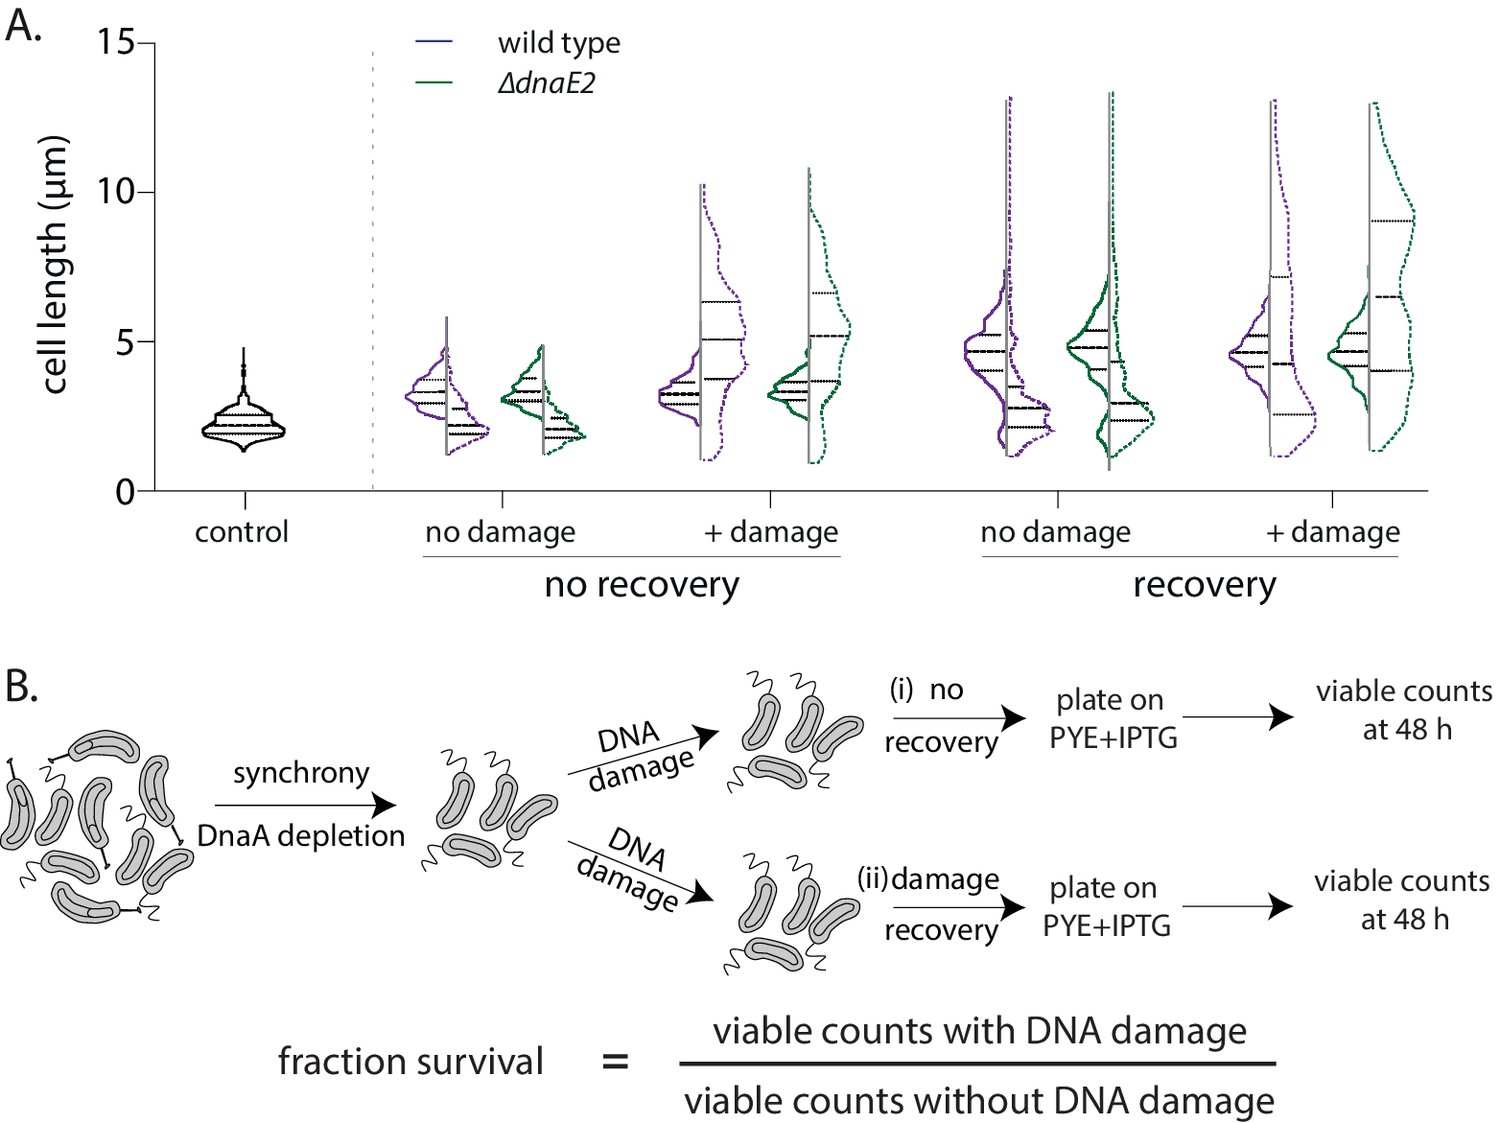
DnaE2 activity on nucleotide excision repair (NER)-generated long single-stranded DNA (ssDNA) gaps enhances survival of non-replicating cells under DNA damage.
(A) Cell length distribution for wild type (purple) or ∆dnaE2 (green) cells. Control cells were not treated with DNA damage, while + damage cells were exposed to mitomycin C (MMC) treatment for 30 min. Solid lines represent length distribution prior to release into replication-permissive conditions while dashed lines represent length distribution after 240 min in replication-permissive conditions. Median and inter-quartile range of the distribution is indicated. ‘No recovery’ and ‘recovery’ as outlined in Figure 5A (n ≥ 300 cells). (B) Schematic of experimental design to estimate survival advantage from recovery in non-replicating phase (Figure 5D). Fraction survival was calculated by normalizing viable cell counts obtained with damage to that obtained without damage. A similar experimental design was used for estimation of mutation frequencies (Figure 4—figure supplement 1G and 'Materials and methods').
-
Figure 5—figure supplement 1—source data 1
Source data related to panels in Figure 5—figure supplement 1.
- https://cdn.elifesciences.org/articles/67552/elife-67552-fig5-figsupp1-data1-v2.xlsx
Tables
Key resources table
| Reagent type (species) or resource | Designation | Source or reference | Identifiers | Additional information |
|---|---|---|---|---|
| Strain, strain background Caulobacter crescentus NA1000 | Caulobacter crescentus NA1000 strains | PMID:334726 This study | Supplementary file 1 | |
| Recombinant DNA reagent | Plasmids | This study | Supplementary file 2 | |
| Sequence based reagents | Oligos | This study | Supplementary file 3 | |
| Antibody | Anti-Flag (mouse monoclonal) | Sigma-Aldrich | F1804 (RRID:AB_262044) | Western blot (1:2000) |
| Antibody | Anti-mouse IgG, HRP-linked antibody | Cell Signaling Technology | 7076S (RRID:AB_330924) | Western blot (1:5000) |
| Commercial assay, kit | SuperSignal West Pico Plus Chemiluminescent Substrate | Thermo Scientific | 34577 | Western blot |
| Chemical compound, drug | Mitomycin C (MMC) | AG Scientific | M-2715 | DNA damaging agent |
| Commercial assay, kit | SYTOX Green Nucleic Acid Stain | Thermo Fisher Scientific | S7020 | Flow cytometry |
| Chemical compound, drug | Percoll | GE Healthcare | 17-0891-01 | Synchrony |
| Software, algorithm | GraphPad Prism 8 | GraphPad Software | RRID:SCR_002798 | Analysis |
| Software, algorithm | Fiji (ImageJ) | Schindelin et al., 2012 | RRID:SCR_002285 | Analysis |
| Software, algorithm | MATLAB R2020a | MathWorks | RRID:SCR_001622 | Analysis |
| Software, algorithm | Oufti | Paintdakhi et al., 2016 | RRID:SCR_016244 | Analysis |
| Software, algorithm | MicrobeTracker | Sliusarenko et al., 2011 | RRID:SCR_015939 | Analysis |
Additional files
-
Supplementary file 1
Table for strains used in the study and strain construction details.
- https://cdn.elifesciences.org/articles/67552/elife-67552-supp1-v2.docx
-
Supplementary file 2
Table for plasmids used in the study and cloning details.
- https://cdn.elifesciences.org/articles/67552/elife-67552-supp2-v2.docx
-
Supplementary file 3
Table for oligonucleotides used in the study.
- https://cdn.elifesciences.org/articles/67552/elife-67552-supp3-v2.docx
-
Supplementary file 4
Summary of p-values for statistical tests performed in the study.
- https://cdn.elifesciences.org/articles/67552/elife-67552-supp4-v2.docx
-
Transparent reporting form
- https://cdn.elifesciences.org/articles/67552/elife-67552-transrepform-v2.pdf
Download links
A two-part list of links to download the article, or parts of the article, in various formats.
Downloads (link to download the article as PDF)
Open citations (links to open the citations from this article in various online reference manager services)
Cite this article (links to download the citations from this article in formats compatible with various reference manager tools)
Coordination between nucleotide excision repair and specialized polymerase DnaE2 action enables DNA damage survival in non-replicating bacteria
eLife 10:e67552.
https://doi.org/10.7554/eLife.67552


