Two de novo GluN2B mutations affect multiple NMDAR-functions and instigate severe pediatric encephalopathy
- Department of Neuroscience, Ruth and Bruce Rappaport Faculty of Medicine, Technion-Israel Institute of Technology, Israel
- Clalit health services, Israel
- Genetics Institute, Rambam medical center, Israel
- Department of Physiology and Pharmacology, Sackler Faculty of Medicine, Tel Aviv University, Israel
- Department of Epilepsy Genetics and Personalized Treatment, the Danish Epilepsy Centre, Denmark
- Institute for Regional Health Services, University of Southern Denmark, Denmark
Figures
Figure 1 with 4 supplements
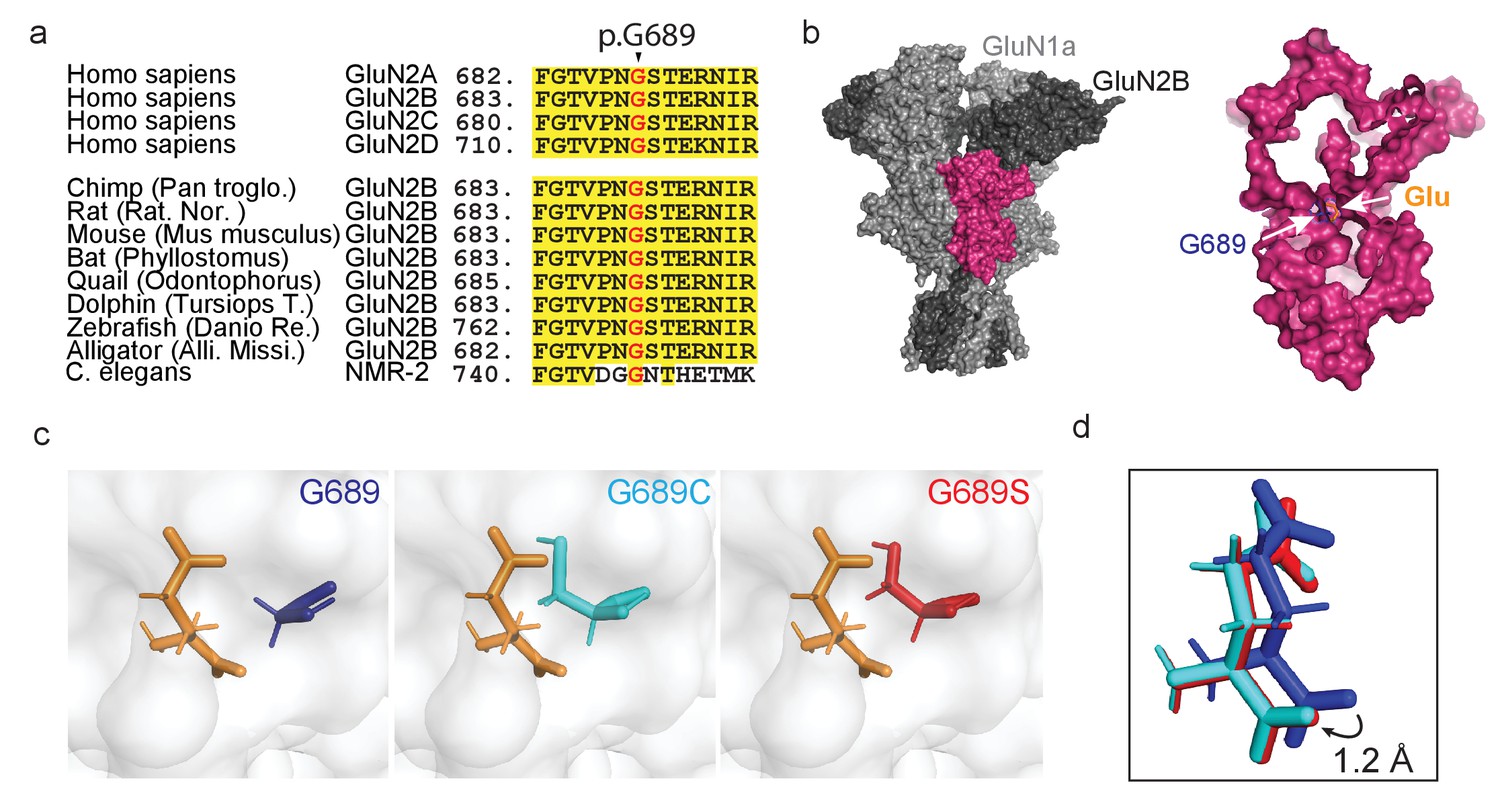
De novo mutations occurring at a highly conserved glycine residue in the human GluN2B subunit.
(a) Sequence alignment, showing strong homology and conservation of Glycine residue at position 689 (black arrowhead) among different GluN2 subunits (A–D) and different species. (b) Crystal structure of GluN1a-2B (PDB 4PE5 [Karakas and Furukawa, 2014]). Left image- light and dark gray depicts GluN1a and GluN2B subunits respectively; GluN2B LBD is highlighted in pink. Inset- Space filling of the GluN2B’s LBD showing the deep location of Gly689 residue (blue), positioned adjacent to the bound glutamate ligand (orange). (c) Prediction of de novo mutations occurring at p.689; left image- p.Gly689 (dark blue); center image- p.Gly689Cys (cyan) and right- p.Gly689Ser (red). Note that the side chains of the mutations point toward the glutamate ligand. This apposition required structural shifting of the glutamate ligand to prevent clashes with the original position, as shown in (d). (d) Simulation of the shift (1.2 Å) in the position of the glutamate ligand, resulting from mutagenesis of G689. Original position (as in PDB 4PE5) is shown in dark blue (representing the presence of the original G689). Cyan and red glutamates correspond to the newly positioned glutamate ligands obtained by the simulations when G689 was replaced by C or S, respectively.
Figure 1—figure supplement 1
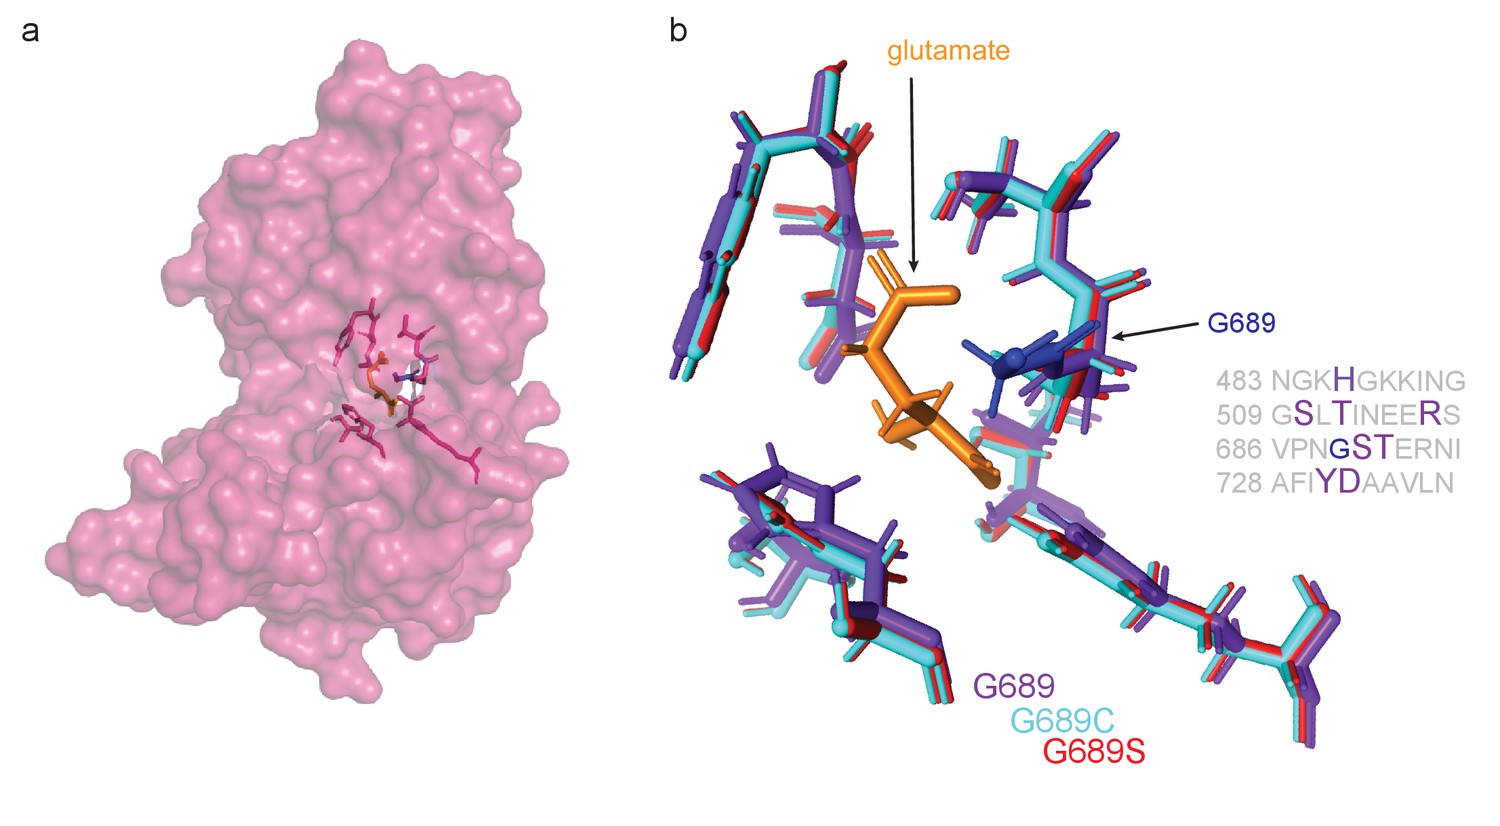
G689 lies adjacent to essential residues involved in glutamate binding.
(a) GluN2B LBD crystal structure (PDB 4PE5, magenta) showing residues (red) involved in binding of glutamate (orange). (b) Mutagenesis of G689 to C or S results in disruption of the glutamate-binding pocket. Stick representation of glutamate (orange) and its interacting residues in their original positions (purple) when residue G689 is intact (dark blue). Mutagenesis of G689 to C or S (see Figure 1c) results in shifts in the positions of the interacting residues, shown in cyan or red, respectively.
Figure 1—figure supplement 2
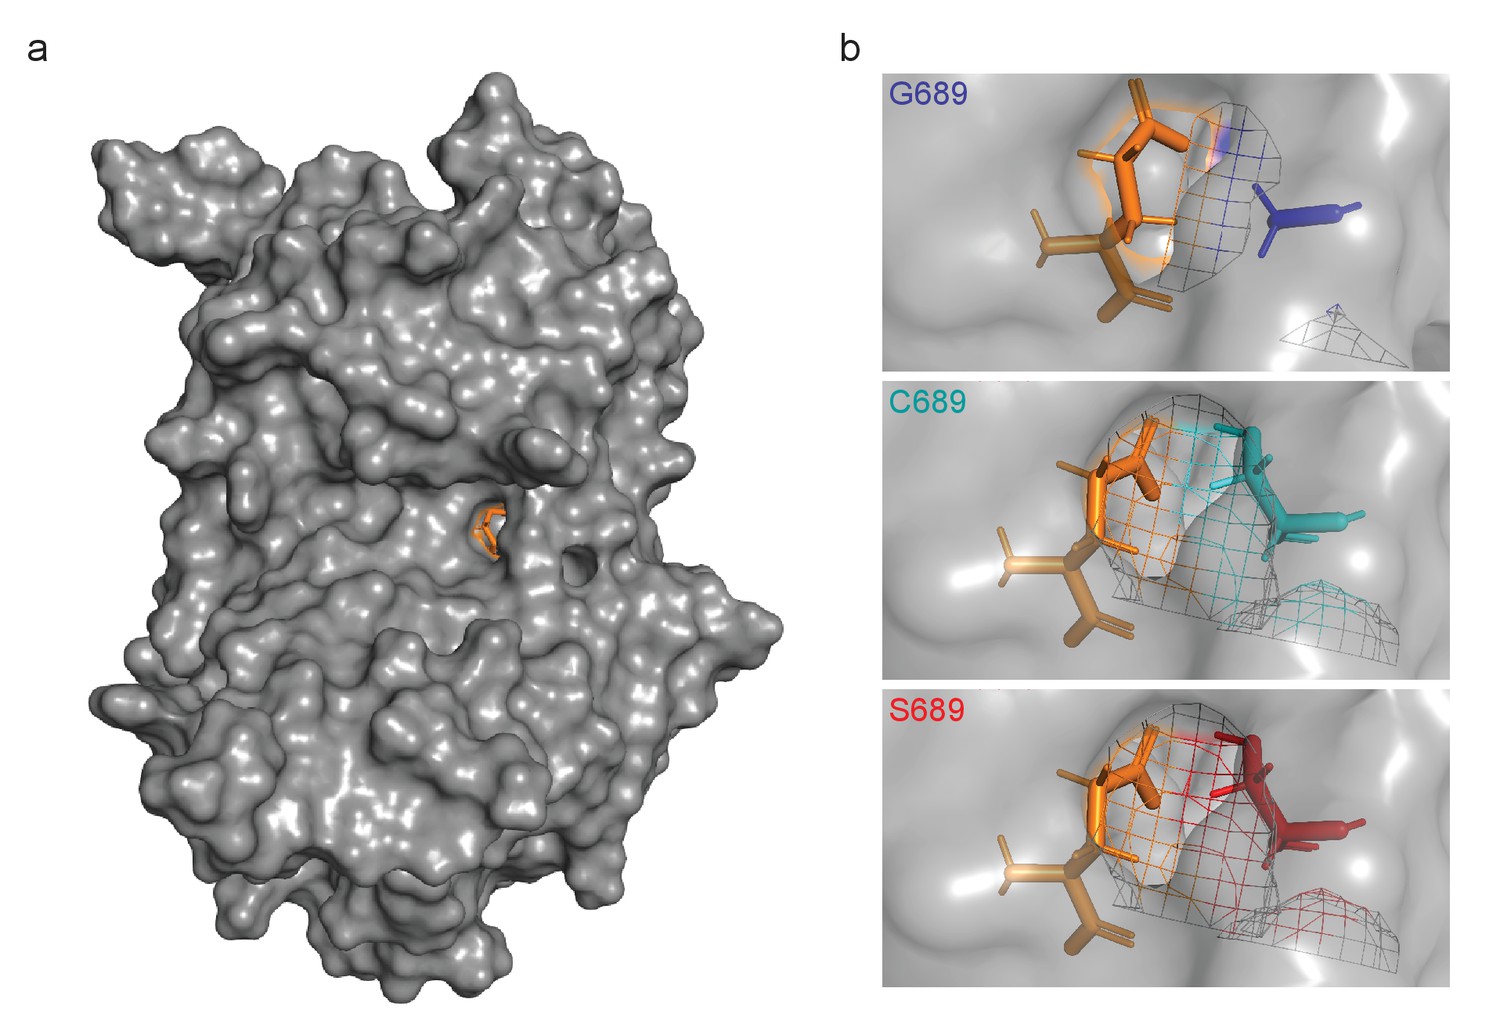
G689C and G689S mutations block possible water exit tunnels.
(a) GluN2B LBD crystal structure (a, PDB 4PE5) showing a large hole adjacent to the buried ligand (orange); depicting possible water entry/exit routes in the closed conformation. (b) The holes are completely sealed by the simulated G689C mutation (cyan-orange mesh, middle image) or G689S (red-orange mesh, bottom image) compared to native G689 residue (blue, top image).
Figure 1—figure supplement 3
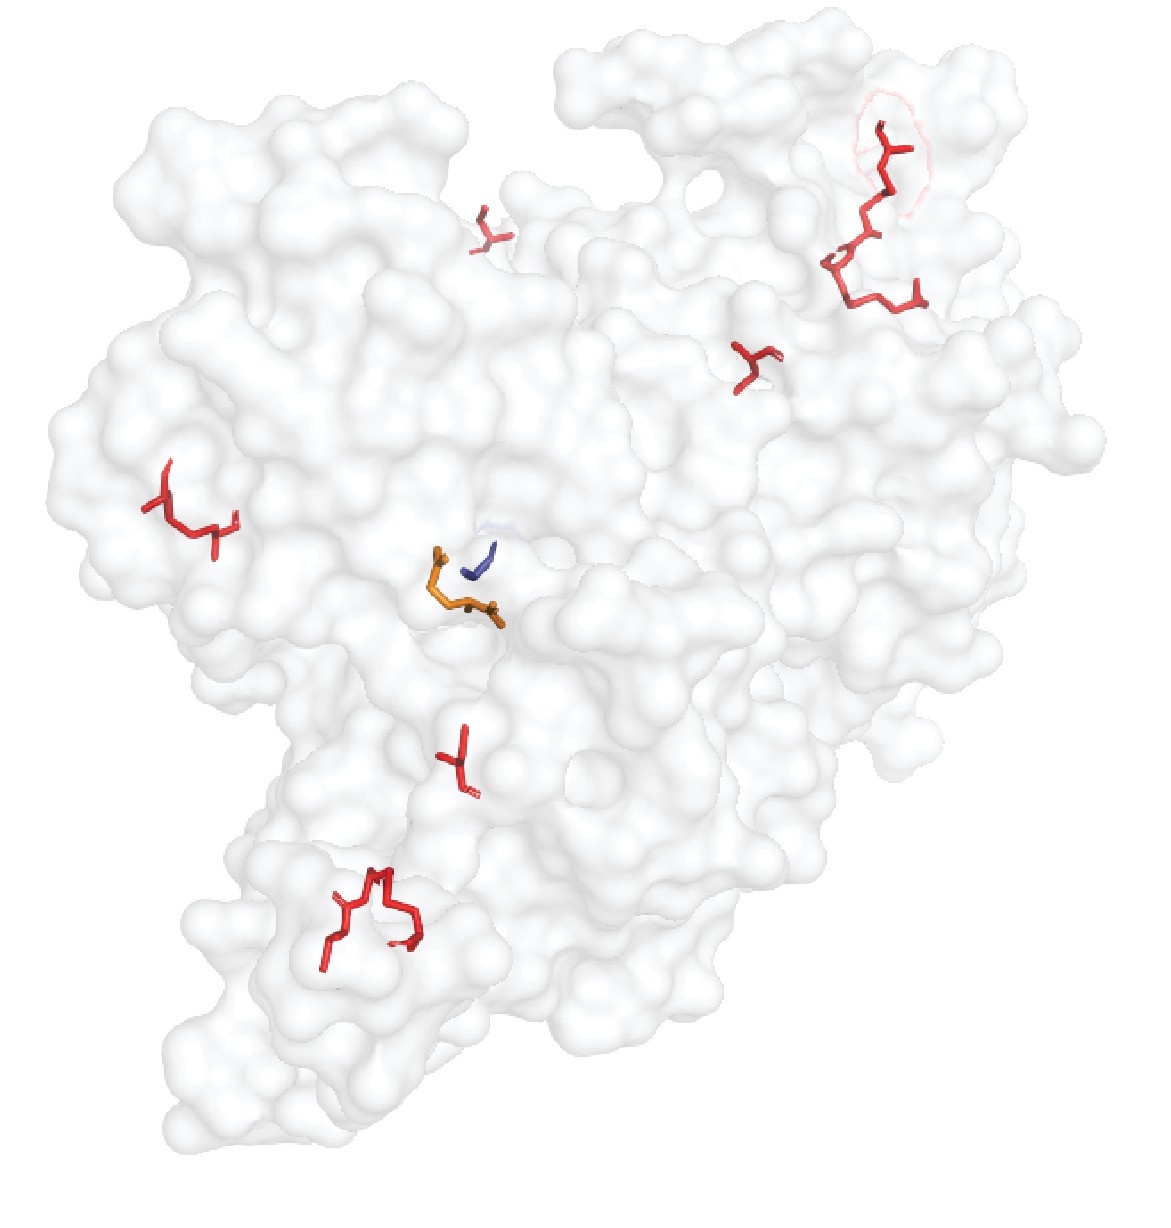
GluN2B LBD unbound cysteine residues.
Naturally occurring cysteine residues (red) in the GluN2B LBD (light gray) are distant from the G689 (blue) residue. Glutamate shown in orange.
Figure 1—figure supplement 4
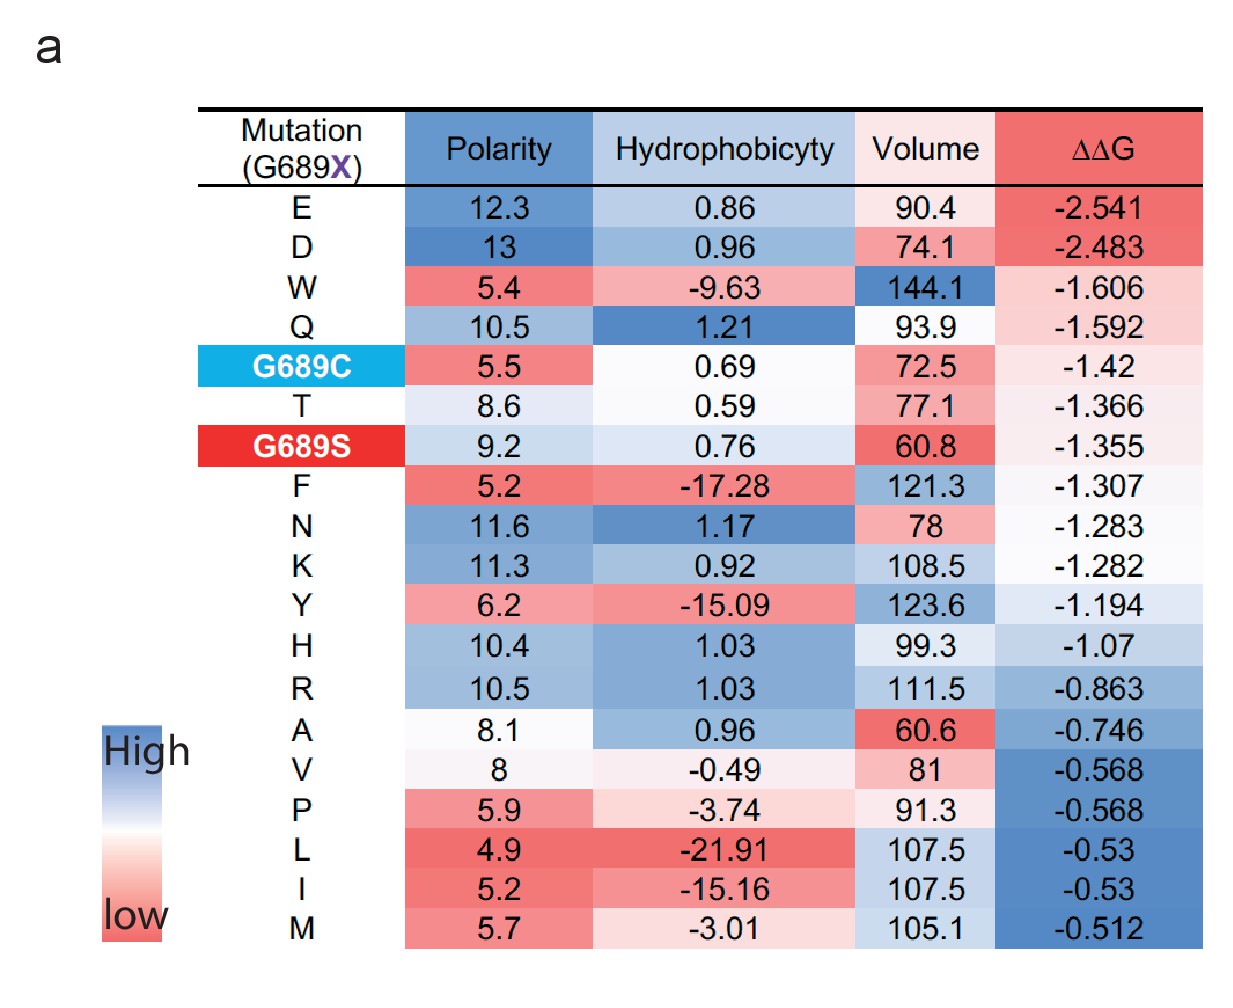
Mutations of G689 yield destabilized LBD.
(a) ΔΔG estimation for all possible substitutions of the G689 residue (19 substitutions). The sorted values (high to low- red to blue, respectively) show no correlation between residue’s features (polarity, hydrophobicity, and volume) and ΔΔG values, but show that both variants rank quite negatively (with similar ΔΔG values).
Figure 2 with 2 supplements
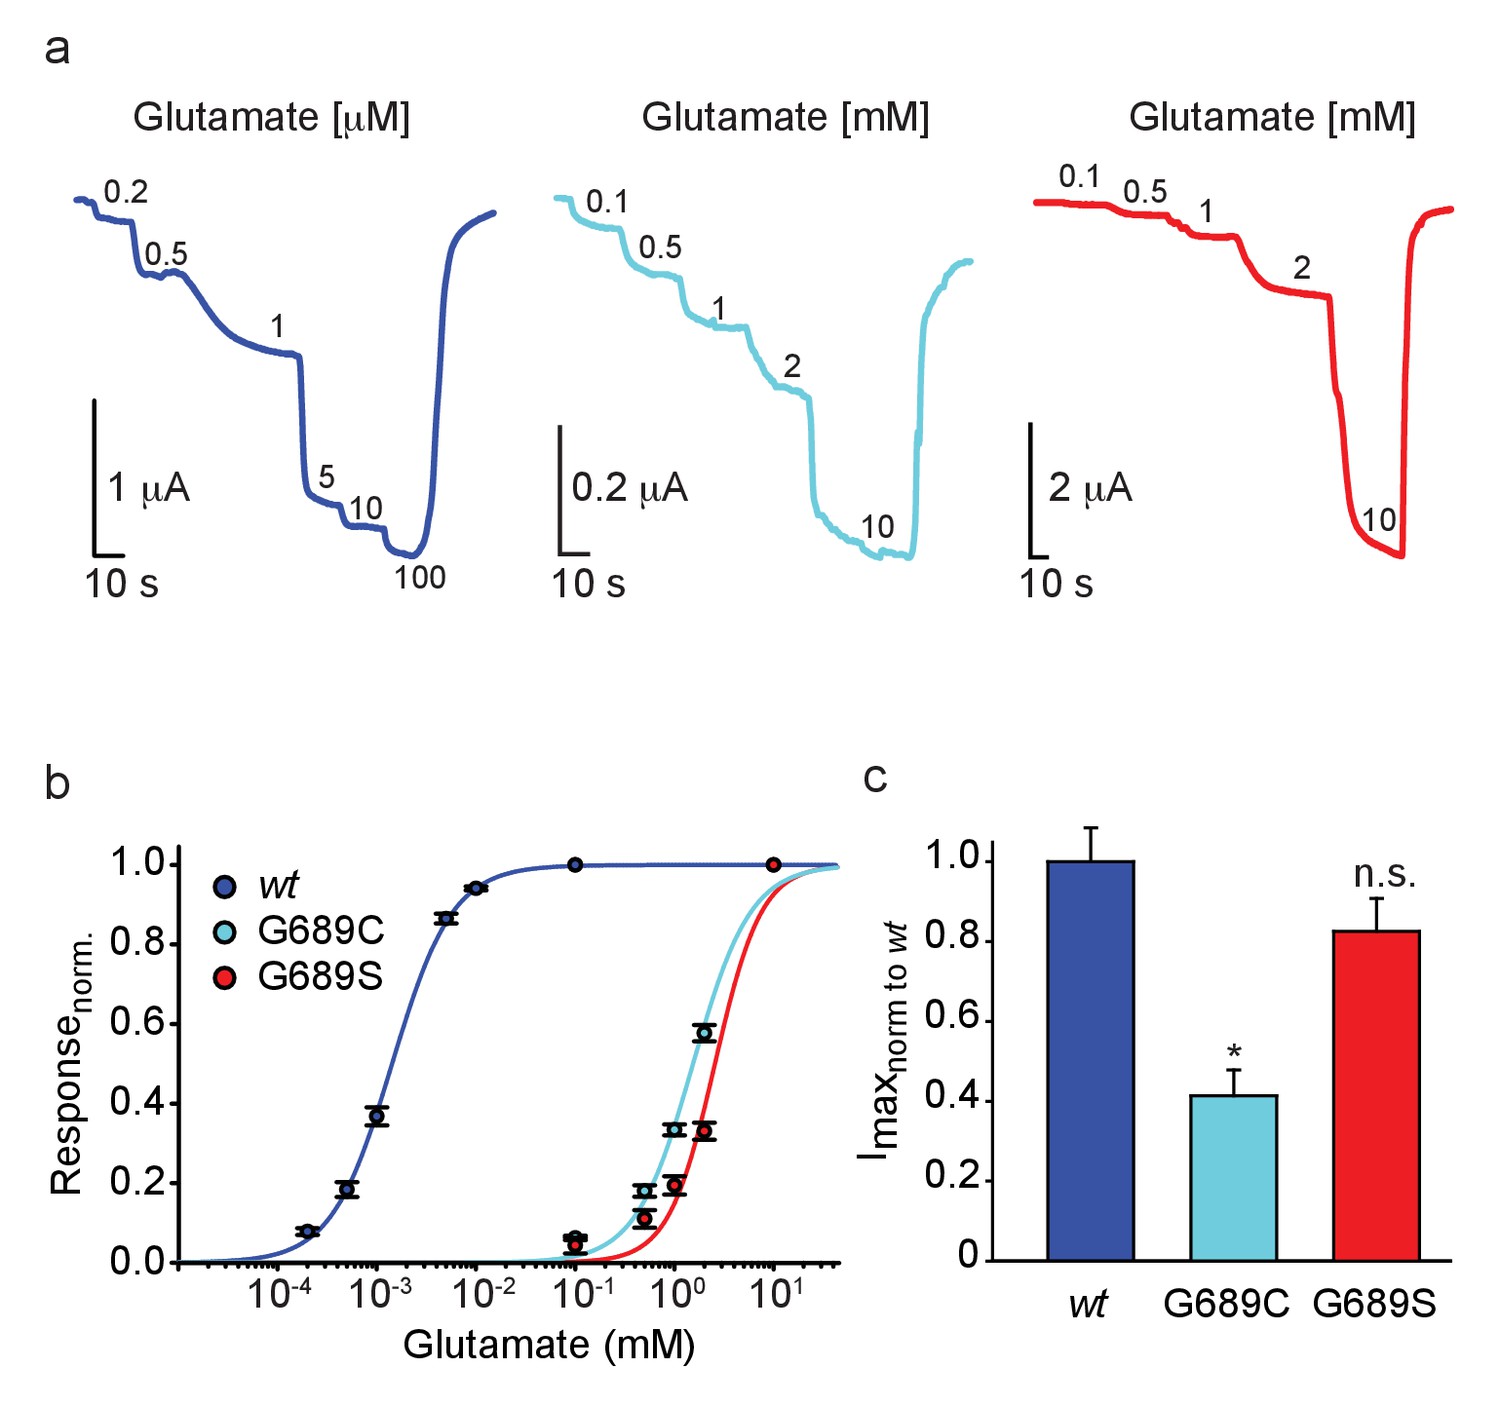
GluN2B LBD mutations drastically reduce glutamate potency.
(a) Representative glutamate-dependent currents recorded from Xenopus oocytes co-expressing hGluN1a with GluN2B-wt (blue); GluN2B-G689C (cyan) or GluN2B-G689S (red). Glutamate concentrations are marked next to current steps (note the differences in units, namely μM and mM); summarized in (b). (c) Summary of the normalized maximal current (Imax) of the different GluN2B-subunits, showing the significantly smaller currents of G689C, but not G689S, mutant. For (b), wt- 43 cells; G689C- 31 cells; G689S- 23 cells, collected form two to three independent experiments; (c), wt- 22 cells; G689C- 30 cells; G689S- 21 cells, collected form one to two independent experiments.
Figure 2—figure supplement 1
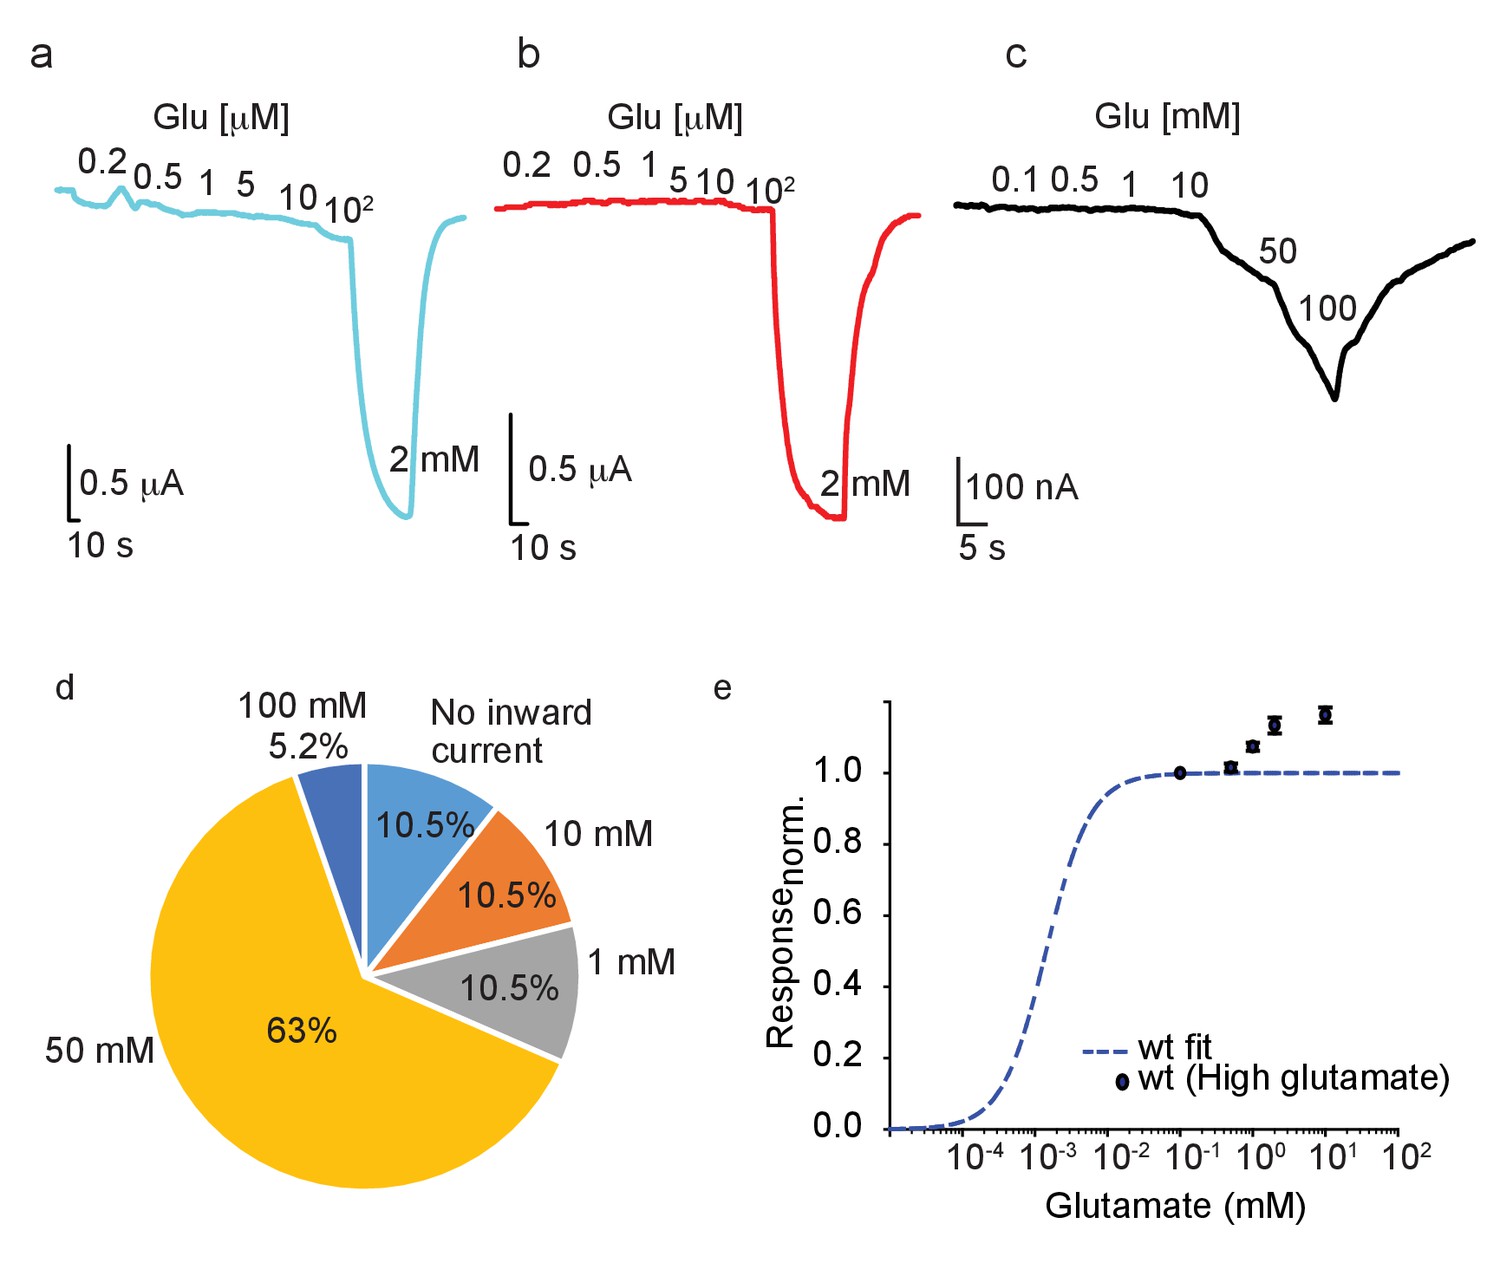
Assessment of the effect of low to very high glutamate concentrations on uninjected oocytes and G689C/S-injected oocytes.
(a and b) Representative traces of oocytes co-expressing hGluN1a and GluN2B-G689C (cyan, a) or -G689S (red, b) in response to low glutamate concentrations (indicated next to trace), from two to three independent experiments, n = 32 and 11, respectively. (c) Responses of uninjected oocytes to low and very high glutamate concentrations. Uninjected oocytes start responding to glutamate concentrations surpassing 10 mM, although osmolarity was maintained in all groups. (d) Summary of the effects of different glutamate concentrations on uninjected oocytes. Pie chart represents the fraction of oocytes (from N=2, n = 19 oocytes) that began responding only at the concentration indicated: 10.5% of all oocytes did not show any non-specific response even to 100 mM glutamate (no inward current, cyan). A similar fraction of oocytes (10.5%) showed non-specific inward current already at 1 mM (gray) and 10.5% started to respond only at 10 mM (orange). 63% of oocytes began responding when reaching 50 mM glutamate (yellow) and only 5.2% showed non-specific responses only when reaching 100 mM glutamate. (e) hGluN1a-GluN2B-wt are saturated at 100 μM glutamate. Plot shows normal dose responses curve (dashed blue, taken from Figure 2) and the small contribution (<15%) to the total current by excess glutamate >100 μM glutamate (blue closed circles) for N = 3, n = 26 oocytes.
Figure 2—figure supplement 2
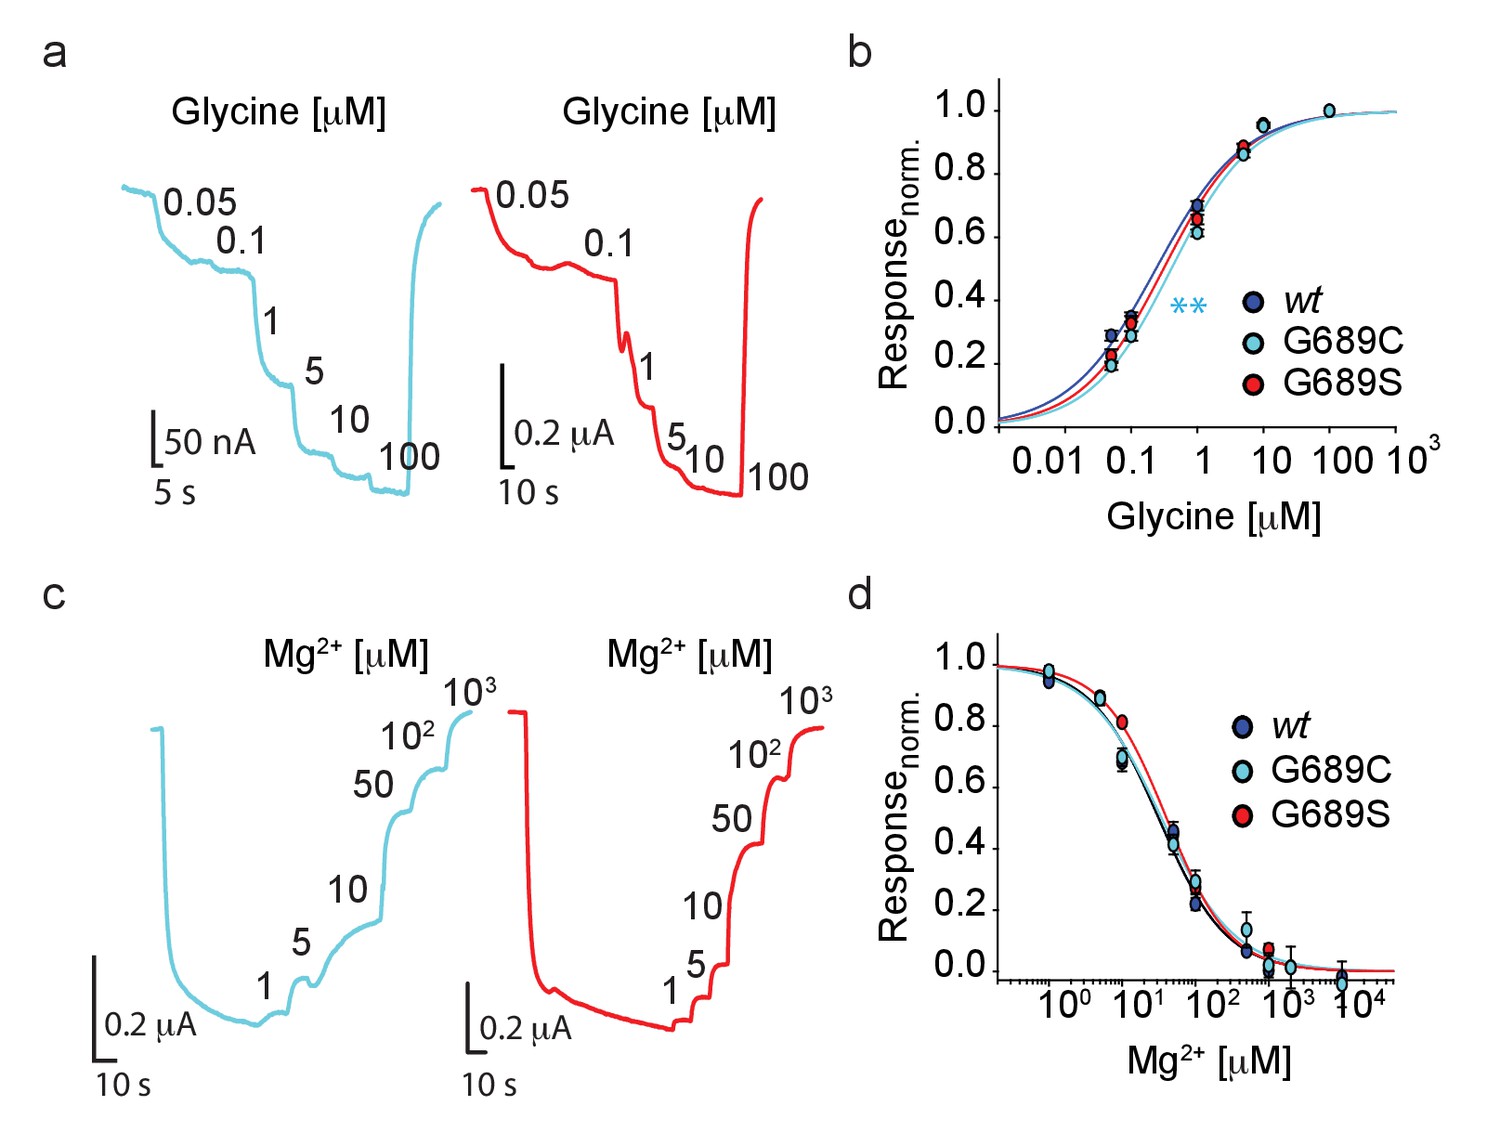
Variants’ effect on Glycine and Mg2+-sensitivity.
(a, c) Representative traces showing responses of the variants to glycine (a) or Mg2+ (c) of oocytes co-expressing hGluN1a and hGluN2B-G689C (cyan) or -G689S (red). (b, d) Summary of dose-response curves for glycine (b) and Mg2+ (d) are shown for GluN2B-wt (dark blue), G689C (cyan) and G689S (red). Glycine EC50 and Mg2+ IC50 values are listed in Table 2. For (b) n = wt- 33 cells; G689C- 35 cells; G689S- 15 cells; for (d) n = wt- 33 cells; G689C- 17 cells; G689S- 23 cells, from one to three independent experiments. **, p< 0.01.
Figure 3 with 1 supplement
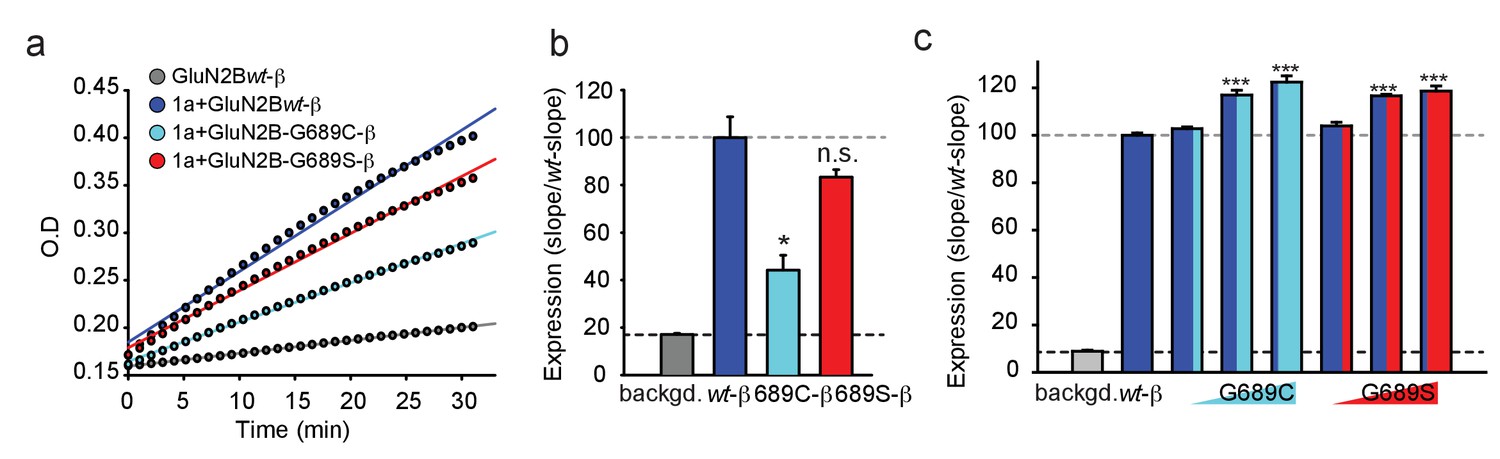
The G689C variant is poorly expressed at membranes of cells, but both variants enhance expression of GluN2Bwt.
(a) Representative plot of nitrocefin absorbance (O.D) over time (min) in HEK293T cells expressing GluN2B-β-lac (gray), hGluN1a-GluN2B-wt-β-lac (blue), hGluN1a-GluN2B-G689C-β-lac (cyan), hGluN1a-GluN2B-G689S-β-lac (red). Background signal (backgd.; gray) was collected from cells expressing GluN2Bwt-β-lac only (wt-β, 1 μg DNA) without GluN1a (thereby not transported to membrane). (b) Summary of expression of the various channel types from three to five independent experiments. Colors are as depicted in (a). Results show that G689C expresses at ~44% compared to the expression of 2B-wt or G689S subunits. (c) Summary of the expression of GluN2Bwt-β-lac (wt-β, 1 μg DNA), co-transfected with 1 μg GluN1a, when also co-transfected with increasing DNA amounts (0.1, 0.5, and 1 μg) of the G689C (cyan) or G689S variants (N = two independent experiments). *, p<0.05; **, p<0.01; ***, p<0.001; n.s. non-significant. Statistics show comparison to the wt-β group.
Figure 3—figure supplement 1
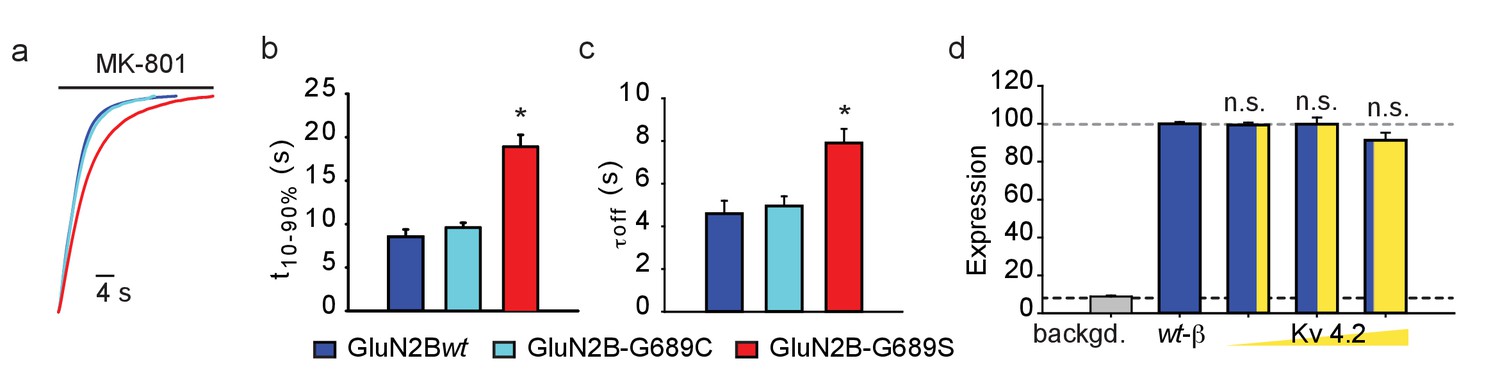
hGluN2B-G689S, but not hGluN2B-G689C, shows reduced apparent open probability (Po).
(a) Representative deactivation traces of oocytes co-expressing hGluN1a with hGluN2Bwt (black), hGluN2B-G689C (cyan) or hGluN2B-G689S (red). Following opening of channels by 3 mM glutamate, oocytes were washed with glutamate and 1 μM MK-801 (activity-dependent blocker; indicated by black bar above traces). (b, c) Summary of deactivation kinetics. t10-90% inhibition (b) and τoff (c) (see Materials and methods) are shown (bars are color coded as representative currents). (d) Summary of the the expression of GluN2Bwt-β-lac (wt-β, 1 μg DNA) in HEK293T cells, co-transfected with 1 μg GluN1a, when also co-transfected with increasing DNA amounts (0.1, 0.5, and 1 μg) of Kv4.2 (N = two independent experiments). *, p<0.05; **, p<0.01; ***, p<0.001; n.s. non-significant. Statistics show comparison to the GluN2wt-β group.
Figure 4 with 1 supplement

GluN2B LBD variants exert a dominant-negative effect over GluN2B-wt subunit in Xenopus oocytes.
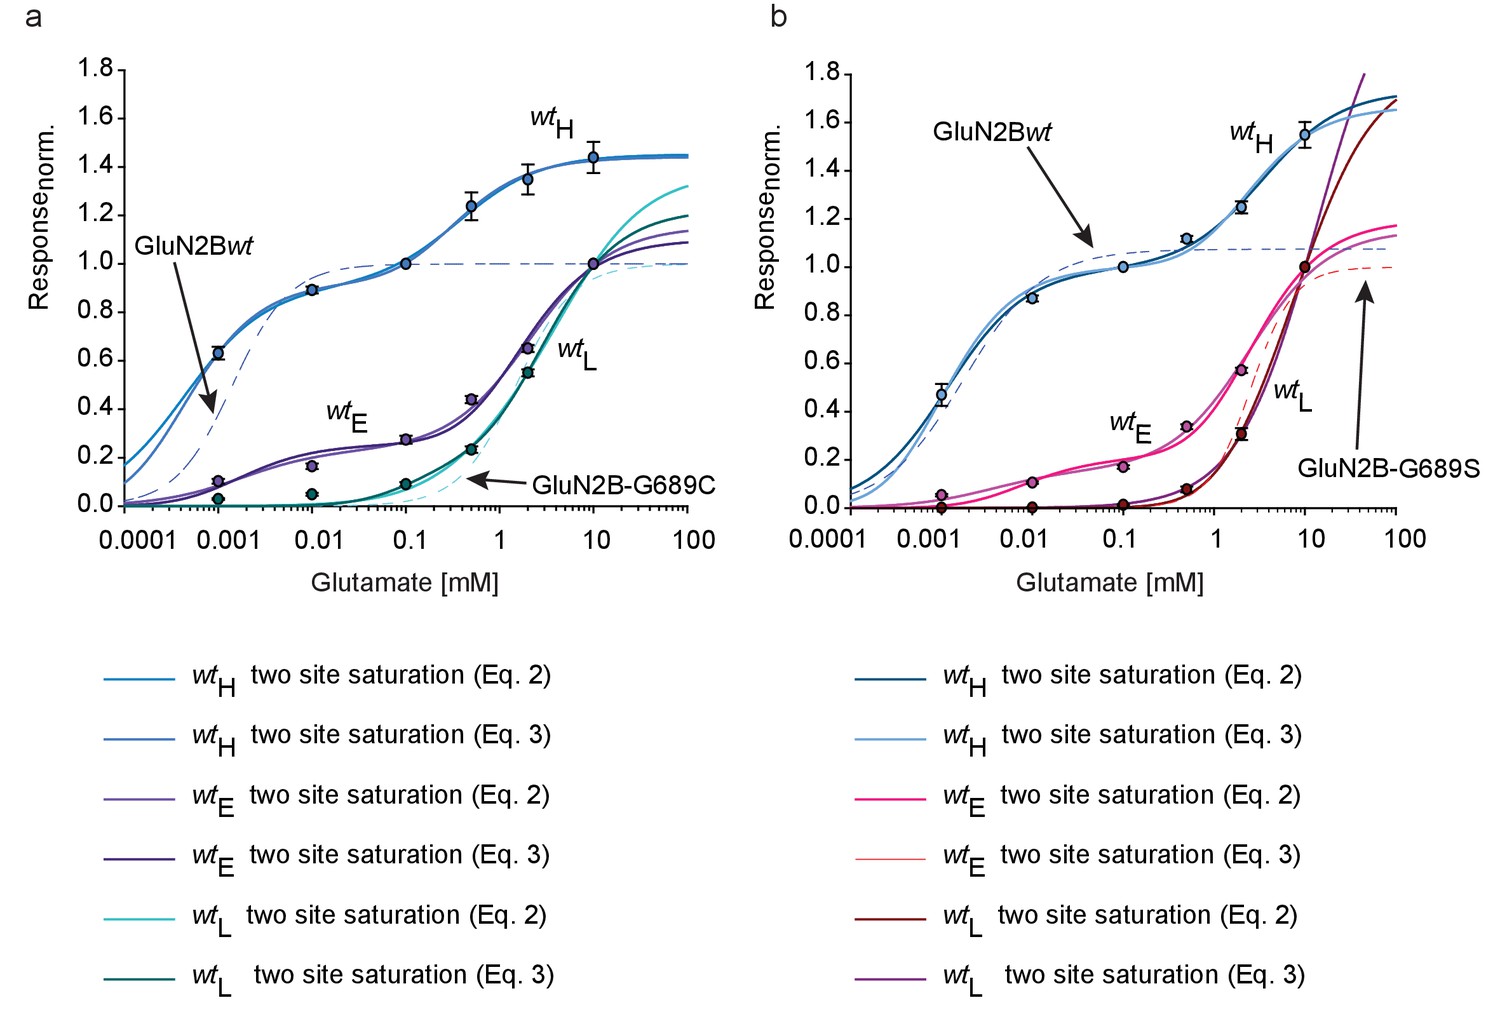
(a and d) Representative traces from oocytes co-expressing hGluN1a, hGluN2B-wt and GluN2B-G689C (a) or G689S (d) at different mRNA ratios in response to incrementing glutamate concentrations (indicated next to trace, in μM unless mentioned otherwise). Oocytes in which we co-injected mRNA of GluN2Bwt 16-fold over mRNA of variant belong to wildtype-High group (wtH). Oocytes co-injected with equal mRNA amounts belong to wt-Equal group (wtE) and, inversely, oocytes co-injected with 16-fold more mRNA of variant over GluN2Bwt, belong to the wt-Low group (wtL). (b and e) Summary of the normalized maximal current (Imax) obtained by 5 mM glutamate and 100 μM glycine for the different treatments (wtH, wtE and wtL) when G689C (b) or G689S (e) were co-injected with the GluN2Bwt-subunit. N = 1–2 experiments, n = 10–19 oocytes. (c and f) Glutamate dose-response curves for the three different treatments with G689C (c), namely wtH, wtE and wtL groups fitted by different bimodal curves in blue-, purple-, and cyan-shades, respectively (values are shown in Table 3) and for G689S (f) by light blue-, pink- and cyan shades, respectively. Dashed plots (blue and cyan in c; blue and pink in f) show dose-response curves for di-heteromeric channels, hGlun1a-hGluN2B-wt and hGlun1a-hGluN2B-G689C or G689S, respectively (as shown in Figure 2b). For (c), wtH- 18 cells; wtE - 26 cells; wtL- 19 cells, collected form two to three independent experiments; (f), wtH- 14 cells; wtE - 11 cells; wtL- 12 cells, collected form one to two independent experiments.
Figure 4—figure supplement 1
Re-normalization of dose-response curves to 100 μM glutamate persistently shows dominant-negative effect of variants at wtH group.
(a, b) Glutamate dose-response curves for wtH, wtE, and wtL for hGluN1a+hGluN2Bwt co-expressed with varying doses of hGluN2B-G689C (a) or -G689S (b); fitted by bimodal curves after values have been normalized to 100 μM glutamate (instead of 10 mM as in Figure 4). Dashed traces show the standard dose-response curve for the di-heteromeric hGlun1a co-expressed with hGluN2Bwt (dark blue in a and b), G689C (dashed cyan, a) or -G689S (dashed pink, b) (taken from Figure 2). Fit types are indicated below graphs.
Figure 5 with 2 supplements
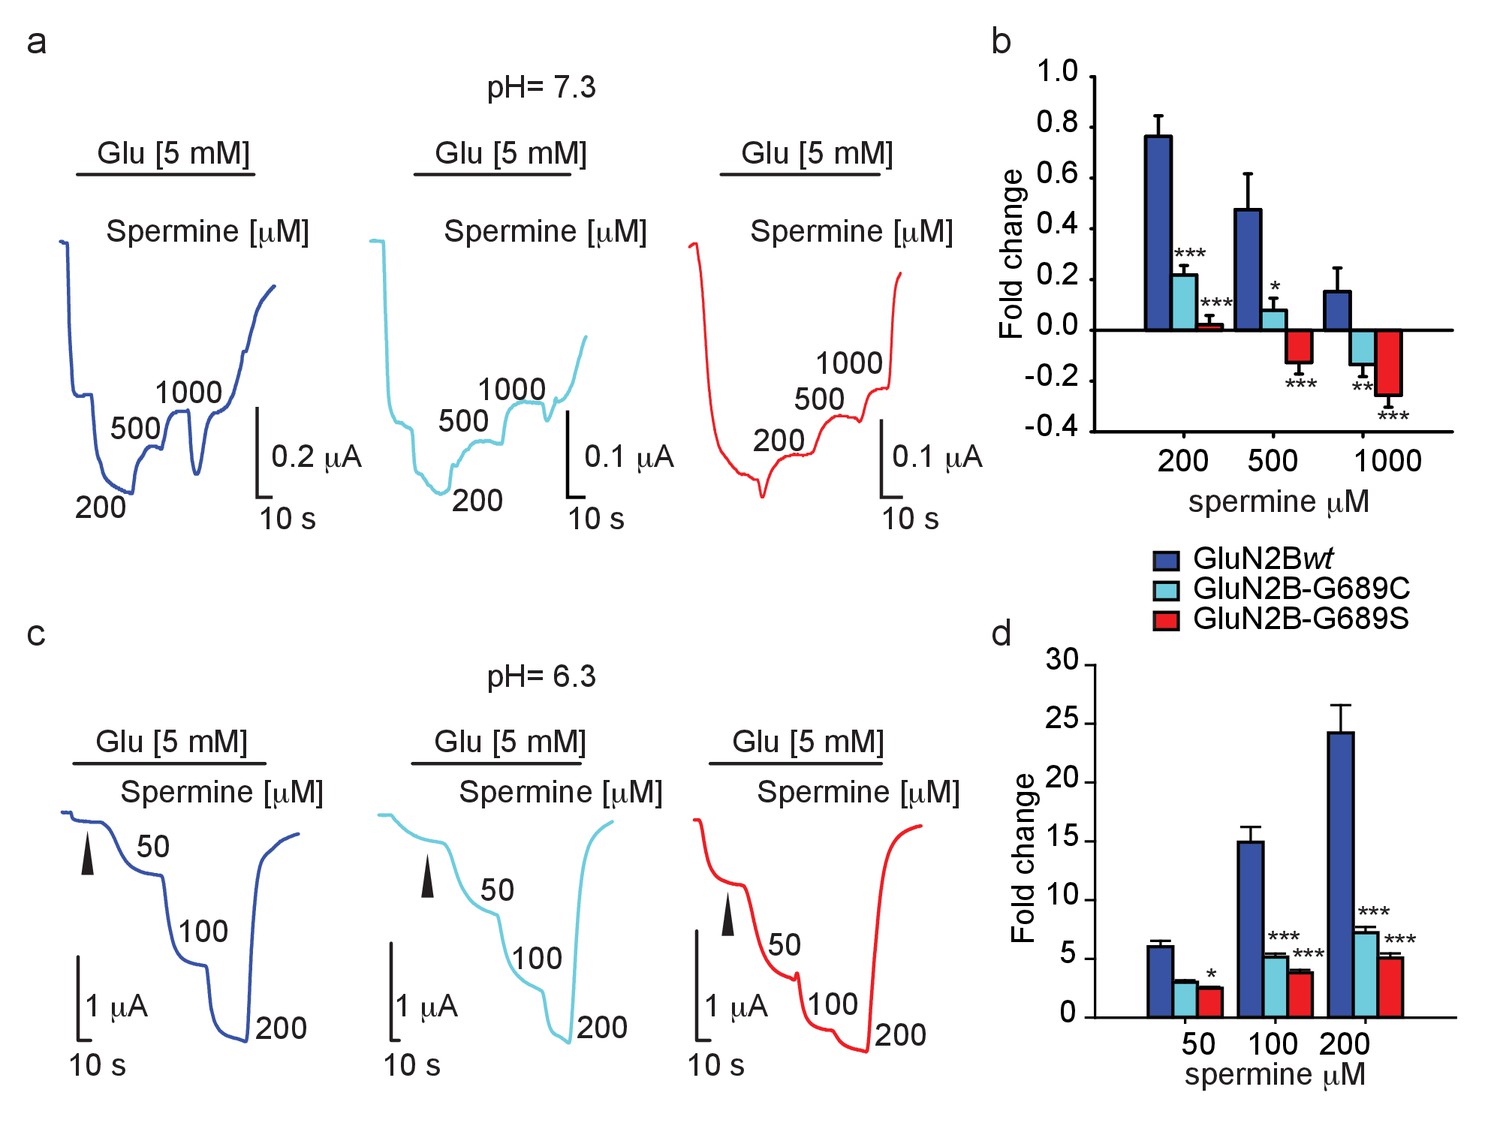
Spermine weakly potentiates variants in Xenopus oocytes.
(a and c) Representative traces from oocytes co-expressing hGluN1a and hGluN2B-wt (blue) or GluN2B-G689C (cyan) or G689S (red), in response to increases in spermine concentrations (indicated next to trace in μM) after receptors activation (indicated by black line by 5 mM glutamate) at pH=7.3 (a) or pH 6.3 (c). At pH = 7.3, G689S failed to respond to spermine under all conditions and, instead, was inhibited by the drug. (b and d) Summary of spermine potentiation at pH=7.3 (b) or pH = 6.3 (d). Black arrowhead (c) shows the strongly diminished basal glutamate-current at pH=6.3; Ibasal. In c, note that the variants (cyan and red) exhibit a larger Ibasal than oocytes expressing hGluN1a and hGluN2B-wt (blue), though it did not reach significance. This resulted from the application of 5 mM glutamate that saturates currents of hGluN1a and hGluN2B-wt (blue), but not of the variants. From two to three independent experiments, (b) n = 4–16 oocytes; (d) n = 14–20 cells. *, p<0.05; ***, p<0.001. Statistics show comparison to the corresponding GluN2Bwt group (blue).
Figure 5—figure supplement 1
LBD mutations do not affect spermine binding site.
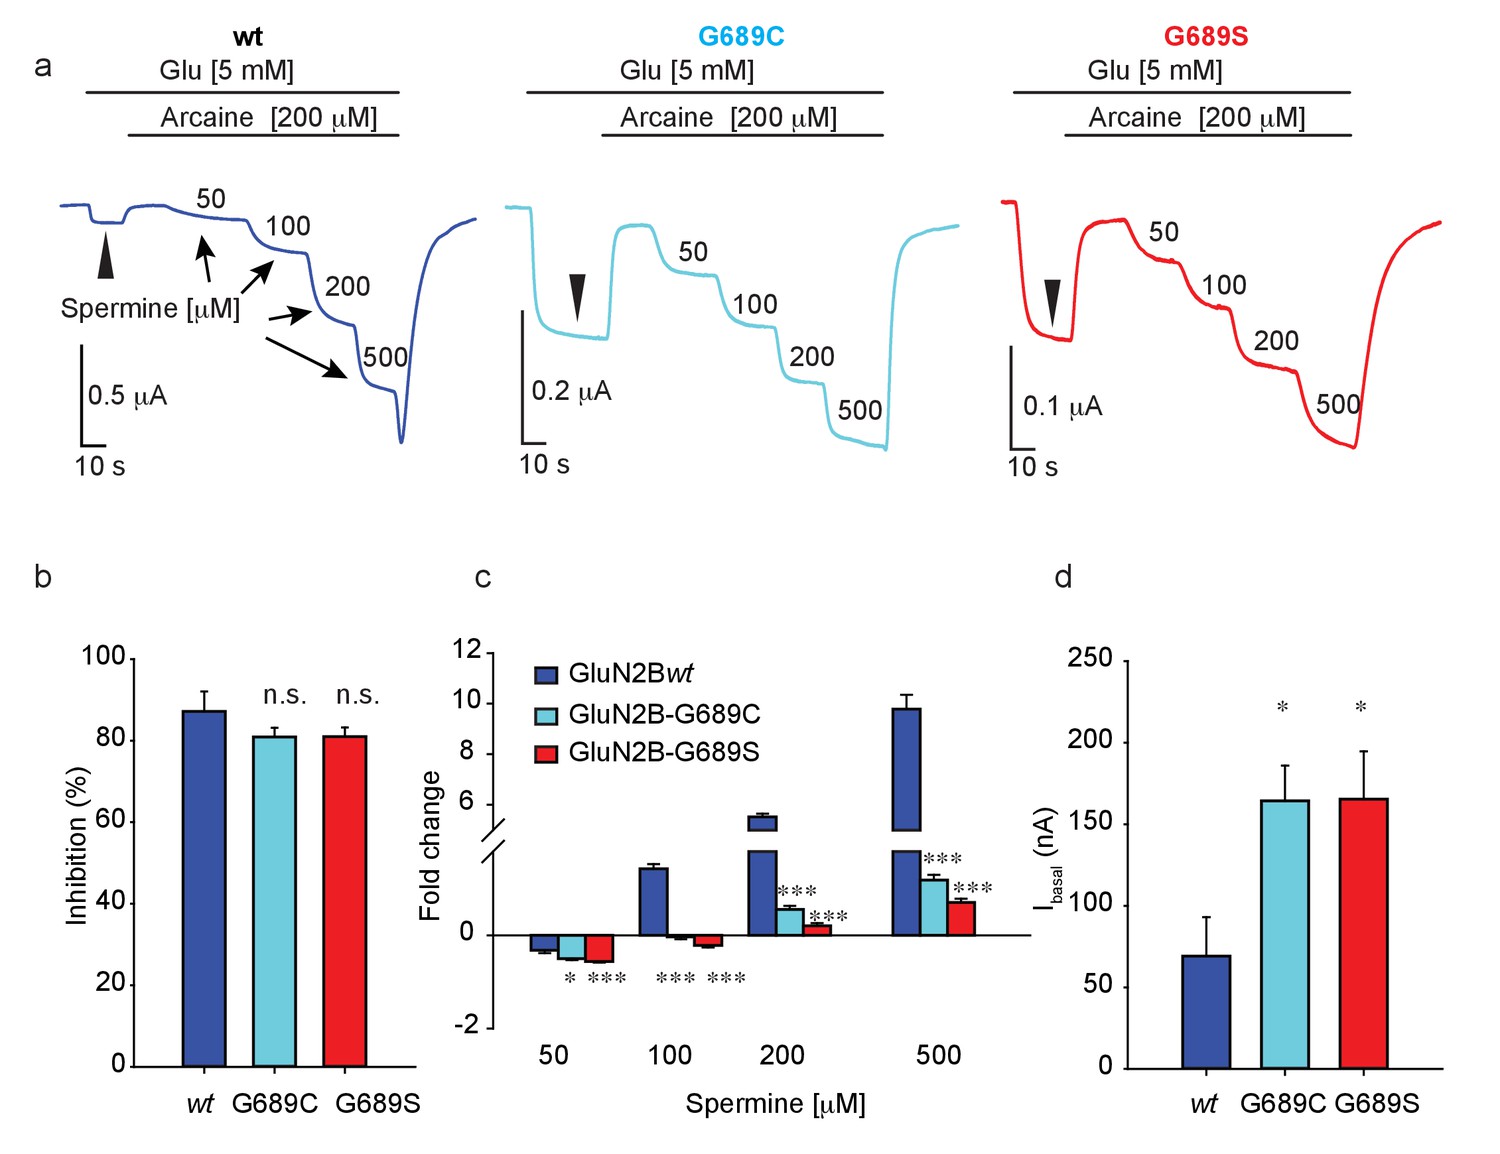
(a) Representative traces from oocytes co-expressing hGluN1a and hGluN2B-wt (blue) or GluN2B-G689C (cyan) or G689S (red) in response to block by arcaine (200 μM), after receptors have been activated by saturating glycine (100 μM) and glutamate (5 mM) at pH 6.5. Then, application of incrementing concentrations of spermine (concentration indicated next to plot; in μM) are added in the presence of arcaine, showing increases of the current despite antagonist. Arrowhead indicates Ibasal at pH 6.5, prior block by arcaine. (b) Summary of arcaine-dependent antagonism of the current. (c) Summary of spermine potentiation at pH=6.5 in the presence of 200 μM arcaine. (d) Summary of Ibasal at pH=6.5, showing that 2Bwt receptors exhibit smallest Ibasal. *, p<0.05 when compared to control group (in d). *** indicates p< 0.001 when compared to control group exposed to the same spermine concentration. n.s., not significant. hGluN2B-wt, n=9; hGluN2B-G689C, n=10; hGluN2B-G689S, n=9.
Figure 5—figure supplement 2
Spermine potentiation is correlated with proton sensitivity of the variants.
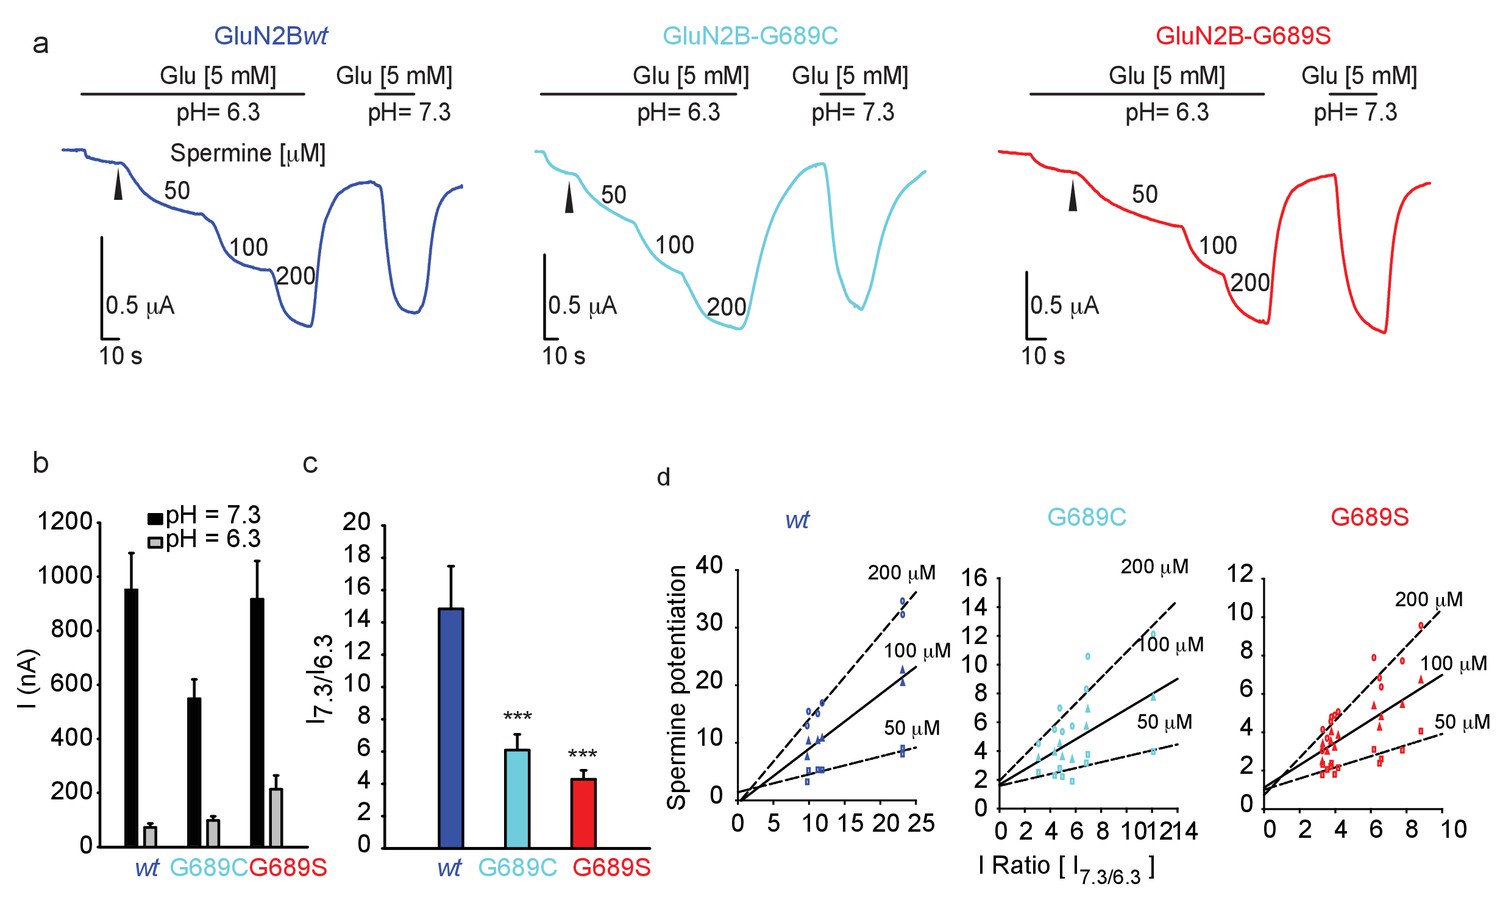
(a) Representative currents of GluN2Bwt (blue), G689C (cyan), and G689S (red) showing responses to 5 mM glutamate (top black bar) and incrementing concentrations of spermine (μM, noted next to trace) at pH = 6.3, followed by glutamate responses at pH 7.3; summarized in (b). (c) Summary of the ratio of currents obtained at pH 7.3 and pH = 6.3 (I7.3/6.3). (d) relationship between I7.3/I6.3 ratio and spermine potentiation (linear fit). *, p<0.05; **, p<0.01; ***, p<0.001; n.s. non-significant. Statistics show comparison to the GluN2wt-β group. Fits were assessed by Spearman correlation.
Figure 6
GluN2B variants show reduced proton-sensitivity.
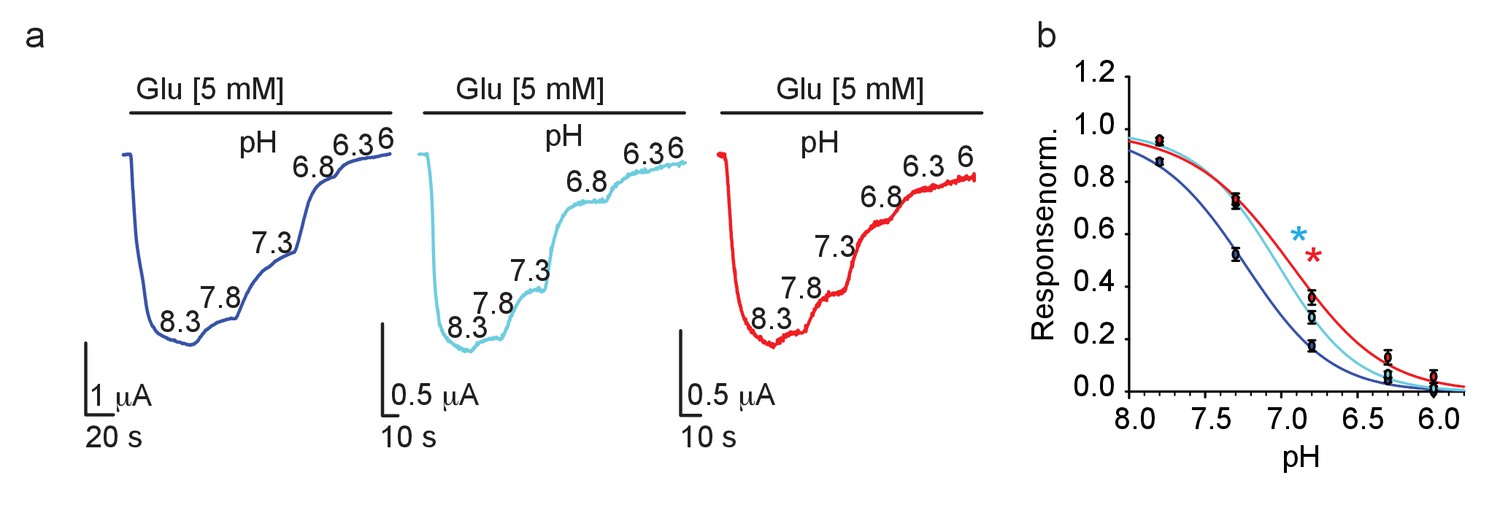
(a) Representative traces from oocytes co-expressing hGluN1a and hGluN2B-wt (blue) or GluN2B-G689C (cyan) or G689S (red), in response to decreases in pH (indicated next to trace in 8.3–6), summarized in (b). * (cyan- G689C and red, G689S) indicate p< 0.05 compared to IC50 of wt (see Table 2). From N=two independent experiments, n = 15–21 cells.
Figure 7

D-serine does not potentiate GluNRs.
(a) Representative traces from oocytes co-expressing hGluN1a and hGluN2B-wt (blue) or GluN2B-G689C (cyan) or G689S (red) in response to 100 μM D-serine (green bar above traces) after receptors have been activated by 5 mM glutamate along 1 (orange), 10 (light blue), or 100 μM (light green) glycine. b Summary of changes in amplitude after application of 100 μM (color coded as in a). c Representative traces and assessment of the effect of application of 100 μM D-serine (as shown in a), but when channels are activated by physiologically relevant glutamate (10 μM) and glycine (1 μM) concentrations. Total current of channels (and proof of expression) was obtained by application of 5 mM glutamate before end of recording. D-serine further activates, albeit weakly, G689C (cyan), but has no effect over 2B-G689S receptors (red); summarized in (d) and inset (zoom in on region of plot). In (d), black outline of bars represents currents obtained by 1 μM glycine. Green outline represents the currents obtained by 1 μM glycine and D-serine. *** indicates p< 0.001 compared to other glycine concentrations for the same variant. n.s., not significant. hGluN2B-wt, n=10; hGluN2B-G689C, n=11; hGluN2B-G689S, n=12. For (d), n = 8 (G689C), n=7 (G689S).
Figure 8 with 2 supplements
GluN2B variants modulate synaptic glutamatergic activity.
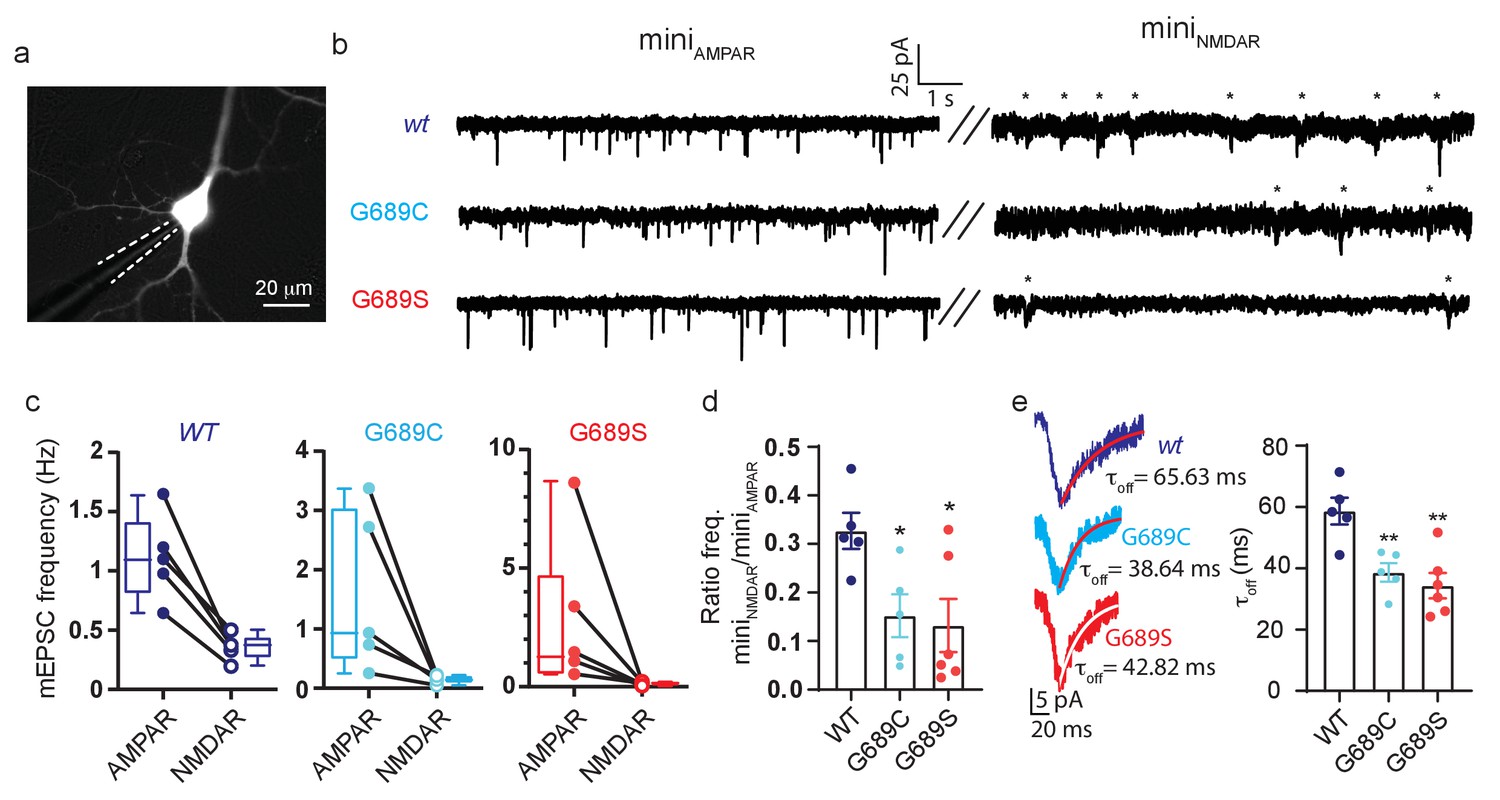
(a) Representative micrograph showing a transfected neurons (expressing GluN2B and YFP) and a recording pipette (dashed white line). (b) Representative recordings of miniature EPSCs from neurons overexpressing GluN2Bwt (top), GluN2B-G689C (middle) or GluN2B-G689S (bottom) subunits. Left- recordings of miniAMPAR; right- miniNMDAR (highlighted by asterisks). (c) Frequencies of miniAMPAR and miniNMDAR for each cell, summarized in (d). (d) Ratio of NMDAR to AMPAR minis’ frequency. (e) miniNMDAR show reduced decay kinetics. Traces are averaged miniature EPSCs from events as shown in (b), fitted with a mono-exponential fit (red), summarized in plot (τoff). n.s., not significant. *, p<0.05 compared to control group, 2Bwt. hGluN2B-wt, n=5; hGluN2B-G689C, n=5; hGluN2B-G689S, n=6. Fit (red)- exponential.
Figure 8—figure supplement 1
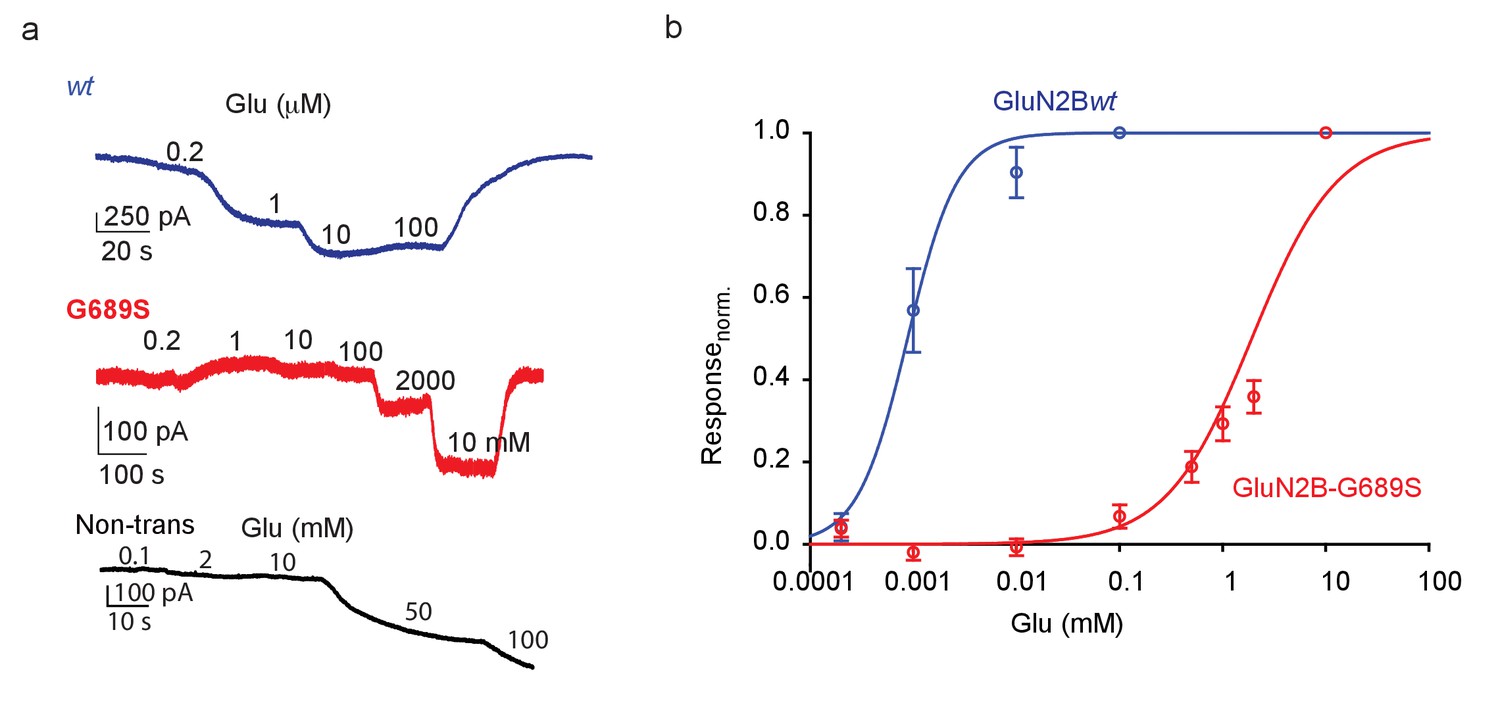
GluN2B-G689S shows reduced glutamate potency in mammalian cells.
(a) Representative glutamate-dependent currents recorded from HEK293T cells, transfected with hGluN1a with GluN2B-wt (blue, top trace) or with GluN2B-G689S (red), and non-transfected cells (black, bottom trace). Note that non-transfected cells exhibit non-specific responses to glutamate only at >10 mM glutamate. (b) Dose-response curves, color coded as in (a). GluN2Bwt, n=6; hGluN2B-G689S, n=20.
Figure 8—figure supplement 2
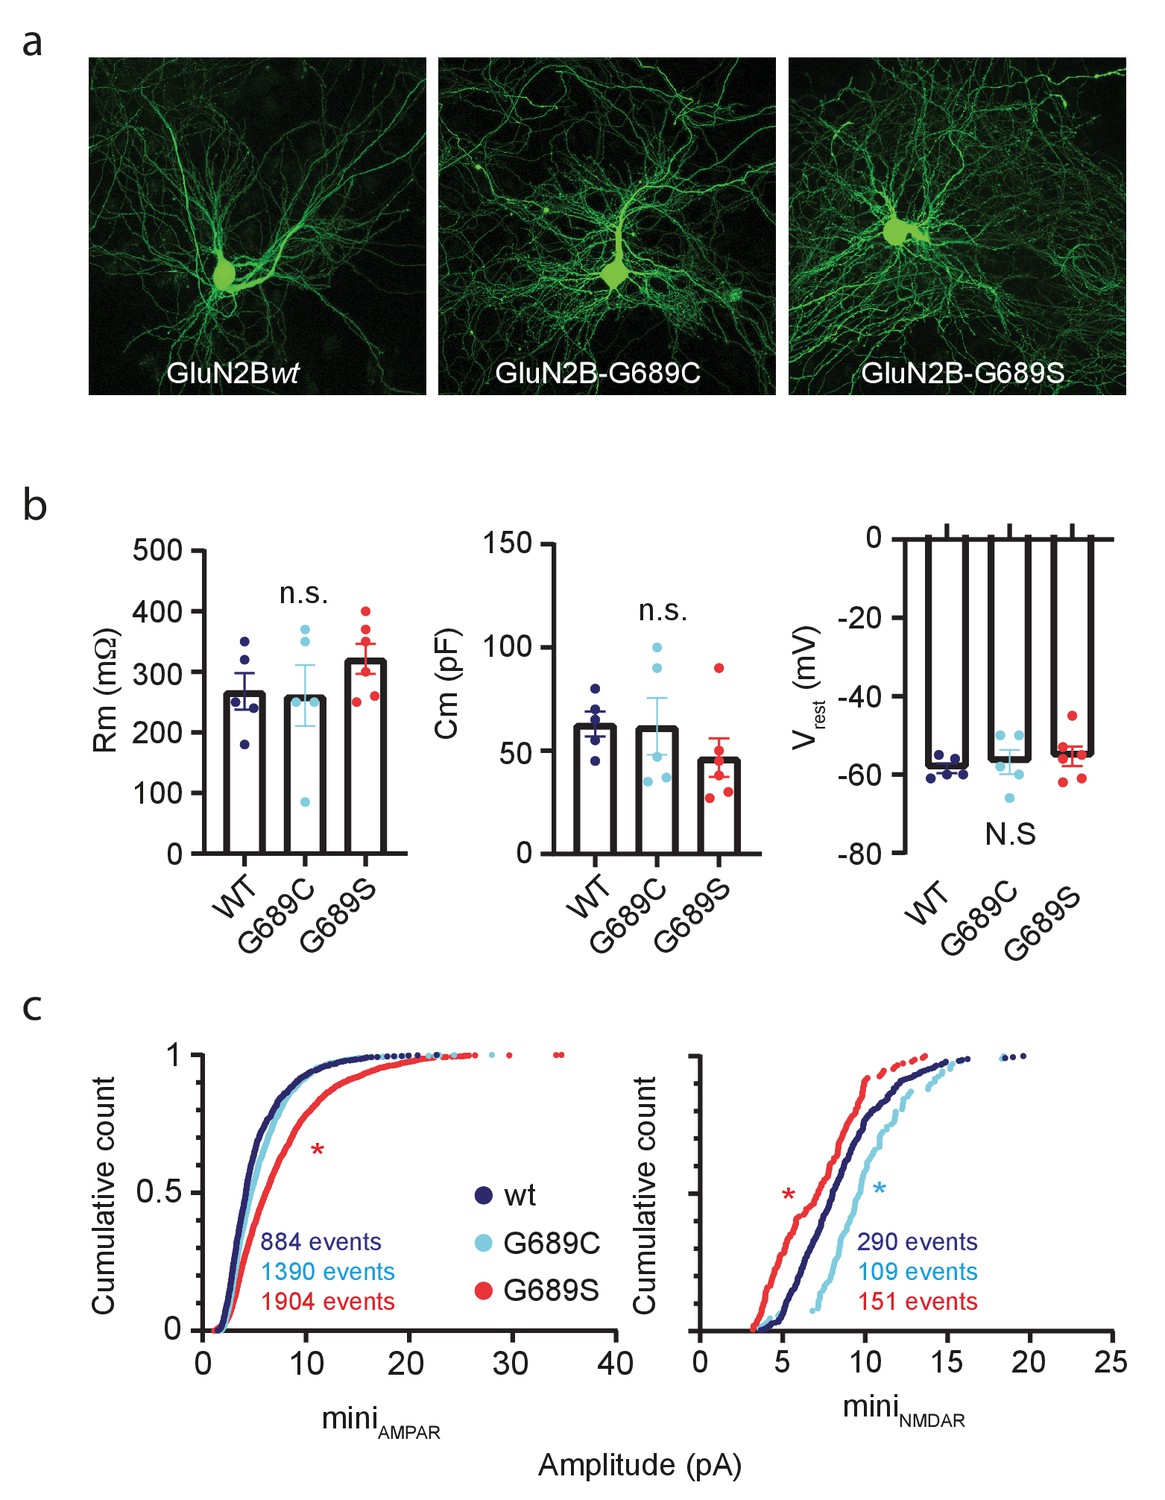
GluN2B variants modulate miniature EPSCs' amplitudes.
(a) Representative micrographs showing comparable morphology of neurons overexpressing GluN2Bwt, G689C, or G689S. (b) Summary of membrane resistance (left), capacitance (middle) and resting potential (right) of neurons presented in Figure 8. (c) Cumulative distribution for amplitude of miniAMPAR (left) and miniNMDAR (right). *, p<0.05 compared to control group (number of events are noted in plots).
Tables
Table 1
clinical proband of patients suffering from De novo GRIN2B mutations.
| Mutation | GRIN2B p.Gly689Ser | GRIN2B p.Gly689Cys |
|---|---|---|
| Genotype (type) | c.2065G>A, De Novo, heterozygous (WES; performed at ~1 year of age) | c.2065G>T, De Novo, heterozygous (WES; performed at 8 months of age) |
| CMA | N/A | Normal |
| Age | 6 | 3.5 |
| EEG | Initial EEG (before 1 y): epileptiform discharges 1.5- year -old: diffuse mix of beta activity, sometimes sharp waves centrally in the midline; sleep: recurrent trains of sharp waves / polyspikes and slow waves with a very high amplitude, as well as trains of fast activity (20 Hz) occipito-post-temporal, sometimes with a diffuse spread (correlated with myoclonic seizures) Latest EEG: May 2019: Spikes / Sharp-waves in the left temporo/central region | Normal with no epileptic behavior |
| Seizures | Myoclonic seizures + epileptic spasms | No epileptic activity |
| MRI | Normal (at 1 year of age) | Asymmetry in left ventricle (up to 11 mm; prenatally) Normal (at 1.5 year of age) |
| DD | Severe, crawl for short distance | Severe, can crawl, walk with aid |
| ID | Severe – nonverbal | Severe - speaks 10 words, understands simple commands |
| Strabismus | No | Yes |
| Gastrointestinal symptoms | N/A | Constipation (until two years old), reflux |
| Additional observations | Dyskinetic movements, hypertonia | Dyskinetic movements (resolved at age of 2), hypotonia, hyperflexible, no dysmorphism |
| Current medication | Piracetam and serine Previously treated with CBD and valproic acid | N/A |
| VUS | SLC6A8, CACNA1A | N/A |
| Collaboration | Danish Epilepsy Centre | The Genetics institute -Rambam |
-
CMA – chromosomal microarray analysis; DD -developmental delay; ID – intellectual disability; VUS - Variant of uncertain significance; N/A – not available.
Table 2
Summary of pharmacological profiling for hGluN2B-G689C and hGlun2B-G689S.
| Variant | Glutamate EC50 (n) | Imax Norm. to wt (n) | Glycine EC50 (n) | Mg+2 IC50 (−60 mV) (n) | 10–90% inhibition rate (n) | τoff (n) | Proton IC50 (n) |
|---|---|---|---|---|---|---|---|
| hGluN2B-wt | 1.4 ± 0.04 µM; (43) 0.8 ± 0.01 µM; (6, HEK293T cells) | 1 ± 0.08; (22) | 0.23 ± 0.03 µM; (33) | 31 ± 3.7 µM; (33) | 8554 ± 827 ms; (24) | 4590 ± 603 ms; (24) | 7.26 ± 0.02; (15) |
| hGluN2B- G689C | 1.54 ± 0.14* mM; (31) | 0.41 ± 0.06*; (30) | 0.4 ± 0.05** µM; (33) | 34.5 ± 3.8 µM; (17) | 9604 ± 547 ms; (29) | 4950 ± 456 ms; (29) | 7.04 ± 0.01*; (19) |
| hGluN2B- G689S | 2.56 ± 0.40* mM; (23) 2.2 ± 0.39 mM *; (20, HEK293T cells) | 0.82 ± 0.08; (21) | 0.31 ± 0.03 µM; (15) | 40 ± 2.1 µM; (23) | 18904 ± 1375* ms; (26) | 7907 ± 658* ms; (26) | 6.96 ± 0.03*; (21) |
Table 3
Glutamate dose-response fitted parameters.
| EC50 Two site saturation (Equation 2) KDH (top row), KDL (bottom row) | EC50 Two site saturation (Equation 3) KDH (top row), KDL (bottom row) | N | ||
|---|---|---|---|---|
| wtH (16:1 ) | 440 nM ± 57 nm 366.5 μM ± 74.4 μM | 212 nM ± 32 nM 148 μM ± 37 μM | 18 | |
| wtH (16:1 ) – normalized to 100 μm glutamate | 430 nM ± 76 nm 370 μM ± 93.3 μM | 212 nM ± 25 nM 154 μM ± 27 μM | 18 | |
| wtE (1:1 ) | 1.725 μM ± 1.541 μM 2.128 mM ± 728 μM | 812 nM ± 818 nM 778 μM ± 320 μM | 26 | |
| wtL(1:16 ) | 646 μM ± 3.716 mM 5.492 mM ± 33.48 mM | 65 μM ± 79 uM 1.426 mM ± 648 uM | 19 | |
| wtH (16:1 ) | 11.85 μM ± 154 nM 3.460 mM ± 1.233 mM | 490 nM ± 90 nM 1.127 mM ± 487 μM | 14 | |
| wtH (16:1 ) – normalized to 100 μm glutamate | 1.15 nM ± 164 nm 3.39 mM ± 1.25 mM | 481 nM ± 94 nM 1.12 mM ± 491 μM | 14 | |
| wtE (1:1 ) | 3.503 μM ± 5.162 μM 2.460 mM ± 1.081 mM | 3.792 μM ± 3.946 μM 1.208 mM ± 406 μM | 11 | |
| wtL(1:16 ) | 13.34 mM ± 4.68 nM 13.34 mM ± 2.53 nM | 1.593 mM ± 78.62 mM 6.261 mM ± 1498 mM | 11 | |
Additional files
-
Source code 1
Systematic replacement of all residues of the LBD by all other amino acids.
- https://cdn.elifesciences.org/articles/67555/elife-67555-code1-v2.zip
-
Supplementary file 1
Validated GRIN2B variants.
Description of output, functional validation and clinical pictures for reported GRIN2B variants. ATD- amino terminal domain; LBD- ligand binding domain; CTD- carboxy terminal domain; GoF and LoF- gain and loss-of-function, respectively.
- https://cdn.elifesciences.org/articles/67555/elife-67555-supp1-v2.docx
-
Supplementary file 2
Published and unpublished GRIN2B variants.
>500 published and unpublished variants found in GRIN2B patients. Search was performed in PubMed, ClinVar and CFERV databases.
- https://cdn.elifesciences.org/articles/67555/elife-67555-supp2-v2.xlsx
-
Supplementary file 3
ΔΔG estimation for 5282 substitutions in LBD reveals that glycine and serine are vulnerable residues in GluN2B.
a. ΔΔG values for 5282 substitutions in the S1/S2 segments (positions 403–539, 651–802) of GluN2B. Stabilizing mutations are represented by ΔΔG>0 (blue box), whereas destabilizing (ΔΔG< −0.5) are marked by red box. b. Most mutations within LBD are destabilizing (~60%; red), with the smallest fraction represented by stabilizing mutations (~16%; blue). Mutations with minor or no effect are noted by white color. c. List of 18 validated LBD mutations in GluN2B and their estimated ΔΔG. Point mutations resulting in stop codons are noted as stop. d. Overlay between mutations shown in c. (dashed arrows) and mean ΔΔG; calculated for each residue by averaging all its possible substitutions for that residue. Red- destabilizing, blue-stabilizing; gray-neutral effect. e. Surface view of the LBD shows that stabilizing residues (blue, taken from d) are located on the outer surface of the LBD. f. Potential effect of all amino acids if these were substituted anywhere in the LBD. This consists of averaging the effect of each substitution across the entire LBD. Analysis highlights glycine (G) and serine (S) as the most destabilizing mutations, whereas methionine (M) as the most stabilizing.
- https://cdn.elifesciences.org/articles/67555/elife-67555-supp3-v2.pdf
-
Transparent reporting form
- https://cdn.elifesciences.org/articles/67555/elife-67555-transrepform-v2.docx
Download links
A two-part list of links to download the article, or parts of the article, in various formats.
Downloads (link to download the article as PDF)
Open citations (links to open the citations from this article in various online reference manager services)
Cite this article (links to download the citations from this article in formats compatible with various reference manager tools)
Two de novo GluN2B mutations affect multiple NMDAR-functions and instigate severe pediatric encephalopathy
eLife 10:e67555.
https://doi.org/10.7554/eLife.67555


