Traumatic injury compromises nucleocytoplasmic transport and leads to TDP-43 pathology
- Department of Pediatrics, Children's Hospital of Pittsburgh, University of Pittsburgh Medical Center, United States
- Department of Chemistry and Biochemistry, University of Arizona, United States
- Department of Pathology and Laboratory Medicine, Boston University School of Medicine, United States
- Boston VA Healthcare System, United States
- Department of Neurobiology, University of Pittsburgh School of Medicine, United States
- LiveLike Lou Center for ALS Research, Brain Institute, University of Pittsburgh School of Medicine, United States
- Molecular, Cellular & Developmental Biology, University of Colorado, United States
- Physical Medicine & Rehabilitation; Safar Center for Resuscitation Research, University of Pittsburgh, United States
- Center for Neuroscience; Center for the Neural Basis of Cognition; Critical Care Medicine, University of Pittsburgh, United States
- Department of Pathology, University of Pittsburgh, United States
- Department of Human Genetics, University of Pittsburgh School of Public Health, United States
Figures
Figure 1 with 1 supplement
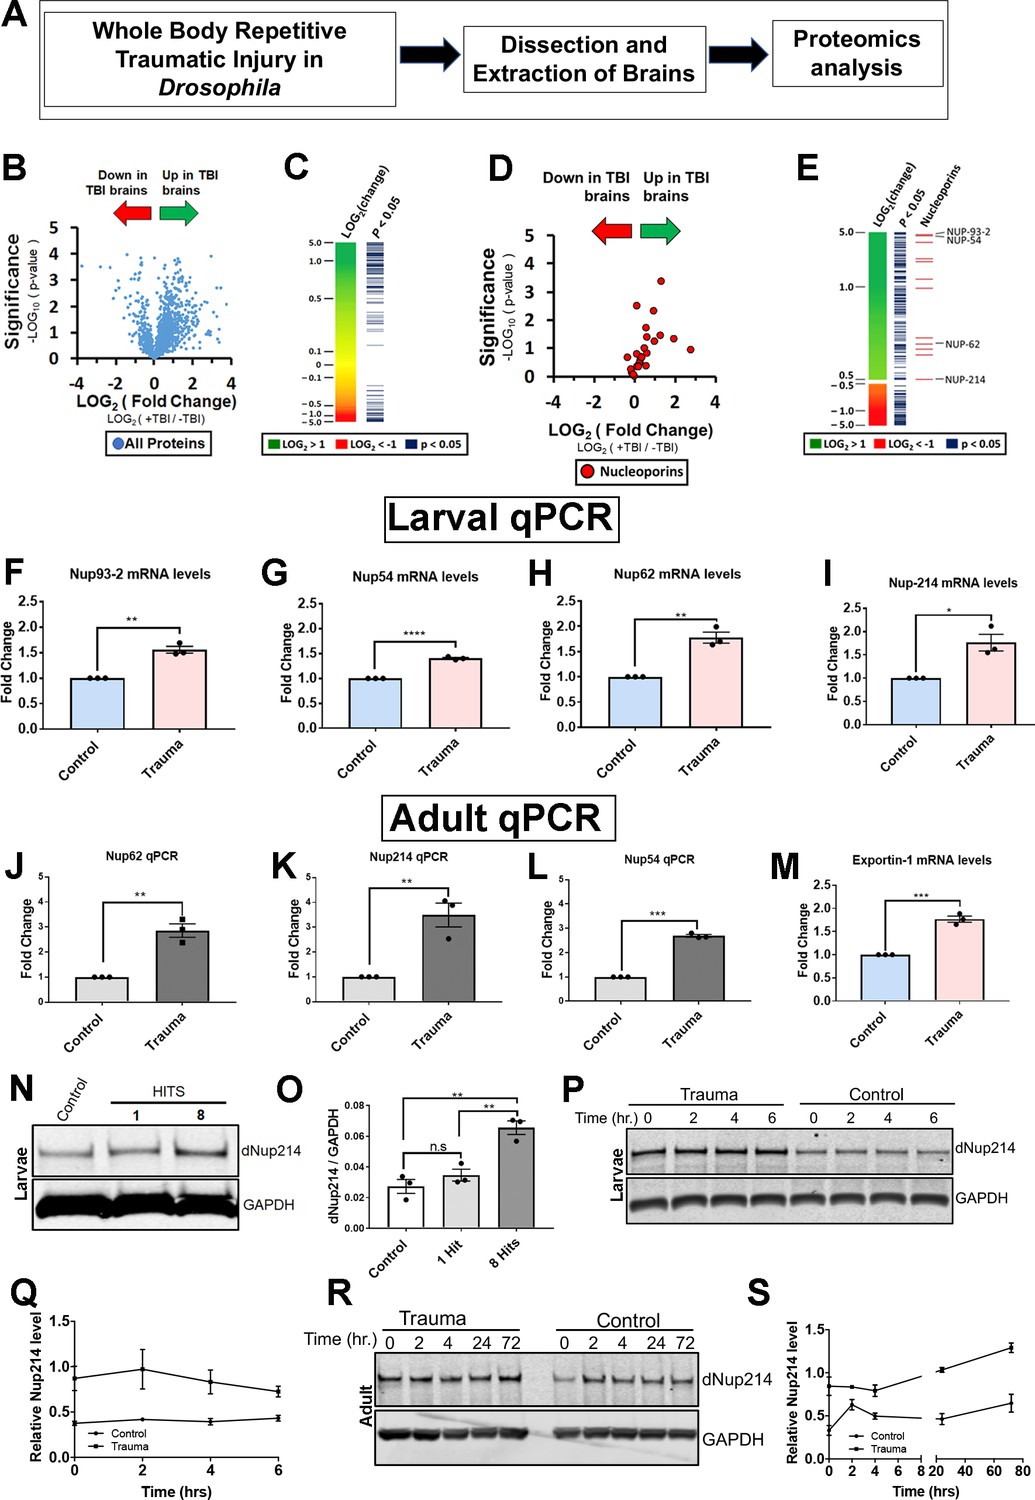
Proteomic analysis of Drosophila brains identifies novel components of the nucleocytoplasmic transport machinery that are disrupted in response to TBI.
(A) Schematic flow of Drosophila larval brain traumatic injury, dissection, and proteomics analysis. (B) Volcano plot showing fold-change and p-values for all detected proteins (student’s t-test, assuming equal variances). (C) Heat map showing change in protein expression for 2000 detected proteins. Proteins with a significant change (p < 0.05) are indicated. (D) Volcano plot showing fold change and p-values of all nucleoporins and nuclear transport proteins. Traumatic injury upregulates components of the nuclear pore and nucleocytoplasmic transport. (E) Heat map and p-values for proteins with more than ±1.4-fold change with the indicated nucleoporins. (F–I) Quantitative reverse-transcriptase polymerase chain reaction (qRT-PCR) analysis of nucleoporins identified in the proteomics analysis showed significant increases in (F) Nup93-2, (G) Nup54, (H) Nup62, and (I) Nup214 mRNA levels in w1118 Drosophila larval brains exposed to trauma (eight hits @ 50° angle) compared to control animals (n = 3, *p < 0.05, **p < 0.01, ****p < 0.0001). (J–L) qPCR analysis of Nup62 (J, **p < 0.01), Nup214 (K, **p < 0.01), and Nup54 (L, **p < 0.001) mRNA levels in adult Drosophila brains showed a significant increase in response to trauma as compared to control brains (n = 3). (M) qRT-PCR analysis of nuclear export factor Emb (exportin) mRNA post-trauma compared to non-trauma controls (n = 3, ***p < 0.001). (N) Western blot of Drosophila larval brains exposed to trauma (one or eight hits @ 50° angle) and controls (0 hits) probed for Nup214 protein. Drosophila Gapdh is shown as a loading control. (O) Quantification of western blots of Drosophila Nup214 protein levels compared to controls (n = 3, **p < 0.01, ***p < 0.001, n.s. = not significant). (P) Western blot of Nup214 protein level in larval brains at 0, 2, 4, and 6 hr post-injury or controls. (Q) Quantification of Nup214 protein levels in larval brains of trauma and control at 0, 2, 4, and 6 hr (n = 3). (R) Western blot of Nup214 protein level in adult brains at 0, 2, 4, 24, and 72 hr post-injury or controls. (S) Quantification of Nup214 level levels in adult brains of trauma and control at 0, 2, 4, 24, and 72 hr (n = 3). All qRT-PCR and western blot analysis were done in triplicate using biological replicates. One-tailed t-test was used in panels F–L and O. One-way ANOVA with Tukey’s multiple comparisons tested was used for panel N. All quantification represents mean ± s.e.m.
Figure 1—figure supplement 1

Proteomic analysis of other altered proteins in response to traumatic injury.
(A–E) Volcano plots showing fold-change and p-values of altered pathways. (F) p-Values for gene ontology (GO) association of proteins detected during mass spectrometry and using the Bonferroni corrected method. Green arrow indicates GO associations for proteins with increased abundance, while red arrow indicates GO associations for proteins with decreased abundance following trauma (p < 0.01, student’s T-test). (G) qRT- PCR analysis of Nup44A mRNA in brains exposed to traumatic brain injury (Trauma) and non- TBI controls (n = 3, *p < 0.05). (H) qRT-PCR analysis of the microtubule binding protein Futsch in brains exposed to TBI and non-TBI controls (n = 3, n.s. = not significant).
Figure 2 with 2 supplements

Nuclear pore complex morphology and RanGAP1 distribution defects as well as TBPH/NPC coaggregation after traumatic injury in vivo.
(A) Immunofluorescence images of the ventral nerve cord (VNC) of trauma brain injury (Trauma) and non-TBI control w1118 Drosophila larvae stained with the nuclear pore complex (NPC) marker (Mab414, red) marker and nuclei (DAPI, blue). TBI NPCs show gaps in membranes (arrows) with signs of aggregation (arrow heads). Scale bar = 15 µM. (B) Quantification of percentage of VNC cells with abnormal (Gaps and aggregation) Mab414 staining after TBI compared to non-TBI controls (n = 7–9 larval VNCs, ***p < 0.001). (C) Representative images of larval VNCs in TBI and control brains stained for the Drosophila homolog of TDP-43, TAR DNA-binding protein-43 homolog (Tbph, red), and Mab414 (green), showing perinuclear as well as cytoplasmic coaggregation (arrows, yellow). Scale bar = 20 µM. (D) Percentage of cells with Tbph/Mab414 coaggregation in the VNCs of TBI and control brains (n = 8 larval VNCs, ***p< 0.001). (E) Immunofluorescence of RanGAP1 (gray) and Lamin (red) in TBI and control VNCs shows aberrant RanGAP1 staining in TBI brains (intense nuclear and cytoplasmic staining, arrows). Scale bar = 15 µM. (F) Percentage of cells with abnormal RanGAP1 staining in TBI VNCs compared to controls (n = 6 larval VNCs, ***p < 0.001). (G) Schematic of control cortical impact (CCI) model of TBI (adopted from Xiong et al., 2013). (H) Immunohistochemical staining of RanGAP1 in rat hippocampal region (granule cell layer and subgranular zone) underlying the cortex in TBI animals or controls shows intense nuclear staining (arrow heads) and cytoplasmic aggregation (arrows). Inset box shows ×40 magnification (scale bar = 50 µM). (I) Percentage of cells with RanGAP1 pathology (cytoplasmic/nuclear aggregate or intense nuclear/cytoplasmic mislocalization) in TBI brains and controls (n = 4, **p < 0. 01). (J) Immunohistochemical staining of Nup62 in rat hippocampal regions shows intense nuclear staining (arrow heads) and cytoplasmic aggregation (arrows). Inset box shows ×40 magnification (scale bar = 50 µM). (K) Percentage of cells with Nup62 pathology (cytoplasmic/nuclear aggregate or intense nuclear/cytoplasmic mislocalization) in TBI brains and controls (n = 4, **p < 0.01). One-tailed t-tested was used in panel B, D, F, I, and K. Data represent mean ± s.e.m.
Figure 2—figure supplement 1
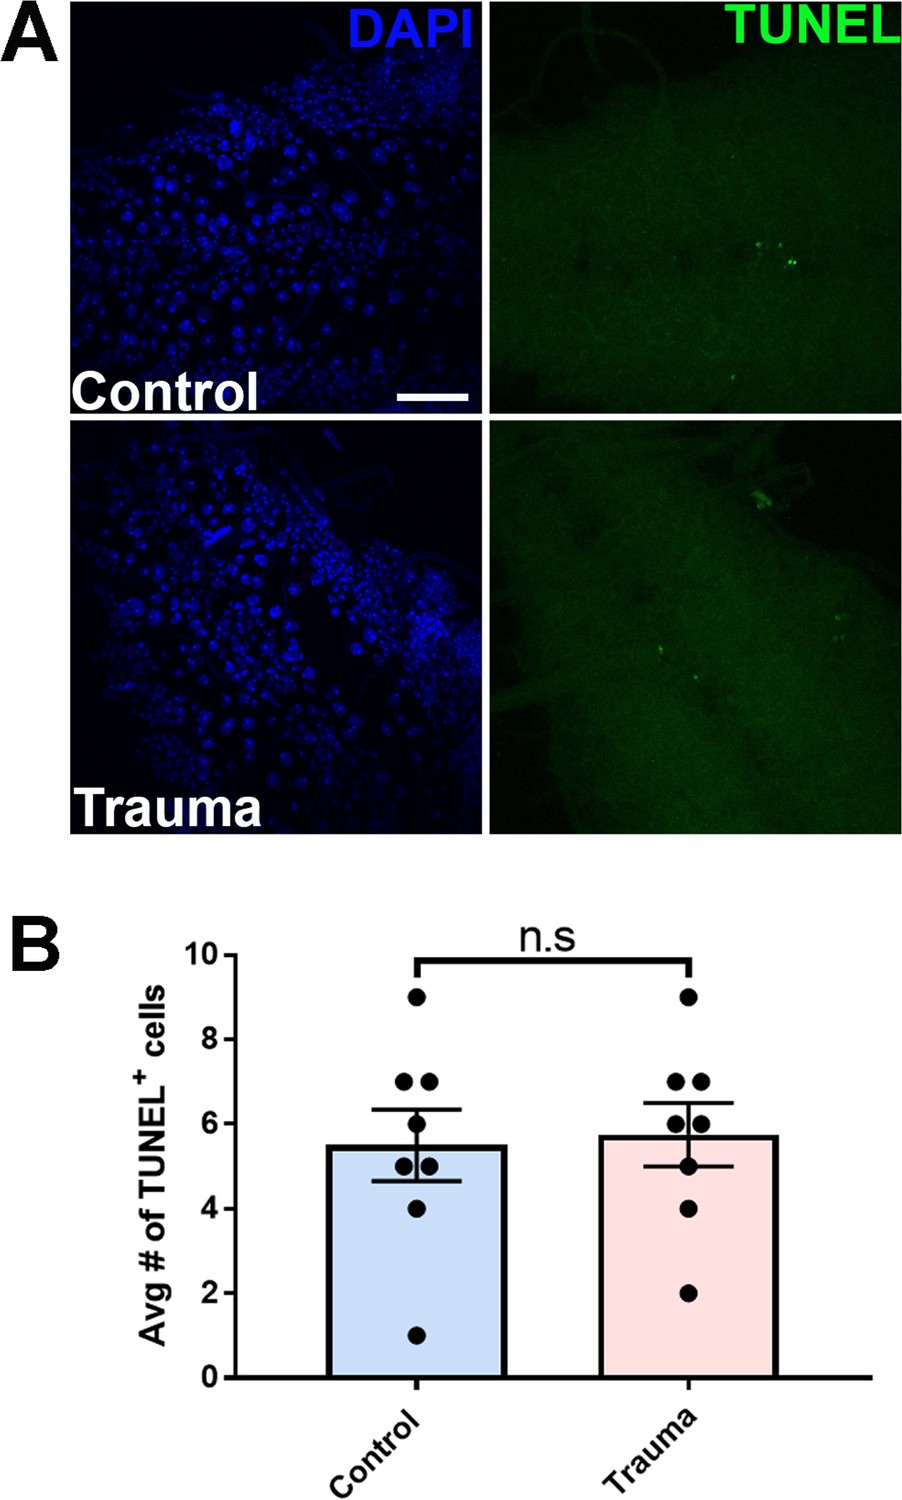
Repeated traumatic injury does not lead to cell death immediately following injury.
(A) TUNEL assay of apoptotic cells (green) in w1118 Drosophila brains with or without trauma. Scale bar = 25 µM. (B) Quantification of TUNEL-positive cells in Drosophila brains immediately after TBI compared to non-TBI controls (n = 8, n.s. = not significant). One-tailed t-tested was used in panel B. Quantification represents± s.e.m.
Figure 2—figure supplement 2
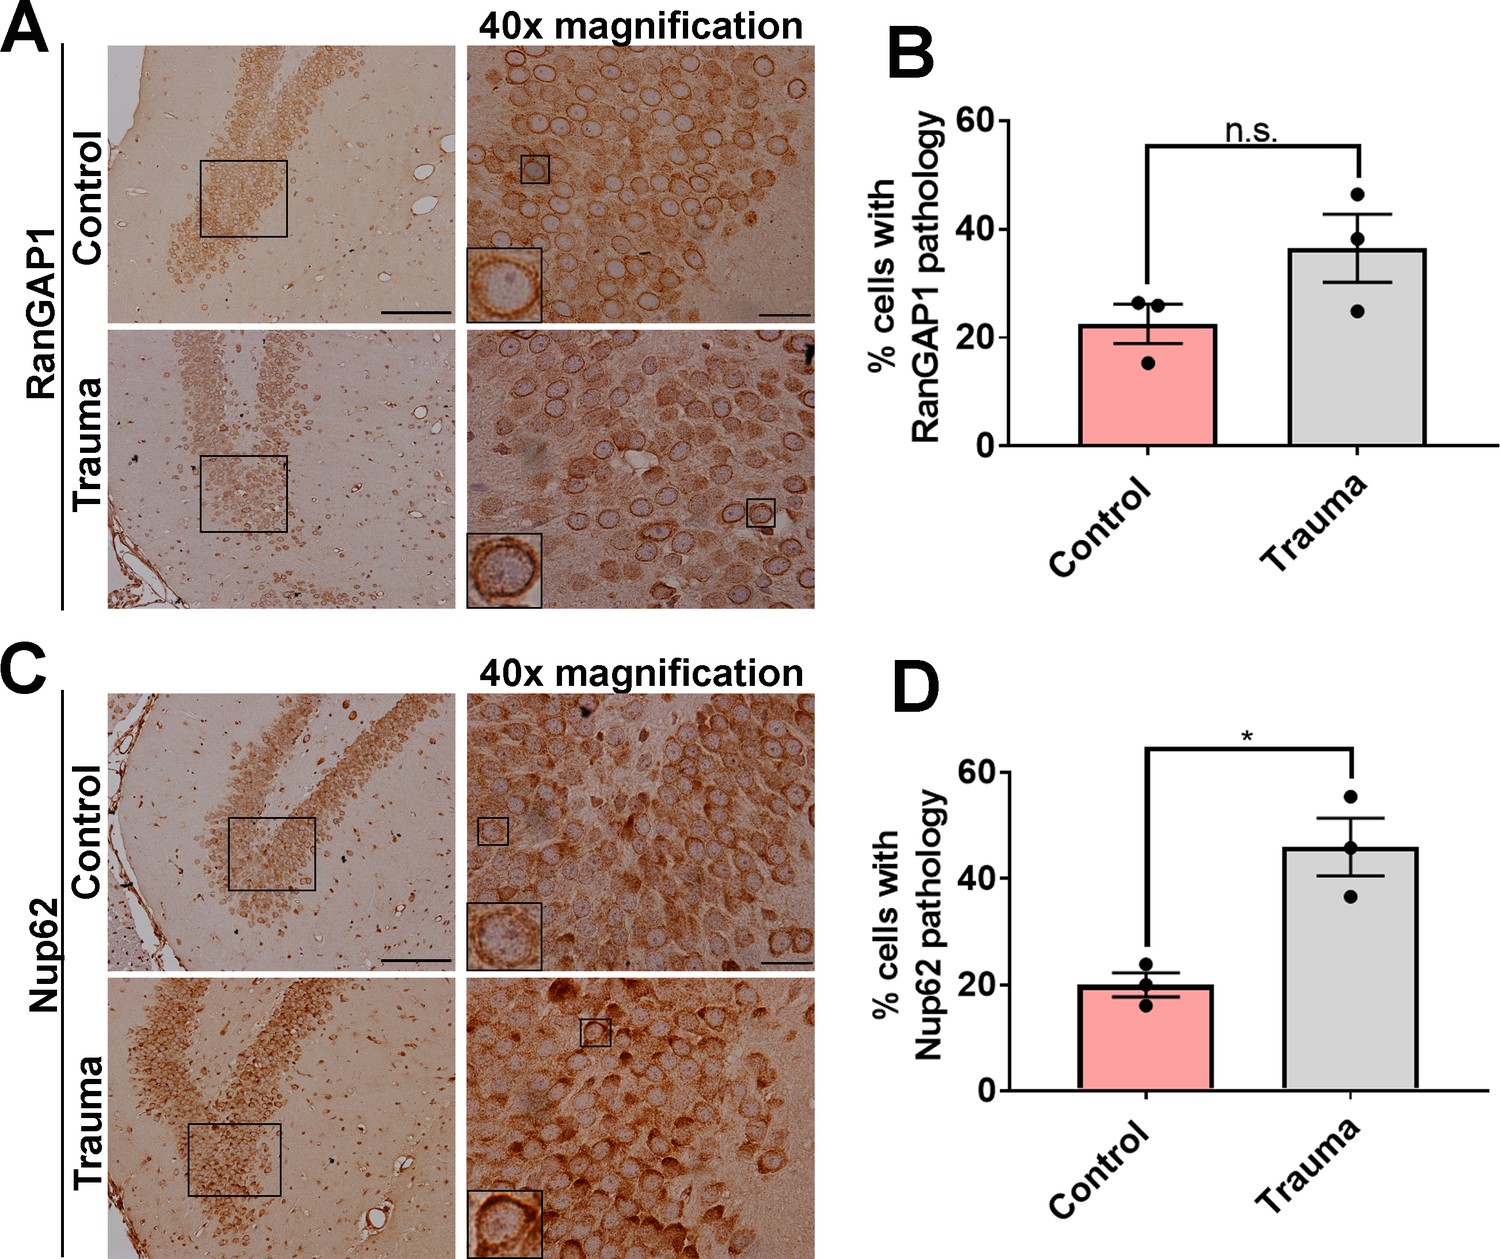
RanGAP1 and NUP62 distribution is mildly altered in the contralateral hemisphere in a CCI trauma rat model.
(A) Immunohistochemical staining of RanGAP1 in rat hippocampal region contralateral hemisphere of trauma and control (sham) animals from Figure 2G. Inset box corresponds to ×40 magnification. Scale bar = 50 µM. (B) Quantification of the percent of cells with RanGAP1 pathology (intense nuclear/cytoplasmic mislocalization) in trauma brains compared to controls (n = 3, n.s. = not significant). (C) Immunohistochemical staining of NUP62 in rat hippocampal region (contralateral hemisphere of control and trauma animals illustrated in Figure 2I) showing intense staining and aggregation. Inset box corresponds to ×40 magnification. Scale bar = 50 µM. (D) Quantification of percent of cells with NUP62 pathology (cytoplasmic/nuclear aggregation) in trauma brains cells contralateral to the site of injury compared to controls (n = 3, *p < 0.05). One-tailed t-tested was used in panels B and D. Data represent mean ± s.e.m.
Figure 3 with 1 supplement
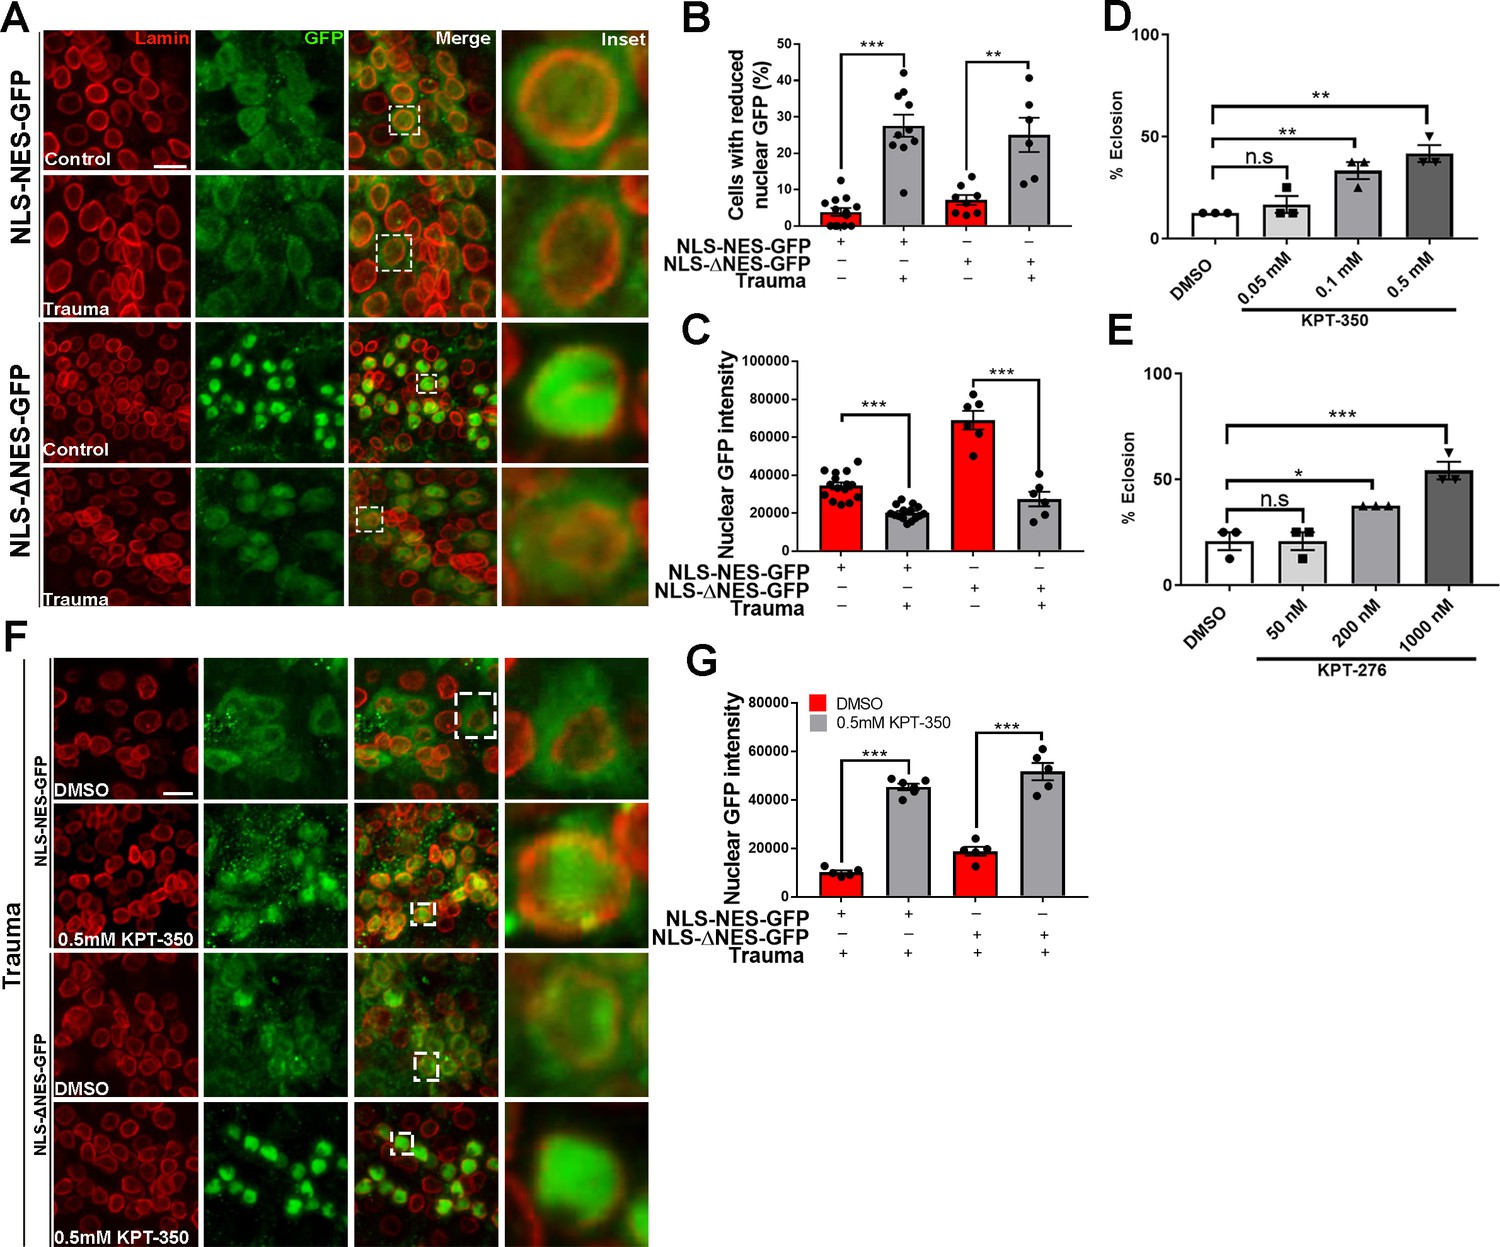
Pharmacological suppression of nuclear export rescues trauma-mediated nucleocytoplasmic transport defects and lethality in vivo.
(A) Representative immunofluorescence images of larval ventral nerve cord (VNC) cells expressing NLS-NES-GFP or NLS-ΔNES-GFP in motor neurons (OK371-gal4) exposed to traumatic brain injury (TBI) or controls (non-TBI) were co-stained for anti-GFP (green) and nuclear envelope marker Lamin (red). Scale bar = 15 µM. (B) Percentage of cells with reduced nuclear GFP signal in animals expressing NLS-NES-GFP (n = 10–11) or NLS-ΔNES-GFP GFP (n = 6–10) exposed to TBI or non-TBI controls (**p < 0.01, ***p < 0.001). (C) Quantification of nuclear GFP signal intensity in TBI and non-TBI NLS-NES-GFP (n = 15) or NLS-ΔNES-GFP (n = 6) expressing animals (***p < 0.001). (D, E) Quantification of eclosion assay of trauma Drosophila larvae treated with DMSO only compared to those treated with (D) KPT-350 (0.05, 0.1, or 0.5 mM) or (E) KPT-276 (50, 200, or 1000 nM). Treatment with KPT-350 or KPT-276 shows a dose-dependent rescue of trauma-mediated lethality (n = 3; *p < 0.05, **p < 0.01). Results indicate one-way ANOVA with Tukey’s multiple comparisons. All quantifications represent mean ± s.e.m. (n = 15 animals per experiment). (F) Representative immunofluorescence confocal images of Drosophila VNCs expressing NLS-NES-GFP or NLS-ΔNES-GFP in motor neurons exposed to TBI and fed KPT-350 (0.5 mM) or DMSO alone for 24 hr show that KPT-350 protects against trauma-mediated depletion of nuclear GFP signal. Scale bar = 15 µM. (G) Quantification of nuclear GFP signal intensity in animals expressing NLS-NES-GFP or NLS-ΔNES-GFP exposed to TBI or non-TBI controls (n = 5–6, ***p < 0.001).
Figure 3—figure supplement 1
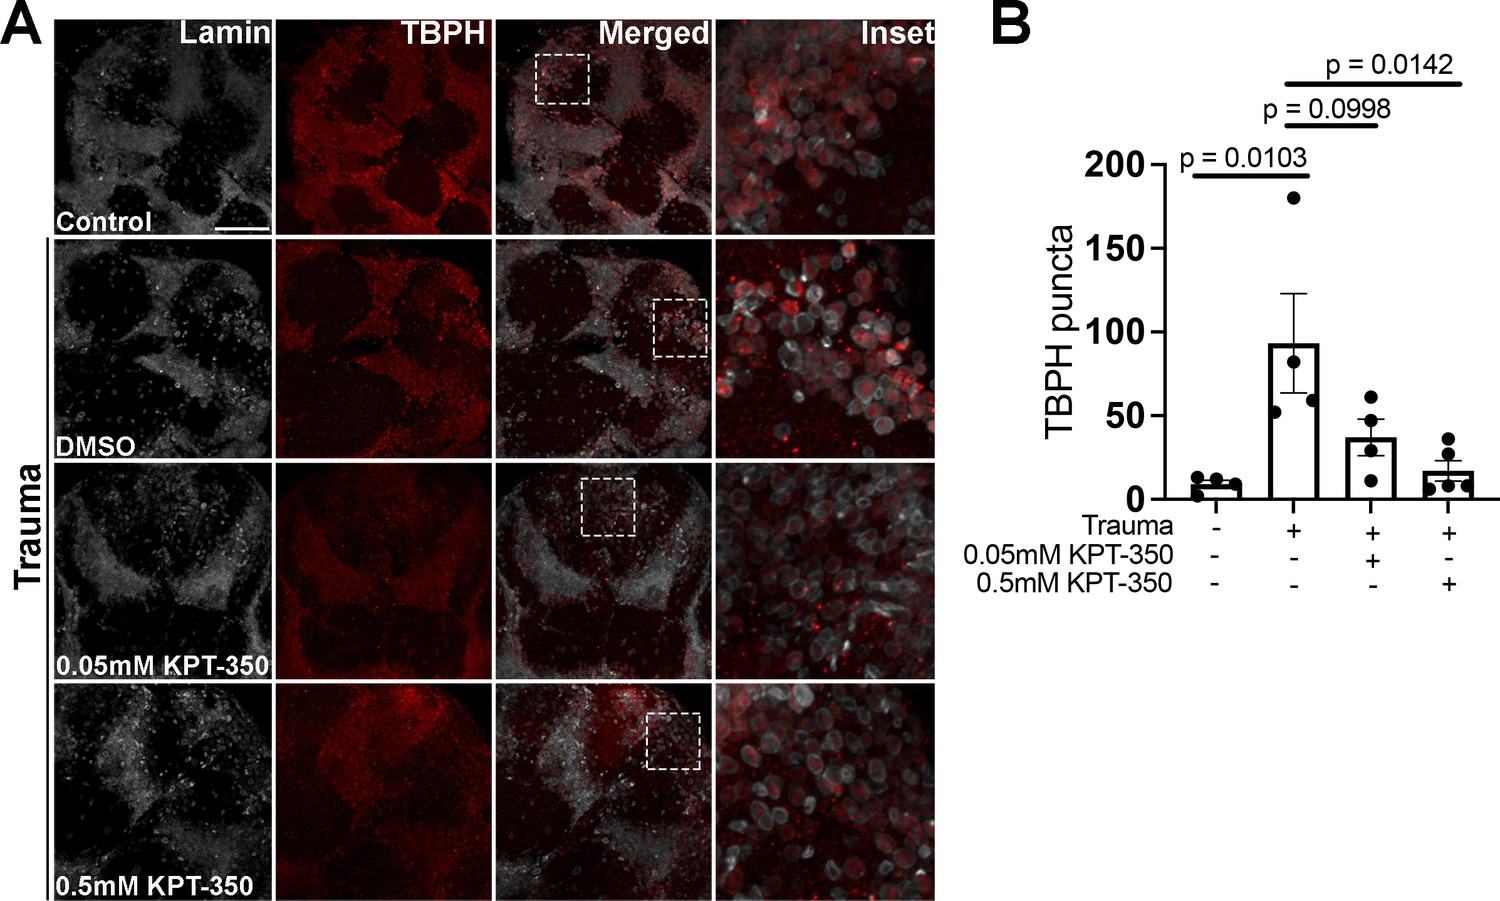
Pharmacological suppression of nuclear export rescues trauma mediated Tbph aggregation.
(A) Representative immunofluorescence images of w1118 adult Drosophila exposed to traumatic injury and treated with DMSO or KPT-350 (0.05 mM or 0.5 mM) for 10 days and untreated (no trauma control) stained with anti-Tbph (red) and Lamin (gray). Scale bar = 25 μM. (B) Quantification of Tbph puncta in the treated and untreated conditions showed significant reduction with 0.5 mM KPT-350 compared to DMSO treated animals (n = 4–5, p = 0.0142). One-way ANOVA with Tukey’s multiple comparisons tested was used for panel B.
Figure 4 with 6 supplements
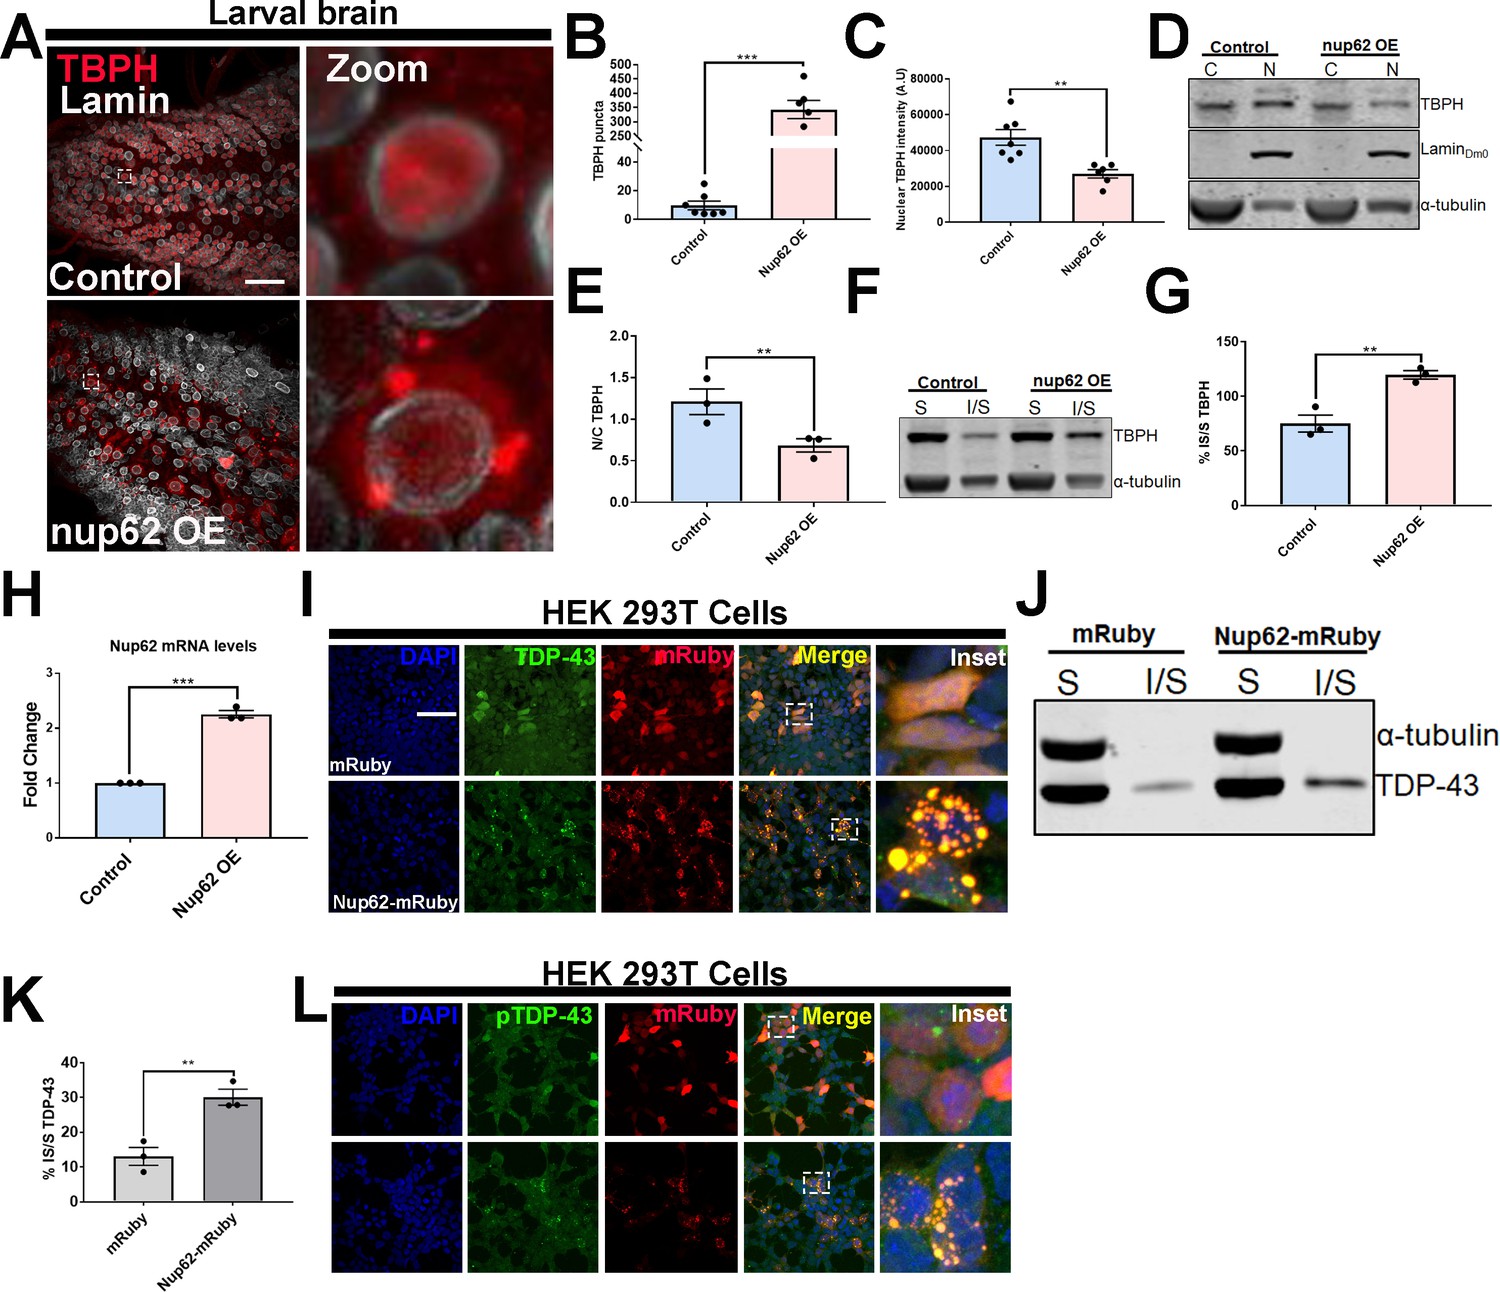
Nup62 expression promotes TDP-43 mislocalization and aggregation in vivo and in vitro.
(A) Drosophila larval brain overexpressing Nup62 (Nup62 OE) in motor neurons (Ok371-gal4) and controls (eGFP) stained for the Drosophila homolog of TDP-43, TAR DNA-binding protein-43 homolog (Tbph), and the nuclear envelope marker Lamin, showing Tbph accumulation. Scale bar = 25 µM. Zoom image represents inset box. (B) Quantification of the number of Tbph puncta in Nup62 OE flies compared to controls (n = 5–7, ***p< 0.001). (C) Nuclear Tbph intensity in Nup62 OE flies compared to controls (n = 5–7 brains, **p < 0.01). (D) Western blots of cytoplasmic (C) and nuclear (N) fractions from Drosophila expressing Nup62 OE in motor neurons and control probed for Tbph, lamin, and tubulin. (E) Nuclear-cytoplasmic (N/C) ratio quantification of Tbph in Nup62 OE and control animals (n = 3 blots, **p < 0.01). (F) Western blots of soluble (S) and insoluble (I/S) fractions Drosophila expressing Nup62 OE in motor neurons and controls probed for Tbph and tubulin. (G) Percentage of Tbph solubility in Nup62 OE and control motor neurons (n = 3 blots, **p < 0.01). (H) qRT-PCR analysis of Nup62 mRNA in Nup62 OE animals compared to controls (n = 3, ***p < 0.001). (I) Representative immunofluorescence images of human embryonic kidney 293T (HEK293T) cells transfected with mRuby alone (red) and NUP62-mRuby show endogenous TDP-43 (green) coaggregation with NUP62. NUP62-mRuby co-localizes with endogenous TDP-43 (merge, yellow). Scale bar = 25 µM. (J) Western blots of soluble and insoluble fractions from HEK293T cells transfected with mRuby alone or NUP62-mRuby probed for TDP-43 and tubulin. (K) Quantification of TDP-43 solubility in HEK293T cells transfected with mRuby alone or NUP62-mRuby (n = 3 blots, **p < 0.01). (L) Representative immunofluorescence images of HEK293T cells transfected with NUP62 show phosphorylated TDP-43 accumulation (green) that co-localizes with NUP62 (merged, yellow). Scale bar = 25 µM. qRT-PCR and western blot analysis were done in triplicate using biological replicates. One-tailed t-test was used in panel B, C, E, G, H, and K. All quantification represent mean ± s.e.m.
Figure 4—figure supplement 1
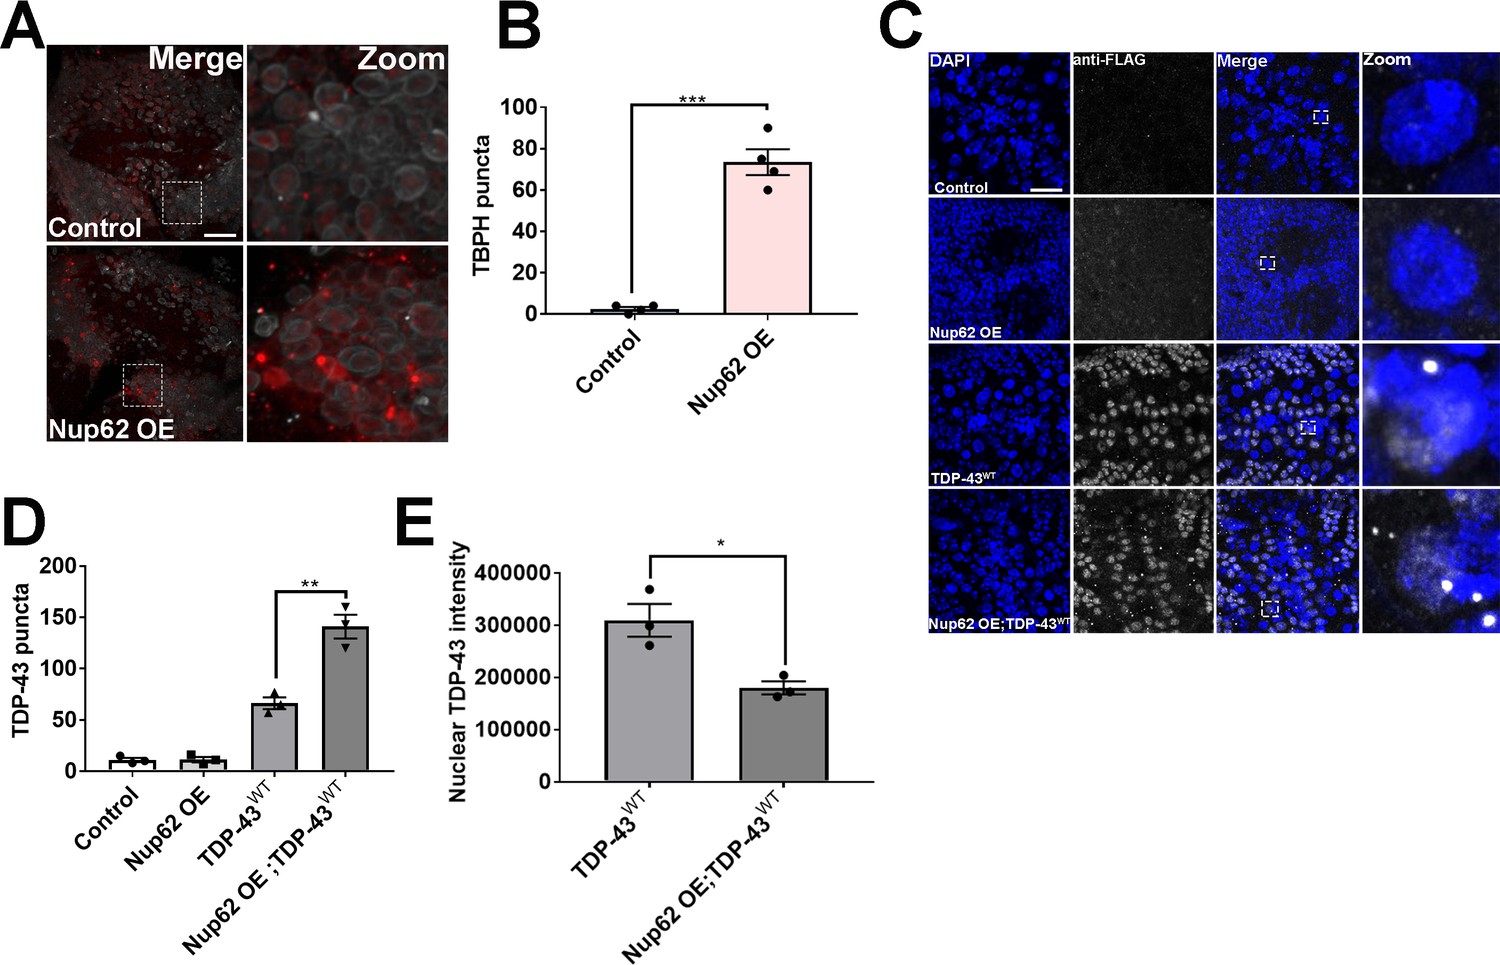
Nup62 expression modulates TBPH and TDP-43 aggregation as well as mislocalization.
(A) Representative immunofluorescence images of adult Drosophila brain overexpressing Nup62 (Nup62 OE) in motor neurons show Tbph (red) aggregation compared to eGFP controls. Lamin was used as a nuclear envelope marker. Inset box corresponds to zoom image. Scale bar = 20 µM. (B) Quantification of Tbph puncta in Nup62 OE and eGFP control brains (n = 4, ***p < 0.001). (C) Representative immunofluorescence images of CRISPR/Cas9 FLAG-tagged human wild-type TDP-43 (TDP-43WT) Drosophila larval brains overexpressing Nup62 (Nup62 OE) in motor neurons stained with anti-FLAG and DAPI. Scale bar = 20 µM. (D) Quantification of TDP-43 puncta (anti-FLAG) in control, Nup62 OE, TDP-43WT, and Nup62 OE; TDP-43WT brains (n = 3, **p < 0.01). (E) Quantification of nuclear TDP-43 (anti-FLAG) intensity in TDP-43WT and Nup62 OE; TDP-43WT brains (n = 3, *p < 0.05). One-way ANOVA with Tukey’s multiple comparisons test was used for panel D, and t-test was used for panel B and E. All quantifications represent mean ± s.e.m.
Figure 4—figure supplement 2

Expression of Nup62 but not Nup214 or Nup43 leads to NPC/TBPH coaggregation.
(A) Larval VNCs overexpressing Nup62, Nup214, or eGFP control in motor neurons stained with Tbph (red) and NPC/Mab414 (green). Tbph colocalized with NPC/Mab414 (merge) in Nup62 OE but not Nup214 animals. (B) Larval VNCs expressing HA-tagged Nup43 (Nup43 OE) or eGFP control in motor neurons stained with Tbph (red) and Anti-HA (green). Scale bar = 20 µM.
Figure 4—figure supplement 3
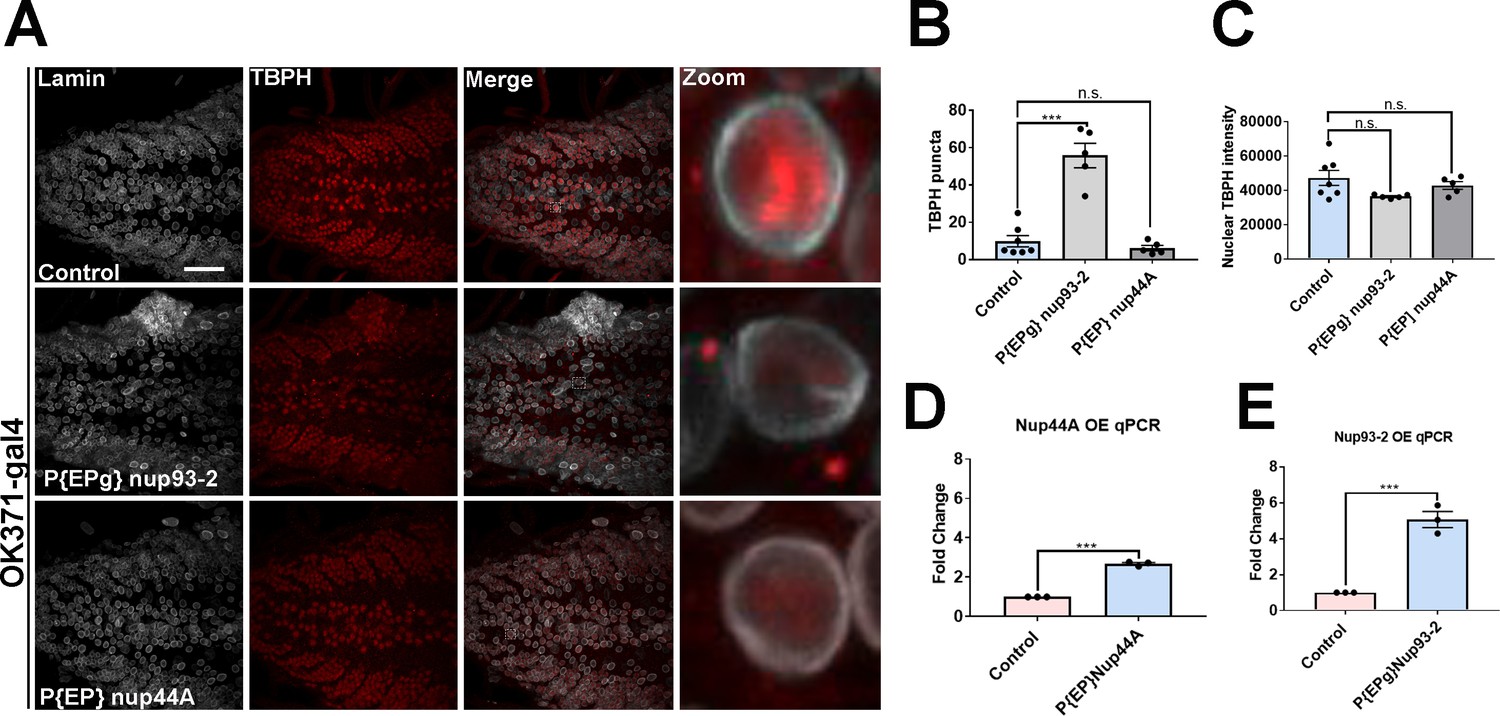
Increased Nup93-2 but not Nup44A expression partially leads to TBPH mislocalization and aggregation in vivo.
(A) Larval brains expressing Nup93-2 or Nup44A and w1118 control stained for Tbph and the nuclear envelope marker Lamin show Tbph accumulation. Scale bar = 25 µM. Inset box corresponds with zoom image. (B) Quantification of number of Tbph puncta in Nup93-2 or Nup44A overexpressing animals compared to controls (n = 5–7, ***p < 0.001, n.s. = not significant). (C) Quantification of nuclear Tbph intensity in Nup93-2 or Nup44A expressing animals compared to controls (n = 5–7, n.s. = not significant). (D) qPCR analysis of Nup44A mRNA levels in expressing animals compared to controls (***p < 0.001). (E) qPCR analysis of Nup93-2 mRNA levels in expressing animals compared to controls (***p < 0.001). One-way ANOVA with Tukey’s multiple comparisons tested was used for panels B and C; t-test was used for panels D and E. All quantifications represent mean ± s.e.m.
Figure 4—figure supplement 4
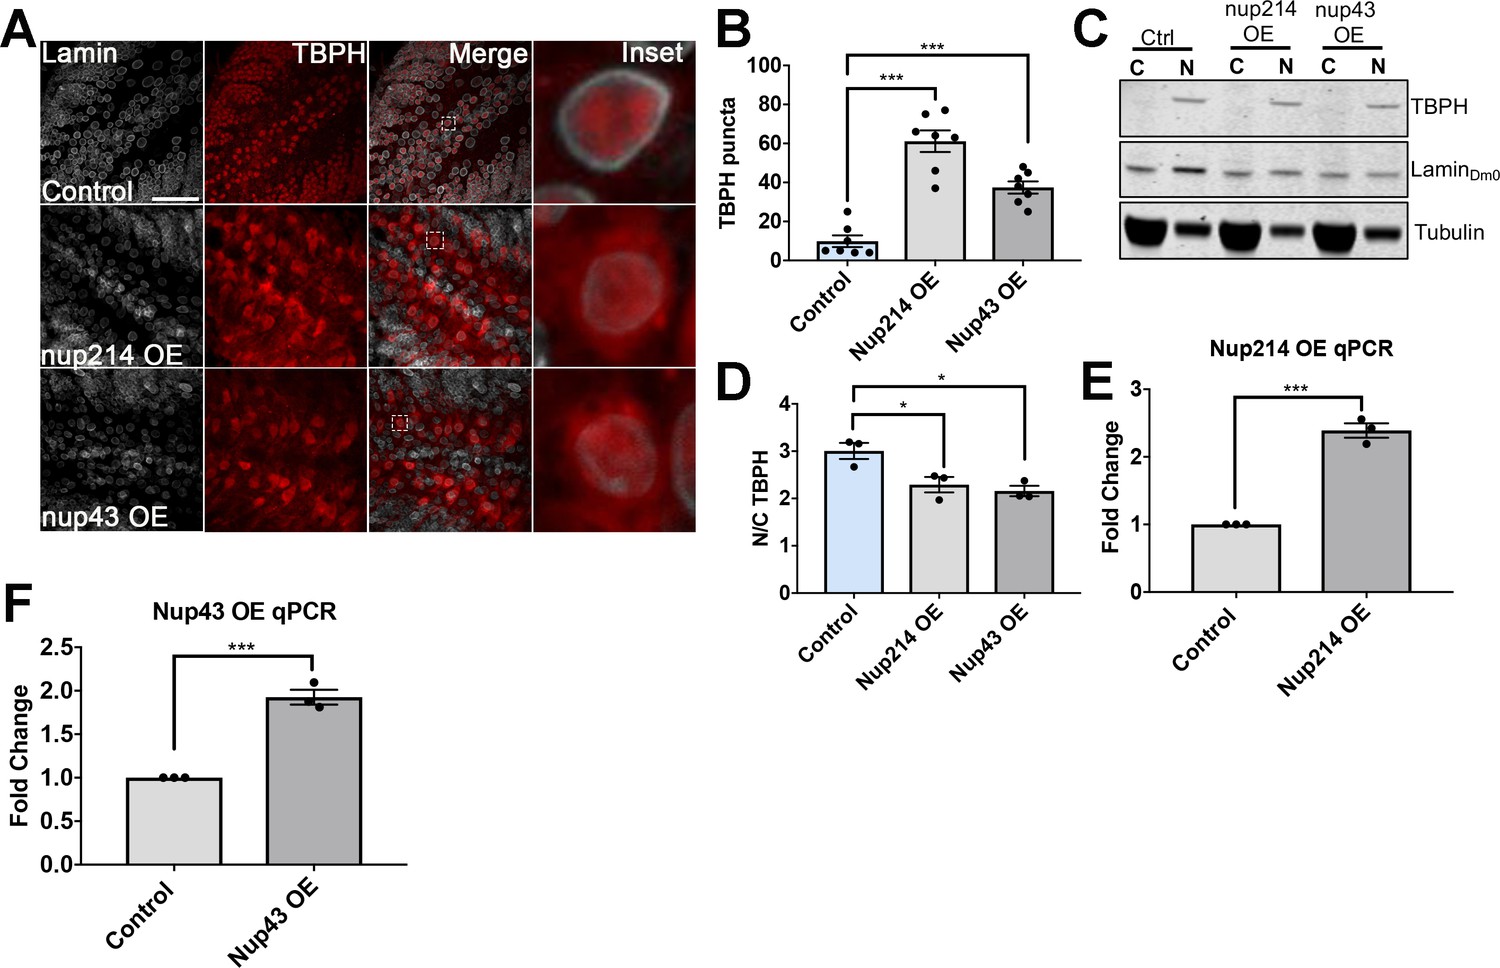
Nup214 and Nup43 expression leads TDP-43 mislocalization and aggregation.
(A) Drosophila larval brain overexpressing Nup214 (Nup214 OE), HA-tagged Nup43 (Nup43 OE), or eGFP controls (controls) in motor neurons (OK371-gal4) stained for the Tbph (red), and the nuclear envelope marker Lamin, show Tbph accumulation. Scale bar = 20 µM. (B) Quantification of the number of Tbph puncta in Nup214 OE or Nup43 OE flies compared to controls (n = 7, ***p< 0.001). (C) Western blots of cytoplasmic (C) and nuclear (N) fractions from Nup214 OE, Nup43 OE, and control motor neurons probed for Tbph, Lamin, and tubulin. (D) Nuclear-cytoplasmic (N/C) ratio quantification of Tbph in Nup214 OE, Nup43 OE and control animals (n = 3 blots, **p < 0.05). (E) qRT-PCR analysis of Nup214 mRNA in Nup214 OE animals compared to controls (n = 3, ***p < 0.001). (F) qRT-PCR analysis of Nup43 mRNA in Nup43 OE animals compared to controls (n = 3, ***p < 0.001). One-way ANOVA with Tukey’s multiple comparisons tested was used for panels B and D; t-test was used for panels E and F. All quantifications represent mean ± s.e.m.
Figure 4—figure supplement 5
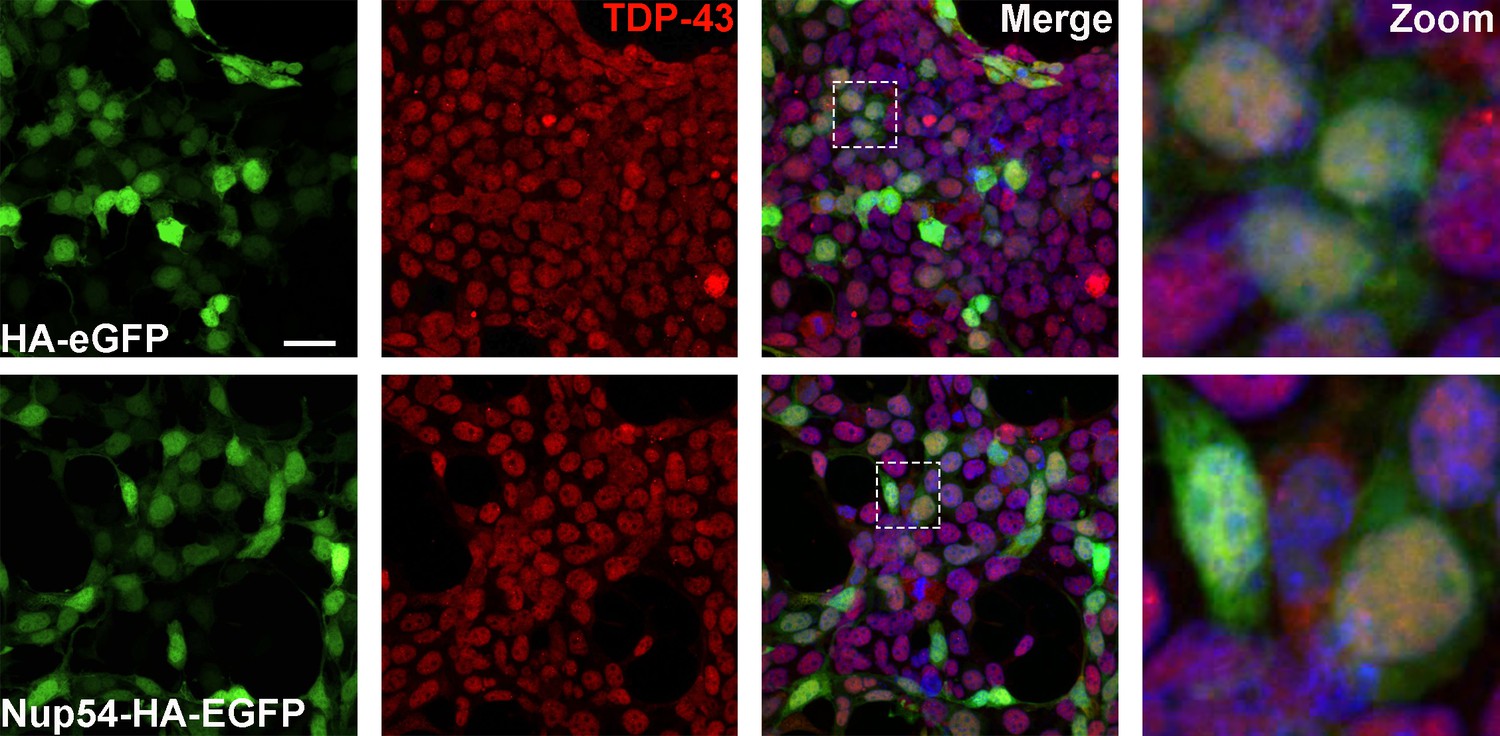
NUP54 expression does not alter TDP-43 localization.
Representative immunofluorescence images of HEK293T cells expressing HA-eGFP or NUP54-HA-EGFP and stained for endogenous TDP-43 (red). Inset box corresponds to zoom image. Scale bar = 25 µM.
Figure 4—figure supplement 6
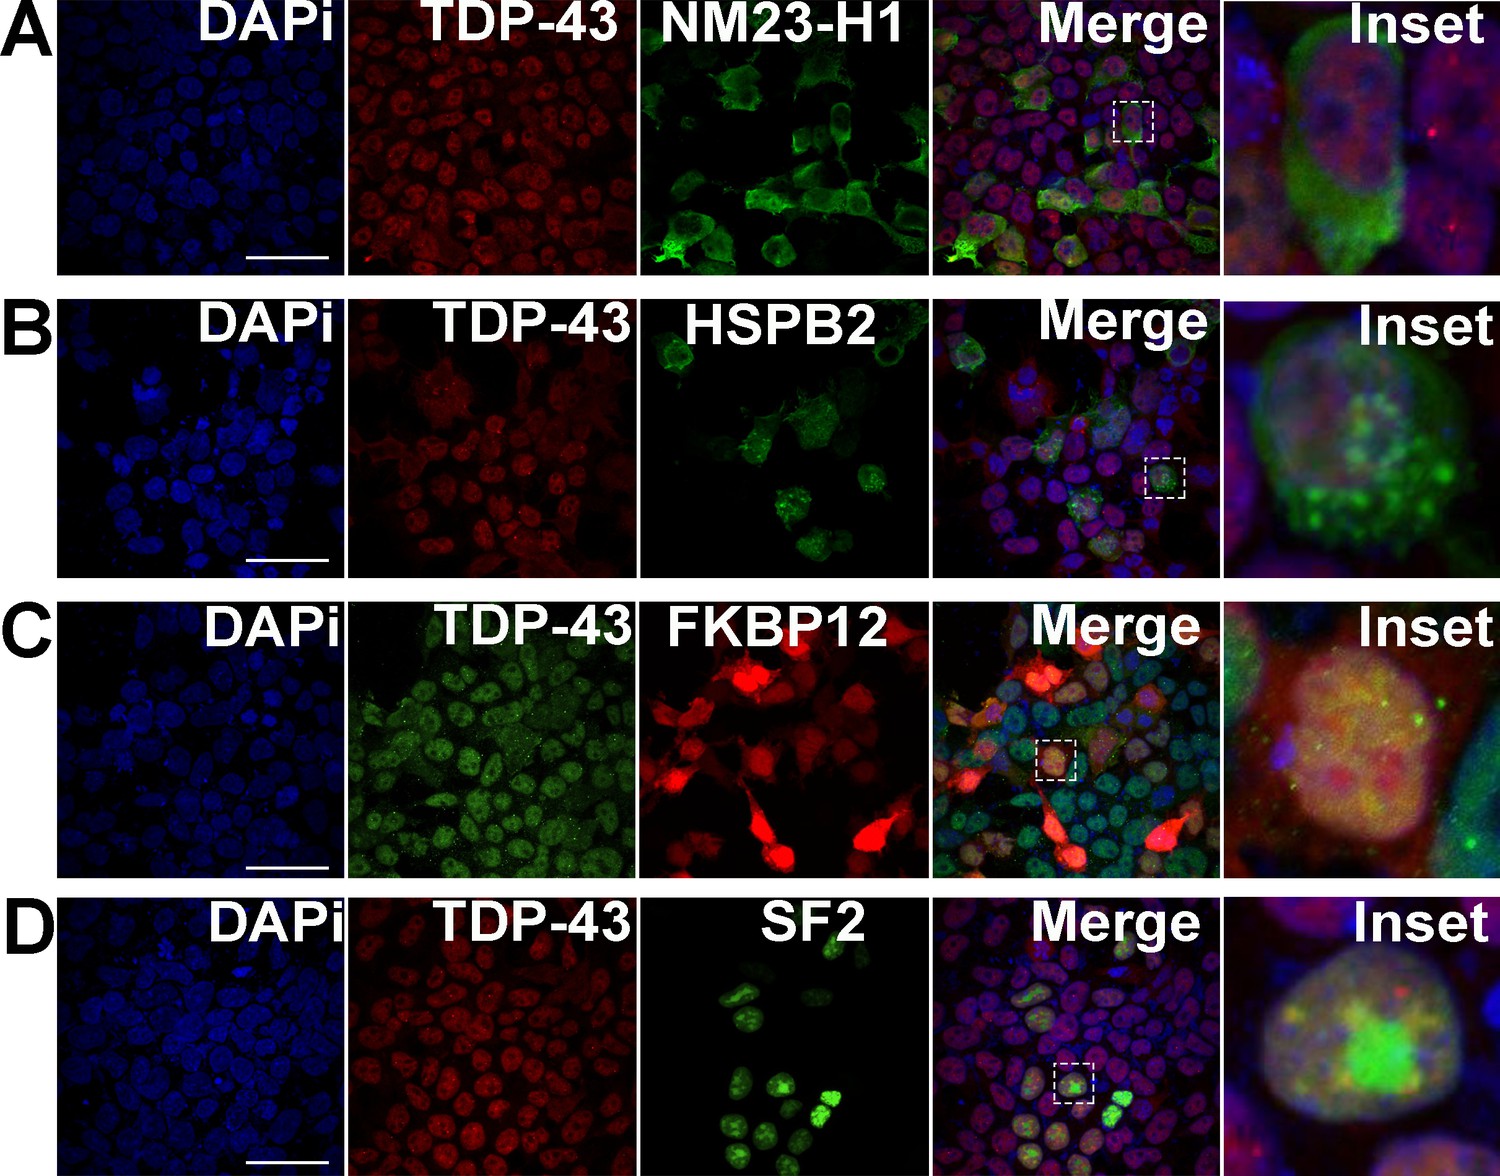
Expression of other upregulated proteins in the top five categories does not alter TDP-43 localization.
Representative immunofluorescence images of HEK293T cells expressing: (A) nucleoside diphosphate kinase 1 (NME1, green), the human homolog of Drosophila awd; (B) heat-shock protein family B (small) member 2 (HSPB2), the human homolog of Drosophila heat-shock protein 27 (HSP27); (C) peptidyl-prolyl cis-trans isomerase (FKBP1A), the human homolog of Drosophila Fkbp12; or (D) SRSF1, the human homolog of Drosophila SF2. TDP-43 (red) localization was not altered in any of these conditions. Scale bar = 15 µM.
Figure 5 with 1 supplement
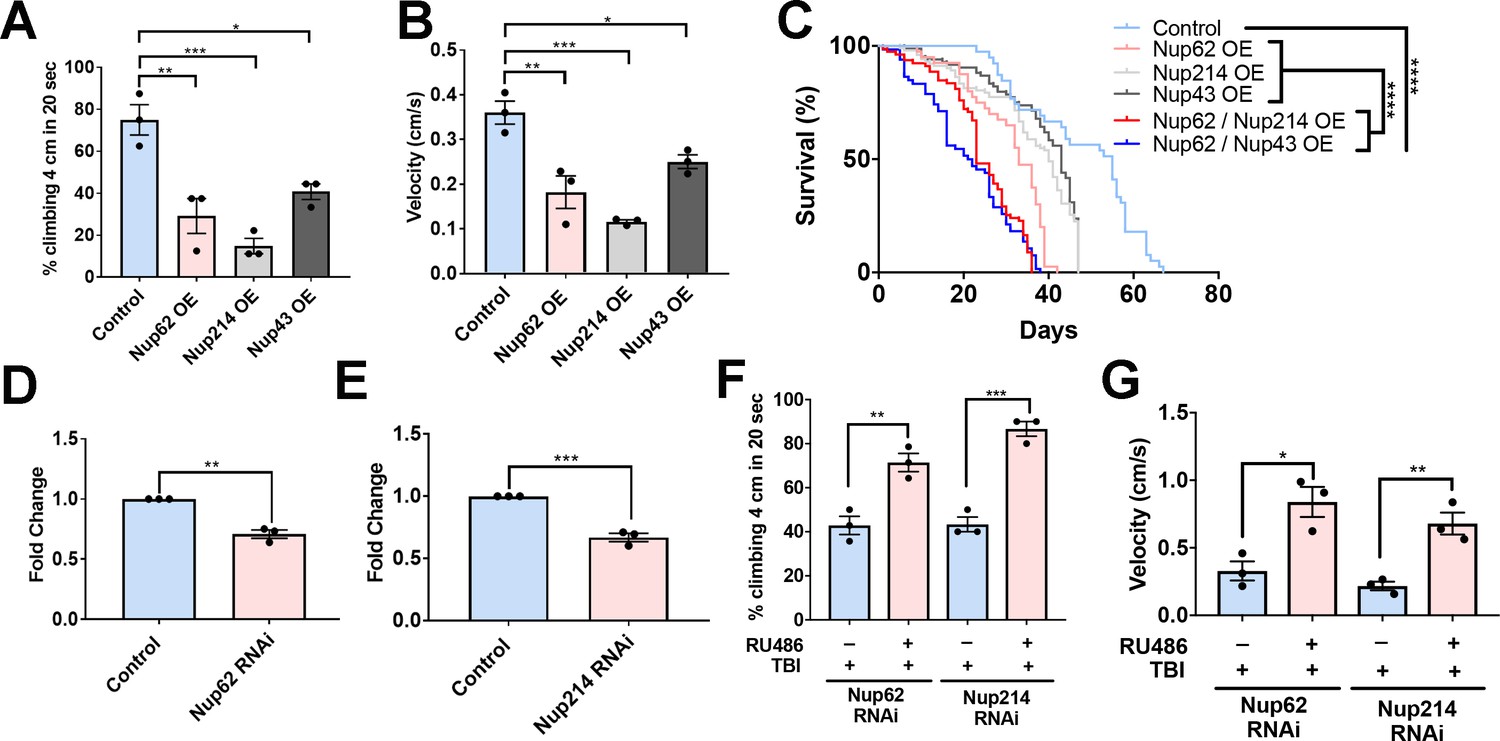
Nups expression reduces motor function and lifespan, and knockdown partially rescues trauma-mediated motor dysfunction in Drosophila.
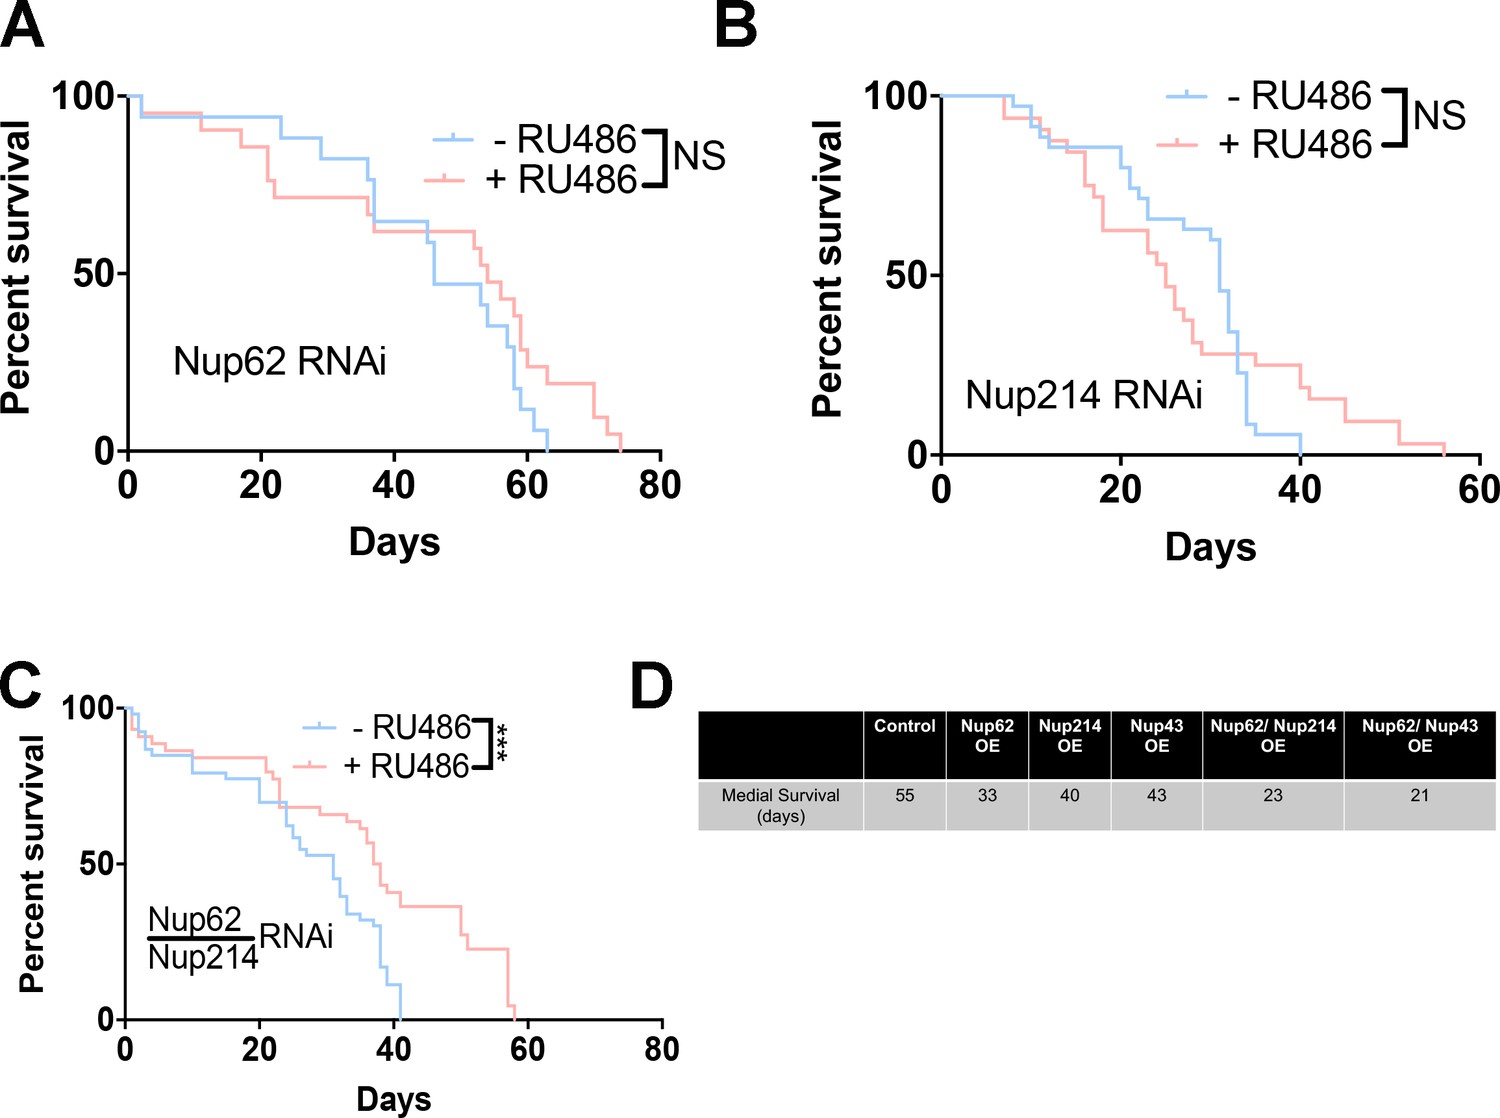
(A) Percentage of flies that climbed 4 cm in 20 seconds for Nup62, Nup214, and Nup43-overexpressing (Nup62 OE, Nup214 OE and Nup43 OE) animals compared to eGFP control (n = 3 trials, 10 animals per trials; ***p < 0.001, *p < 0.01, *p < 0.05). (B) Quantification of climbing velocity (cm/s) of Nup62 OE, Nup214 OE, and Nup43 OE flies compared to eGFP controls (n = 3 trials, 10 animals per trials, ***p < 0.001, **p < 0.01, *p < 0.05). (C) Kaplan-Meier survival curve of flies expressing Nup62 OE, Nup214 OE, Nup43 OE, Nup62/Nup214 OE, Nup62/Nup43 OE or eGFP control in motor neurons. (n = 60–80, ****p < 0.0001). (D, E) qPCR analysis of Nup62 and Nup214 mRNA levels in flies expressing Nup62 RNAi, Nup214 RNAi or eGFP controls (n = 3, **p < 0.01, ***p < 0.001). (F, G) Adult Drosophila expressing Nup62 RNAi or Nup214 RNAi in neuronal cells exposed to repeated traumatic brain injury (TBI) were raised on RU486 (+ RU486) or ethanol (-RU486) treated food for 20 days before motor assays. Quantification of (F) percentage of flies that climbed 4 cm in 20 s (n = 3 trials, **p < 0.01, ***p < 0.001) and (G) climbing velocity (cm/s) (n = 3 trials, *p < 0.05, **p < 0.01). Log-rank with Grehan-Breslow-Wilcoxon tests were performed to determine significance for panel C, while one-tailed t-tested was used in panel D, E, F, and G. All quantifications represent mean ± s.e.m.
Figure 5—figure supplement 1
Knockdown of Nup62/Nup214 together extends lifespan.
(A, B) Kaplan-Meier survival curve of Nup62 RNAi (A) or Nup214 RNAi (B) exposed to repeated traumatic brain injury (TBI) were raised on RU486 (+ RU486) or ethanol (-RU486) showed no change (n = 85–90, p = NS). (C) Kaplan-Meier survival curve of Nup62 RNAi/Nup214 RNAi flies exposed to trauma were raised on RU486 (+ RU486) or ethanol (-RU486) showed that+ RU486-treated animals significantly increase survival (n = 80–90, ***p < 0.001). (D) Table showing the median survival of control Nup62 OE, Nup214 OE, Nup43 OE, Nup62/Nup214 OE, Nup62/Nup43 OE, and control animals. Log-rank with Grehan-Breslow-Wilcoxon tests were performed to determine significance for panels A-C.
Figure 6 with 1 supplement
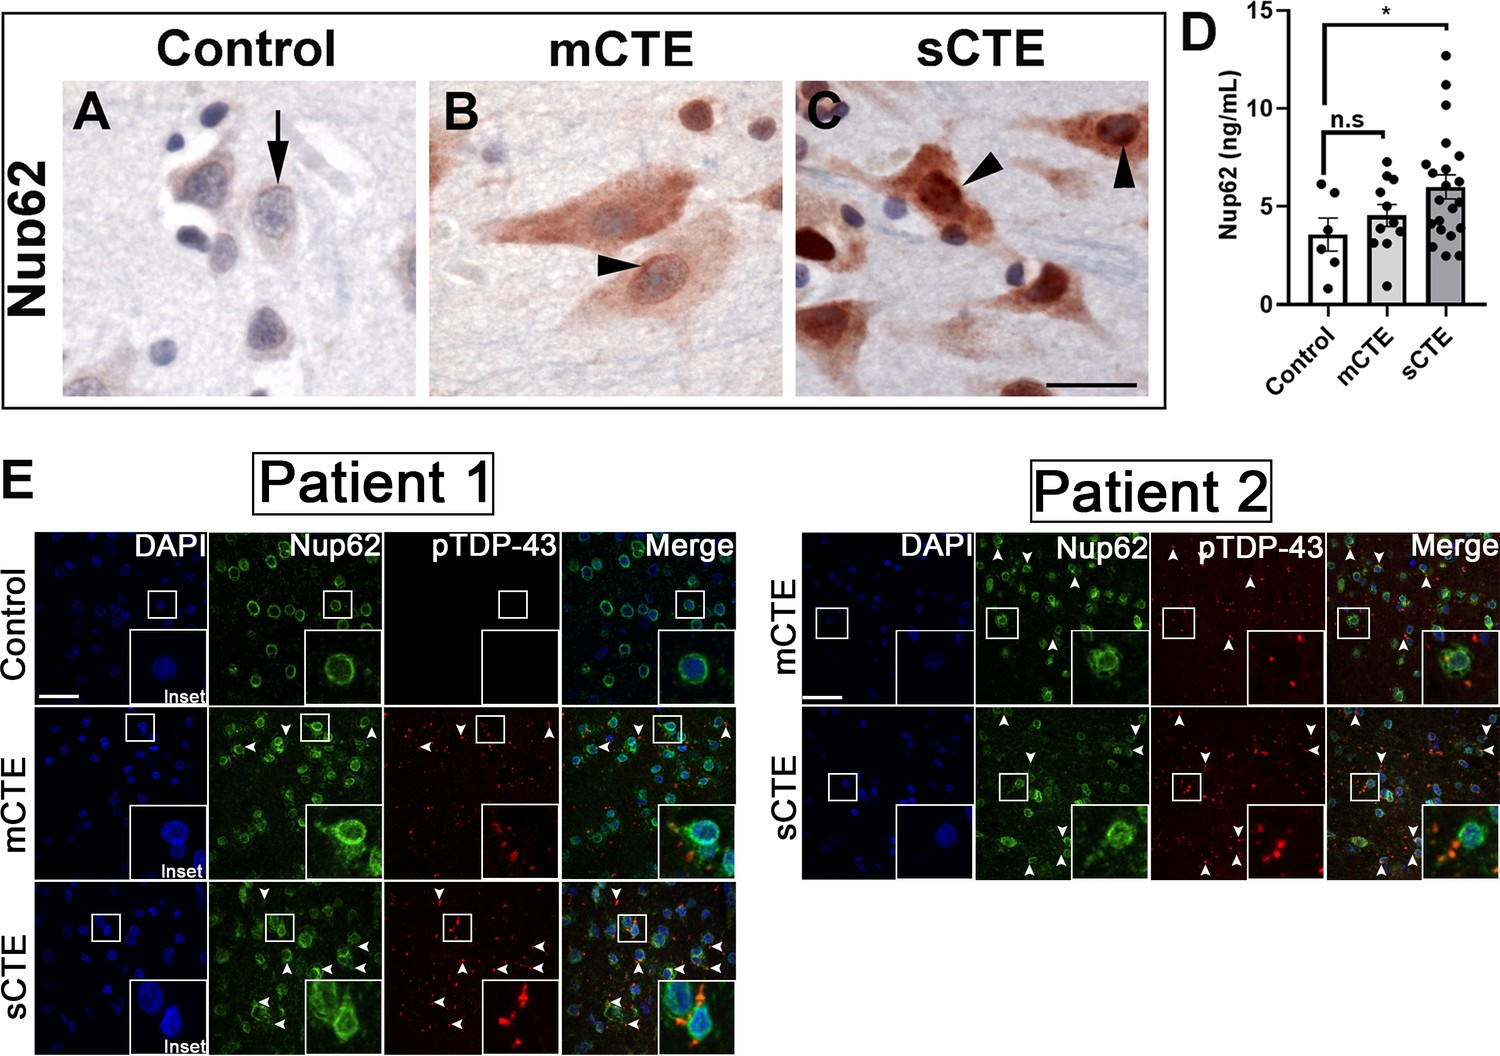
NUP62 pathology is present in brain tissue of patients with mild and severe CTE and coaggregates with pTDP-43 inclusion.
(A) NUP62 immunohistochemical staining in human frontal cortex tissue from a control individual without neurodegenerative disease, showing faint perinuclear staining for NUP62 (arrow). (B) NUP62 immunohistochemical staining in human frontal cortex tissue from a participant with mild CTE (mCTE), showing more neurons with diffuse cytoplasmic staining as well as perinuclear aggregates of NUP62 (arrowhead). (C) NUP62 immunohistochemical staining in human frontal cortex tissue from a participant with severe CTE (sCTE), showing more intense Nup62 staining in the nucleus and cytoplasm (arrowheads). Scale bar = 20 µm. (D) Quantification of enzyme-linked immunosorbent assay (ELISA) results for human NUP62 in control (n = 6), mCTE (n = 11), and sCTE (n = 21) subjects (*p < 0.05, n.s. = not significant). (E) Representative immunofluorescence images of a control, and two mCTE and sCTE cases stained for NUP62 (green) and phosphorylated TDP-43 (red) in the frontal cortex (Scale bar = 25 µm), showing pTDP-43 co-localization with NUP62 (arrows head, merge) in two patients. DAPI was used as a nuclear marker. One-way ANOVA with Tukey’s multiple comparisons tested was used for panel D. All quantification represent mean ± s.e.m.
Figure 6—figure supplement 1
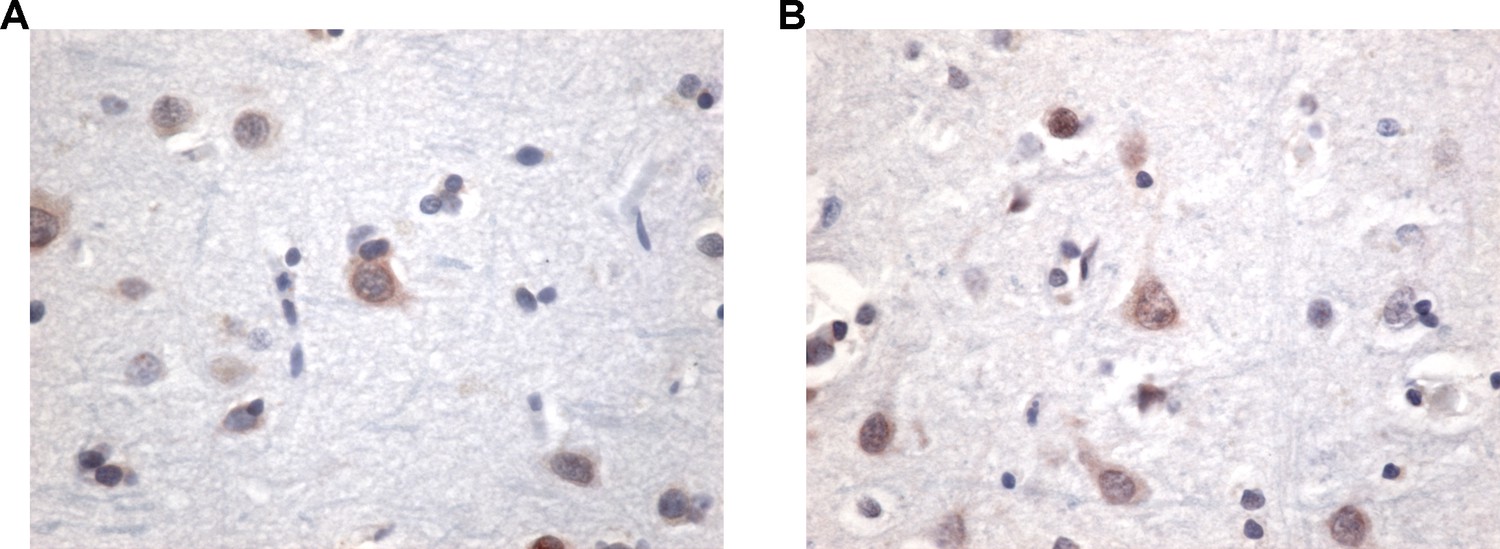
Control NUP62 immunohistochemistry cases.
(A, B) NUP62 immunohistochemical staining in human frontal cortex tissue from two control individual without neurodegenerative disease.
Tables
Key resources table
| Reagent type (species) or resource | Designation | Source or reference | Identifiers | Additional information |
|---|---|---|---|---|
| Genetic reagent (D. melanogaster) | w1118 | Bloomington Drosophila Stock Center | BDSC:3605; FLYB: FBst000360; RRID:BDSC_3605 | w[1,118] |
| Genetic reagent (D. melanogaster) | w1118; P{UAS-NLS-NES+-GFP}5A | Bloomington Drosophila Stock Center | BDSC:7032; FLYB: FBst0007032; RRID:BDSC_7032 | w[1,118]; P{w[+ mC] = UAS-NLS-NES[+]-GFP}5A |
| Genetic reagent (D. melanogaster) | y1 w*; P{UAS-NLS-NESP12-GFP}2A | Bloomington Drosophila Stock Center | BDSC:7033; FLYB: FBst0007033; RRID:BDSC_7033 | y (Amador-Ortiz et al., 2007) w[*]; P{w[+ mC] = UAS-NLS-NES[P12]-GFP}2A |
| Genetic reagent (D. melanogaster) | w1118; P{EP}Nup44AEP2417 | Bloomington Drosophila Stock Center | BDSC:17053; FLYB: FBst0017053; RRID:BDSC_17053 | w[1,118]; P{w[+ mC] = EP}Nup44A[EP2417] |
| Genetic reagent (D. melanogaster) | w1118; P{EPg}Nup93-2HP35056 | Bloomington Drosophila Stock Center | BDSC:21975; FLYB: FBst0021975; RRID:BDSC_21975 | w[1,118]; P{w[+ mC] = EPg}Nup93-2[HP35056] |
| Genetic reagent (D. melanogaster) | P{VSH330104}attP40 | Vienna Drosophila Resource Center | VDRC:v330104; FLYB: FBst0491076; RRID:FlyBase_FBst0491076 | P{VSH330104}attP40 |
| Genetic reagent (D. melanogaster) | P{KK108318}VIE-260B | Vienna Drosophila Resource Center | VDRC: v100588; FLYB: FBst0472461; RRID:FlyBase_FBst0472461 | P{KK108318}VIE-260B |
| Genetic reagent (D. melanogaster) | UAS-Nup62 | This paper | Created at BestGene | |
| Genetic reagent (D. melanogaster) | M{UAS-Nup214.ORF}ZH-86Fb | FLYORF | FLYORF: F001467; FLYB: FBst0500182; RRID:FlyBase_FBst0500182 | M{UAS-Nup214.ORF}ZH-86Fb |
| Genetic reagent (D. melanogaster) | M{UAS-Nup43.ORF.3xHA.GW}ZH-86Fb | FLYORF | FLYORF: F003133; FLYB: FBst0502466; RRID:FlyBase_FBst050246 | M{UAS-Nup43.ORF.3xHA.GW}ZH-86Fb |
| Genetic reagent (D. melanogaster) | CRISPR/Cas9 hTDP43-WT | Gift from David B. Morton Chang and Morton, 2017 | ||
| Cell line (Homo sapiens) | Human Embryonic Kidney cells (HEK 293T) | ATCC | RRID:CVCL_0063 | |
| Transfected construct (human) | mRFP-FKBP1A Plasmid | Addgene | (Cat #: 67514); RRID:Addgene_67514 | transfected construct (human) |
| Transfected construct (human) | Frt-V5-HspB2 Plasmid | Addgene | (Cat #: 63103); RRID:Addgene_63103 | transfected construct (human) |
| Transfected construct (human) | FLAG NM23-H1/NME1 Plasmid | Addgene | (Cat #: 25000); RRID:Addgene_25000 | transfected construct (human) |
| Transfected construct (human) | pEGFP SF2/SRSF1 Plasmid | Addgene | (Cat #: 17990); RRID:Addgene_17990 | transfected construct (human) |
| Transfected construct (human) | Nup54-HA-eGFP Plasmid | VectorBuilder | This paper | transfected construct (human) |
| Transfected construct (human) | HA-eGFP Plasmid | VectorBuilder | This paper | transfected construct (human) |
| Transfected construct (human) | mRuby Plasmid | Gift from Dr. Christopher Donnelly | This paper | transfected construct (human) |
| Transfected construct (human) | NUP62-mRuby Plasmid | Gift from Dr. Christopher Donnelly | This paper | transfected construct (human) |
| Antibody | anti-Nup214 (Guinea Pig polyclonal) | Gift from Dr. Christos Samakovlis Roth et al., 2003 | WB (1:5000) | |
| Antibody | Anti-Lamin Dm0 (Mouse monoclonal) | DSHB | Cat# ADL84.12; RRID:AB_528338 | IF(1:200)WB (1:1000) |
| Antibody | anti-α-Tubulin (Mouse monoclonal) | Sigma-Aldrich | Cat#: T5168; RRID:AB_477579 | WB (1:10,000) |
| Antibody | anti-Tbph (Rabbit polyclonal) | Gift from Dr. Frank Hirth Diaper et al., 2013 | IF (1:1500)WB (1:3000) | |
| Antibody | anti-FLAG (Mouse monoclonal) | Sigma-Aldrich | Cat#: F1804; RRID:AB_259529 | IF (1:1000) |
| Antibody | anti-GFP (Chicken polyclonal) | Abcam | Cat#: ab13970; RRID:AB_300798 | IF (1:1000) |
| Antibody | anti-TDP43 (Rabbit polyclonal) | Proteintech | Cat#: 10782–2-AP; RRID:AB_615042 | IF (1:1000) |
| Antibody | anti-phospho-TDP43 (Rat monoclonal) | Millipore SIGMA | Cat#: MABN14; RRID:AB_11212279 | IF (1:1000) |
| Antibody | anti-Mab414 (Mouse monoclonal) | Abcam | Cat#: ab24609; RRID:AB_448181 | IF (1:1000) |
| Antibody | anti-RanGAP1 (Rabbit polyclonal) | Millipore SIGMA | Cat#: ABN1674 | IF (1:200) |
| Antibody | anti-Nup62 (Mouse polyclonal) | BD Transduction Laboratories | Cat#: 610497; RRID:AB_397863 | IHC/IF (1:500) |
| Antibody | anti-pTDP-43 (Rabbit polyclonal) | Cosmo Bio | Cat#:NC0877946; RRID:AB_1961899 | IF (1:1000) |
| Antibody | anti-Nup62 (Mouse polyclonal) | Roche Applied Science | Cat#: 610497; RRID:AB_397863 | IHC (1:400) |
| Antibody | anti-RanGAP1 (Rabbit polyclonal) | Santa Cruz Biotechnology | Cat#: sc-28322; RRID:AB_2176987 | IHC (1:1000) |
| Sequence-based reagent | Futsch | This paper | PCR primers (5'–3'): | Forward: CAAAGCCCACTCACCTTTCReverse: CTGCTCCTGCCAACATCTProbe: AGTCTCTGGAAATGCAGCACCACT |
| Sequenced-based reagent | dNup93-2 | This paper | PCR primers (5'–3'): | Forward: ACACCGTCCGCGAAATACReverse: ACTCAACCGCCACCTTAACProbe: ATGGCCGCTGGTTTACTACGGATT |
| Sequenced-based reagent | dNup214 | This paper | PCR primers (5'–3'): | Forward: CCTAAGTGAGGACAAGGATGAGReverse: GGCATAGTCTGCAGCTTCTTProbe: TGCCTTCGACACTTCTACAACGCA |
| Sequenced-based reagent | dNup54 | This paper | PCR primers (5'–3'): | Forward: GAGTGAGCTGACAGAACTCAAGReverse: CTCGGCCAGTTTCCGTTTATProbe: CCACTGCCACAGCGAAGATACTTGA |
| Sequenced-based reagent | dNup44A | This paper | PCR primers (5'–3'): | Forward: AAGGTATCCTCCACCAATACCCReverse: TTGGGTGCAAACTCCACATCProbe: TTGTAGACTCGCGGACCAGTGTCA |
| Sequenced-based reagent | dNup62 | This paper | PCR primers (5'–3'): | Forward: CTTGCTGTTGTCTGCATCTCReverse: CAGCACCAGCTTCAGGAProbe: ACATTCTCTTTCGGAACACCGGCA |
| Sequenced-based reagent | Emb (Exportin) | This paper | PCR primers (5'–3'): | Forward: GGTCACGCGTATGTCATTCAReverse: GTTCACATTGACGCCATTCACProbe: AGCATGTCCAGATATATGCGGCCC |
| Sequenced-based reagent | dNup43 | This paper | PCR primers (5'–3'): | Forward: TTGCATCTGATCCTCCTCCACReverse: ACCGCCATGGAGTTCGTProbe: TGGACGTTAAACACGCTGAGATGACC |
| Sequenced-based reagent | dGapdh | This paper | PCR primers (5'–3'): | Forward: CAACAGTGATTCCCGACCAGReverse: TTCGTCAAGCTAATCTCGTGGProbe: CCAAAACTATCGTACAAACCCGGCG |
| Commercial assay or kit | 3,3'-diaminobenzidine (DAB) | Vector Laboratories | Cat: #SK-4100; RRID:AB_2336382 | |
| Commercial assay or kit | NE-PER nuclear-cytoplasmic extraction kit | ThermoFisher Scientific | Cat #: 78,833 | |
| Commercial assay or kit | Nup62 ELISA | LSBio | Cat #: LS-F22196 | |
| Chemical compound, drug | KPT-350 | Karyopharm | ||
| Chemical compound, drug | KPT-276 | Selleck Chem | Cat #: S7251 | |
| Software, algorithm | GraphPad Prism 6 | GraphPad Prism 6 | RRID:SCR_002798 |
Additional files
-
Supplementary file 1
Table summary of the proteomic analysis and GO association of approximately 2000 proteins identified in TBI and control (non-TBI) condition including the fold changes and statistical significance.
- https://cdn.elifesciences.org/articles/67587/elife-67587-supp1-v1.xlsx
-
Supplementary file 2
Summary of neuropathology cases (severe CTE and mild CTE) and controls.
Table reports all relevant information for the human sample used in the study including age, sex, phosphor TDP-43, dementia, sports played, number of years played, Braak stage (0–6), consortium to establish a registry for Alzheimer’s disease (CERAD) score (0–3), and CAA score (0–3).
- https://cdn.elifesciences.org/articles/67587/elife-67587-supp2-v1.xlsx
-
Supplementary file 3
GO-ID and p-Values as well as GO associations for genes whose protein levels increase or decrease > 1.6-fold.
- https://cdn.elifesciences.org/articles/67587/elife-67587-supp3-v1.xlsx
-
Transparent reporting form
- https://cdn.elifesciences.org/articles/67587/elife-67587-transrepform1-v1.docx
Download links
A two-part list of links to download the article, or parts of the article, in various formats.
Downloads (link to download the article as PDF)
Open citations (links to open the citations from this article in various online reference manager services)
Cite this article (links to download the citations from this article in formats compatible with various reference manager tools)
Traumatic injury compromises nucleocytoplasmic transport and leads to TDP-43 pathology
eLife 10:e67587.
https://doi.org/10.7554/eLife.67587


