Connectional asymmetry of the inferior parietal lobule shapes hemispheric specialization in humans, chimpanzees, and rhesus macaques
- Key Laboratory for NeuroInformation of Ministry of Education, School of Life Science and Technology, University of Electronic Science and Technology of China, China
- Brainnetome Center, Institute of Automation, Chinese Academy of Sciences, China
- National Laboratory of Pattern Recognition, Institute of Automation, Chinese Academy of Sciences, China
- University of Chinese Academy of Sciences, China
- Center for Language and Brain, Shenzhen Institute of Neuroscience, China
- Department of Anthropology and Center for the Advanced Study of Human Paleobiology, The George Washington University, United States
- State Key Laboratory of Cognitive Neuroscience and Learning & IDG/McGovern Institute for Brain Research, Beijing Normal University, China
- Beijing Key Laboratory of Brain Imaging and Connectomics, Beijing Normal University, China
- CAS Center for Excellence in Brain Science and Intelligence Technology, Institute of Automation, Chinese Academy of Sciences, China
Figures
Figure 1 with 2 supplements
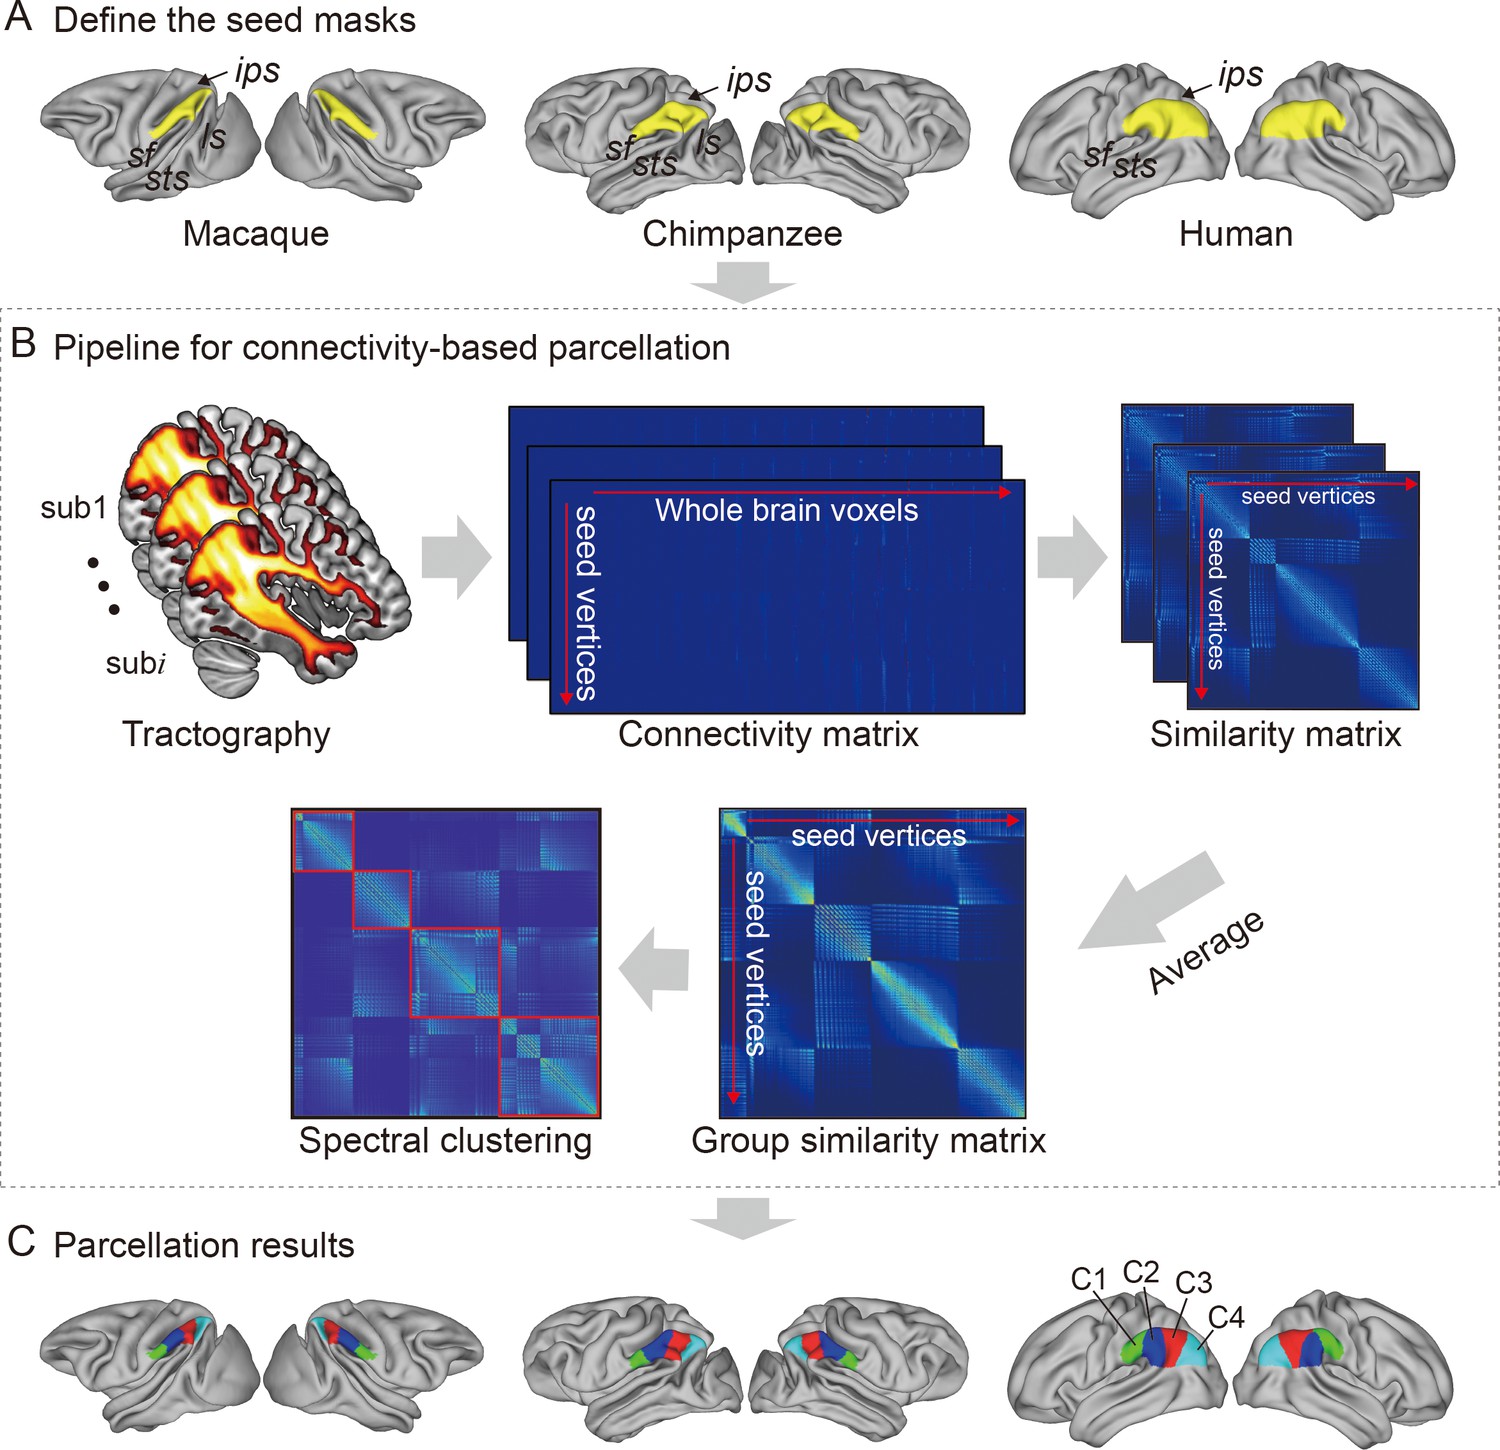
Framework of the connectivity-based brain parcellation for macaques, chimpanzees, and humans.
(A) Defining the seed masks of the inferior parietal lobule (IPL) in surface space according to the gyri and sulci. (B) Connectivity-based parcellation using anatomical connectivity. Probabilistic tractography was applied by sampling 5000 streamlines at each vertex within the seed mask. Whole-brain connectivity profiles were used to generate a connectivity matrix with each row representing the connectivity profile of each seed vertex. Next, a correlation matrix was calculated as a measure of similarity between the seed vertices. Then, a group similarity matrix was calculated by averaging the correlation matrix across subjects and spectral clustering was applied to it. (C) Parcellation results of the IPL across species. The entire framework was applied independently for each hemisphere and each species.
Figure 1—figure supplement 1
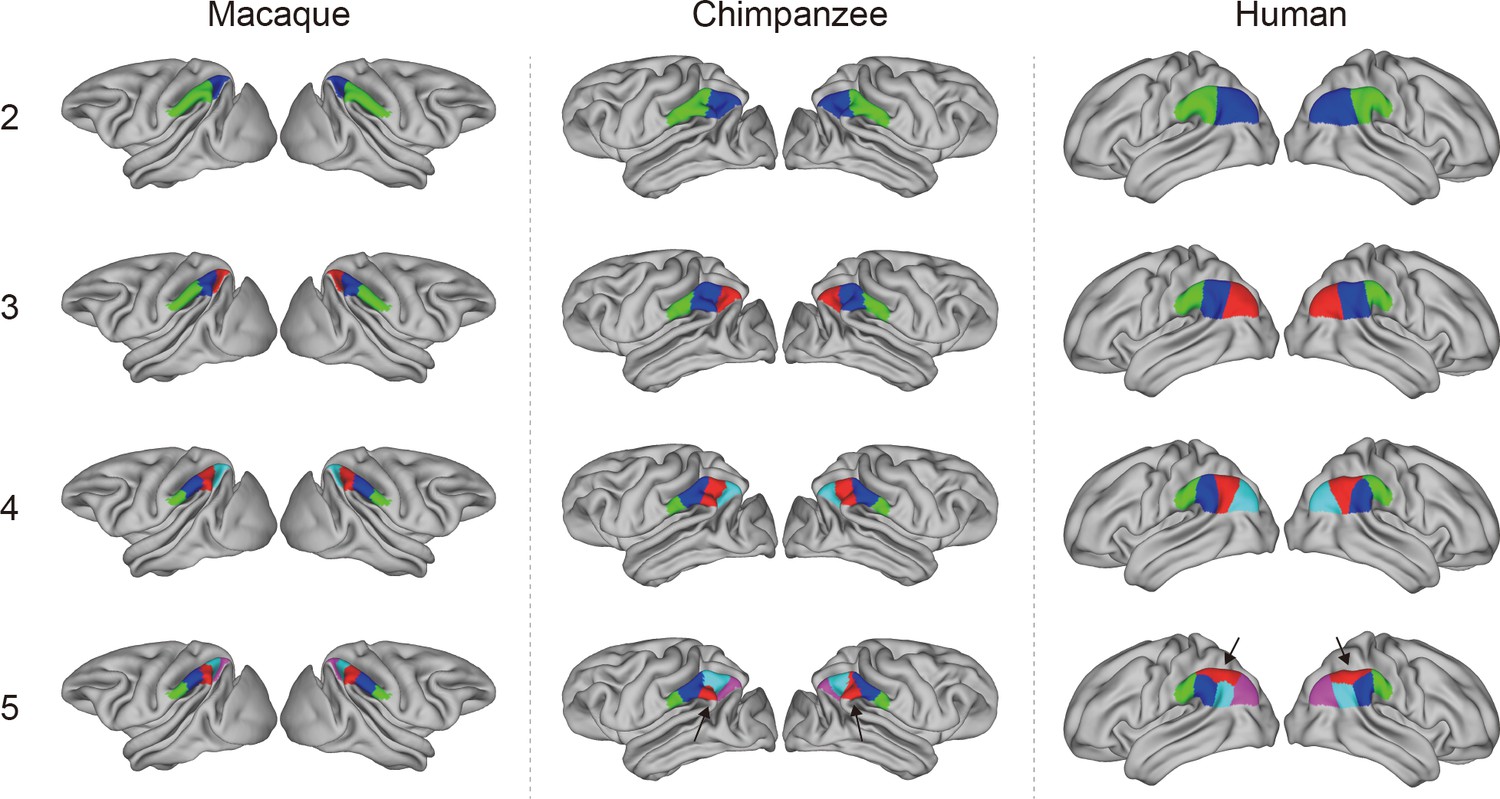
Two- to five-cluster parcellation of the IPL.
The two- to four-cluster solutions showed a consistent rostral–caudal pattern. In the five-cluster solution, a ventral cluster emerged in chimpanzees and a dorsal cluster emerged in humans.
Figure 1—figure supplement 2
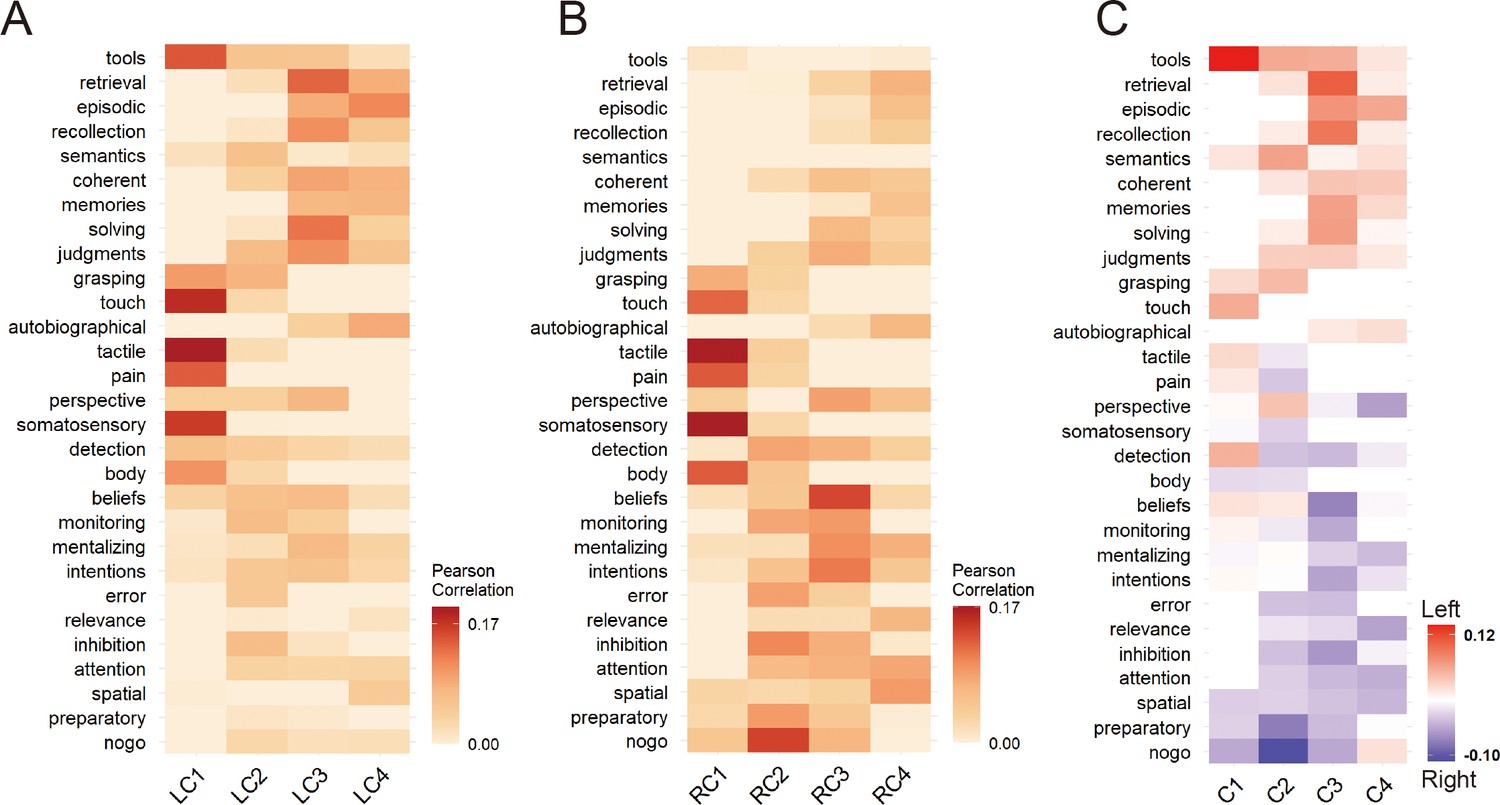
Functional decoding of the human left (A) and right (B) inferior parietal lobule (IPL) subregions.
(C) Differences between the correlation values of the left and right IPL subregions.
Figure 2
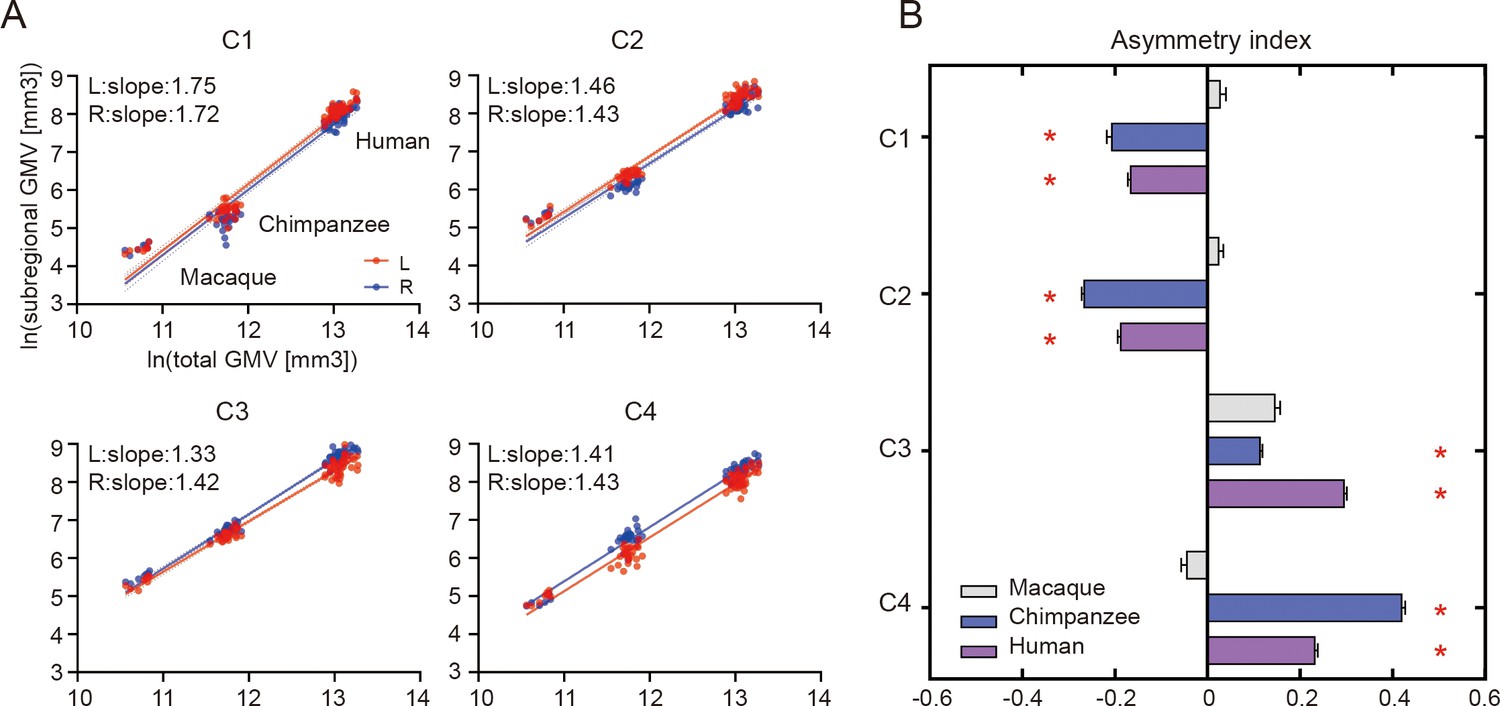
Structural allometric scaling and asymmetries of the inferior parietal lobule (IPL) subregions across species.
(A) Volumes of the IPL subregions plotted against total cortical gray matter volume (GMV). Solid lines represent the best fit using mean macaque, chimpanzee, and human data points; dotted lines represent 95% confidence intervals. (B) Volumetric asymmetries of the IPL subregions. Negative asymmetry index indicates leftward asymmetry and positive index indicates rightward asymmetry. *Significance at the Bonferroni-corrected level of p<0.05. The error bars indicate the standard error of the mean.
Figure 3 with 1 supplement
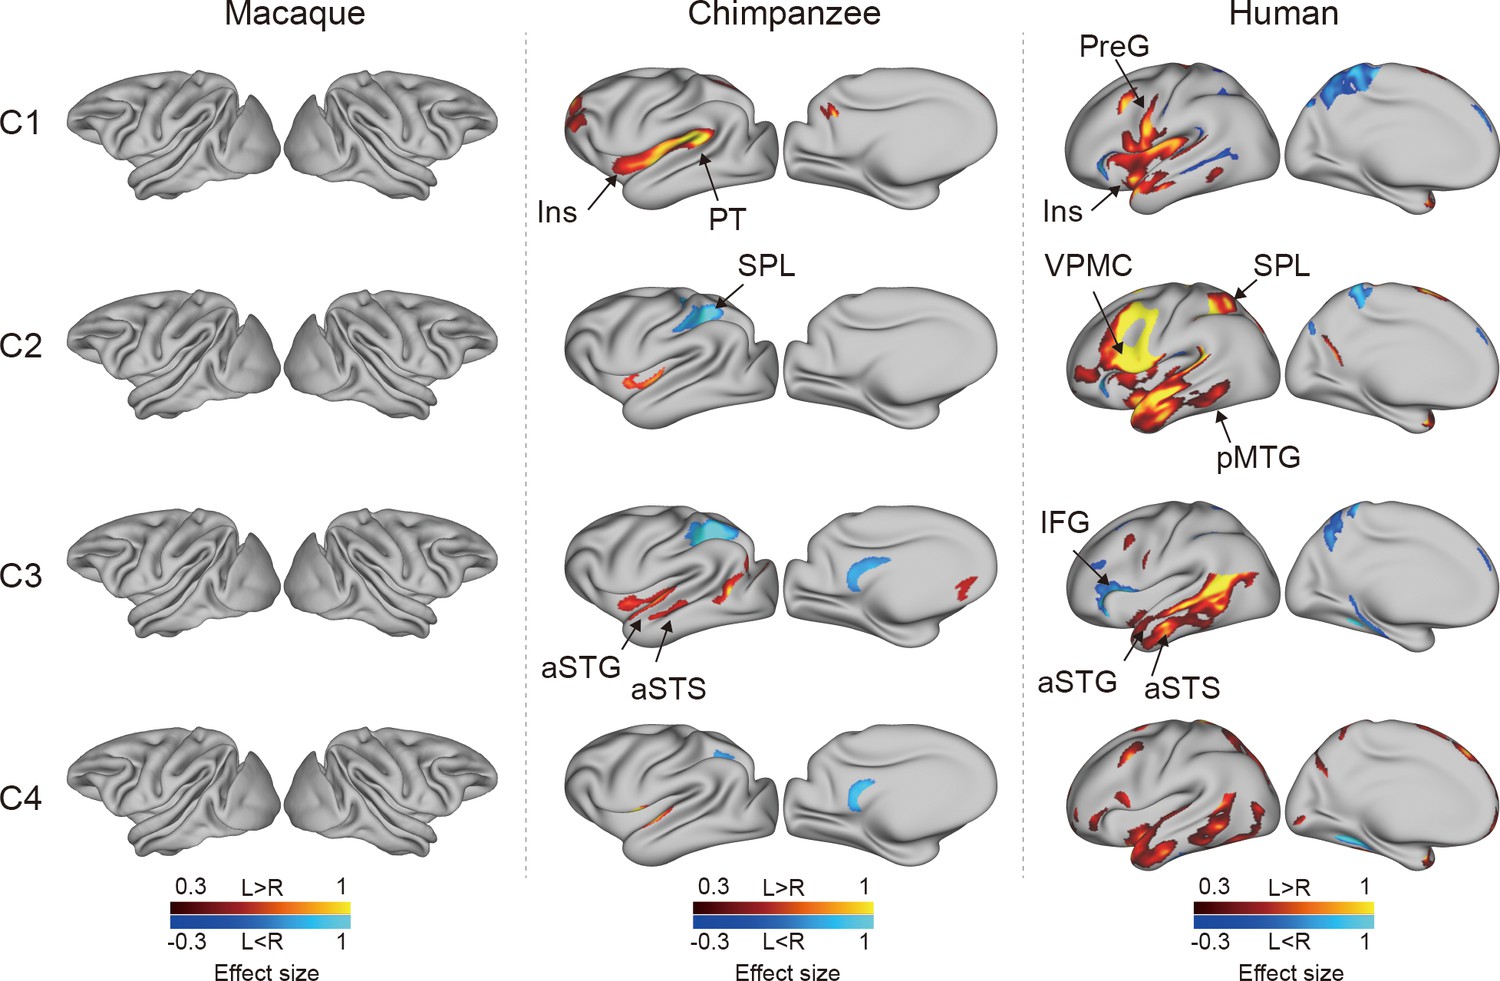
Connectional asymmetries of the IPL subdivisions in the vertex-wise analyses across species.
Effect size (Cohen’s d) related to asymmetric connections of IPL subdivisions displayed on the left hemisphere of a species-specific standard brain (leftward asymmetry: yellow, rightward asymmetry: blue) for each species for areas showing significance at the p<0.05 level corrected for multiple comparisons using false discovery rate correction. PreG, precentral gyrus; SPL, superior parietal lobule; aSTG, anterior superior temporal gyrus; aSTS, anterior superior temporal sulci; PT, planum temporale; VPMC, ventral premotor cortex; pMTG, posterior middle temporal gyrus; IFG, inferior frontal gyrus; Ins, insula.
Figure 3—figure supplement 1
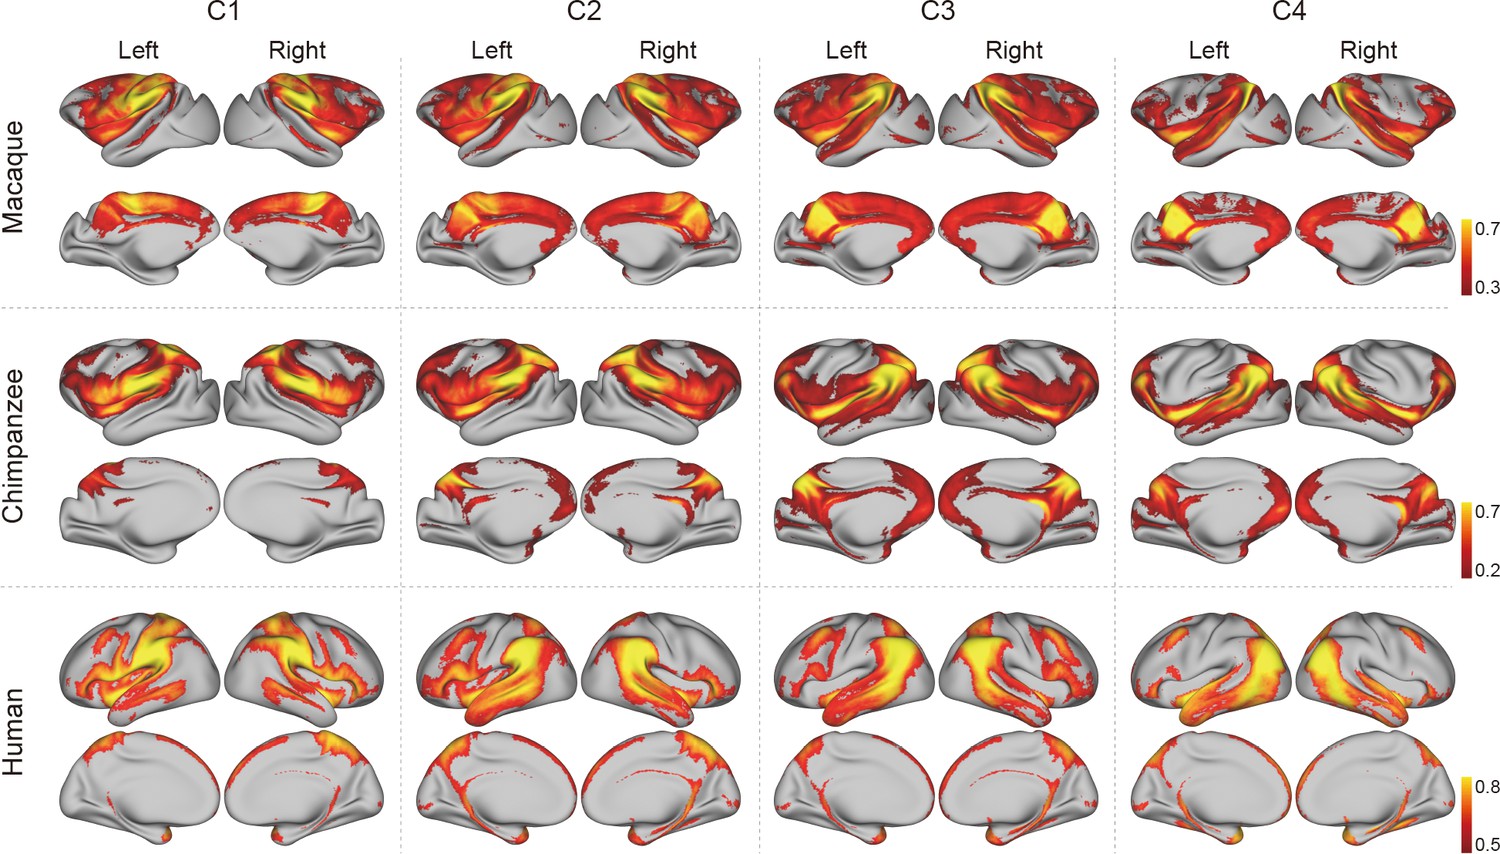
Connectivity profiles of IPL subdivisions across species.
Probabilistic tractography was performed for each IPL subdivision to map its whole-brain connectivity profiles. The group tractograms shown were at a threshold of 0.3 for macaques, 0.2 for chimpanzees, and 0.5 for humans.
Figure 4 with 2 supplements
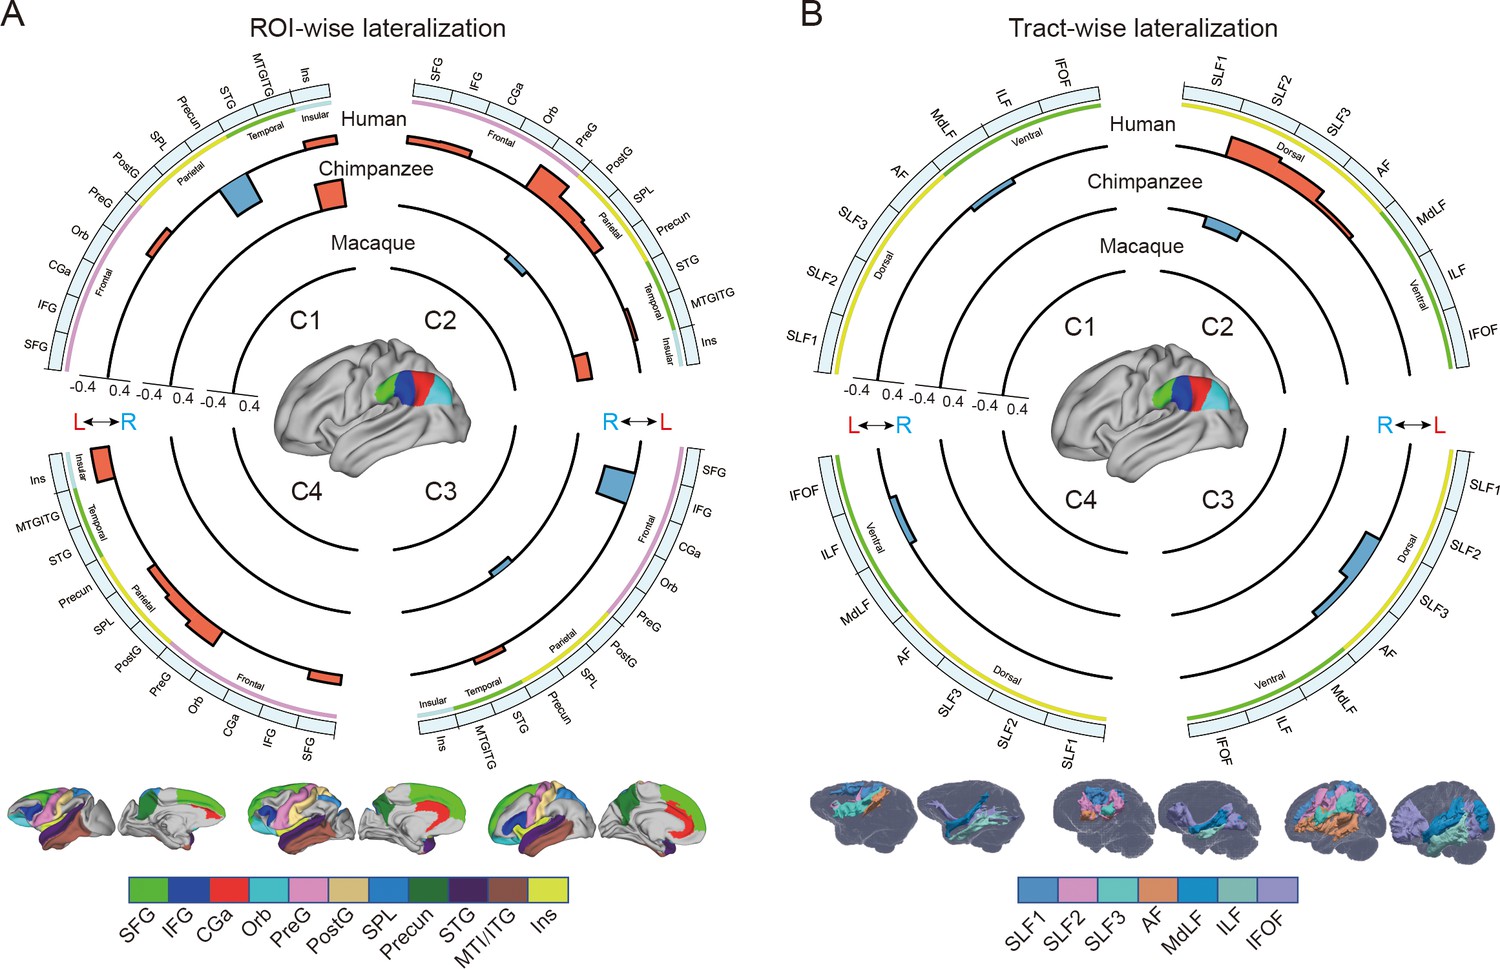
Regional connectional asymmetries of IPL subdivisions.
(A) Connectional asymmetries of IPL subdivisions in the region of interest (ROI)-wise analyses across species. Connectional asymmetry was calculated for the connections between each IPL subregion and 11 ROIs. (B) Connectional asymmetries of the IPL subdivisions in the tract-wise analysis across species. Connectional asymmetry was calculated for the connections between each IPL subregion and the seven tracts. For all plots, the four quadrants of each circle correspond to the four IPL subregions. The outermost circles represent ROIs or tracts. The three inner circles from inside to outside represent macaques, chimpanzees, and humans, respectively. For all plots, only the connectivity showing a significance at a Bonferroni-corrected level of p<0.05 are displayed. SFG, superior frontal gyrus; IFG, inferior frontal gyrus; CGa, anterior cingulate gyrus; Orb, orbitofrontal cortex; PreG, precentral gyrus; PostG, postcentral gyrus; SPL, superior parietal lobule; STG, superior temporal gyrus; MTG/ITG, middle temporal gyrus and inferior temporal gyrus; Ins, insula; SLF1, SLF2, SLF3, the three branches of the superior longitudinal fasciculus; AF, arcuate fasciculus; MdLF, middle longitudinal fasciculus; ILF, inferior longitudinal fasciculus; IFOF, inferior fronto-occipital fasciculus.
Figure 4—figure supplement 1
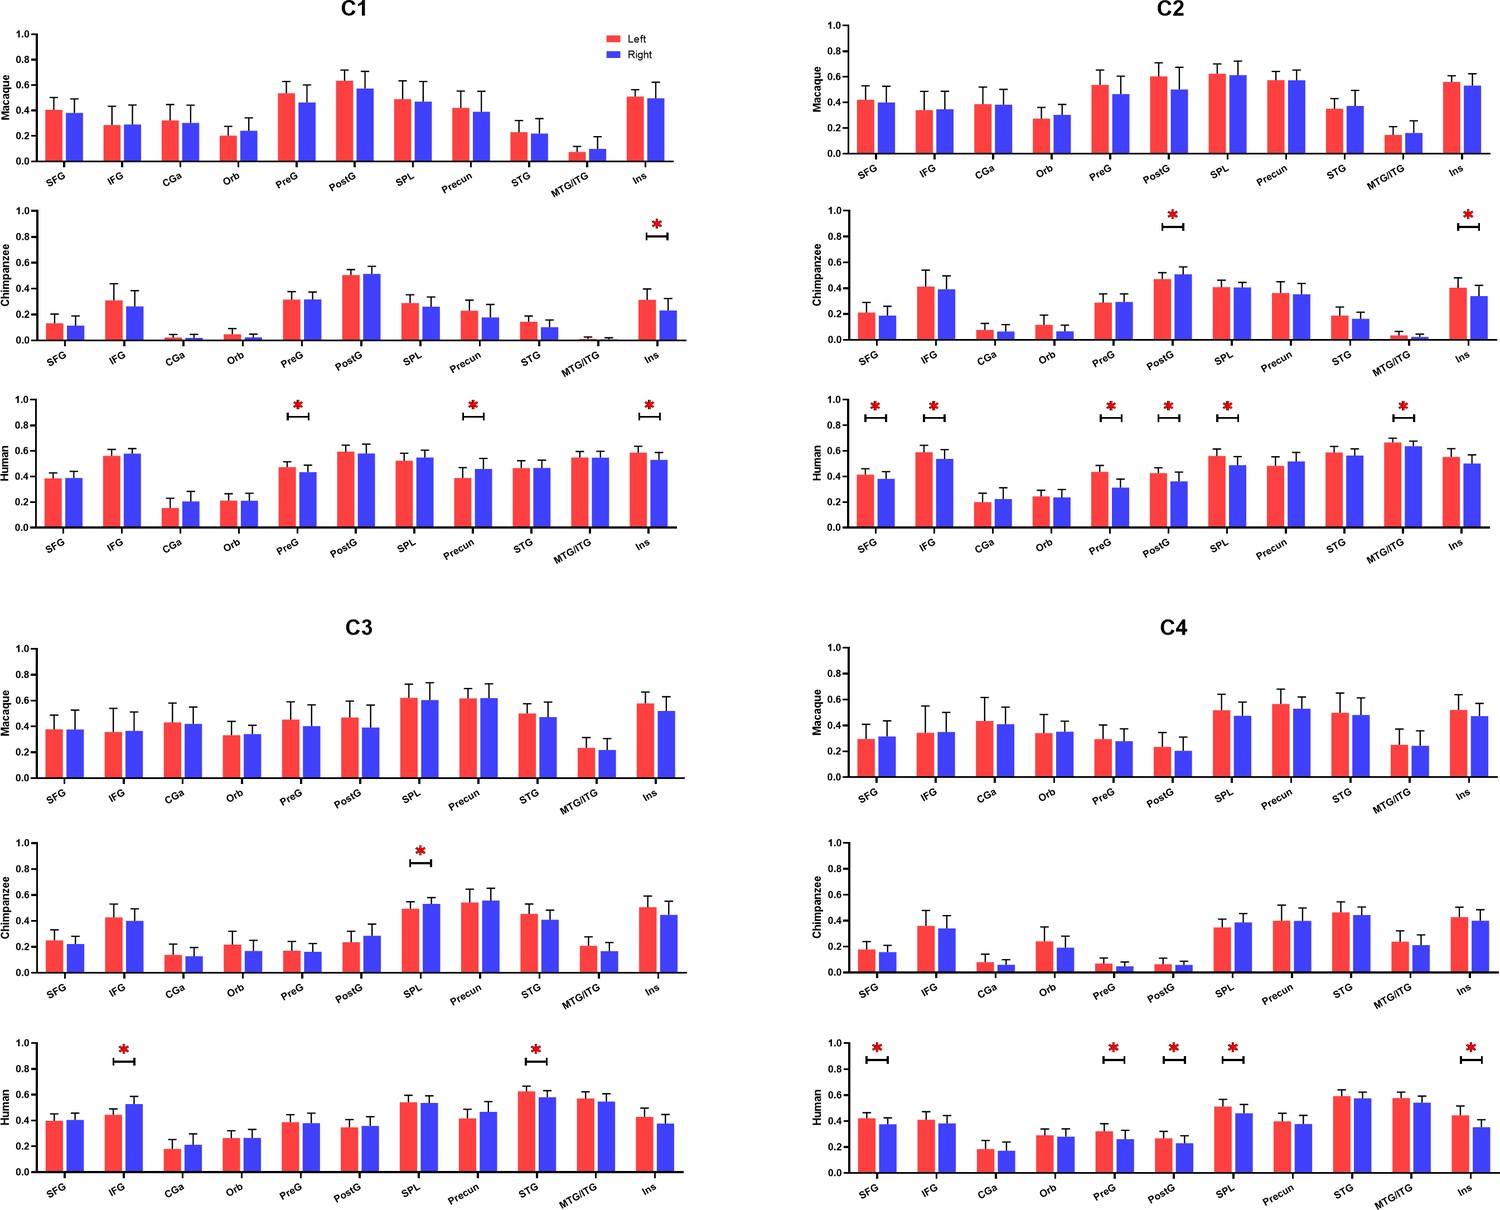
Bar graphs of the average connectivity values between the inferior parietal lobule (IPL) subregions and 11 cortical regions for each species.
The error bars indicate standard deviation. *Significance at a Bonferroni-corrected level of p<0.05.
Figure 4—figure supplement 2
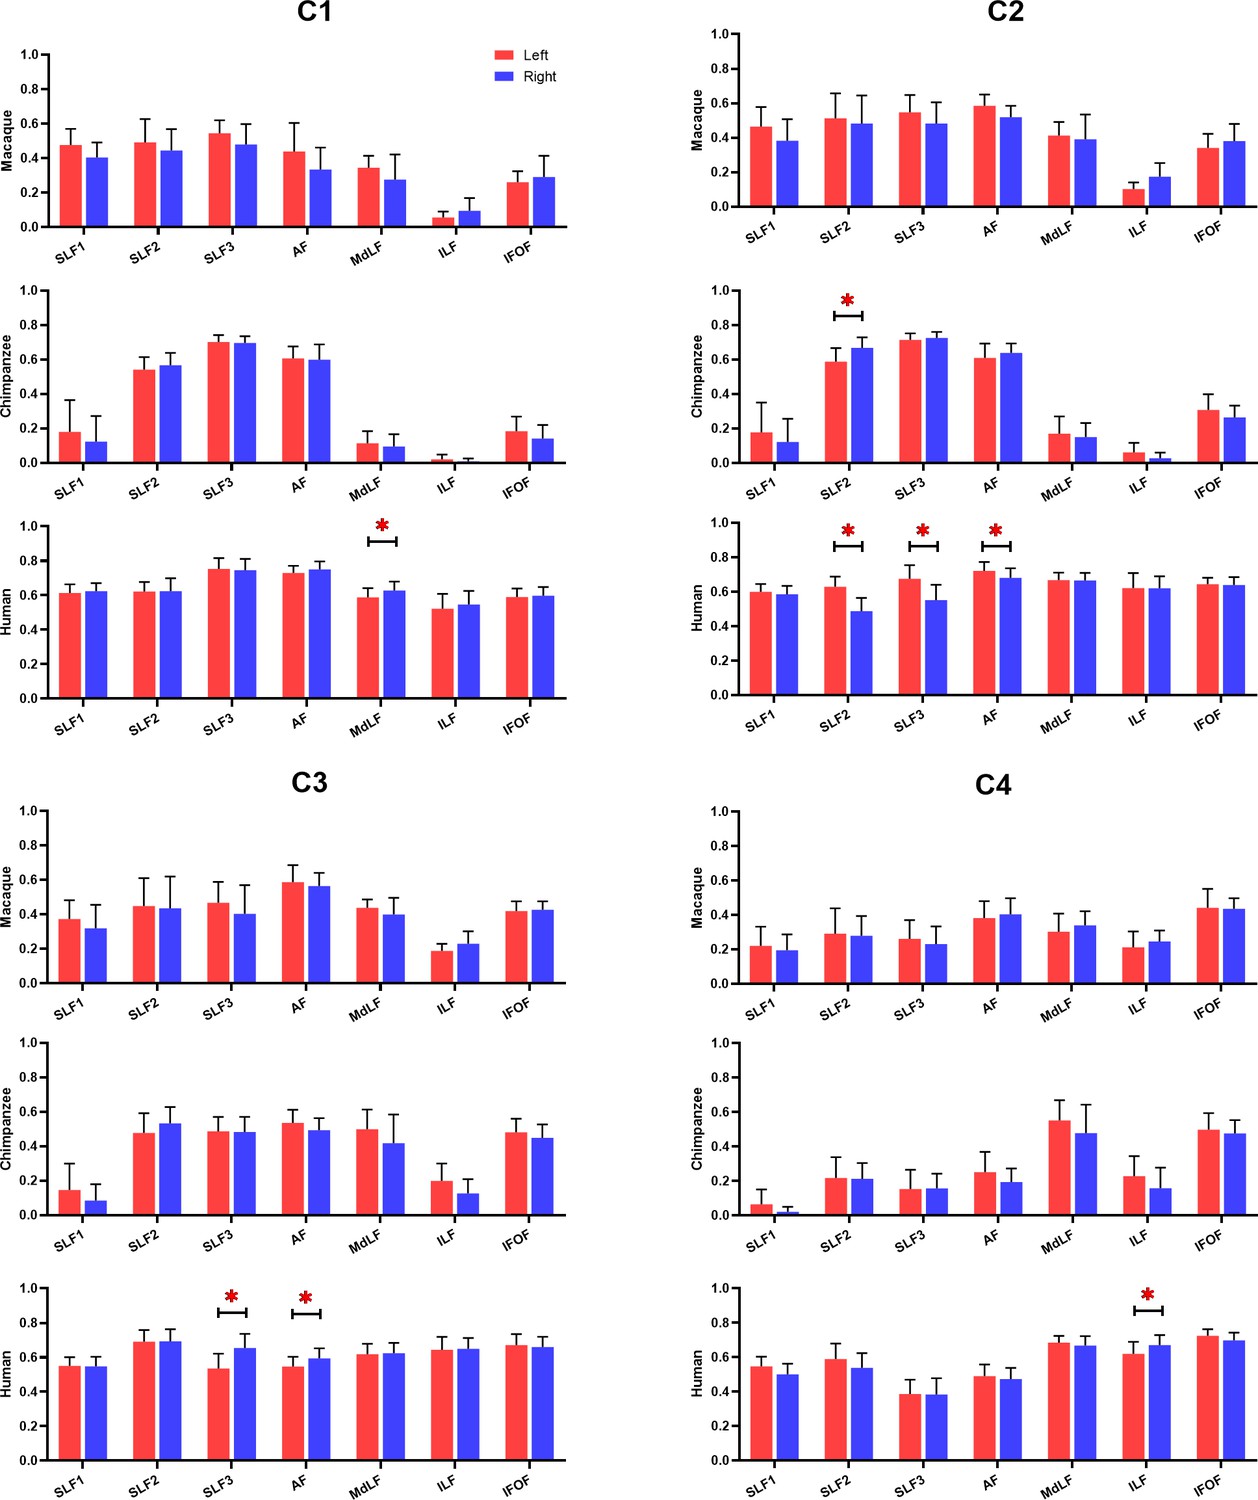
Bar graphs of the average connectivity values between the inferior parietal lobule (IPL) subregions and 11 subcortical tracts for each species.
The error bars indicate standard deviation. *Significance at a Bonferroni-corrected level of p<0.05.
Author response image 1

The graphical abstract summarizing the main results in the present study.
Additional files
Download links
A two-part list of links to download the article, or parts of the article, in various formats.
Downloads (link to download the article as PDF)
Open citations (links to open the citations from this article in various online reference manager services)
Cite this article (links to download the citations from this article in formats compatible with various reference manager tools)
Connectional asymmetry of the inferior parietal lobule shapes hemispheric specialization in humans, chimpanzees, and rhesus macaques
eLife 10:e67600.
https://doi.org/10.7554/eLife.67600


