Pharmacological rescue of impaired mitophagy in Parkinson’s disease-related LRRK2 G2019S knock-in mice
- MRC Protein Phosphorylation and Ubiquitylation Unit, University of Dundee, United Kingdom
- Dundee Imaging Facility, School of Life Sciences, University of Dundee, United Kingdom
- Novel Human Genetics Research Unit, GlaxoSmithKline Pharmaceuticals R&D, United Kingdom
Figures
Figure 1 with 1 supplement
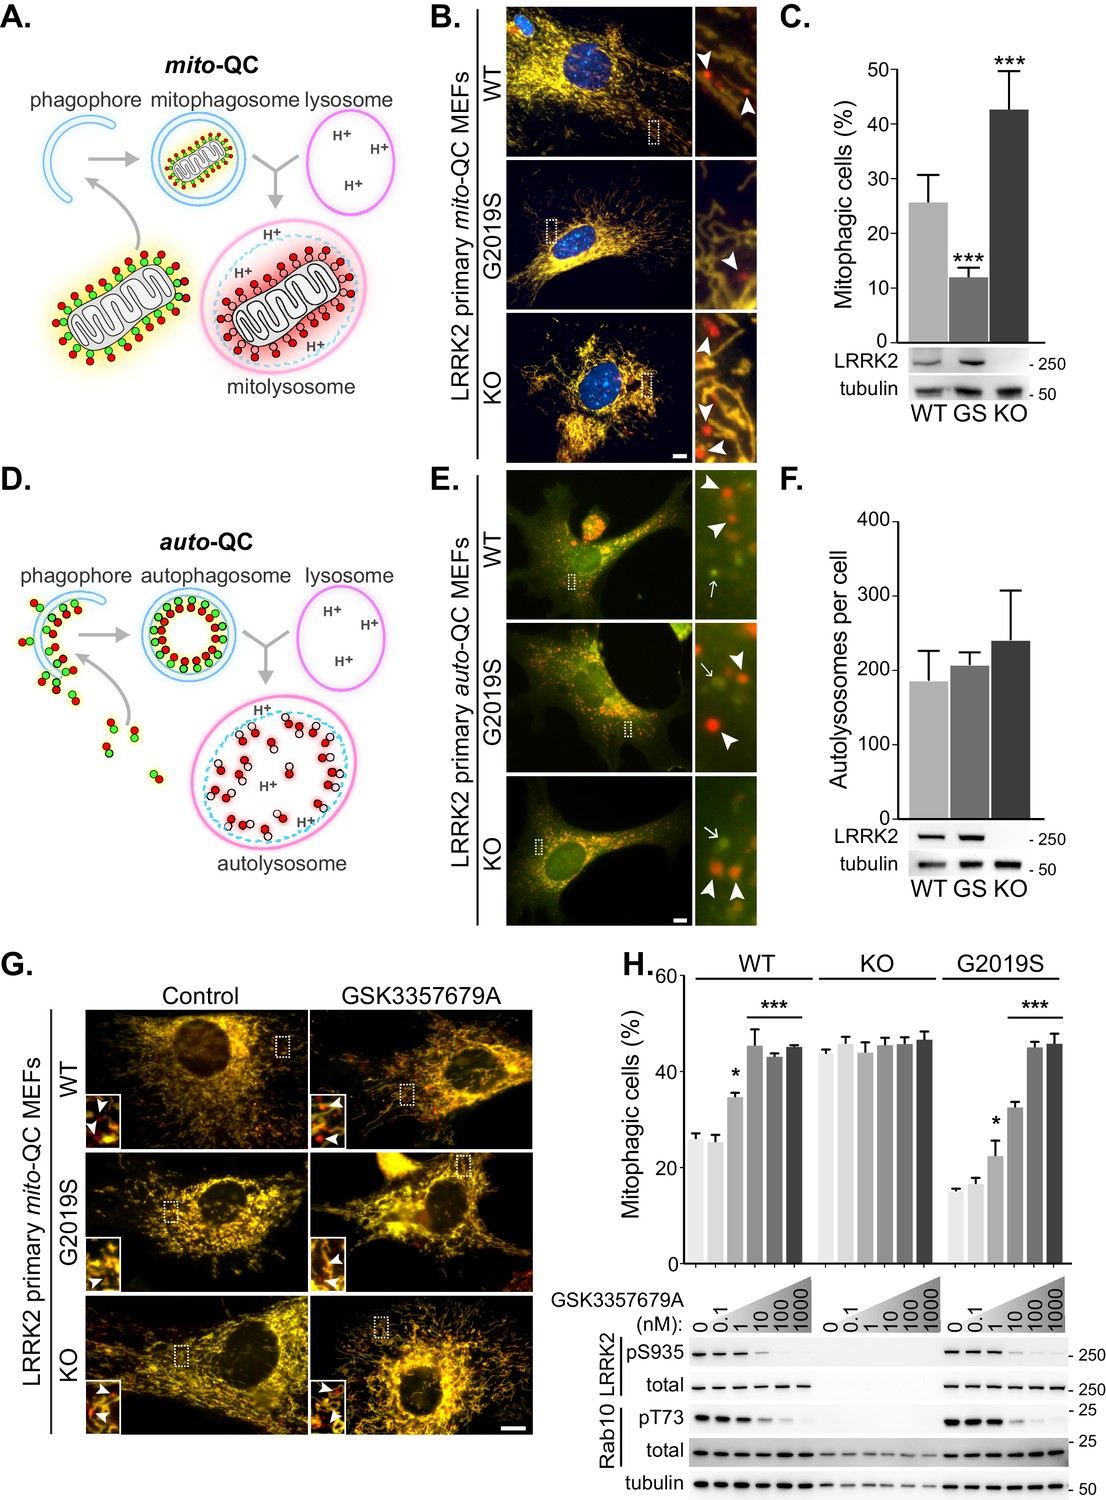
LRRK2 kinase activity impairs basal mitophagy in vitro.
(A) Schematics of the mito-QC reporter in mouse model. (B) Representative images of mito-QC primary MEF cultures established from LRRK2 WT, LRRK2 G2019S, and LRRK2 KO embryos. Boxed area is magnified on the right and arrowheads indicate examples of mitophagy (mCherry-only mitolysosomes). (C) Mitophagy quantitation of data shown in B from six to nine independent experiments, as described in Materials and methods. Below is representative immunoblot showing LRRK2 protein expression. (D) Schematics of the auto-QC reporter in mouse model. (E) Representative images of auto-QC primary MEF cultures established from LRRK2 WT, LRRK2 G2019S, and LRRK2 KO embryos. Boxed area is magnified on the right and arrowheads indicate examples of autolysosomes and arrows highlight autophagosomes. (F) Quantitation of data shown in E from four to six independent experiments. (G) Representative images of mito-QC primary MEFs treated with control (DMSO) or 10 nM GSK3357679A. Boxed area is magnified on bottom left and arrowheads indicate examples of mitolysosomes. (H) Quantitation of mitophagy shown in G from three to seven independent experiments. Corresponding immunoblot of indicated proteins is shown below. Scale bars, 10 μm. Overall data is represented as mean +/- SEM. Statistical significance is displayed as *p<0.05, and ***p<0.001.
-
Figure 1—source data 1
Numerical data for Figure 1.
- https://cdn.elifesciences.org/articles/67604/elife-67604-fig1-data1-v1.xlsx
-
Figure 1—source data 2
Western blot raw data files for Figure 1C.
- https://cdn.elifesciences.org/articles/67604/elife-67604-fig1-data2-v1.zip
-
Figure 1—source data 3
Western blot raw data files for Figure 1F.
- https://cdn.elifesciences.org/articles/67604/elife-67604-fig1-data3-v1.zip
-
Figure 1—source data 4
Western blot raw data files for Figure 1H.
- https://cdn.elifesciences.org/articles/67604/elife-67604-fig1-data4-v1.zip
Figure 1—figure supplement 1
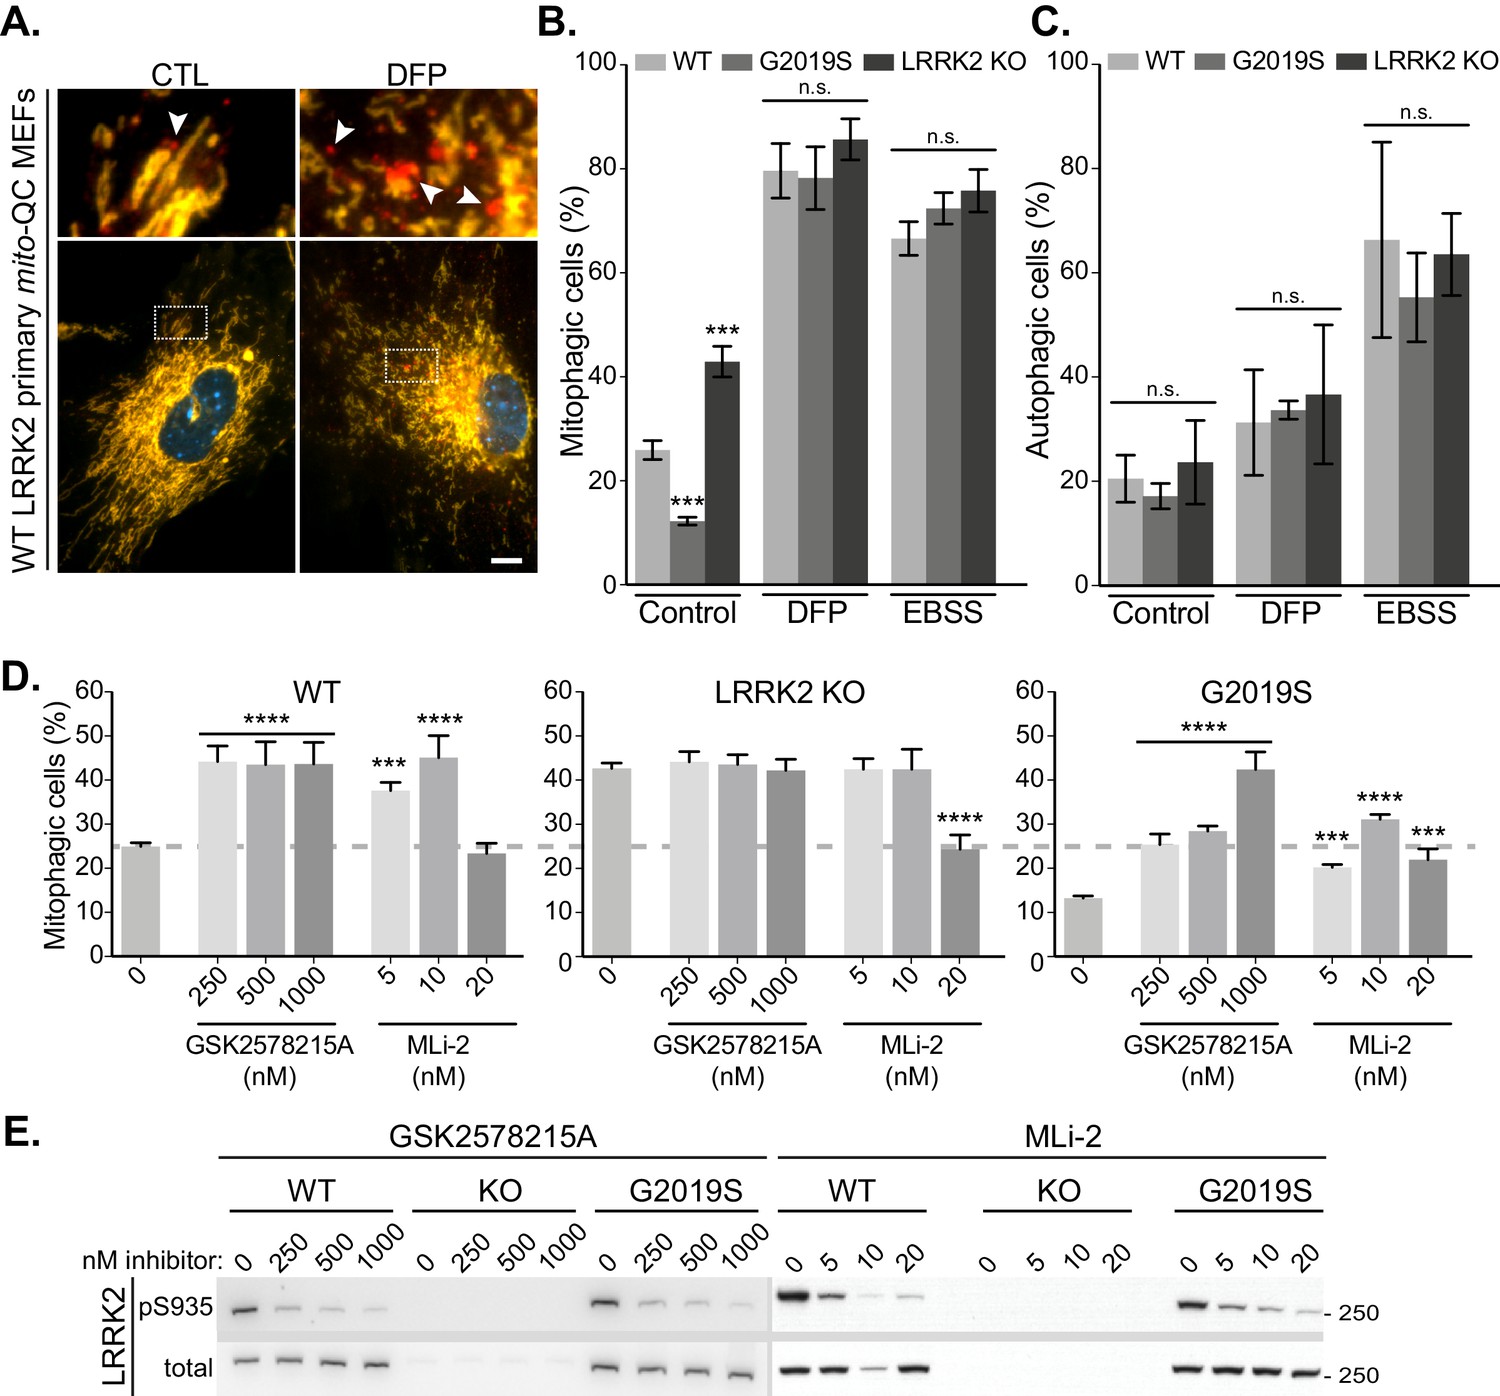
Lrrk2 genotype does not impact stimulated mitophagy and autophagy, yet multiple LRRK2 kinase inhibitors enhance mitophagy under basal conditions.
(A) Representative images of WT mito-QC primary MEF cultures treated with control (CTL) or 1 mM deferiprone (DFP) for 24 hr to stimulate mitophagy. Arrowheads indicate mitophagy (mCherry-only mitolysosomes). (B) Quantitation of basal (CTL) and stimulated (DFP or EBSS) mitophagy in LRRK2 WT, LRRK2 G2019S, and LRRK2 KO mito-QC primary MEFs from three to nine independent experiments. (C) Quantitation of auto-QC primary MEF cultures in basal (control), 1 mM deferiprone (DFP), and amino acid starvation (EBSS) conditions from four to six independent experiments. (D) Quantitation of mitophagy in mito-QC MEFs, from three to 15 independent experiments treated with increasing concentrations of GSK2578215A and MLi-2. (E) Representative immunoblots MEFs treated as in D. Scale bars, 10 μm. Overall data is represented as mean +/- SEM. Statistical significance is displayed as ***p<0.001, and ****p<0.0001.
-
Figure 1—figure supplement 1—source data 1
Numerical data for Figure 1—figure supplement 1.
- https://cdn.elifesciences.org/articles/67604/elife-67604-fig1-figsupp1-data1-v1.xlsx
-
Figure 1—figure supplement 1—source data 2
Western blot raw data files for Figure 1—figure supplement 1E.
- https://cdn.elifesciences.org/articles/67604/elife-67604-fig1-figsupp1-data2-v1.zip
Figure 2 with 1 supplement
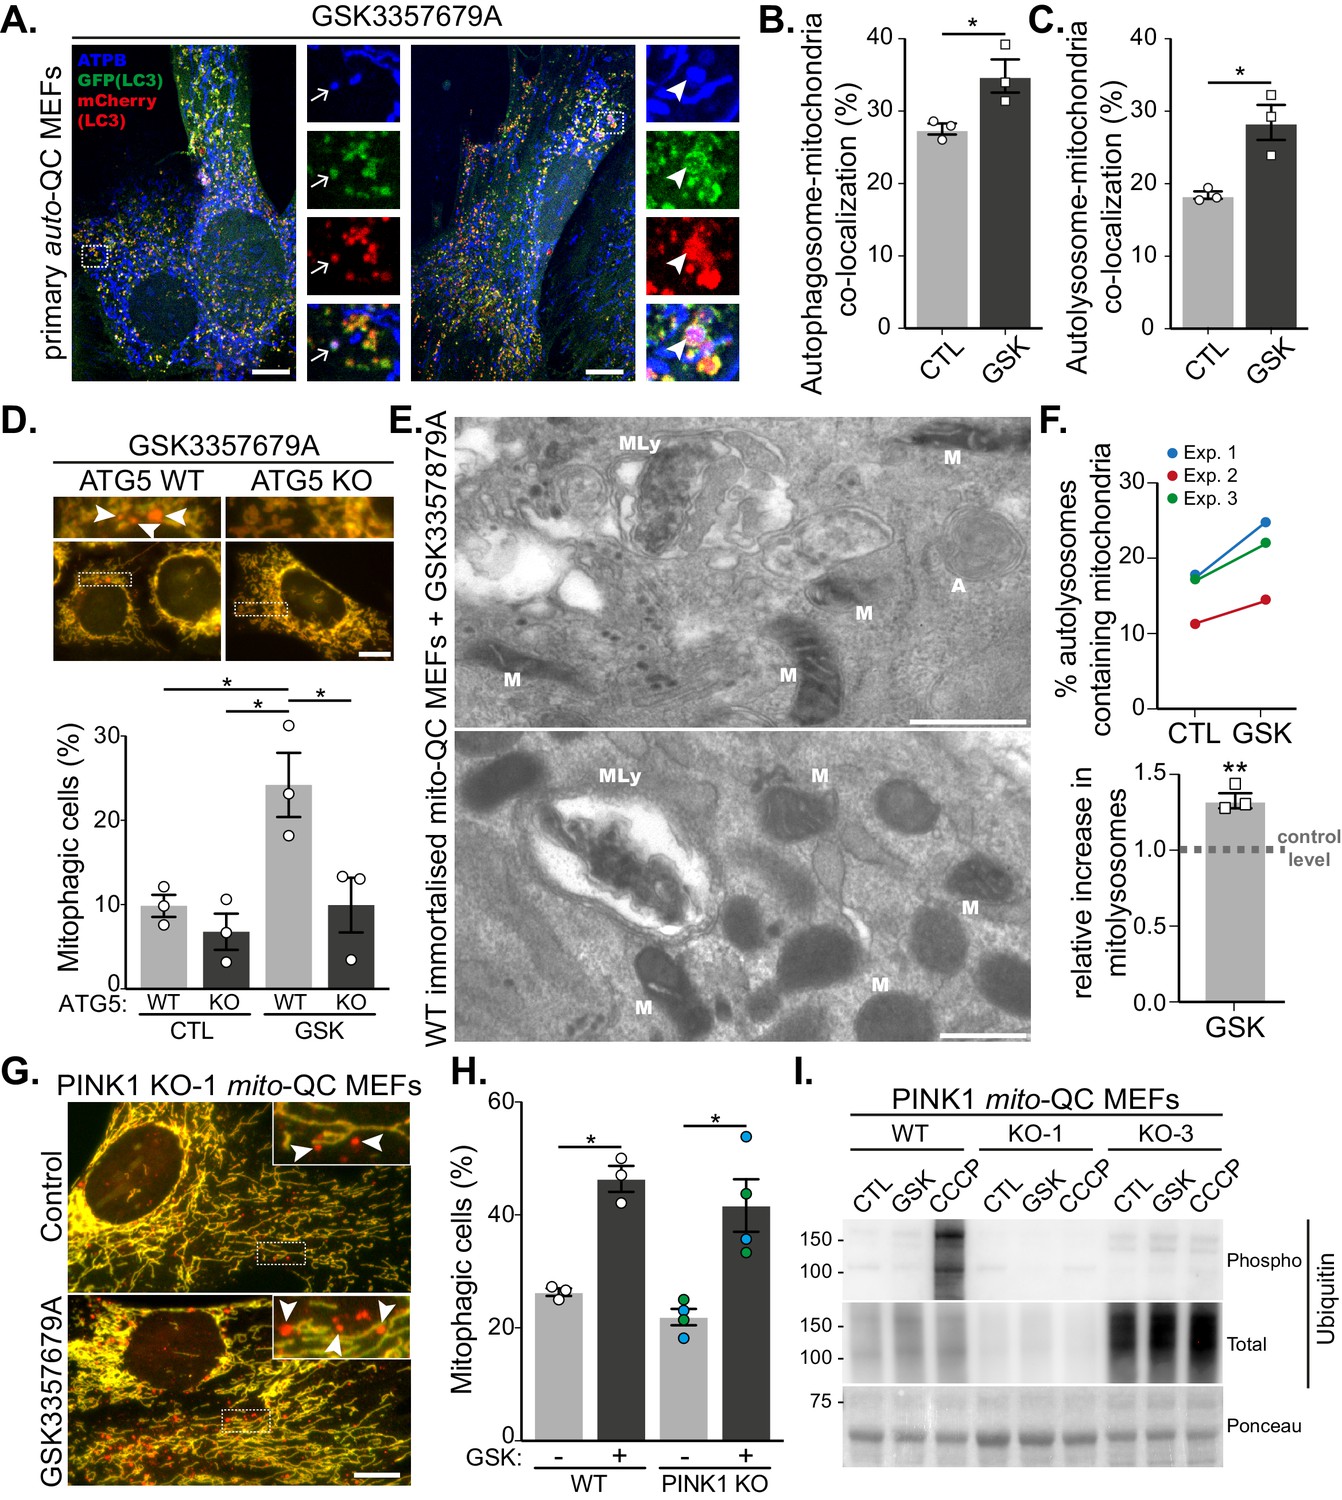
LRRK2-dependent mitophagy relies on the general autophagy machinery but is independent of the PINK1 pathway.
(A) Representative images of auto-QC primary MEF cultures treated with 10 nM GSK3357679A for 24 hr and immunolabelled with ATPB. Arrows show examples of autophagosomes containing mitochondria, and arrowheads show examples of autolysosomes containing mitochondria. Scale bars, 10 μm. (B) Quantitation of autophagosomes containing mitochondria shown in (B) or autolysosomes containing mitochondria shown in (C) from three independent experiments. (D) Representative images of WT and ATG5 KO mito-QC immortalised MEF cultures treated with 10 nM GSK3357679A for 24 hr. Corresponding quantitation from three independent experiments is shown below. Scale bars, 10 μm. (E) Representative transmission electron microscopy images from immortalised MEFs treated with 10 nM GSK3357679A for 24 hr. MLy: Mitolysosome; M: Mitochondria; A: autophagosome. Scale bars, 500 nm. (F) Quantitation of data in E from three independent experiments. (G) Representative images of PINK1 KO mito-QC primary MEF cultures treated with/without with 10 nM GSK3357679A for 24 hr. Scale bars, 10 μm. (H) Quantitation of the of mitophagic cells from data shown in G from 3 (4 for KO) independent experiments. (I) Immunoblots of the indicated proteins from WT and PINK1 KO primary MEFs (KO-1 and KO-3 are derived from different embryos) treated with/without 10 nM GSK3357679A or 10 μM CCCP for 24 hr. Overall data is represented as mean +/- SEM. Statistical significance is displayed as *p<0.05 and **p<0.01.
-
Figure 2—source data 1
Numerical data for Figure 2.
- https://cdn.elifesciences.org/articles/67604/elife-67604-fig2-data1-v1.xlsx
-
Figure 2—source data 2
Western blot raw data files for Figure 2I.
- https://cdn.elifesciences.org/articles/67604/elife-67604-fig2-data2-v1.zip
Figure 2—figure supplement 1
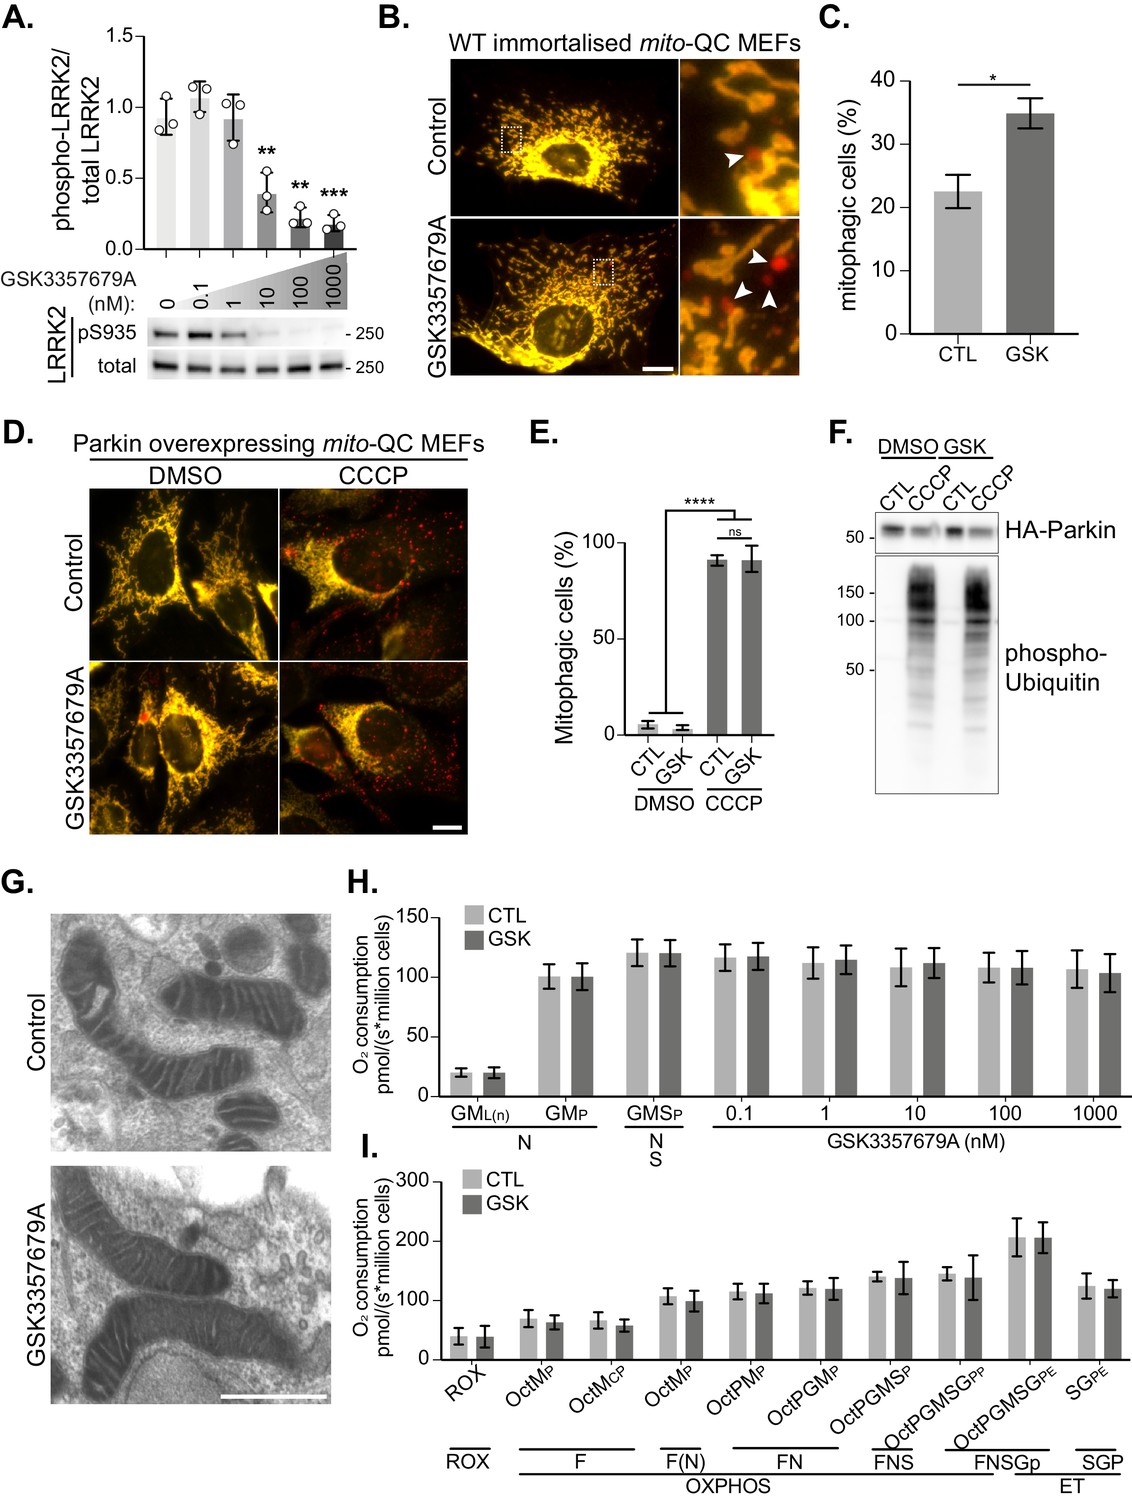
LRRK2-regulated mitophagy does not disrupt Parkin-dependent mitophagy and does not globally affect mitochondrial function.
(A) Representative immunoblots of immortalised WT MEFs treated with increasing concentrations of GSK3357679A and quantitation (n=3). (B) Representative images of WT mito-QC immortalised MEF cultures treated with control (CTL) or 10 nM GSK3357679A. (C) Quantitation of mitophagy in mito-QC MEFs, from three independent experiments. (D) Representative images of Parkin overexpressing mito-QC primary MEF cultures treated with DMSO, 10 nM GSK3357679A, and 20 μM CCCP for 24 hr. (E) Quantitation of the data displayed in D. (F) Immunoblots of the indicated proteins in samples treated as in D. (G) Representative transmission electron microscopy images of mitochondria from immortalised MEFs treated with control or 10 nM GSK3357679A for 24 hr. (H) High-resolution respirometry of acute exposure to incremental doses of GSK3357679A following stimulation of the NS pathways in immortalised WT MEFs. (I) High-resolution respirometry of chronic (24 hr) exposure to 10 nM GSK3357679A. *p<0.05, **p<0.01, ***p<0.001, and ****p<0.0001.
-
Figure 2—figure supplement 1—source data 1
Numerical data for Figure 2—figure supplement 1.
- https://cdn.elifesciences.org/articles/67604/elife-67604-fig2-figsupp1-data1-v1.xlsx
-
Figure 2—figure supplement 1—source data 2
Western blot raw data files for Figure 2—figure supplement 1A.
- https://cdn.elifesciences.org/articles/67604/elife-67604-fig2-figsupp1-data2-v1.zip
-
Figure 2—figure supplement 1—source data 3
Western blot raw data files for Figure 2—figure supplement 1F.
- https://cdn.elifesciences.org/articles/67604/elife-67604-fig2-figsupp1-data3-v1.zip
Figure 3 with 1 supplement
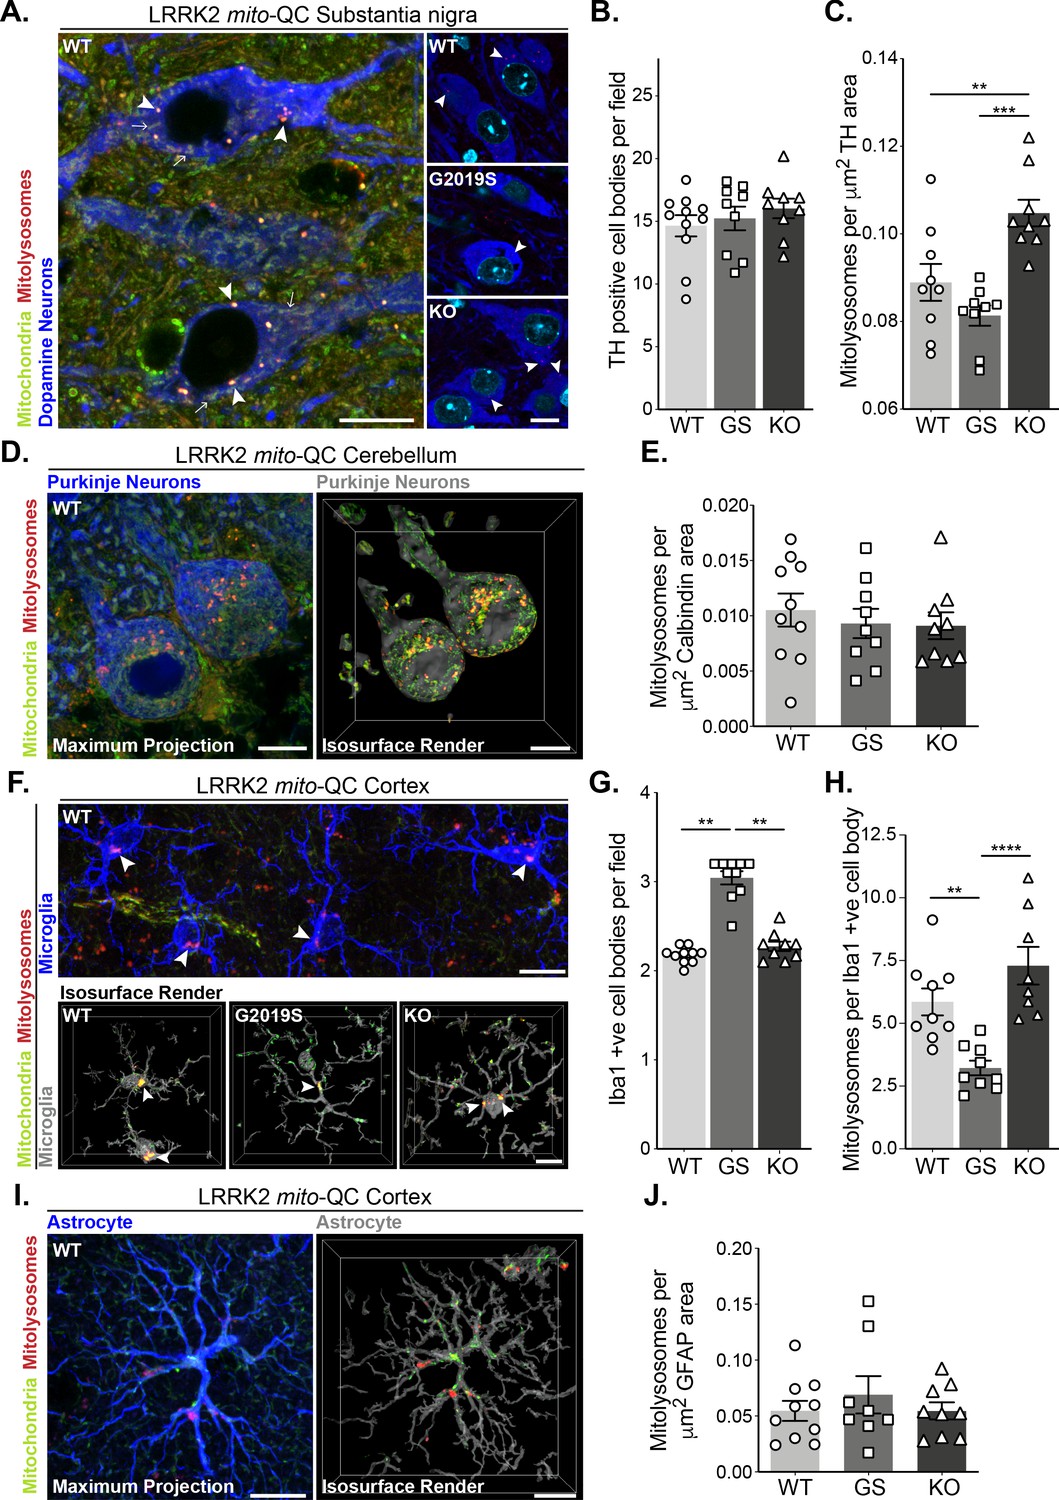
Mutation of LRRK2 in vivo alters brain mitophagy.
(A) Representative image of tyrosine hydroxylase (TH) immunolabelled dopaminergic neurons within the substantia nigra pars compacta (SNpc) undergoing basal mitophagy in LRRK2 WT, LRRK2 G2019S, and LRRK2 KO mito-QC mice. Arrowheads show examples of mitolysosomes and arrows indicate mitochondria. (B) Quantitation of the number of TH positive cells per field of view using a 63x objective. (C) Quantitation of basal mitophagy per μm (Sironi et al., 2020) of TH staining, data points represent means from individual mice. (D) Representative maximal intensity projection and isosurface render of calbindin immunolabelled Purkinje neurons in mito-QC cerebellum sections, undergoing basal mitophagy. (E) Quantitation of basal mitophagy per μm (Sironi et al., 2020) of calbindin staining, data points represent means from individual mice. (F) Representative image and isosurface renders of Iba1 immunolabelled microglia undergoing basal mitophagy in cortical sections from LRRK2 WT, LRRK2 G2019S, and LRRK2 KO mito-QC mice. Arrowheads highlight mitolysosomes. (G) Quantitation of the number of Iba1-positive cells in the brain cortex per field of view using a 63x objective. (H) Quantitation of basal mitophagy per Iba1-positive cell body, data points represent means from individual mice. (I) Representative maximal intensity projection and isosurface render of GFAP immunolabelled astrocytes undergoing basal mitophagy in mito-QC cortical sections. (J) Quantitation of basal mitophagy per μm (Sironi et al., 2020) of GFAP staining, data points represent means from individual mice. Scale bars, 10 μm. Overall data is represented as mean +/- SEM. Statistical significance is displayed as *p<0.05, **p<0.01, and ***p<0.001.
-
Figure 3—source data 1
Numerical data for Figure 3.
- https://cdn.elifesciences.org/articles/67604/elife-67604-fig3-data1-v1.xlsx
Figure 3—figure supplement 1
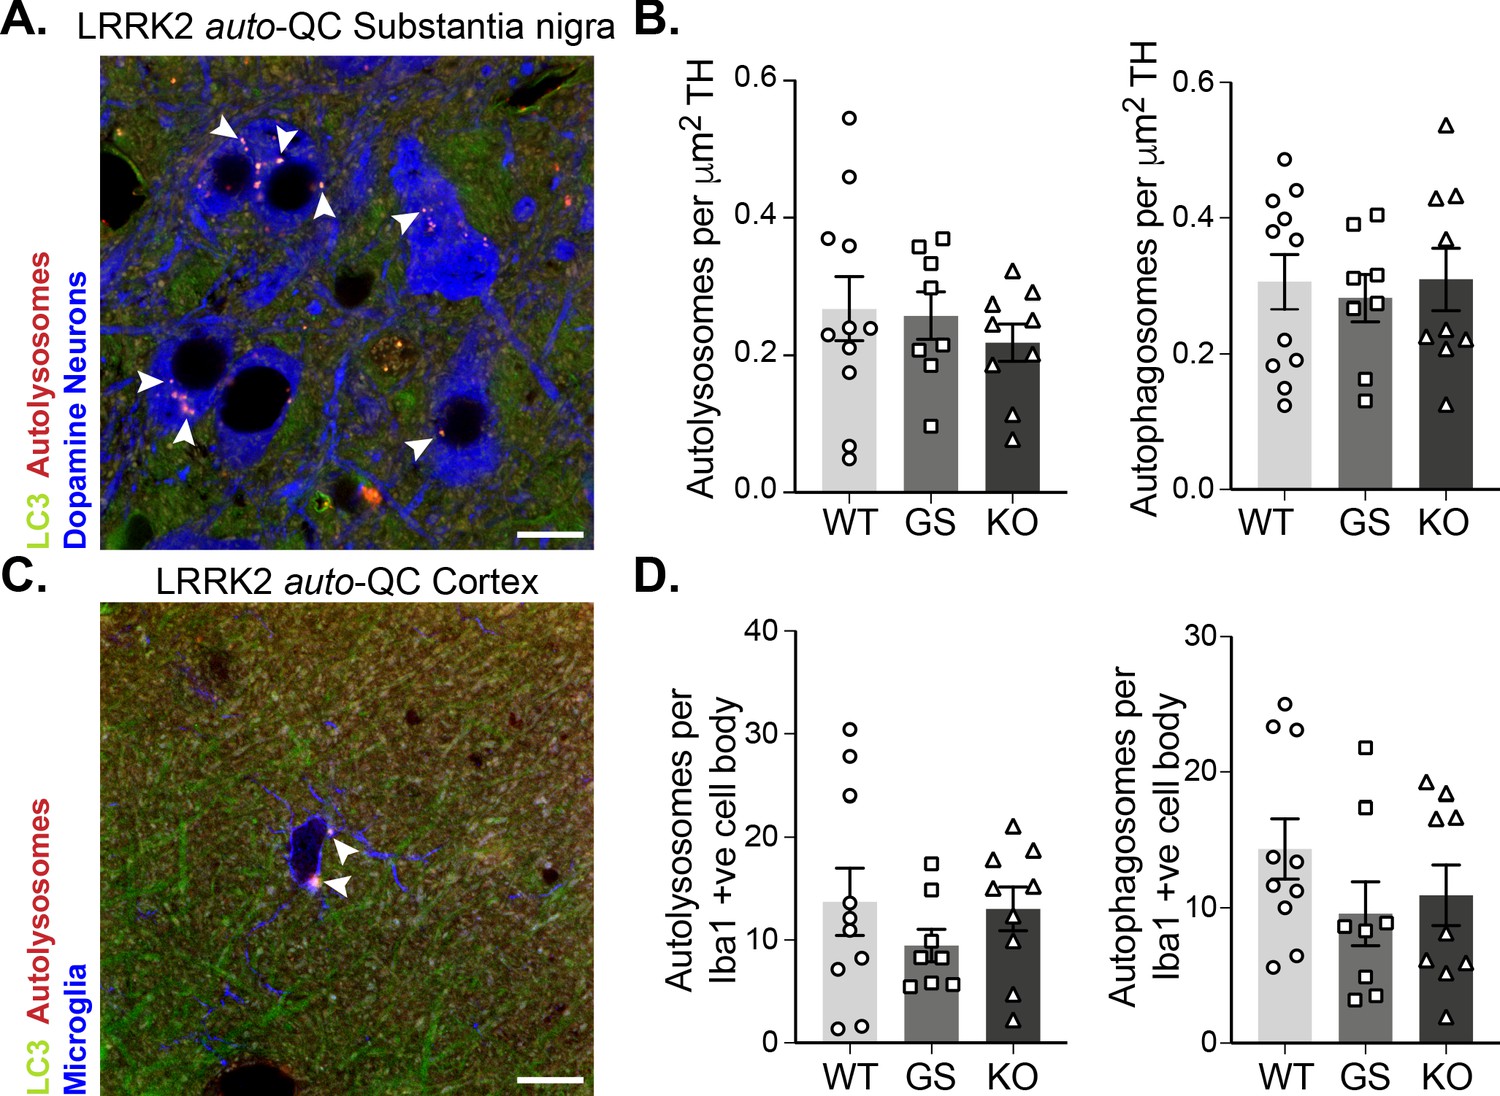
Macroautophagy in the brain is unaltered by LRRK2 genotype.
(A) Representative image of tyrosine hydroxylase (TH) immunolabelled dopaminergic neurons in substantia nigra pars compacta WT auto-QC sections. Arrowheads indicate autolysosome examples. (B) Quantitation of the number of autolysosomes (left) or autophagosomes (right) per TH area in LRRK2 WT, LRRK2 G2019S, and LRRK2 KO auto-QC mice. Data points are means from individual mice. (C) Representative image of Iba1 immunolabelled microglia in cortical WT auto-QC sections. Arrowheads highlight autolysosomes. (D) Quantitation of the number of autolysosomes (left) or autophagosomes (right) per Iba1-positive cell in LRRK2 WT, LRRK2 G2019S, and LRRK2 KO auto-QC mice. Data points are means from individual mice. Scale bars, 10 μm. Overall data is represented as mean +/- SEM.
-
Figure 3—figure supplement 1—source data 1
Numerical data for Figure 3—figure supplement 1.
- https://cdn.elifesciences.org/articles/67604/elife-67604-fig3-figsupp1-data1-v1.xlsx
Figure 4 with 1 supplement
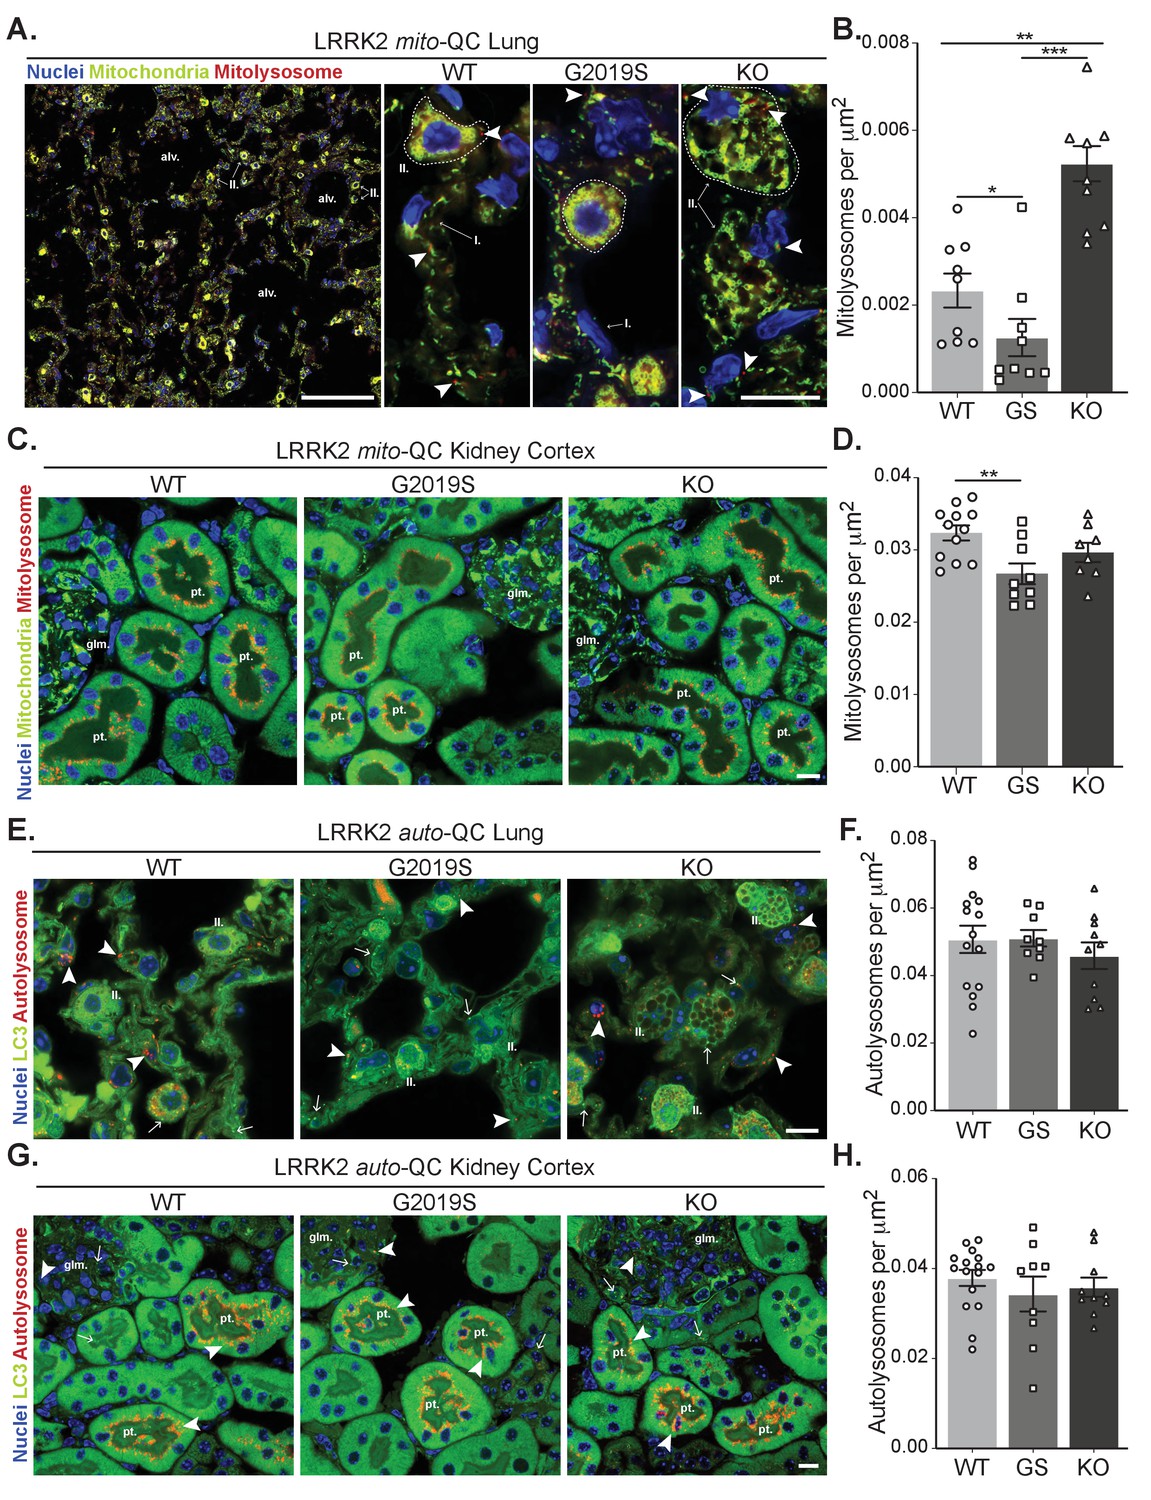
Effects of Lrrk2 genotype on basal mitophagy and macroautophagy in selected peripheral tissues.
(A) Representative tile scan and images of mito-QC lungs from LRRK2 WT, LRRK2 G2019S, and LRRK2 KO mice. Arrows on the tile scan highlight Type II pneumocytes (II.), alv. show alveoli. Arrowheads in the higher magnification images indicate examples of mitolysosomes and circled cells correspond to Type II pneumocytes (II.) and I. indicates Type I pneumocytes. (B) Quantitation of lung basal mitophagy from data shown in D, data points represent means from individual mice. (C) Representative images of mito-QC kidney cortex from LRRK2 WT, LRRK2 G2019S, and LRRK2 KO mice. glm. indicates glomeruli and pt. indicates proximal tubule examples. (D) Quantitation of kidney basal mitophagy from data shown in F, data points represent means from individual mice. (E) Representative images of auto-QC lungs from LRRK2 WT, LRRK2 G2019S, and LRRK2 KO mice. Arrowheads highlight autolysosomes, arrows indicate autophagosomes, and II. indicates Type II pneumocytes. (F) Quantitation of lung autophagy from data shown in C, data points represent means from individual mice. (G) Representative images of auto-QC kidney cortex from LRRK2 WT, LRRK2 G2019S, and LRRK2 KO mice. Arrowheads and, arrows as in C, glm. indicates glomeruli, and pt. indicates proximal tubules. (H) Quantitation of kidney autophagy from data shown in E, data points represent means from individual mice. Scale bars, Tile scan in A: 100 μm, Other pictures:10 μm. Overall data is represented as mean +/- SEM. Statistical significance is displayed as **p<0.01, and ***p<0.001.
-
Figure 4—source data 1
Numerical data for Figure 4.
- https://cdn.elifesciences.org/articles/67604/elife-67604-fig4-data1-v1.xlsx
Figure 4—figure supplement 1
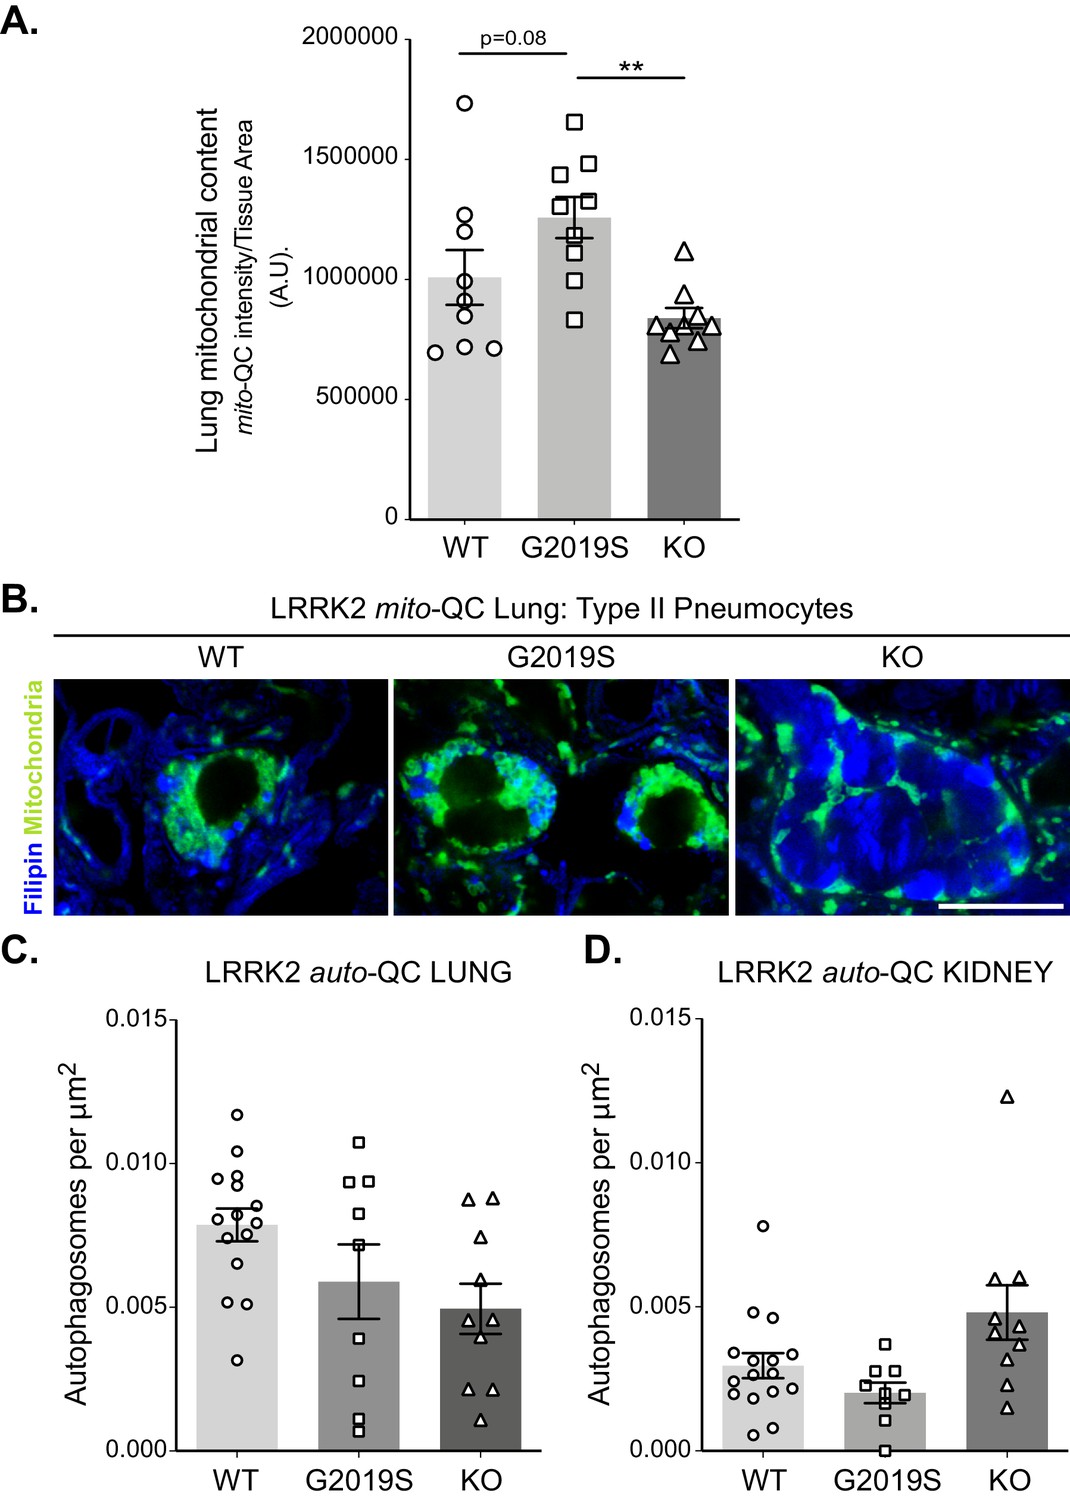
Macroautophagy in the lungs and kidney cortex of LRRK2 mice.
(A) Quantitation of mitochondrial content, based on total mito-QC reporter staining, from lung sections of indicated mice. Data points are means from individual animals. (B) Filipin staining of cholesterol in type II pneumocytes within mito-QC lungs. Note increased staining in KO. (C) Quantitation of basal number of autophagosomes in auto-QC lungs from LRRK2 WT, LRRK2 G2019S, and LRRK2 KO mice. (D) Quantitation of basal number of autophagosomes auto-QC kidney cortex from LRRK2 WT, LRRK2 G2019S, and LRRK2 KO mice. Scale bars, 10 μm. Data is represented as mean +/- SEM. Statistical significance is displayed as **p<0.01.
-
Figure 4—figure supplement 1—source data 1
Numerical data for Figure 4—figure supplement 1.
- https://cdn.elifesciences.org/articles/67604/elife-67604-fig4-figsupp1-data1-v1.xlsx
Figure 5 with 1 supplement
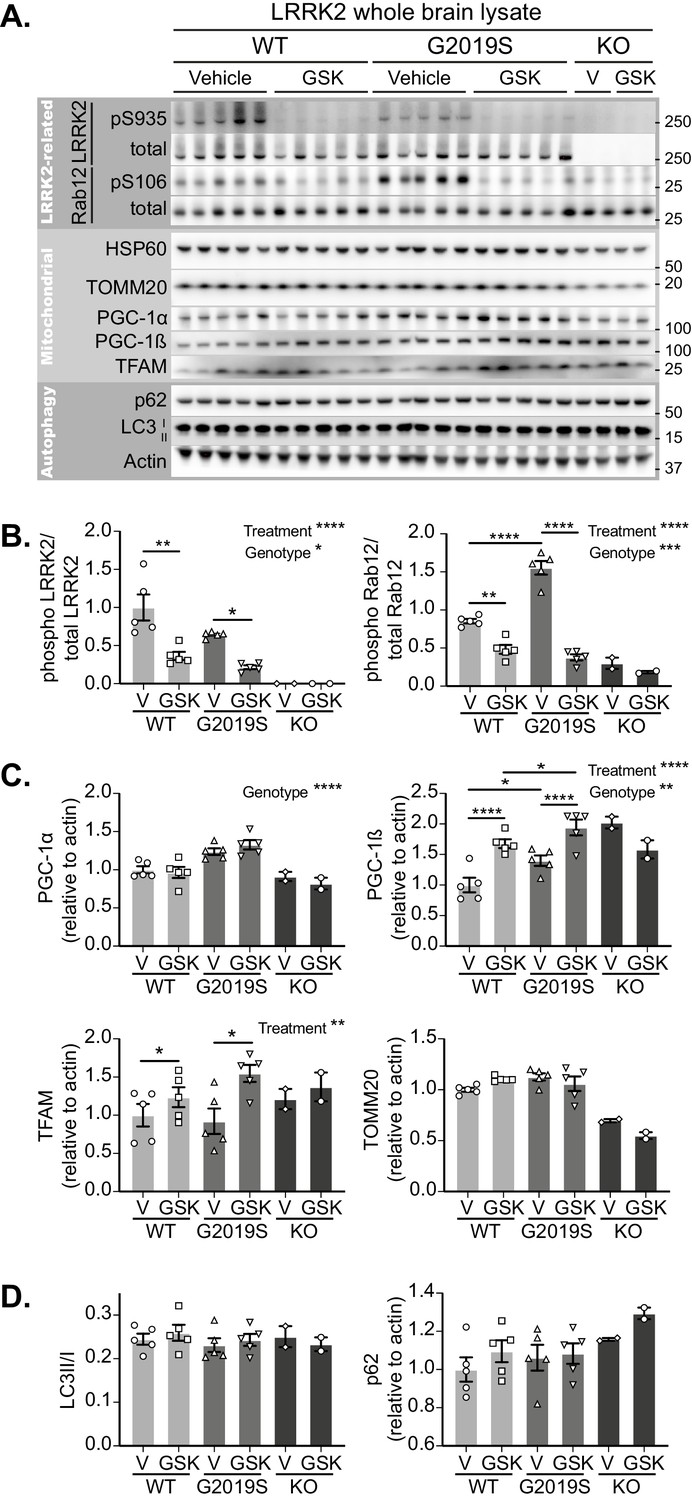
GSK3357679A treatment inhibits LRRK2 in the brain.
(A) Immunoblots of the indicated LRRK2-related, mitochondrial and autophagy proteins from brain lysates of LRRK2 WT, LRRK2 G2019S, and LRRK2 KO mito-QC mice treated with vehicle or GSK3357679A. (B) Quantitation of phosphorylation data from the LRRK2-related proteins displayed in A. (C) Quantitation of mitochondria- and mitochondrial biogenesis-related proteins displayed in A. (D) Quantitation of autophagy-related proteins displayed in A. Overall data is represented as mean +/- SEM. Statistical significance is displayed as *p<0.05, **p<0.01, ***p<0.001, and ****p<0.0001.
-
Figure 5—source data 1
Numerical data for Figure 5.
- https://cdn.elifesciences.org/articles/67604/elife-67604-fig5-data1-v1.xlsx
-
Figure 5—source data 2
Western blot raw data files for Figure 5A.
- https://cdn.elifesciences.org/articles/67604/elife-67604-fig5-data2-v1.zip
Figure 5—figure supplement 1
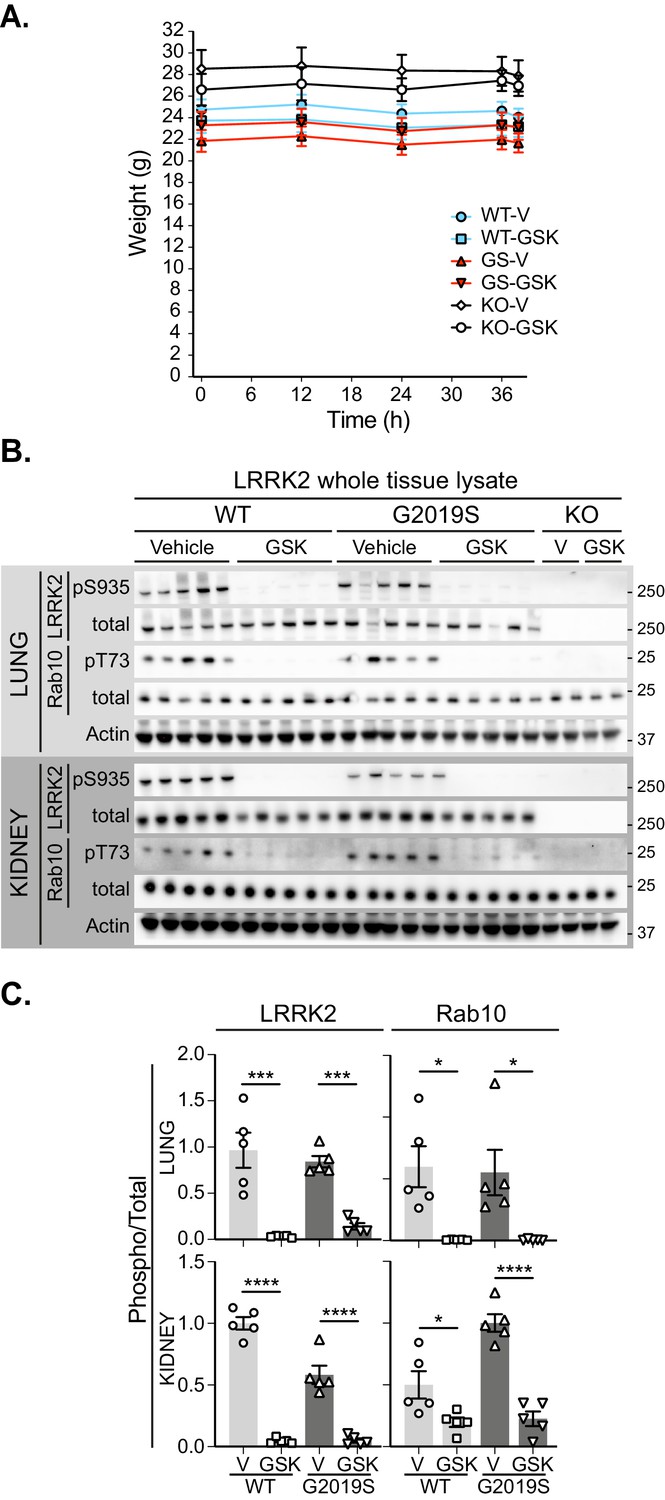
Pharmacological inhibition of LRRK2 kinase in the lung and kidney.
(A) Body weights of mice treated over 36 hr with vehicle (V) or GSK3357679A (GSK). (B) Immunoblots of the indicated LRRK2-related, mitochondrial and autophagy proteins from lung and kidney lysates of LRRK2 WT, LRRK2 G2019S, and LRRK2 KO mito-QC mice treated with vehicle or GSK3357679A. (C) Quantitation of phosphorylation data from the LRRK2-related proteins displayed in B. *p<0.05, ***p<0.001, and ****p<0.0001.
-
Figure 5—figure supplement 1—source data 1
Numerical data for Figure 5—figure supplement 1.
- https://cdn.elifesciences.org/articles/67604/elife-67604-fig5-figsupp1-data1-v1.xlsx
-
Figure 5—figure supplement 1—source data 2
Western blot raw data files for Figure 5—figure supplement 1B.
- https://cdn.elifesciences.org/articles/67604/elife-67604-fig5-figsupp1-data2-v1.zip
Figure 6 with 1 supplement

Pharmacological rescue of LRRK2-mediated mitophagy defects in vivo.
(A) Representative image of tyrosine hydroxylase (TH) immunolabelled dopaminergic neurons of the substantia nigra pars compacta in LRRK2 WT, LRRK2 G2019S, and LRRK2 KO mito-QC mice treated or not (vehicle) with GSK3357679A. Arrowheads indicate mitolysosome examples. (B) Quantitation of mitophagy from data shown in A, with the addition of LRRK2 KO. Each data point represents mean value from an individual mouse. (C) Representative images of Iba1 positive cortical microglia from LRRK2 WT, and LRRK2 G2019S mice treated or not (vehicle) with GSK3357679A. Arrowheads indicate mitolysosomes. (D) Quantitation of mitophagy from data shown in E, with the addition of LRRK2 KO. (E) Representative images of mito-QC lungs from LRRK2 WT, and LRRK2 G2019S mice treated or not (vehicle) with GSK3357679A. Arrowheads highlight mitolysosomes. (F) Quantitation of mitophagy from data shown in E, with the addition of LRRK2 KO. For (B), (D), and (F), V = vehicle dosed animals, GSK = GSK3357679A dosed animals. Each data point represents mean value from an individual mouse. Scale bars, 10 μm. Overall data is represented as mean +/- SEM. Statistical significance is displayed as *p<0.05, **p<0.01, ***p<0.001, and ****p<0.0001.
-
Figure 6—source data 1
Numerical data for Figure 6.
- https://cdn.elifesciences.org/articles/67604/elife-67604-fig6-data1-v1.xlsx
Figure 6—figure supplement 1
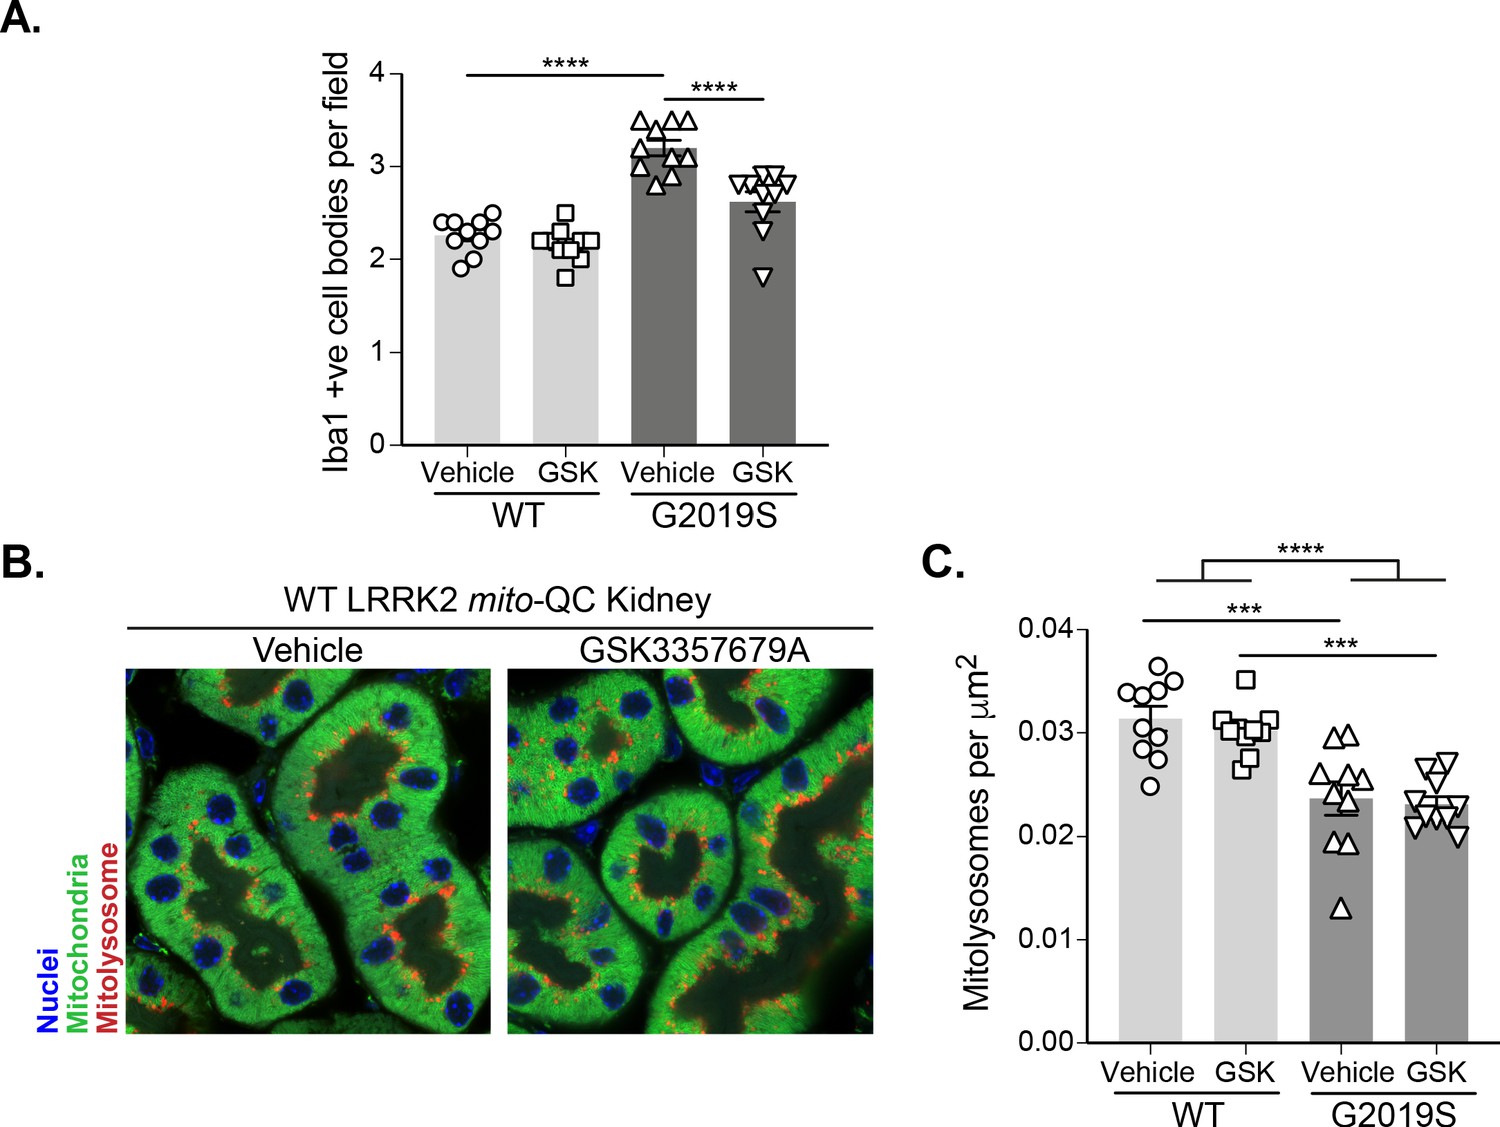
LRRK2 inhibition rescues microglia number in G2019S cortex but does not impact mitophagy in the kidney.
(A) Quantitation of Iba1-positive cells in the brain cortex per field of view (using a 63x objective) in LRRK2 WT, LRRK2 G2019S, and LRRK2 KO mito-QC mice treated with vehicle or GSK3357679A. (B) Representative images of mito-QC kidney cortex from LRRK2 WT mice treated with vehicle or GSK3357679A. (C) Quantitation of mitophagy from data shown in B. Data points represent the mean value from individual mice. Scale bars, 10 μm. Overall data is represented as mean +/- SEM. Statistical significance is displayed as ***p<0.001 and ****p<0.0001.
-
Figure 6—figure supplement 1—source data 1
Numerical data for Figure 6—figure supplement 1.
- https://cdn.elifesciences.org/articles/67604/elife-67604-fig6-figsupp1-data1-v1.xlsx
Additional files
Download links
A two-part list of links to download the article, or parts of the article, in various formats.
Downloads (link to download the article as PDF)
Open citations (links to open the citations from this article in various online reference manager services)
Cite this article (links to download the citations from this article in formats compatible with various reference manager tools)
Pharmacological rescue of impaired mitophagy in Parkinson’s disease-related LRRK2 G2019S knock-in mice
eLife 10:e67604.
https://doi.org/10.7554/eLife.67604


