Effects of arousal and movement on secondary somatosensory and visual thalamus
- Department of Neuroscience, Columbia University, United States
- Kavli Institute for Brain Science, United States
- Zuckerman Mind Brain Behavior Institute, United States
Figures
Figure 1 with 2 supplements
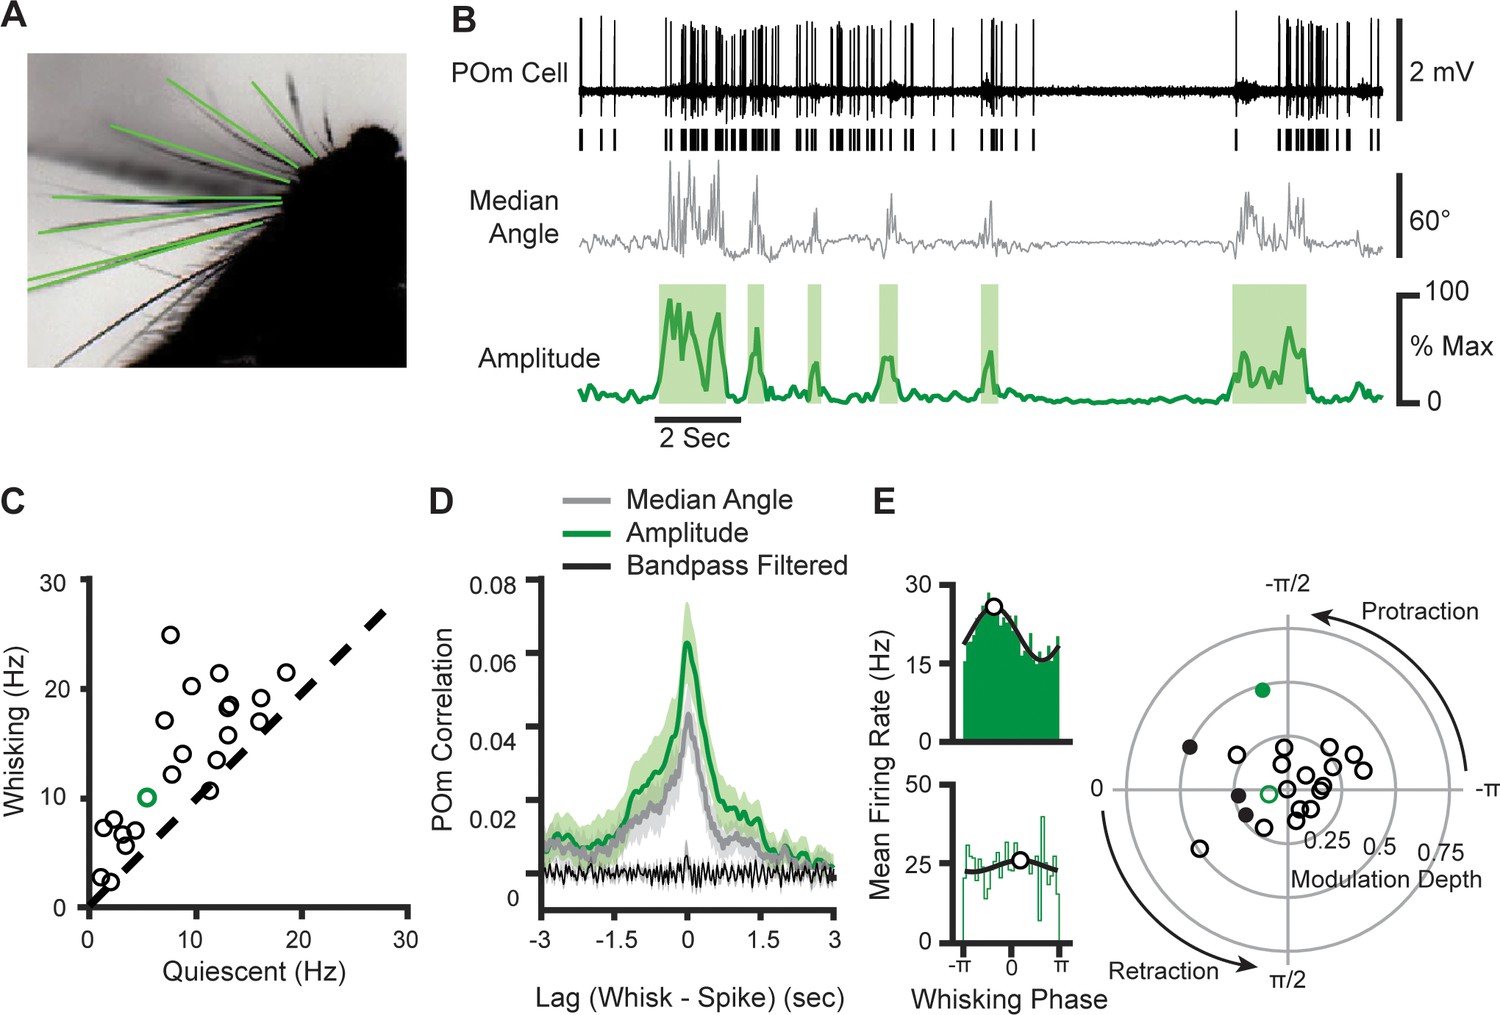
POm cells mainly track slow components of whisking activity.
(A) An example frame from a video. Identified whiskers are highlighted in green. (B) Example traces of juxtasomal POm recording and whisking. The median angle of all whiskers in each video frame (middle, gray) was used to calculate the whisking amplitude (bottom, green). (C) Scatter plot of POm firing rates during whisking and quiescence (n=22 POm cells, five mice, increase from mean of 7.8 Hz to 12.4 Hz, or 58%, p<10–4, paired t-test). Green, cell in (B). (D) Cross-correlation of POm firing rate and whisking amplitude (green), angle (gray), and 4–30 Hz bandpass-filtered angle (black). Shading, SEM over cells. Cross-correlation is normalized such that autocorrelations at zero lag equal one. (E) Left, Firing rate as a function of phase in the whisking cycle for two example POm units. A sinusoid model (black) was fit to each cell to quantify preferred phase (white markers) and modulation depth. Right, A polar plot of modulation depth (radius) and preferred phase (angle) of each POm unit. Filled circles, cells with significant phase modulation (p<0.05, Kuiper test, Bonferroni corrected). Green circles correspond to the two examples.
Figure 1—figure supplement 1
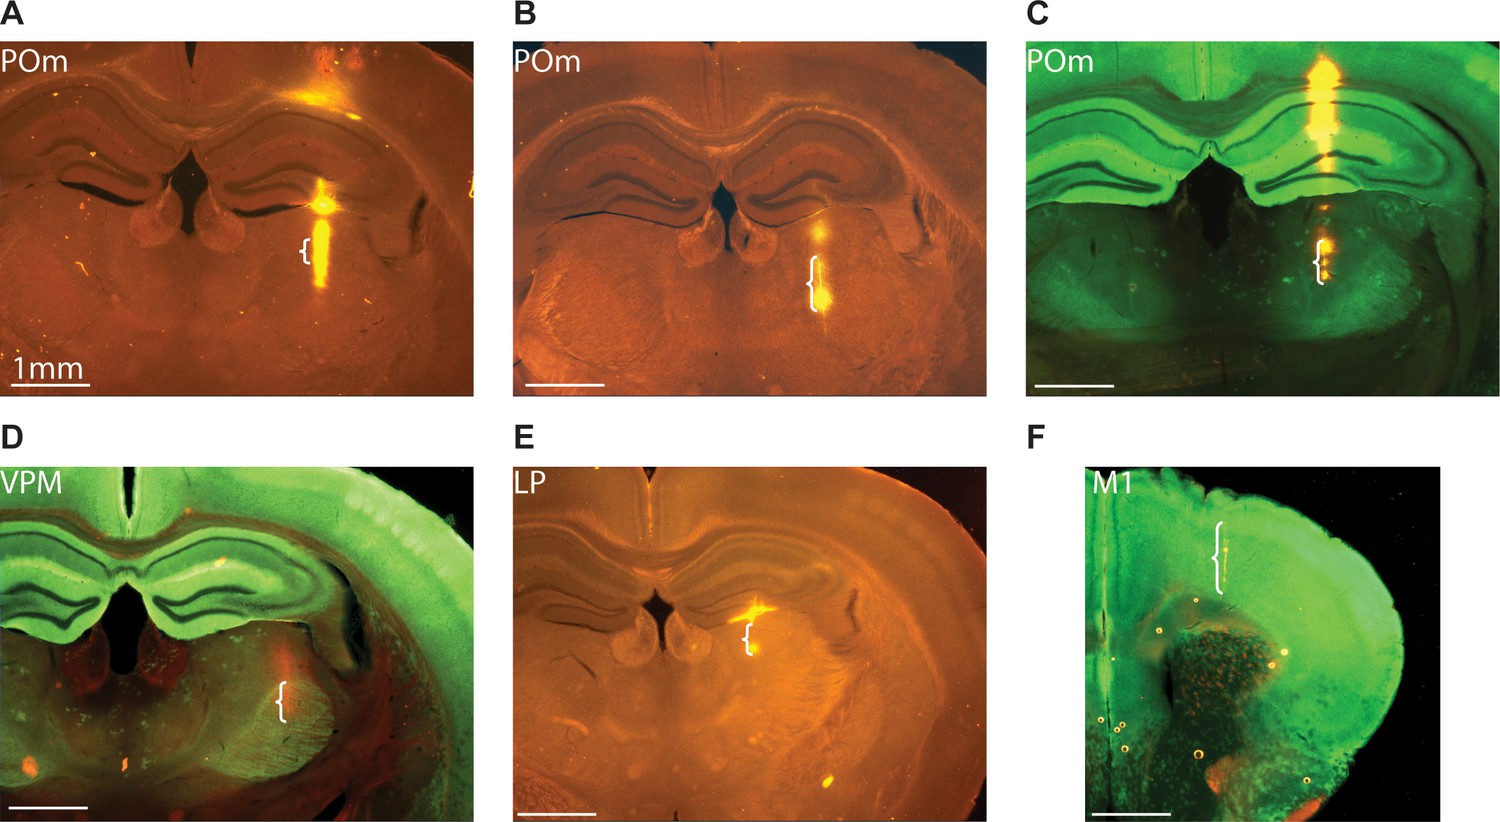
Anatomical confirmation of recording locations.
(A, B) POm juxtasomal recording locations labeled with DiI in two example wild-type mice. (C) POm juxtasomal recording location in an example Emx1-Halo mouse (Green: GFP; Orange: DiI). (D) VPM juxtasomal recording location in an example Emx1-Halo mouse (Green: GFP; Orange: DiI). (E) LP juxtasomal recording location in a wild-type mouse. (F) M1 array recording location in an Emx1-Halo mouse. (Scale bar=1 mm for all images. Brackets indicate the depths relative to the end of the DiI track where recordings were made).
Figure 1—figure supplement 2
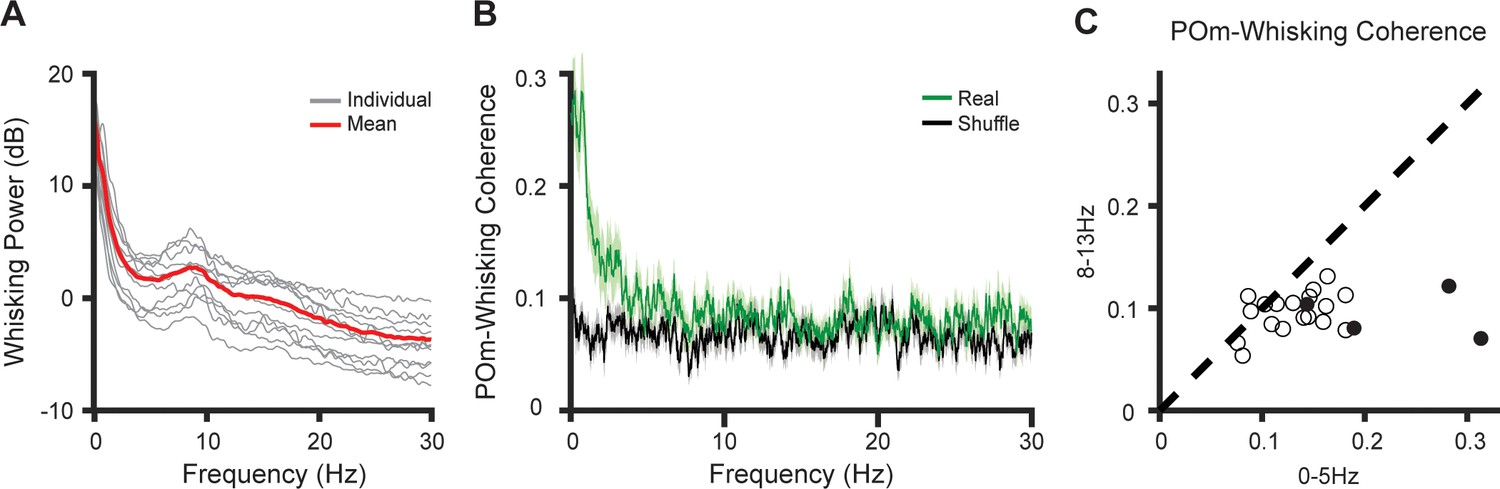
POm cells are coherent with whisking only at low frequencies.
(A) Individual (gray) and mean (red) power spectra of mouse whisking (n=11 mice). (B) Mean coherence between POm spiking activity and whisking (green) compared to shuffled data (black). Shaded: SEM over cells. (n=22 cells from five mice, same cells as in Figure 1). (C) Mean whisking coherence for each POm cell in the frequency ranges 0–5 Hz (encompassing the slow components of whisking) and 8–13 Hz (encompassing the fast components) coherence is significantly higher in the lower frequency band (p=0.0004, paired t-test). Filled circles indicate cells with significant phase coding as in Figure 1E.
Figure 2
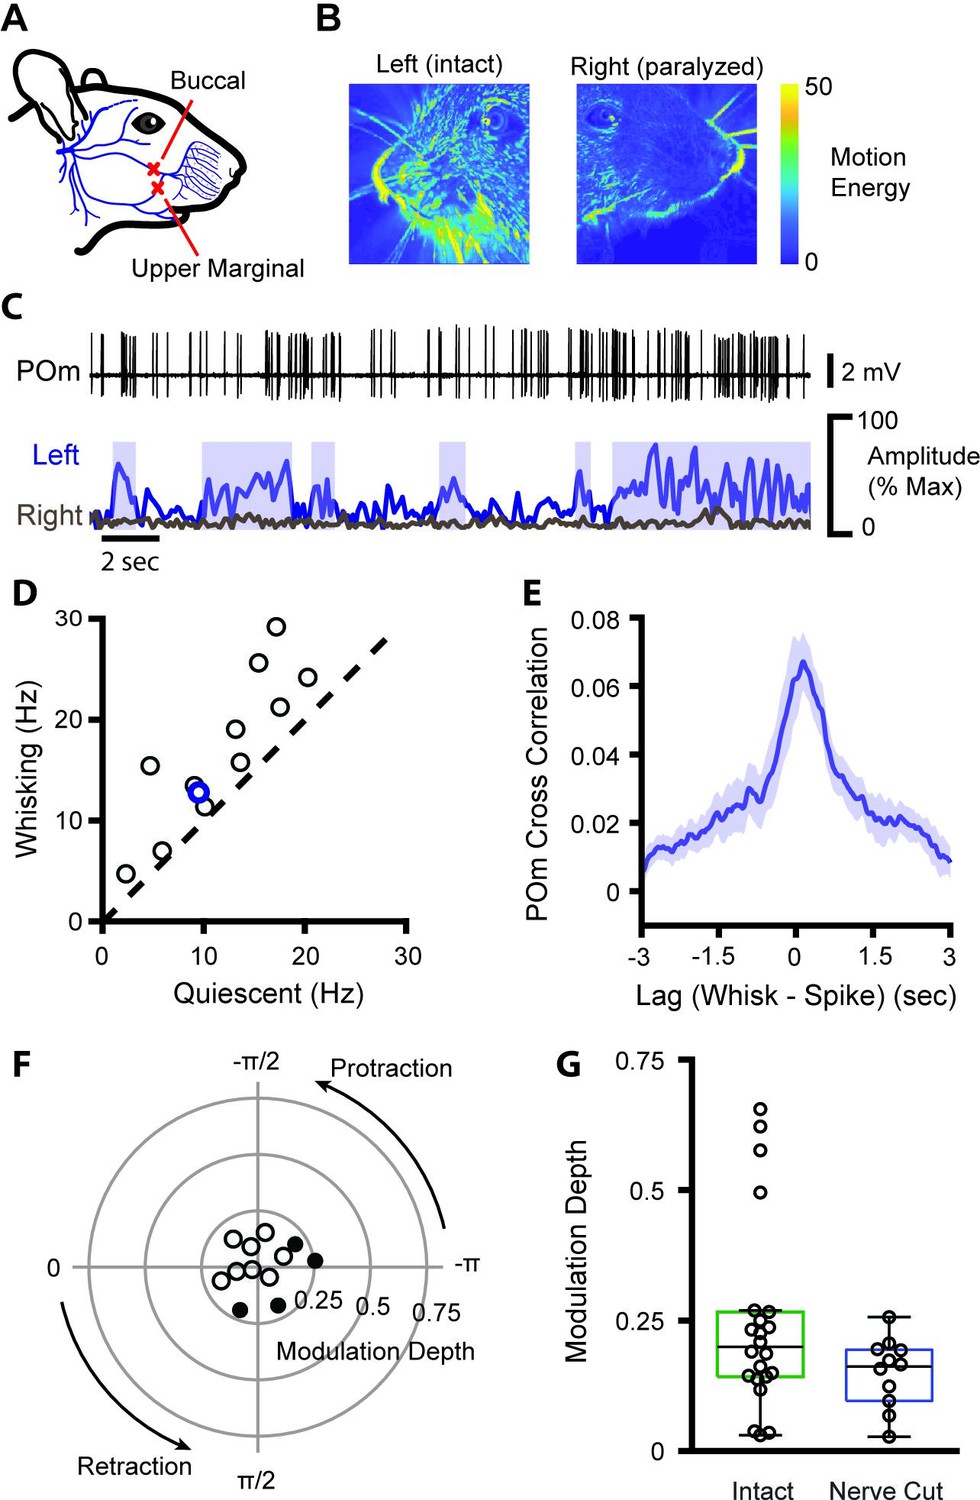
POm encodes whisking activity in absence of reafferent sensory input.
(A) The buccal and upper marginal branches of the facial motor nerve were severed unilaterally, preventing whisker motion on the right side of the face. Adapted from Heaton et al., 2014. (B) Motion energy of the left (intact) and right (paralyzed) sides of the face, averaged over 3 min of video. Nerve cut greatly reduced the motion of both the whiskers and mystacial pad. (C) Example POm cell (top, black), ipsilateral (left side of face) whiskers (bottom, blue), and contralateral whiskers (bottom, gray). Blue boxes: periods of whisking as in Figure 1B. (D) Scatter plot of mean POm firing rate during whisking and quiescence. Blue, example cell in (B). Firing rates during whisking are significantly higher than quiescence (n=12 cells from two animals, quiescent mean: 11.6 Hz, whisking mean: 16.7 Hz, 44% change, p=0.0007, paired t-test). (E) Cross-correlation of POm firing rate and ipsilateral whisking amplitude. (F) Polar plot of modulation depth and preferred phase of each POm unit as in Figure 1E. Filled circles, cells with significant phase modulation (p<0.05, Kuiper test, Bonferroni corrected). (G) Modulation depth of POm cells in intact mice (green, as in Figure 1E) and after buccal nerve cut (blue). There was a significant difference in the variance of modulation depth between groups (p=0.0013, two-sample F-test).
Figure 3
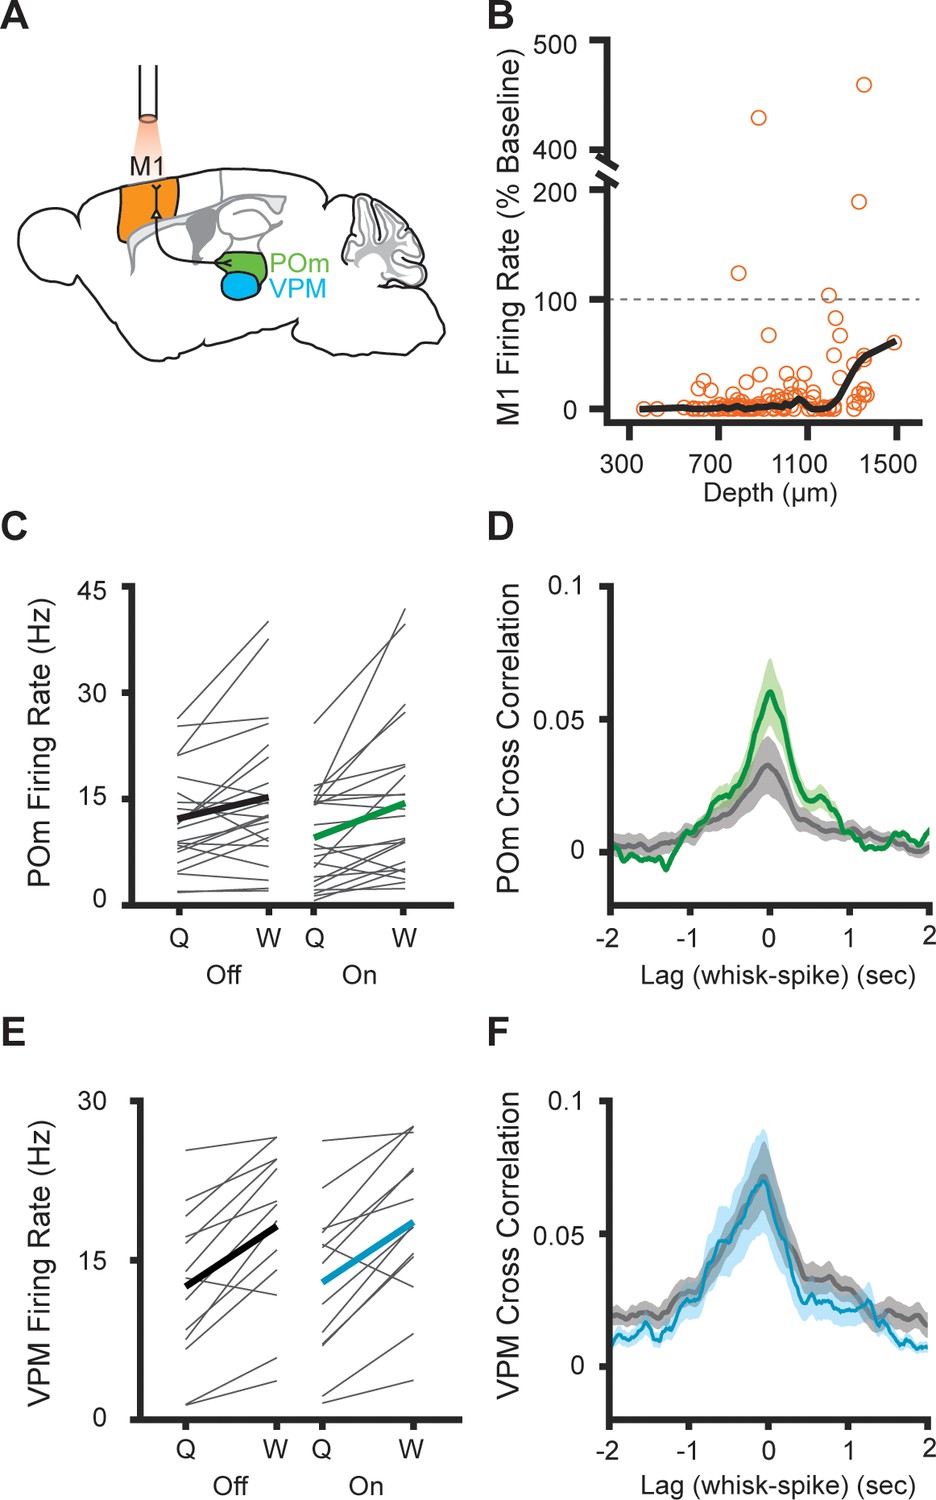
Inhibition of primary motor cortex increases POm correlation with whisking.
(A) Experimental setup. M1 was optogenetically silenced while recordings were made from M1, POm, or VPM. Adapted from The Mouse Brain Atlas in Stereotaxic Coordinates (Paxinos and Franklin, 2019). (B) Effect of laser on M1 activity across cortical depth (n=131 cells, seven mice). The laser inhibited 96.2% of cells (mean laser-on firing rate 17.6%, median 1.04% of baseline). Black, lowess smoothed function. (C) Individual (gray) and mean (black or green) POm firing rates during whisking and quiescence when the laser is off or on (n=23 cells, three mice, whisking p=0.005, laser p=0.016, two-way repeated-measures ANOVA). (D) Cross-correlation of POm firing rate and whisking amplitude when the laser is off. The peak correlation was significantly higher when the laser was on (p=0.0018, paired t-test between peak values). (E) Individual (gray) and mean (black or blue) VPM firing rates during whisking and quiescence when the laser is off or on (n=13 cells, two mice, whisking p=0.0002, laser p=0.27, two-way repeated-measures ANOVA). (F) Cross-correlation of VPM firing rate and whisking amplitude (p=0.11, paired t-test between peak values).
Figure 4
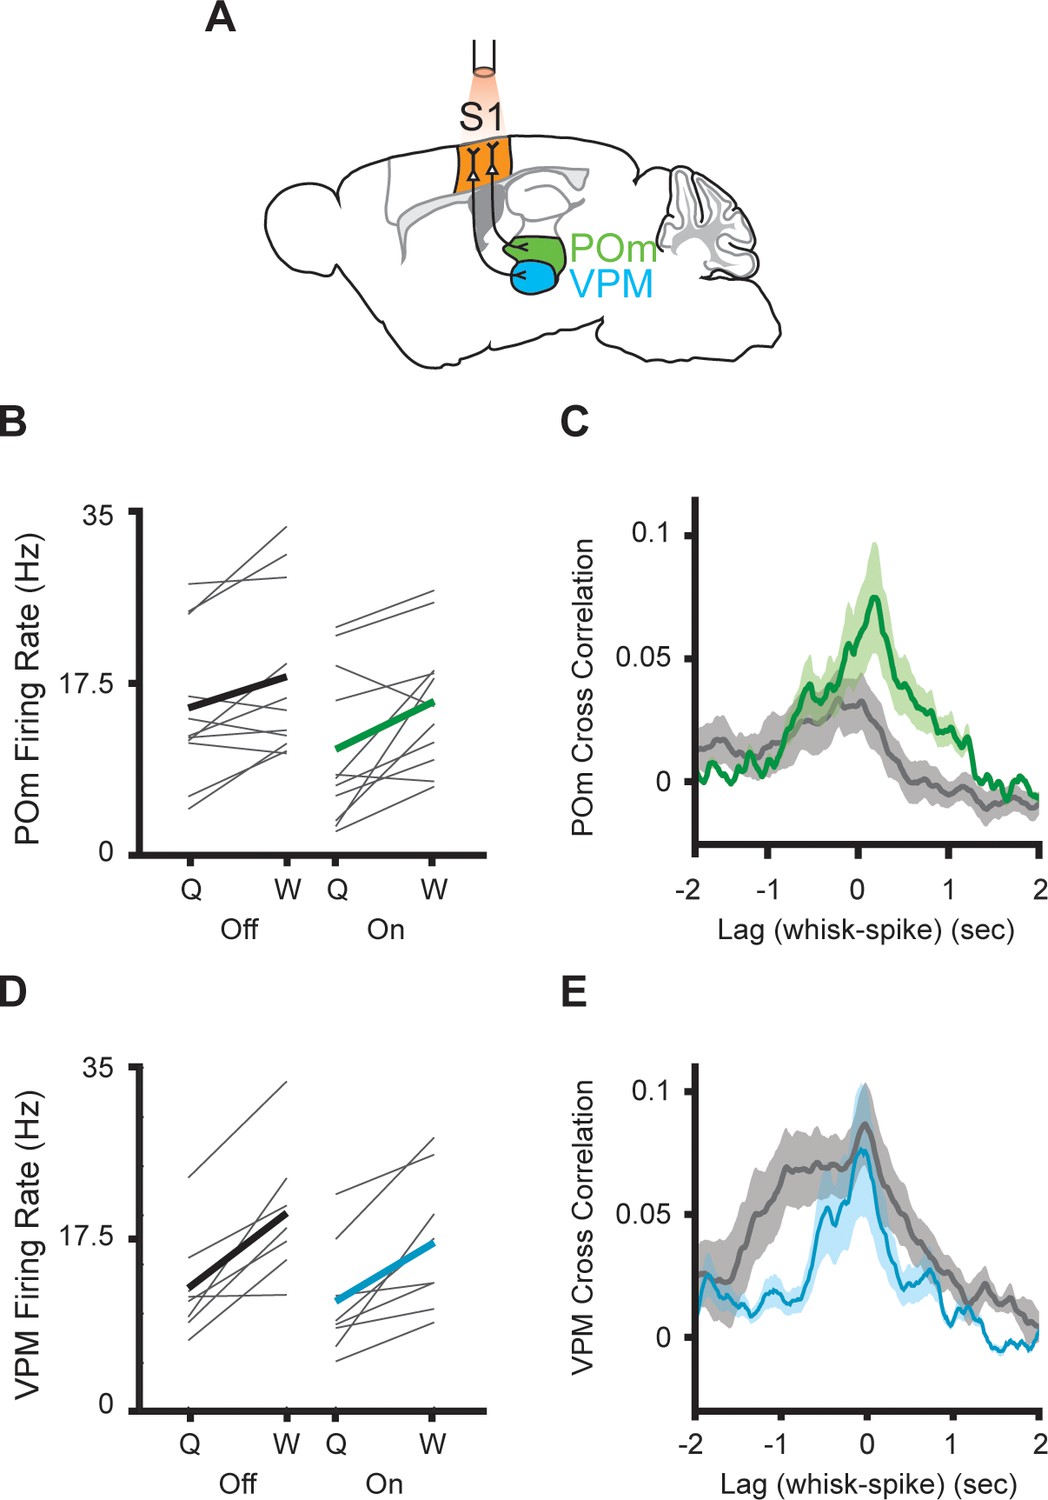
Inhibition of primary somatosensory cortex increases POm correlation with whisking.
(A) Experimental setup. S1 was optogenetically silenced while recordings were made from POm or VPM. The Mouse Brain Atlas in Stereotaxic Coordinates (Paxinos and Franklin, 2019). (B) Individual (gray) and mean (black or green) POm firing rates during whisking and quiescence when the laser is off or on. (n=11 cells, three mice, whisking p=0.0005, laser p=0.03, two-way repeated-measures ANOVA). (C) Cross-correlation between POm firing rate and whisking amplitude when the laser is off (gray) or on (green) (p=0.15, paired t-test between peak values). (D) Mean VPM firing rate (n=8 cells, two mice, whisking p=0.001, laser p=0.11, two-way repeated-measures ANOVA). (E) Cross-correlation between VPM firing rate and whisking amplitude (p=0.48, paired t-test between peak values).
Figure 5

Lesions to superior colliculus (SC) do not reduce POm correlation with whisking.
(A) Sample coronal section showing bilateral electrolytic lesion of SC. (B) Scatter plot of POm firing rates during whisking and quiescence in lesioned (red) and intact animals (black, data from Figure 1). Firing rates in lesioned animals were significantly higher during whisking (n=49 cells from eight animals, increase from mean of 10.9 Hz to 17.4 Hz, or 59%, p<10–9, paired t-test). (C) Box plots of POm firing rates during whisking (W) and quiescence (Q) in intact (black) and lesioned animals (red). Pom firing rates in lesioned animals were higher than intact animals (whisking p<10–5, lesion p<10–3, two-way ANOVA). (D) Lesioned animals tended to spend slightly more time whisking, but this was not statistically significant (intact median=27.5%, n=5 mice; lesion median=38.3%, n=8 mice, p=0.35, Wilcoxon rank-sum test).
Figure 6

POm activity tracks pupil dynamics.
(A) Sample recording of POm activity (middle, black) with concurrent ipsilateral pupil diameter (blue, top), median whisker angle (middle, gray), and whisking amplitude (green, bottom). (B) Cross-correlation of pupil diameter and whisking amplitude (30 recording sessions from seven animals). Errors bars are present but very small. (C) Cross-correlation of POm firing rate (n=10 cells from three animals) with whisking amplitude (green) and pupil diameter (blue).
Figure 7 with 1 supplement
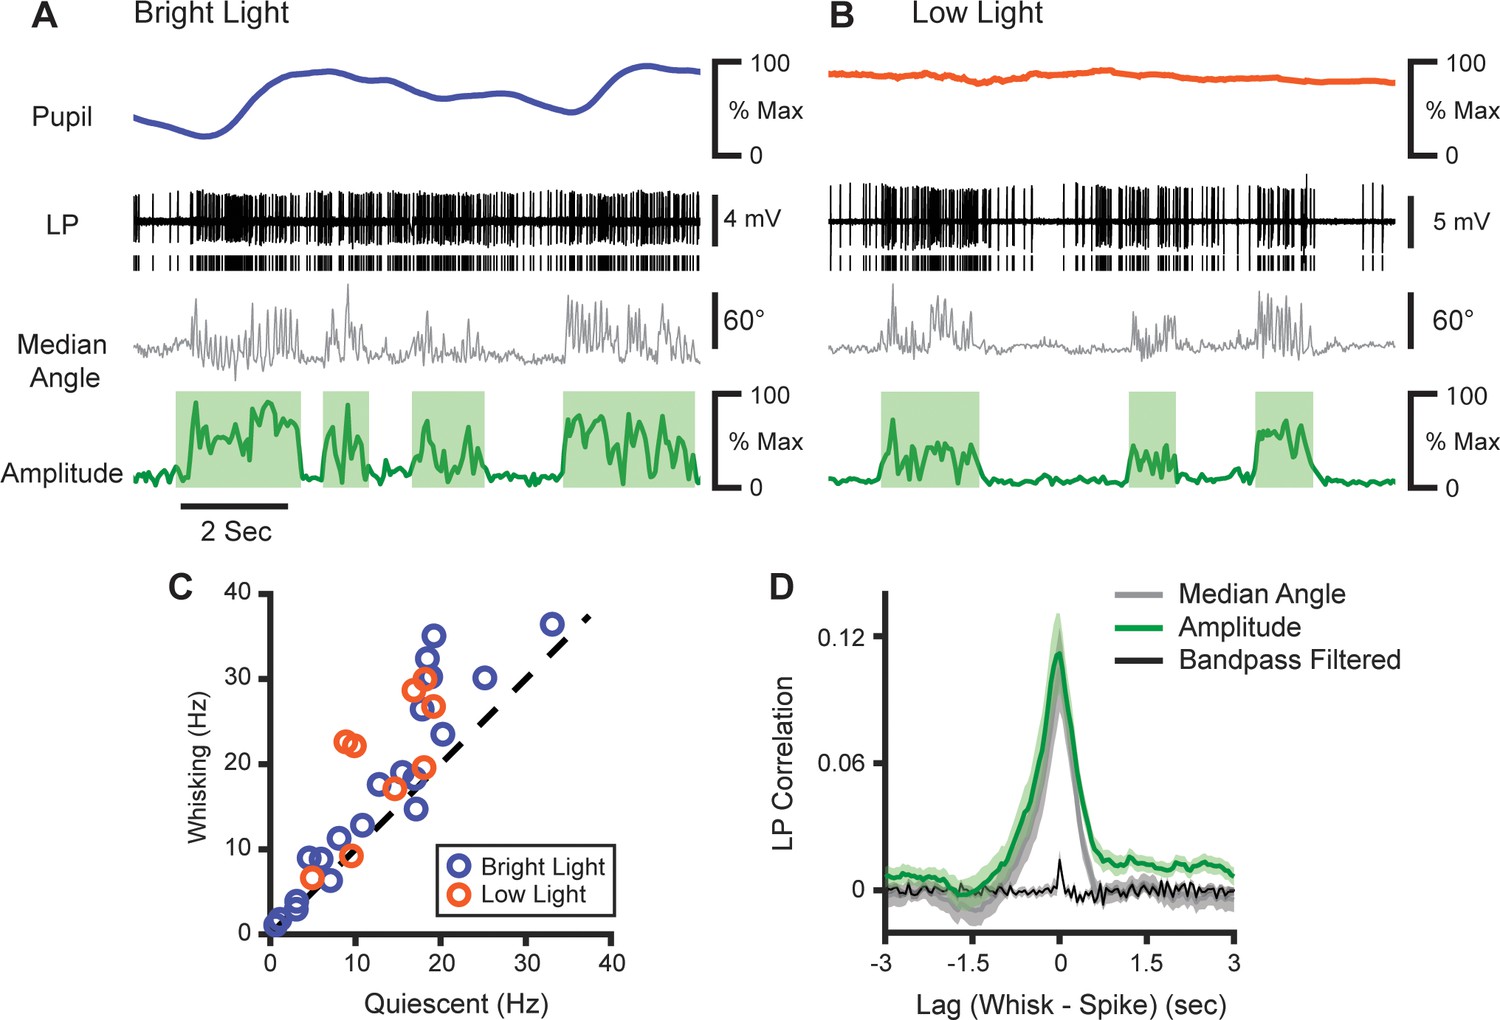
LP activity tracks slow whisker dynamics.
(A, B) Sample recordings of two LP cells (black) recorded in normal light (A) or low light (B), with corresponding median whisker angle (gray) whisking amplitude (green), and pupil diameter (blue or orange). (C) Scatter plot of mean firing rate in LP cells during whisking and quiescence. Blue, cells recorded in bright light; Orange, cells recorded in low light (n=29 cells from four mice, p<10–4, paired t-test). (D) Cross-correlation of LP firing rate with whisking amplitude (green), median whisker angle (red), and 4–30 Hz bandpass filtered angle (black).
Figure 7—figure supplement 1
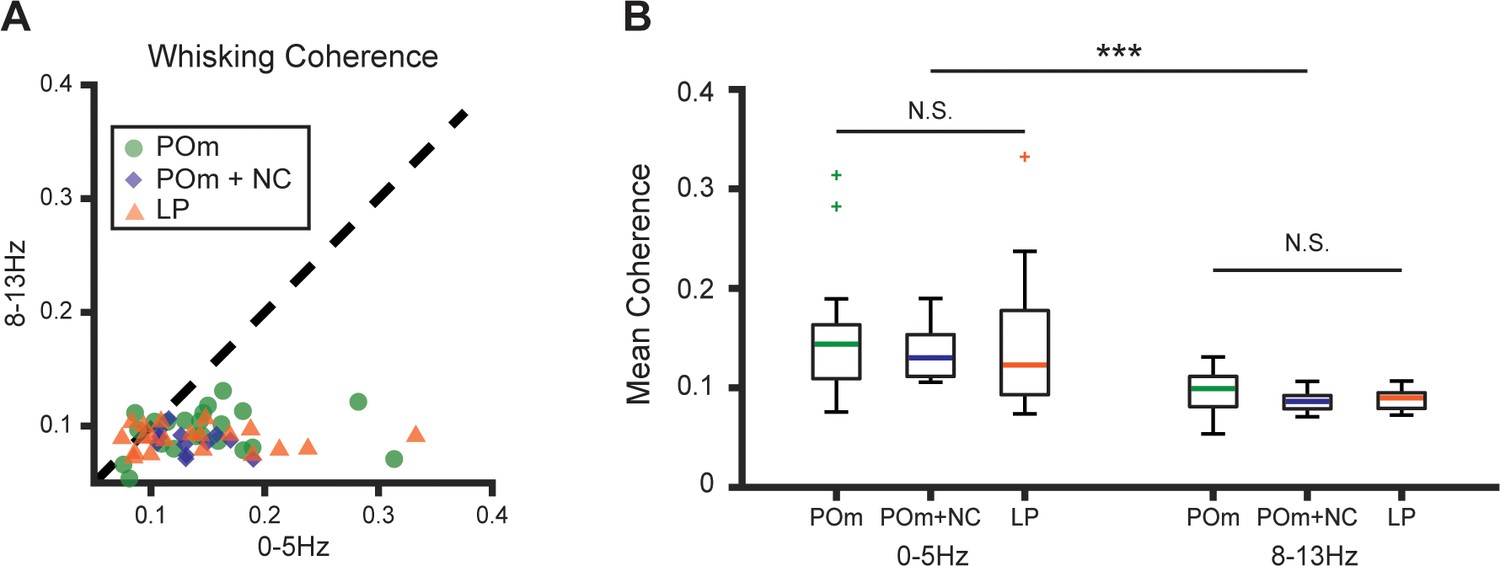
POm and LP cells have identical patterns of coherence with whisking.
(A) Mean spiking-whisking coherence for each POm and LP cell in the frequency ranges 0–5 Hz and 8–13 Hz. Green circles: POm (n=22 cells from five mice, same as in Figure 1). Blue diamonds: POm with ipsilateral facial motor nerve cut (NC) (n=12 cells from two animals, same as in Figure 2). Orange triangles: LP (n=29 cells from four mice, same as in Figure 7). (B) Coherence of whisking with POm cells (green), POm cells after motor NC (blue), and LP cells (orange) in frequency bands 0–5 Hz and 8–13 Hz. Coherence was significantly higher at lower frequencies within all groups and there was no significant difference in whisking coherence among groups (frequency band p<10–9, experimental group p=0.52, two-way ANOVA).
Additional files
Download links
A two-part list of links to download the article, or parts of the article, in various formats.
Downloads (link to download the article as PDF)
Open citations (links to open the citations from this article in various online reference manager services)
Cite this article (links to download the citations from this article in formats compatible with various reference manager tools)
Effects of arousal and movement on secondary somatosensory and visual thalamus
eLife 10:e67611.
https://doi.org/10.7554/eLife.67611


